Oscillator %bOscillator %b indicator apply Bollinger Bands on Oscillator Line, and calculate %b to define Buy and Sell signal with detail as below
===
1. Oscillator Type and Parameter
1.1 RSI (56) on H1 Timeframe
1.2 Stochastic (56,3,3) on H1 Timeframe
1.3 CCI (56) on H1 Timeframe
1.4 MACD (48,104,9)) on H1 Timeframe
1.5 AO (20,136) on H1 Timeframe
===
2. Signal
2.1 Buy Signal: at least 4 periods of %b moving betwween 0.0 and 0.2
2.2 Sell Signal: at least 4 periods of %b moving betwween 0.8 and 1.0
Search in scripts for "oscillator"

Oscillator Evaluator (Analysis tool)Oscillator Evaluator (Analysis tool)
The oscillator evaluator is a tool that will help you analyse and compare the oscillator of your choice to another 2 oscillators.
By selecting the strategy with which you will analyze the oscillators, you will be able to see the behaviour of the oscillators in different aspects.
First there is a moving average increase or decrease strategy, that will give you a good idea of the correlation of the oscillator with the price.
The second is a commom 2 MA crossover strategy, that will give you and idea of the validaty of that oscillator as a strategy or as a trend filter.
The third strategy is a cross over 0 signal, that will go long on a crossover of 0 and short on a crossunder 0. This helps you see how good is the oscillator at evaluating suport and resistance areas and give you an idea of its balance.
The forth strategy is a Buy/Sell on extremes of the oscillator and will let you know how good is your strategy at spotting good places to buy and sell.
The fith strategy is to evaluate how goood the oscillator is as a mean reversion filter or how good it is at spotting small price changes.
The sixth strategy is similar to the last but is focused on how good is the oscillator spotting good places to take profits on trending strategies.
The 6 strategies in the script produce signals from the oscillator and from the oscillator only.
In conclusion this tool can be used to measure your oscillator and see if it really is as good as you think in comparison to others.
This script is not intended to be used as a full strategy but as a tool.

Oscillator Workbench — Chart [LucF]█ OVERVIEW
This indicator uses an on-chart visual framework to help traders with the interpretation of any oscillator's behavior. The advantage of using this tool is that you do not need to know all the ins and outs of a particular oscillator such as RSI, CCI, Stochastic, etc. Your choice of oscillator and settings in this indicator will change its visuals, which allows you to evaluate different configurations in the context of how the workbench models oscillator behavior. My hope is that by using the workbench, you may come up with an oscillator selection and settings that produce visual cues you find useful in your trading.
The workbench works on any symbol and timeframe. It uses the same presentation engine as my Delta Volume Channels indicator; those already familiar with it will feel right at home here.
█ CONCEPTS
Oscillators
An oscillator is any signal that moves up and down a centerline. The centerline value is often zero or 50. Because the range of oscillator values is different than that of the symbol prices we look at on our charts, it is usually impossible to display an oscillator on the chart, so we typically put oscillators in a separate pane where they live in their own space. Each oscillator has its own profile and properties that dictate its behavior and interpretation. Oscillators can be bounded , meaning their values oscillate between fixed values such as 0 to 100 or +1 to -1, or unbounded when their maximum and minimum values are undefined.
Oscillator weight
How do you display an oscillator's value on a chart showing prices when both values are not on the same scale? The method I use here converts the oscillator's value into a percentage that is used to weigh a reference line. The weight of the oscillator is calculated by maintaining its highest and lowest value above and below its centerline since the beginning of the chart's history. The oscillator's relative position in either of those spaces is then converted to a percentage, yielding a positive or negative value depending on whether the oscillator is above or below its centerline. This method works equally well with bounded and unbounded oscillators.
Oscillator Channel
The oscillator channel is the space between two moving averages: the reference line and a weighted version of that line. The reference line is a moving average of a type, source and length which you select. The weighted line uses the same settings, but it averages the oscillator-weighted price source.
The weight applied to the source of the reference line can also include the relative size of the bar's volume in relation to previous bars. The effect of this is that the oscillator's weight on bars with higher total volume will carry greater weight than those with lesser volume.
The oscillator channel can be in one of four states, each having its corresponding color:
• Bull (teal): The weighted line is above the reference line.
• Strong bull (lime): The bull condition is fulfilled and the bar's close is above the reference line and both the reference and the weighted lines are rising.
• Bear (maroon): The weighted line is below the reference line.
• Strong bear (pink): The bear condition is fulfilled and the bar's close is below the reference line and both the reference and the weighted lines are falling.
Divergences
In the context of this indicator, a divergence is any bar where the slope of the reference line does not match that of the weighted line. No directional bias is assigned to divergences when they occur. You can also choose to define divergences as differences in polarity between the oscillator's slope and the polarity of close-to-close values. This indicator's divergences are designed to identify transition levels. They have no polarity; their bullish/bearish bias is determined by the behavior of price relative to the divergence channel after the divergence channel is built.
Divergence Channel
The divergence channel is the space between two levels (by default, the bar's low and high ) saved when divergences occur. When price has breached a channel and a new divergence occurs, a new channel is created. Until that new channel is breached, bars where additional divergences occur will expand the channel's levels if the bar's price points are outside the channel.
Price breaches of the divergence channel will change its state. Divergence channels can be in one of five different states:
• Bull (teal): Price has breached the channel to the upside.
• Strong bull (lime): The bull condition is fulfilled and the oscillator channel is in the strong bull state.
• Bear (maroon): Price has breached the channel to the downside.
• Strong bear (pink): The bear condition is fulfilled and the oscillator channel is in the strong bear state.
• Neutral (gray): The channel has not been breached.
█ HOW TO USE THE INDICATOR
Load the indicator on an active chart (see here if you don't know how).
The default configuration displays:
• The Divergence channel's levels.
• Bar colors using the state of the oscillator channel.
The default settings use:
• RSI as the oscillator, using the close source and a length of 20 bars.
• An Arnaud-Legoux moving average on the close and a length of 20 bars as the reference line.
• The weighted version of the reference line uses only the oscillator's weight, i.e., without the relative volume's weight.
The weighted line is capped to three standard deviations of the reference.
• The divergence channel's levels are determined using the high and low of the bars where divergences occur.
Breaches of the channel require a bar's low to move above the top of the channel, and the bar's high to move below the channel's bottom.
No markers appear on the chart; if you want to create alerts from this script, you will need first to define the conditions that will trigger the markers, then create the alert, which will trigger on those same conditions.
To learn more about how to use this indicator, you must understand the concepts it uses and the information it displays, which requires reading this description. There are no videos to explain it.
█ FEATURES
The script's inputs are divided in five sections: "Oscillator", "Oscillator channel", "Divergence channel", "Bar Coloring" and "Marker/Alert Conditions".
Oscillator
This is where you configure the oscillator you want to study. Thirty oscillators are available to choose from, but you can also use an oscillator from another indicator that is on your chart, if you want. When you select an external indicator's plot as the oscillator, you must also specify the value of its centerline.
Oscillator Channel
Here, you control the visibility and colors of the reference line, its weighted version, and the oscillator channel between them.
You also specify what type of moving average you want to use as a reference line, its source and its length. This acts as the oscillator channel's baseline. The weighted line is also a moving average of the same type and length as the reference line, except that it will be calculated from the weighted version of the source used in the reference line. By default, the weighted line is capped to three standard deviations of the reference line. You can change that value, and also elect to cap using a multiple of ATR instead. The cap provides a mechanism to control how far the weighted line swings from the reference line. This section is also where you can enable the relative volume component of the weight.
Divergence Channel
This is where you control the appearance of the divergence channel and the key price values used in determining the channel's levels and breaching conditions. These choices have an impact on the behavior of the channel. More generous level prices like the default low and high selection will produce more conservative channels, as will the default choice for breach prices.
In this section, you can also enable a mode where an attempt is made to estimate the channel's bias before price breaches the channel. When it is enabled, successive increases/decreases of the channel's top and bottom levels are counted as new divergences occur. When one count is greater than the other, a bull/bear bias is inferred from it. You can also change the detection mode of divergences, and choose to display a mark above or below bars where divergences occur.
Bar Coloring
You specify here:
• The method used to color chart bars, if you choose to do so.
• If you want to hollow out the bodies of bars where volume has not increased since the last bar.
Marker/Alert Conditions
Here, you specify the conditions that will trigger up or down markers. The trigger conditions can include a combination of state transitions of the oscillator and the divergence channels. The triggering conditions can be filtered using a variety of conditions.
Configuring the marker conditions is necessary before creating an alert from this script, as the alert will use the marker conditions to trigger.
Realtime values will repaint, as is usually the case with oscillators, but markers only appear on bar closes, so they will not repaint. Keep in mind, when looking at markers on historical bars, that they are positioned on the bar when it closes — NOT when it opens.
Raw values
The raw values calculated by this script can be inspected using the Data Window, including the oscillator's value and the weights.
█ INTERPRETATION
Except when mentioned otherwise, this section's charts use the indicator's default settings, with different visual components turned on or off.
The aim of the oscillator channel is to provide a visual representation of an oscillator's general behavior. The simplest characteristic of the channel is its bull/bear state, determined by whether the weighted line is above or below the reference line. One can then distinguish between its bull and strong bull states, as transitions from strong bull to bull states will generally happen when trends are losing steam. While one should not infer a reversal from such transitions, they can be a good place to tighten stops. Only time will tell if a reversal will occur. One or more divergences will often occur before reversals. This shows the oscillator channel, with the reference line and the thicker, weighted line:
The nature of the divergence channel 's design makes it particularly adept at identifying consolidation areas if its settings are kept on the conservative side. The divergence channel will also reveal transition areas. A gray divergence channel should usually be considered a no-trade zone. More adventurous traders can use the oscillator channel to orient their trade entries if they accept the risk of trading in a neutral divergence channel, which by definition will not have been breached by price. This show only the divergence channels:
This chart shows divergence channels and their levels, and colors bars on divergences and on the state of the oscillator channel, which is not visible on the chart:
If your charts are already busy with other stuff you want to hold on to, you could consider using only the chart bar coloring component of this indicator. Here we only color bars using the combined state of the oscillator and divergence channel, and we do not color the bodies of bars where volume has not increased. Note that my chart's settings do not color the candle bodies:
At its simplest, one way to use this indicator would be to look for overlaps of the strong bull/bear colors in both the oscillator channel and a divergence channel, as these identify points where price is breaching the divergence channel when the oscillator's state is consistent with the direction of the breach.
Tip
One way to use the Workbench is to combine it with my Delta Volume Channels indicator. If both indicators use the same MA as a reference line, you can display its delta volume channel instead of the oscillator channel.
This chart shows such a setup. The Workbench displays its divergence levels, the weighted reference line using the default RSI oscillator, and colors bars on divergences. The DV Channels indicator only displays its delta volume channel, which uses the same MA as the workbench for its baseline. This way you can ascertain the volume delta situation in contrast with the visuals of the Workbench:
█ LIMITATIONS
• For some of the oscillators, assumptions are made concerning their different parameters when they are more complex than just a source and length.
See the `oscCalc()` function in this indicator's code for all the details, and ask me in a comment if you can't find the information you need.
• When an oscillator using volume is selected and no volume information is available for the chart's symbol, an error will occur.
• The method I use to convert an oscillator's value into a percentage is fragile in the early history of datasets
because of the nascent expression of the oscillator's range during those early bars.
█ NOTES
Working with this workbench
This indicator is called a workbench for a reason; it is designed for traders interested in exploring its behavior with different oscillators and settings, in the hope they can come up with a setup that suits their trading methodology. I cannot tell you which setup is the best because its setup should be compatible with your trading methodology, which may require faster or slower transitions, thus different configurations of the settings affecting the calculations of the divergence channels.
For Pine Script™ Coders
• This script uses the new overload of the fill() function which now makes it possible to do vertical gradients in Pine. I use it for both channels displayed by this script.
• I use the new arguments for plot() 's `display` parameter to control where the script plots some of its values,
namely those I only want to appear in the script's status line and in the Data Window.
• I used my ta library for some of the oscillator calculations and helper functions.
• I also used TradingView's ta library for other oscillator calculations.
• I wrote my script using the revised recommendations in the Style Guide from the Pine v5 User Manual.

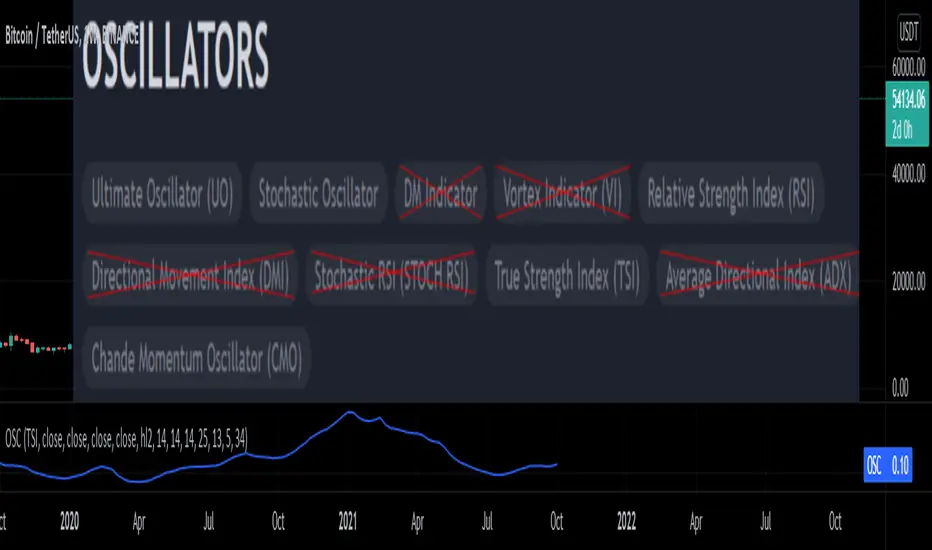
Oscillators SwitchSwitch for common oscillator. Uses built-in function from Pine Script v5 such as Chande Momentum Oscillator (CMO), Relative Strength Index (RSI), Stochastic (STO), True Strength Index (TSI) and Ultimate Oscillator (UO).
Oscillator available as below :
Input displayed individually :
Oscillator2OverlayThis experimental study "normalizes" a series into a consistent range such that it can be "overlayed" against an oscillator that's typically plotted independently.
It then "denormalizes" the oscillator's signal into the series' original domain, such that important thresholds can _also_ be denormalized into the series' original domain.
The normalization/denormalization performed using a long-window bollinger band to define a domain for mapping between-chart space and oscillator-space.
This example maps "rsi" into the chart-domain.
(!!) Inspired by

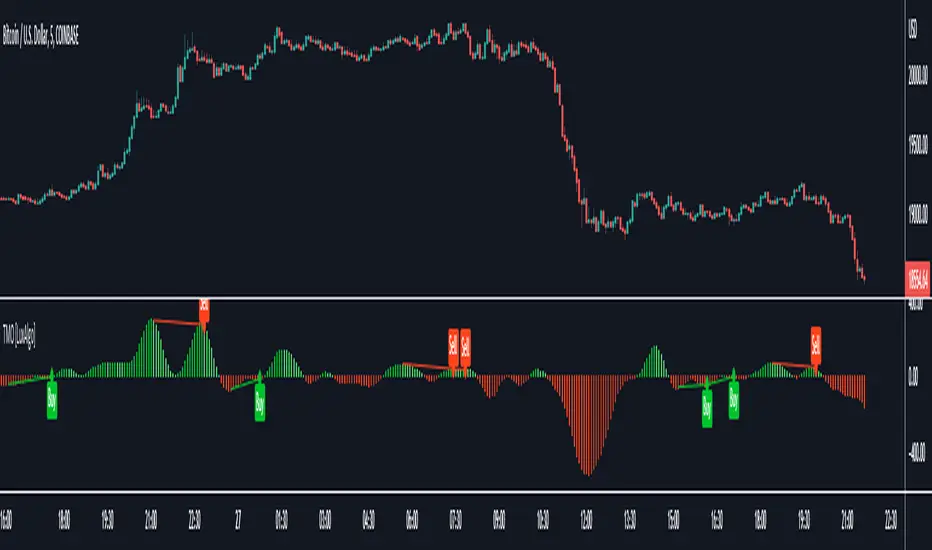
TICK OscillatorOscillator that makes it easy to see when TICK is hitting extreme readings or establishing a bullish/bearish divergence vs the indices.
- Green coloration means a reading of >+400
- Red coloration means a reading of <-400
- Orange means a reading in between -400 and +400
This was inspired by John F Carter's book "Mastering The Trade", where I first learned about utilizing TICK in my trading.

RS4r OscillatorOscillator based on Garofallou's RS4r indicator. It has been modified to compare the Relative Strength of any asset against QQQ . SPY , IWM , VGK , EWJ , DBC , GLD , HYG , LQD , TLT ETFs.
Readings above 80 points suggest great relative strength against these ETFs.

Oscillator Volume Profile [Trendoscope®]The Oscillator Volume Profile indicator is designed to construct a volume profile based on predefined oscillator levels. It integrates volume data with oscillator readings to offer a unique perspective on market dynamics.
🎲 Selectable Oscillators:
Users can select from an array of oscillator options for the basis of the volume profile, including:
Relative Strength Index (RSI)
Chande Momentum Oscillator (CMO)
Center of Gravity (COG)
Money Flow Index (MFI)
Rate of Change (ROC)
Commodity Channel Index (CCI)
Stochastic Oscillator (Stoch)
True Strength Index (TSI)
Williams %R (WPR)
The length parameters - Length, Fast Length, Slow Length allows users to define the period over which the chosen oscillator is calculated, tailoring the sensitivity of the indicator to their trading strategy.
🎲 Dynamic Overbought/Oversold Ranges:
This indicator enhances traditional concepts by introducing dynamic overbought and oversold levels. These adaptable thresholds are calculated using various methods, including:
🎯 Highest/Lowest Range Method : This method establishes the range based on the highest and lowest values of the oscillator within the last N bars.
🎯 Moving Average Range Method : The range is derived from a moving average of the oscillator, providing a smoothed threshold that reflects more recent market conditions.
In addition to these methods, the indicator incorporates a unique 'Sticky Border' feature:
🎯 Sticky Border: With this option enabled, the dynamic ranges maintain their levels until the oscillator breaks out of the range. Once a breakout occurs, the levels are recalculated and updated. This mechanism ensures that the borders remain consistent and relevant, only adjusting to significant market movements that warrant a recalculation.
Users can select their preferred method for determining dynamic ranges, allowing for a customized approach that aligns with their analysis and trading strategy. The sticky border feature further refines this functionality, offering continuity until a decisive market move occurs.
🎲 Volume Profile Calculation Parameters:
🎯 Trend Filter: The indicator provides a versatile trend filter with four selectable options:
Uptrend: The volume profile is calculated when the oscillator indicates an uptrend.
Downtrend: The volume profile is calculated when the oscillator indicates a downtrend.
Any: The volume profile is calculated regardless of the trend.
External: Users can input values from an external indicator. The volume profile is then calculated only when the external indicator's value is non-zero, integrating external analysis into the volume profile construction.
🎯 Precision: Users have the option to define the precision for calculating the volume profile, which is crucial due to the varying scales of different oscillators (e.g., some oscillators range from 0 to 100, while others from -1 to 1). Selecting an appropriate precision ensures that the volume profile is accurately aligned with the minimal price range significant to the chosen oscillator. This setting requires user intervention for optimal configuration, as automatic calculation is not feasible due to the diverse nature of oscillator ranges.
🎯 Number of Bars: Users can select a specific number of bars for volume profile calculation, or opt to include all available historical bars for a comprehensive profile.
🎲 Selecting the right precision:
Users must select the right precision based on their choice of indicator. For example, RSI values range from 0-100. Hence, the default precision of 1 work fine on RSI as the volume profiles are plotted from 0 to 100 at the interval of 0.1
But, the default precision of 1 will not be ok on TSI because TSI values range from -1 to 1. Hence, using 1 as precision will result in very less volume profile lines as shown below.
Due to this, it is necessary to increase the precision for oscillators such as TSI where the range between highest and lowest value is far less. Once we set the precision to 2, we can see more appropriate volume profile division.
🎲 Note of thanks:
This publication uses polyline feature for drawing volume profiles. The advantage of using polyline is that we can overcome max 500 lines issue that we face by using the regular line objects. More details of polyline can be found in the tradingview blog post
Further, using polyline for display of volume profiles is inspired by the publications of fikira and KioseffTrading

Oscillator Matrix [Alpha Extract]A comprehensive multi-oscillator system that combines volume-weighted money flow analysis with enhanced momentum detection, providing traders with a unified framework for identifying high-probability market opportunities across all timeframes. By integrating two powerful oscillators with advanced confluence analysis, this indicator delivers precise entry and exit signals while filtering out market noise through sophisticated threshold-based regime detection.
🔶 Volume-Weighted Money Flow Analysis
Utilizes an advanced money flow calculation that tracks volume-weighted price movements to identify institutional activity and smart money flow. This approach provides superior signal quality by emphasizing high-volume price movements while filtering out low-volume market noise.
// Volume-weighted flows
up_volume = price_up ? volume : 0
down_volume = price_down ? volume : 0
// Money Flow calculation
up_vol_sum = ta.sma(up_volume, mf_length)
down_vol_sum = ta.sma(down_volume, mf_length)
total_volume = up_vol_sum + down_vol_sum
money_flow_ratio = total_volume > 0 ? (up_vol_sum - down_vol_sum) / total_volume : 0
🔶 Enhanced Hyper Wave Oscillator
Features a sophisticated MACD-based momentum oscillator with advanced normalization techniques that adapt to different price ranges and market volatility. The system uses percentage-based calculations to ensure consistent performance across various instruments and timeframes.
// Enhanced MACD-based oscillator
fast_ma = ta.ema(src, hw_fast)
slow_ma = ta.ema(src, hw_slow)
macd_line = fast_ma - slow_ma
signal_line = ta.ema(macd_line, hw_signal)
// Proper normalization using percentage of price
price_base = ta.sma(close, 50)
macd_normalized = macd_line / price_base
hyper_wave = macd_range > 0 ? macd_normalized / macd_range : 0
🔶 Multi-Factor Confluence System
Implements an intelligent confluence scoring mechanism that combines signals from both oscillators to identify high-probability trading opportunities. The system assigns strength scores based on multiple confirmation factors, significantly reducing false signals.
🔶 Fixed Threshold Levels
Uses predefined threshold levels optimized for standard oscillator ranges to distinguish between normal market fluctuations and significant momentum shifts. The dual-threshold system provides clear visual cues for overbought/oversold conditions while maintaining consistent signal criteria across different market conditions.
🔶 Overflow Detection Technology
Advanced overflow indicators identify extreme market conditions that often precede major reversals or continuation patterns. These signals highlight moments when market momentum reaches critical levels, providing early warning for potential turning points.
🔶 Dual Oscillator Integration
The indicator simultaneously tracks volume-weighted money flow and momentum-based price action through two independent oscillators. This dual approach ensures comprehensive market analysis by capturing both institutional activity and technical momentum patterns.
// Multi-factor confluence scoring
confluence_bull = (mf_bullish ? 1 : 0) + (hw_bullish ? 1 : 0) +
(mf_overflow_bull ? 1 : 0) + (hw_overflow_bull ? 1 : 0)
confluence_bear = (mf_bearish ? 1 : 0) + (hw_bearish ? 1 : 0) +
(mf_overflow_bear ? 1 : 0) + (hw_overflow_bear ? 1 : 0)
confluence_strength = confluence_bull > confluence_bear ? confluence_bull / 4 : -confluence_bear / 4
🔶 Intelligent Signal Generation
The system generates two tiers of reversal signals: strong signals that require multiple confirmations across both oscillators, and weak signals that identify early momentum shifts. This hierarchical approach allows traders to adjust position sizing based on signal strength.
🔶 Visual Confluence Zones
Background coloring dynamically adjusts based on confluence strength, creating visual zones that immediately communicate market sentiment. The intensity of background shading corresponds to the strength of the confluent signals, making pattern recognition effortless.
🔶 Threshold Visualization
Color-coded threshold zones provide instant visual feedback about oscillator positions relative to key levels. The fill areas between thresholds create clear overbought and oversold regions with graduated color intensity.
🔶 Candle Color Integration
Optional candle coloring applies confluence-based color logic directly to price bars, creating a unified visual framework that helps traders correlate indicator signals with actual price movements for enhanced decision-making.
🔶 Overflow Alert System
Specialized circular markers highlight extreme overflow conditions on both oscillators, drawing attention to potential climax moves that often precede significant reversals or accelerated trend continuation.
🔶 Customizable Display Options
Comprehensive display controls allow traders to toggle individual components on or off, enabling focused analysis on specific aspects of the indicator. This modularity ensures the indicator adapts to different trading styles and analytical preferences.
1 Week
1 Day
15 Min
This indicator provides a complete analytical framework by combining volume analysis with momentum detection in a single, coherent system. By offering multiple confirmation layers and clear visual hierarchies, it empowers traders to identify high-probability opportunities while maintaining precise risk management across all market conditions and timeframes. The sophisticated confluence system ensures that signals are both timely and reliable, making it an essential tool for serious technical analysts.

Triangular Momentum Oscillator & Real Time Divergences [LuxAlgo]Oscillators are widely used in technical analysis and can return a large amount of information to the trader depending on their design. It is common to use oscillators to detect divergences with the price, divergences occur when the tops/bottoms made by the oscillator and price are negatively correlated.
The following oscillator is based on the momentum of a triangular moving average, hence the name "triangular momentum" because of the very smooth property of the triangular moving average, we aimed at a real-time detection of divergences instead of using more common methods such as relying on pivot high/low detection which are suitable for more noisy oscillators.
The oscillator can also be colored based on a gradient derived from the correlation between its output and the price which can be useful to detect when the oscillator is out of phase (significantly lagging or leading the price).
Settings
length : Period of the oscillator, higher values return a smoother output.
src : Input source of the indicator.
Show Lines : Show lines connecting the current top/bottom with the previous one made by the oscillator when a divergence is detected. True by default.
Color Based On Price/Oscillator Correlation : Allows the color of the oscillator to change based on its correlation with the price, with red colors suggesting a negative correlation.
Usages
The advantage of having a smoother oscillator for divergences detection is that it can be done in real-time since a top or bottom is present when the oscillator first difference cross 0. Smoother oscillators are also easier to interpret, however, they will still suffer from lag.
The divergences detected by the oscillator are regular divergences, where the oscillator leads price variations.
Using higher values of length allows the oscillator to filter out longer-term variations thus being smoother as a result.
By using the color mode based on the price/oscillator correlation we can see where the oscillator leads or lag the price, and since divergences are based on the price and oscillator going in the opposite direction we can have information where price might reverse.
It is also possible to interpret the oscillator without relying on the divergence detection, with a decreasing value of the oscillator indicating a downtrend and an increasing value indicating an uptrend.
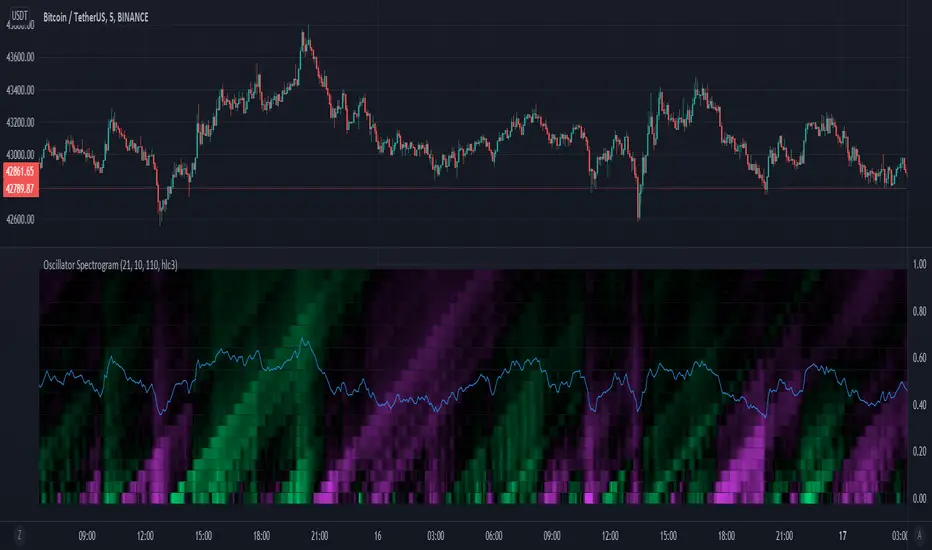
Oscillator SpectrogramA spectrogram of simple oscillators over varying periods.
Oscillator periods increase from bottom to top.
Color indicates the value of the oscillator, with fuchsia indicating a negative value, black indicating a value around 0, and lime green indicating a value greater than 0.
The oscillators are simply the percentage of positive movement within a lookback period, with 50 percent centered at 0.
Vertical lines along the spectrogram indicate that multiple oscillators of different periods are changing values, indicating a shift in market character.
Oscillator OB/OS BarsChoose between 3 different oscillators (RSI, MFI, and StochRSI) to show bars when the oscillator is oversold/overbought.
Green = oversold
Red = overbought
Orange = Bearish "Reversal"
Aqua = Bullish "Reversal"
I created this to help determine patterns with other stuff I'm building. Thought others may find it useful for the same purpose, not to trade based off of this.
Used those 3 oscillators cause their OB/OS levels are clear enough (though I put no effort into the stochrsi like I should've but welp)
enjoy zzzzzz

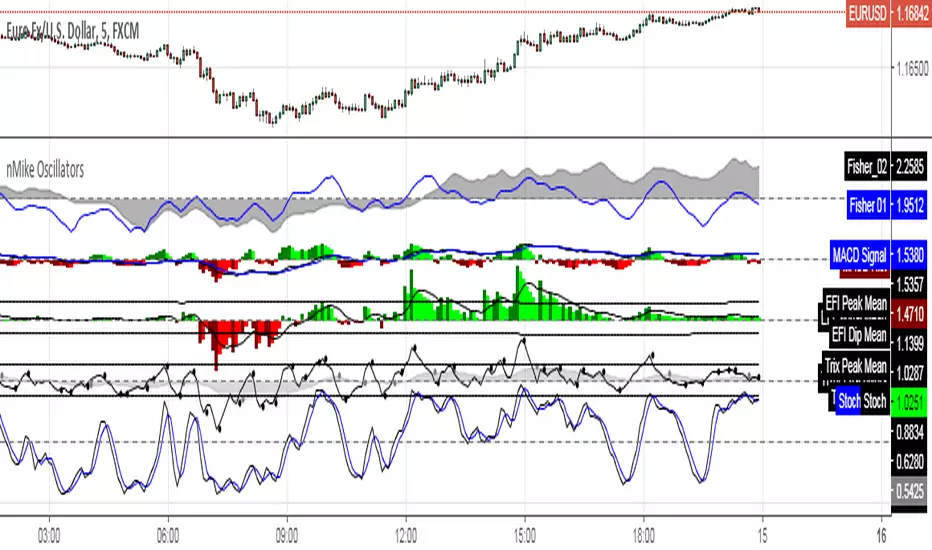
[RS]nMikes Divergence OscillatorsOscillator Package used for nMike's trading system.
Note: this is still in development, so use at your own discretion.
Oscillator Scatterplot Analysis [Trendoscope®]In this indicator, we demonstrate how to plot oscillator behavior of oversold-overbought against price movements in the form of scatterplots and perform analysis. Scatterplots are drawn on a graph containing x and y-axis, where x represent one measure whereas y represents another. We use the library Graph to collect the data and plot it as scatterplot.
Pictorial explanation of components is defined in the chart below.
🎲 This indicator performs following tasks
Calculate and plot oscillator
Identify oversold and overbought areas based on various methods
Measure the price and bar movement from overbought to oversold and vice versa and plot them on the chart.
In our example,
The x-axis represents price movement. The plots found on the right side of the graph has positive price movements, whereas the plots found on the left side of the graph has negative price movements.
The y-axis represents the number of bars it took for reaching overbought to oversold and/or oversold to overbought. Positive bars mean we are measuring oversold to overbought, whereas negative bars are a measure of overbought to oversold.
🎲 Graph is divided into 4 equal quadrants
Quadrant 1 is the top right portion of the graph. Plots in this quadrant represent the instances where positive price movement is observed when the oscillator moved from oversold to overbought
Quadrant 2 is the top left portion of the graph. Plots in this quadrant represent the instances where negative price movement is observed when the oscillator moved from oversold to overbought.
Quadrant 3 is the bottom left portion of the chart. Plots in this quadrant represent the instances where negative price movement is observed when the oscillator moved from overbought to oversold.
Quadrant 4 is the bottom right portion of the chart. Plots in this quadrant represent the instances where positive price movement is observed when the oscillator moved from overbought to oversold.
🎲 Indicator components in Detail
Let's dive deep into the indicator.
🎯 Oscillator Selection
Select the Oscillator and define the overbought oversold conditions through input settings
Indicator - Oscillator base used for performing analysis
Length - Loopback length on which the oscillator is calculated
OB/OS Method - We use Bollinger Bands, Keltener Channel and Donchian channel to calculate dynamic overbought and oversold levels instead of static 80-10. This is also useful as other type of indicators may not be within 0-100 range.
Length and Multiplier are used for the bands for calculating Overbought/Oversold boundaries.
🎯 Define Graph Properties
Select different graph properties from the input settings that will instruct how to display the scatterplot.
Type - this can be either scatterplot or heatmap. Scatterplot will display plots with specific transparency to indicate the data, whereas heatmap will display background with different transparencies.
Plot Color - this is the color in which the scatterplot or heatmap is drawn
Plot Size - applicable mainly for scatterplot. Since the character we use for scatterplot is very tiny, the large at present looks optimal. But, based on the user's screen size, we may need to select different sizes so that it will render properly.
Rows and Columns - Number of rows and columns allocated per quadrant. This means, the total size of the chart is 2X rows and 2X columns. Data sets are divided into buckets based on the number of available rows and columns. Hence, changing this can change the appearance of the overall chart, even though they are representing the same data. Also, please note that tables can have max 10000 cells. If we increase the rows and columns by too much, we may get runtime errors.
Outliers - this is used to exclude the extreme data. 20% outlier means, the chart will ignore bottom 20% and top 20% when defining the chart boundaries. However, the extreme data is still added to the boundaries.

Cunupia Capital DMI OscillatorOscillator for DMI, it allows you to see the difference in percentage with the different DMI lines, positive and negative and it's strength.

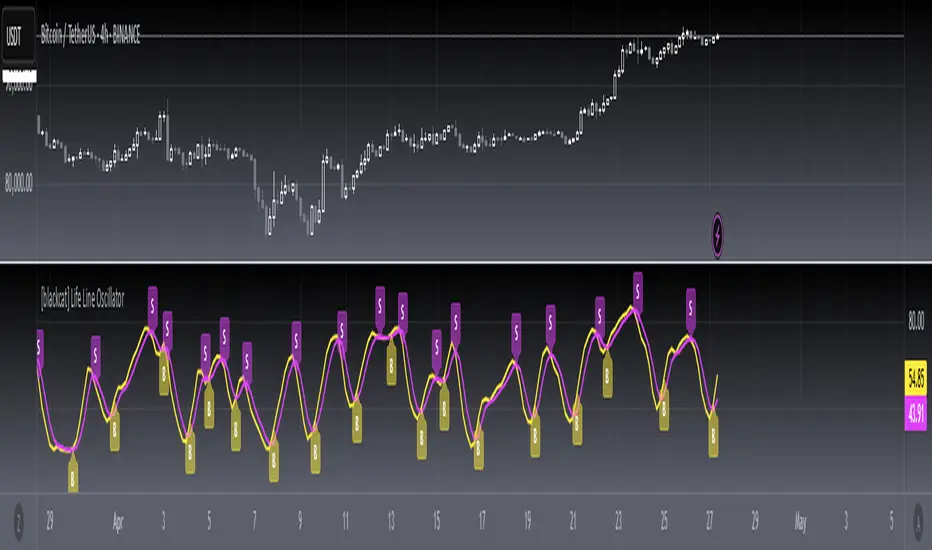
[blackcat] L1 Main life line oscillator█ OVERVIEW
The Pine Script provided is an indicator named " L1 Main life line oscillator." Its primary function is to calculate and plot two oscillators: the Main Force and the Life Line. These oscillators are derived from smoothed price data, and the script also detects and labels crossovers and crossunders between the two lines, which can be used to generate buy and sell signals.
█ FEATURES
Key Features:
• Input Parameters: Users can define the period (n) and the weight for the oscillators.
• Custom Function: A function calculate_life_line_oscillator is defined to compute the Main Force and Life Line oscillators.
• Advanced Calculations: The script uses an adaptive moving average (ALMA) and exponential moving average (EMA) to smooth the price data and calculate the oscillators.
• Crossover and Crossunder Detection: Built-in functions ta.crossover and ta.crossunder are used to identify signal points.
• Label Drawing: Custom labels are drawn on the chart to indicate buy ("B") and sell ("S") signals.
█ HOW TO USE
1 — Configure Input Parameters: Adjust the period (n) and weight to suit your trading strategy.
2 — Interpret the Oscillators: Observe the Main Force and Life Line on the chart.
3 — Act on Signals: Look for crossovers and crossunders to generate buy and sell signals. Buy signals are indicated by the label "B" and sell signals by "S".
█ LIMITATIONS
• Lag in Signals: While the use of ALMA and EMA reduces lag, some delay may still occur, especially in volatile markets.
• False Signals: Crossovers and crossunders can sometimes produce false signals, so it is advisable to use this indicator in conjunction with other tools for confirmation.
█ NOTES
Advanced Pine Script Features:
• Adaptive Moving Average (ALMA): Provides a more responsive and adaptive oscillator.
• Exponential Moving Average (EMA): Smooths the price range and Main Force values.
• Crossover and Crossunder Detection: Utilizes built-in functions for signal identification.
• Label Drawing: Enhances visual signaling with custom labels.
Optimization Techniques:
• The use of ALMA and EMA helps in reducing lag and improving the responsiveness of the oscillators.
• The custom function encapsulates complex calculations, making the main script cleaner and more maintainable.
Unique Approaches:
• The combination of ALMA and EMA to create the Main Force oscillator provides a unique smoothing method.
• The Life Line is calculated using a weighted average of the previous and current Main Force values, adding an additional layer of smoothing and responsiveness.
█ THANKS
Thank you for using the " L1 Main life line oscillator." If you have any questions or suggestions, please feel free to reach out in the comments or on the TradingView or my Discord channel.
█ EXTENDED KNOWLEDGE AND APPLICATIONS
Potential Modifications:
• Additional Indicators: Extend the script to include other technical indicators (e.g., RSI, MACD) for a more comprehensive trading signal system.
• Customizable Colors and Styles: Allow users to customize the colors and styles of the plotted lines and labels.
• Alerts: Implement alerts for crossovers and crossunders to notify users in real-time.
Application Scenarios:
• Intraday Trading: The responsiveness of the oscillators makes this script suitable for intraday trading, where quick buy and sell signals are crucial.
• Long-Term Analysis: By adjusting the period n, the script can be used for long-term trend analysis and strategic trades.
• Backtesting: The script can be modified into a strategy to backtest the performance of the oscillator-based signals against historical data.
Related Pine Script Concepts:
• Strategy Development: Understanding how to convert indicators into strategies for backtesting and live trading.
• Advanced Plotting: Exploring more advanced plotting techniques, such as using different styles and customizing plot appearances.
• Signal Validation: Techniques for validating and filtering signals to reduce false positives and improve trade accuracy.
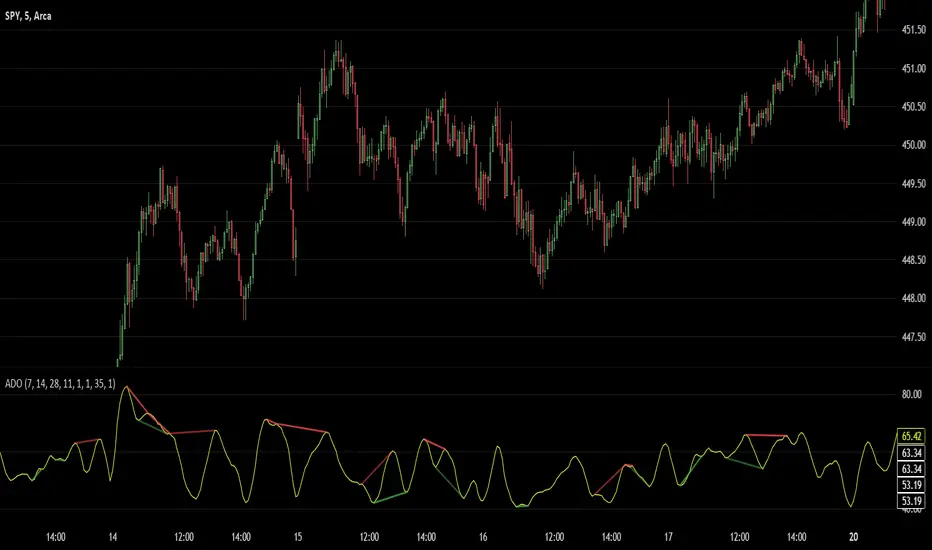
Advanced Divergence OscillatorIntroduction to ADO
The Advanced Divergence Oscillator (ADO) is a modern tool crafted for traders in various markets like stocks, forex, or cryptocurrencies. Imagine it as a smart gadget that helps you understand the ebb and flow of market prices. Unlike standard tools, ADO provides a more nuanced view, enabling you to grasp subtle changes in market trends.
Functionality of ADO
ADO operates by observing and comparing market price movements over different timeframes. Picture a racetrack where cars are moving at various speeds. Some are racing ahead, while others are gradually picking up pace. ADO keeps track of these varying 'speeds' in market prices.
By analyzing these movements, ADO generates a smooth, flowing line – the oscillator. This line moves in a wave-like pattern, offering hints about the market's momentum and possible future trends. When the line moves up, it suggests increasing prices, and when it moves down, it hints at falling prices.
How to Use ADO
Setup: You can easily integrate ADO into your trading platform, adjusting settings like length and color to suit your preference.
Reading the Oscillator: Watch for the oscillator's movement. Rising and falling patterns can indicate potential buying or selling opportunities.
Identifying Divergences: ADO excels in spotting divergences – situations where market prices and the oscillator don't align. For instance, if prices are climbing but the oscillator is falling, it might signal a potential price drop ahead.
Brief History of the Ultimate Oscillator
The concept of oscillators in trading isn’t new. The Ultimate Oscillator, developed by Larry Williams in the 1970s, is a foundational tool in this field. Williams' innovation was to combine short, intermediate, and long-term market trends into a single oscillator. This approach offered a more comprehensive market view, helping traders make informed decisions.
The ADO is a step further in this evolution. It takes the core principles of the Ultimate Oscillator and enhances them with proper smoothing and divergence detection methods. This evolution represents the continuous effort in the trading community to refine tools for better market analysis and decision-making.
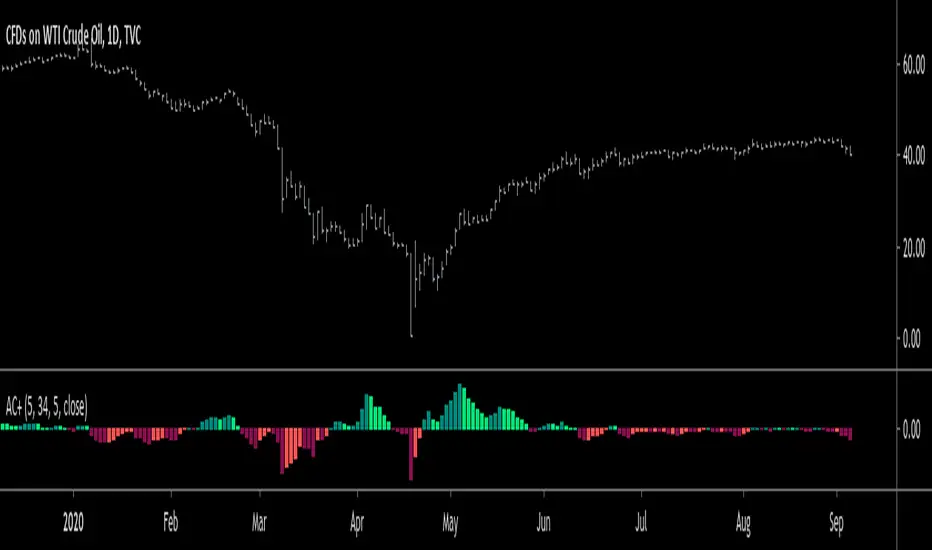
Accelerator Oscillator PlusBill Williams designed the Accelerator Oscillator (AC) to provide the earliest indications possible to changes in the trend, and he claimed that it gives traders a significant advantage in the market.
Improving upon his indicator, I give you Accelerator Oscillator Plus (AC+). Currently, Accelerator Oscillator Plus sets itself apart from other Accelerator Oscillators in Tradingview because it has a source option that allows the user to choose between close, hl2, etc.
Calculation:
AO(5,34) = sma(close,5) - sma(close,34)
AC(5,34,5)+ = AO - sma(AO,5)
The default & recommended settings for Accelerator Oscillator Plus are:
AO ma1: 5
AO ma2: 34
AC ma: 5
AO Source: Close
How to trade with this oscillator:
When values are greater than zero, oscillator is green/bullish.
When values are lesser than zero, oscillator is red/bearish.
A signal to buy occurs when the oscillator changes from (-) to (+) values...and vise versa for a sell signal.
If you have any questions or concerns, please leave a comment down below.
Also, hit the like & follow buttons if you haven't already!
I come up with new indicators every month!
Good luck, and enjoy :)
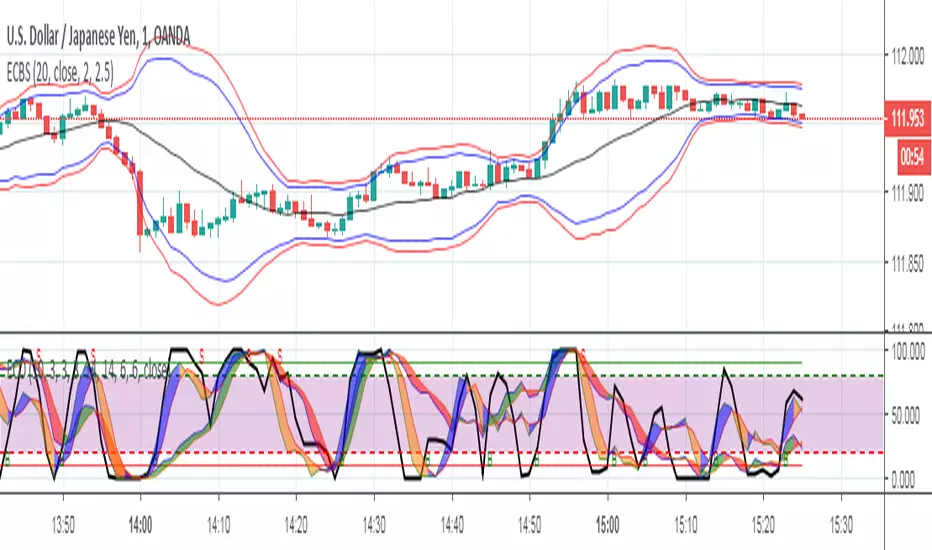
Evan Cabral OscillatorsThis is the oscillator strategy that Evan Cabral teaches. He uses three oscillators: DMI Stochastic Extreme, and two Stochastic RSI's.
This script overlays all three in a single display.
Pulse of Cycle Oscillator"Pulse of Cycle" Oscillator: Logic and Usage
What Is It and How Does It Work?
The "Pulse of Cycle" is an oscillator that measures the cycles of price rises and falls, helping you spot overbought and oversold conditions. Unlike classic indicators, it doesn’t focus on how much the price moves but tracks its direction (up or down) like a "pulse." Here’s the logic:
Price Movement:
If the price rises compared to the previous bar, it adds +1.
If the price falls, it subtracts -1.
If the price stays the same, it adds 0.
Decay Factor: Each step, the previous value is multiplied by a factor (e.g., 0.9) to shrink it slightly. This keeps the oscillator from growing too big and focuses it on recent price action.
Signals: The oscillator moves around zero. When it crosses certain levels (e.g., 5 and 10), it warns you about overbought or oversold zones:
Weak Signal: Above ±5, the market might be stretching a bit.
Strong Signal: Above ±10, a reversal is more likely.
In short, it tracks the "rhythm" of price streaks (consecutive ups or downs) and signals when things might be getting extreme.
How It Looks on the Chart
Line: The oscillator moves around a zero line.
Colors:
Blue: Normal zone (between -5 and +5).
Orange: Weak overbought (+5 and up) or oversold (-5 and down).
Red: Strong overbought (+10 and up).
Lime: Strong oversold (-10 and down).
Threshold Lines: You’ll see lines at 0, ±5, and ±10 on the chart to show where you are.
How to Use It?
Here’s how to trade with this oscillator:
Buy Opportunity (Long Position):
When?: The oscillator drops below -5 (weak) or -10 (strong), then starts moving back toward zero. This suggests the price has hit a bottom and might rise.
Example: It falls to -12 (lime), then rises to -8. You could buy, expecting a bounce.
Tip: Wait for a green candle to confirm if you want to be safer.
Sell Opportunity (Short Position):
When?: The oscillator rises above +5 (weak) or +10 (strong), then starts dropping back toward zero. This indicates the price might have peaked and could fall.
Example: It hits +11 (red), then drops to +7. You could sell, expecting a decline.
Tip: Look for a red candle to confirm the turn.
Neutral Zone: If it’s between -5 and +5, the market is balanced. You can wait for a clearer signal.
Practical Steps to Use
Add to TradingView:
Paste the code into Pine Editor and click “Add to Chart.”
Adjust Settings (Optional):
Decay (0.9): Lower to 0.7 for faster response, raise to 0.95 for smoother movement.
Thresholds (5 and 10): Change them (e.g., 4 and 8) based on your market.
Watch Signals:
Follow the color changes and threshold crossings.
Set Alerts:
Right-click the oscillator > “Add Alert” to get notified on overbought/oversold signals.
Things to Watch Out For
Confirmation: Pair it with support/resistance levels or candlestick patterns for stronger signals.
Market Type: Works best in range-bound (sideways) markets. In strong trends (all up or down), signals might mislead.
Risk: Always use a stop loss—below the last low for buys, above the last high for sells.
Summary
The "Pulse of Cycle" is a simple yet powerful tool that tracks price movement streaks. Use it to catch reversals at strong signals (-10/+10) or get early warnings at weak signals (±5). The colors and lines on the chart make it easy to see when to act.

Pivot Length Percentiles Oscillator# Pivot Length Percentiles Oscillator: Technical Mechanics Explained
## Introduction
The Pivot Length Percentiles Oscillator is a statistical approach to identifying potential market reversals by analyzing the distribution of price movements relative to pivot points. This publication explains the technical mechanics behind the indicator.
## Core Mechanics
### 1. Pivot Point Detection
The indicator begins by identifying significant pivot highs and lows using a user-defined lookback period:
- `lft`: Number of bars to the left of potential pivot point
- `rht`: Number of bars to the right of potential pivot point
These parameters determine how "significant" a pivot needs to be to qualify for analysis.
### 2. Distance Measurement & Historical Database
For each new pivot point identified, the indicator:
- Calculates the absolute price distance from the previous pivot of the same type
- Records the number of candles between consecutive pivots
- Stores these measurements in dynamic arrays that build a historical database
### 3. Statistical Distribution Analysis
Rather than using fixed values, the oscillator analyzes the complete distribution of historical pivot distances and calculates key percentile values:
- `lw` (Low Percentile): Lower boundary for statistical significance
- `md` (Mid Percentile): Median statistical boundary
- `hi` (High Percentile): Upper boundary for statistical extremes
### 4. Oscillator Construction
Two primary oscillator lines are calculated:
- Green line (`osc1`): Measures current price's fall below recent highs with `low - ta.highest(high, lft)`
- Red line (`osc2`): Measures current price's rise above recent lows with `high - ta.lowest(low, lft)`
### 5. Threshold Generation
The percentile values from the historical distribution create dynamic threshold lines:
- For downside movements: Scaled versions of the low percentile (`lw_distance_low`) and high percentile (`hi_distance_low`)
- For upside movements: Scaled versions of the low percentile (`lw_distance_high`) and high percentile (`hi_distance_high`)
### 6. Signal Logic
Entry signals are generated when:
- **Bullish Signal**: The downside oscillator crosses below a statistical threshold while price continues showing downward momentum (close < previous close AND close < previous open)
- **Bearish Signal**: The upside oscillator crosses above a statistical threshold while price continues showing upward momentum (close > previous close AND close > previous open)
### 7. Visualization Options
Users can toggle between:
- Standard view: Shows the oscillator and threshold lines
- Percentile view: Displays the current movement's percentile rank within the historical distribution
## Implementation Notes
- The indicator scales threshold values by 0.9 to create a slight buffer that reduces false signals
- The movement's continuation is confirmed by checking both close-to-close and close-to-open relationships
- Arrays dynamically update throughout the chart's history, making the indicator increasingly accurate as more data is processed
## Mathematical Framework
The core statistical function calculates percentiles using linear interpolation between values when needed:
```
calculate_percentile(array, percentile) =
sortedValue +
fraction * (sortedValue - sortedValue )
```
where `index = (array.size - 1) * percentile / 100`
This mathematical approach ensures the thresholds adapt dynamically to changing market conditions rather than relying on fixed values.

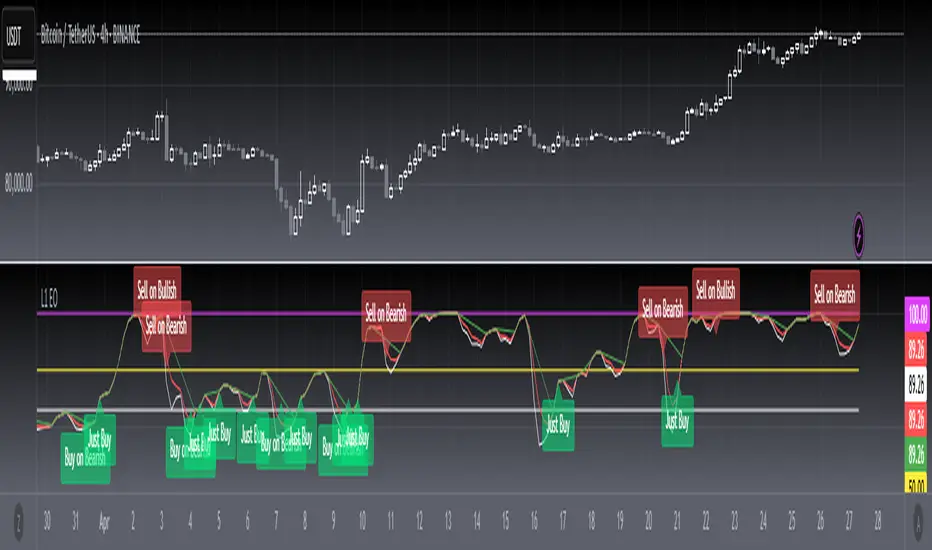
[blackcat] L1 Enveloped Oscillator█ OVERVIEW
The script is an indicator named “ L1 Enveloped Oscillator” (L1 EO) designed to plot various trend and oscillator values on a separate chart pane. It calculates multiple indicators such as trend, adjusted trend, oscillator, directional strength, and normalized oscillator, and uses these to detect potential buy and sell signals based on trend contractions, expansions, and divergences.
█ LOGICAL FRAMEWORK
Structure:
1 — Input Parameters: None are explicitly defined, but the script is parameterized within the function with fixed values for levels and periods.
2 — Calculations: The calculate_l1_enveloped_oscillator function computes multiple values including price bases, trend, oscillator, and adjusted trends. This function uses built-in Pine Script functions like ta.highest, ta.lowest, ta.ema, ta.sma, and math.max.
3 — Plotting: The calculated values are plotted on the chart using the plot function, with different colors and styles for visual distinction.
4 — Signal Detection: The script detects and labels potential buy and sell signals based on trend contractions, expansions, and divergences between the price and oscillator.
5 — Conditional Statements: Multiple if statements are used to determine when to place labels for buy and sell signals.
█ CUSTOM FUNCTIONS
• calculate_l1_enveloped_oscillator(high, low, close, open): Calculates various trend and oscillator values based on the input price data.
— Parameters: high, low, close, open (price data).
— Return Values: A tuple containing top_level, bottom_level, middle_level, adjusted_trend, trend, oscillator, directional_strength, normalized_oscillator, and adjusted_candle_trend.
█ KEY POINTS AND TECHNIQUES
• Advanced Pine Script Features: Utilizes built-in functions for technical analysis (ta.highest, ta.lowest, ta.ema, ta.sma, ta.crossover, ta.crossunder).
• Optimization Techniques: Uses fixed periods and levels for calculations, which can be adjusted for different market conditions.
• Best Practices: Clearly separates calculations and plotting, making the script modular and easier to maintain.
• Unique Approaches: Combines multiple indicators (trend, oscillator, directional strength) to detect complex market conditions like divergences and contractions/expansions.
█ EXTENDED KNOWLEDGE AND APPLICATIONS
• Modifications: Users can modify the levels (top_level, bottom_level, middle_level) and periods used in calculations to better suit specific asset classes or market conditions.
• Extensions: The script can be extended to include additional indicators or signals, such as RSI or MACD, to enhance its predictive power.
• Application Scenarios: Similar techniques can be applied in other trading strategies involving trend analysis and divergence detection, such as momentum trading or mean reversion strategies.
• Related Concepts: Users can explore other Pine Script concepts like alerts, backtesting, and optimization to fine-tune strategies based on historical data.
Awesome Oscillator.MMouse_Lager_BCEAwesome Oscillator with added options for turning short trades on and off, as well as a start date for backtesting.
