Sharky Reversal IndicatorAuthor: Tradewave
Date: 12/16/2017
Description:
Identifies key reversal area on any time frame. The indicator is based on pure price action and an oscillator.
Search in scripts for "oscillator"

Stochastic Slow [ABitra]Stochastic slow is a slower version of stochastic oscillator.
Defaults K=10, D=10

RSI and CCICombined RSI and CCI Indicator for MetaTrader
The Combined RSI and CCI Indicator is a powerful hybrid momentum oscillator designed to merge the strengths of two popular indicators—the Relative Strength Index (RSI) and the Commodity Channel Index (CCI)—into a single, visually intuitive chart window. This tool enhances traders’ ability to identify overbought and oversold conditions, divergences, trend strength, and potential reversal zones with improved precision.
Purpose
By integrating RSI and CCI, this indicator helps filter out false signals that often occur when using each tool independently. It is especially useful for swing trading, trend confirmation, and spotting high-probability entry/exit zones. This dual-oscillator approach combines RSI’s relative momentum insights with CCI’s deviation-based analysis to produce a more reliable signal structure.
Key Features
Dual Oscillator Display: Plots both RSI and CCI on the same subwindow for easy comparison and correlation analysis.
Customizable Parameters:
RSI Period and Level (default: 14)
CCI Period and Typical Price Type (default: 20, TP)
Overbought/Oversold Levels for both indicators
Color-Coded Zones:
Background highlights when both RSI and CCI enter overbought/oversold territory, signaling high potential reversal zones.
Combined Signal Logic (Optional Feature):
Buy Signal: RSI < 30 and CCI < -100
Sell Signal: RSI > 70 and CCI > 100
These can be visualized as arrows or plotted as signal markers.
Trend Filter Overlay (Optional):
Can be combined with a moving average or price action filter to confirm trend direction before accepting signals.
Divergence Detection (Advanced Option):
Optional plotting of bullish or bearish divergence where both indicators diverge from price action.
Multi-Timeframe Compatibility:
Allows the use of higher timeframe RSI/CCI values to confirm signals on lower timeframes.
Benefits
Improved Signal Accuracy: Using both RSI and CCI together helps avoid false breakouts and whipsaws.
More Informed Decision-Making: Correlating momentum (RSI) with deviation (CCI) provides a well-rounded picture of market behavior.
Efficient Charting: Saves screen space and cognitive load by combining two indicators into one clean panel.
Scalable Strategy Integration: Can be used in discretionary trading or coded into automated strategies/alerts.
Use Case Example
In a ranging market, the indicator highlights zones where both RSI and CCI are oversold, alerting traders to potential bounce opportunities.
In trending markets, it confirms trend strength when RSI and CCI are both aligned with trend direction.
When RSI is diverging from price but CCI isn’t, it can be a clue of weakening momentum, helping traders scale out or avoid traps.
This combined indicator offers a versatile, high-performance toolset for traders looking to elevate their technical analysis by leveraging multiple momentum perspectives simultaneously.


MonsterSpeedA parameter-free self-adjusting wave oscillator. The presentation is slightly unusual (both red and green parts are on the same side), but this makes buy/sell waves more easily visible. It is best used when one side of the market becomes weaker than the other and then ride the market waves in one direction until the bull/bear force evens out again. This indicator enables easy visual comparison between buy and sell side at at point in time.

Stochastic RSI with Crossover AlertsThis draws your Stochastic RSI just like normal except it adds red or green squares everytime there is a crossover at the bottom or the top of the oscillator. Green crossover is bullish, red is bearish.

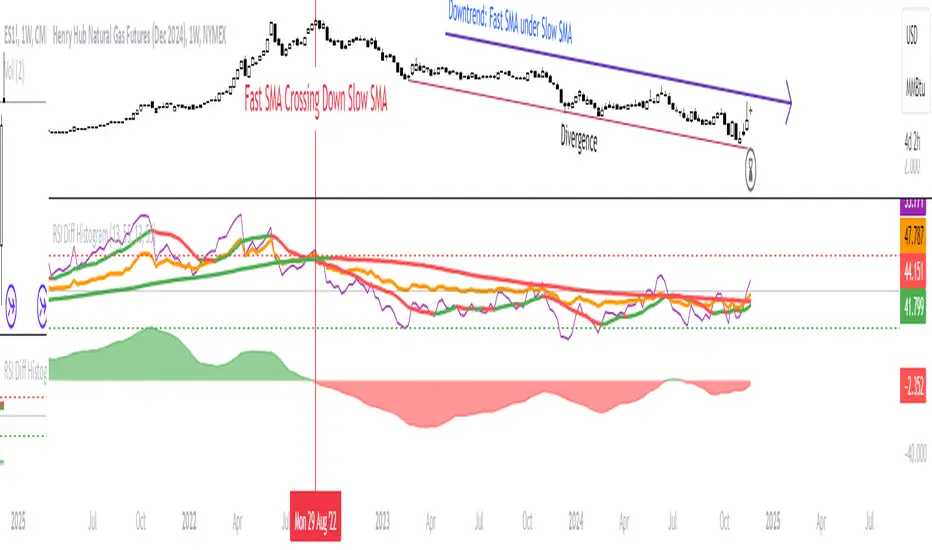
RSI Difference (Fast and Slow)Introduction
Oscillators like the RSI are fundamental tools for identifying trends in financial markets. Their ability to measure price momentum allows traders to detect overbought, oversold levels, and divergences, anticipating trend changes. Are there ways to improve the use of traditional RSI? How can we obtain more detailed information about current trends? This indicator answers these questions by expanding the functionalities of the traditional RSI and offering an additional tool for analysis.
How does it work?
This indicator provides a framework for trend analysis based on the following setup:
Fast RSI
Slow RSI
SMA of the fast RSI
SMA of the slow RSI
Histogram
Custom Indicator Settings
My preferred configuration is based on the 13 and 55 moving averages. The rest of the setup is as follows:
I typically use the 13 and 55 moving averages to configure both the RSI and short- and long-term moving averages.
Interpretation and Signals: Including a Long-Period RSI
Including a long-period RSI helps identify key patterns in market behavior. Crossovers between the two can be used to establish entry patterns:
If the fast RSI crosses above the slow RSI, this could indicate a long-entry pattern.
If the fast RSI crosses below the slow RSI, this could indicate a short-entry pattern.
Interpretation and Signals: Including Moving Averages
Including moving averages for both the short- and long-period RSI can help identify the base trend of the movement and, consequently:
Avoid false signals.
Trade in favor of the trend.
A simple way to start working with these is to use the crossover of the moving averages to identify the current trend:
If the short-period SMA is above the long-period SMA, the trend is bullish.
If the short-period SMA is below the long-period SMA, the trend is bearish.
Interpretation and Signals: The Histogram
The histogram represents the difference between the moving averages. If the histogram is positive, the short average is above the long average. If the histogram is below zero, the short average is below the long average. Divergences with price provide signals of potential exhaustion in the movement, indicating a possible reversal.
Indicator Details
This indicator builds upon the traditional RSI by integrating additional features that enhance its utility for traders. Here’s how each component is calculated and how they contribute to the originality of the script:
Fast RSI and Slow RSI: The fast RSI is calculated using a shorter lookback period, allowing it to capture rapid changes in momentum. The slow RSI uses a longer period to smooth out fluctuations and provide a broader view of the trend. These two RSIs work together to identify significant momentum shifts.
SMA of RSI values: The simple moving averages (SMA) of the fast and slow RSI help filter out noise and provide clear crossover signals. The SMAs are calculated using standard formulas but applied to the RSI values rather than price data, which adds a layer of insight into momentum trends.
Histogram calculation: The histogram represents the difference between the SMA of the fast RSI and the SMA of the slow RSI. This value gives a visual representation of the convergence or divergence of momentum. When the histogram crosses zero, it signifies a potential shift in the underlying trend.
This indicator combines multiple layers of analysis: fast and slow momentum, trend confirmation through SMAs, and divergence detection via the histogram. This multi-dimensional approach provides traders with a more comprehensive tool for trend analysis and decision-making.
Conclusion
This article has explored how to use this indicator to identify trends, leverage entry patterns, and analyze divergences by combining the fast RSI, slow RSI, their moving averages, and a histogram. Additionally, I’ve detailed how I usually interpret this indicator:
Identifying RSI patterns to anticipate momentum changes.
Using SMAs to confirm base trends.
Leveraging the histogram to detect divergences and potential price reversals.
Stoic Stoch MFI V2.0 [Nest]This indicator has 2 price momentum oscillators
Aqua line = fast stochastics that react to price action faster (5m and 10m timeframe)
Pink line = slow stochastics that react to price action slow (20m timeframe)
Both lines use a complex smoothing average formula to give more precise measurements of momentum.
Added on top of this indicator is "Godmode by LazyBear" and MFI for confluence.

JohnHosana Momentum/Breakout IndicatorThe Johnhosana Momentum/Breakout Indicator is a pure trend-following indicator. It only looks at price data, and doesn't guess where support and resistance areas are. That sounds a bit basic but it's actually a great strength. Since the Johnhosana Momentum/Breakout Indicator follows the trend, it practically guarantees that we're on the right side of important trends.
When prices cross the upper band, open a long position. Sell when they cross the opposite band.
When prices cross the lower band, initiate a short trade. Cover that position once prices cross the other band.
A nice feature of the Johnhosana Momentum/Breakout is that it moves with prices. When there's an uptrend, new highs push the upper band higher. But an uptrend also has higher lows, and that makes the Johnhosana Momentum/Breakout lower band also move up. This way our long exit becomes more favourable the longer the trend continues.
The size of the Johnhosana Momentum/Breakout also tells us something. When the market is in a volatile downtrend, the Johnhosana Momentum/Breakout increases in height. Then when price volatility decreases, the channel becomes smaller as well. (And when the bands become exceptionally narrow, there's even a chance of a volatile breakout.)
The Johnhosana Momentum/Breakout is not always easy to trade, unfortunately. When prices move sideways, the indicator can generate a lot of false signals. And when trends don't last long, there isn't always enough price movement for a profitable exit. In those environments we better use oscillators instead of trend-following indicators.

Divergence spotter for MCB (add-on)This is an add-on to spot price-momentum divergences in oscillators such as MarketCipher B. Alerts are available for newly found divergences.
Instructions for adding to MarketCipher B:
click on the down arrow next to MarketCipher B
select 'Add indicator on MarketCipher B'
select 'Divergence spotter for MCB'
Instructions for adding to price chart
click on the normal add indicator button
select 'Divergence spotter for MCB'
in the indicator settings set source to 'MarketCipher B: Lt BlueWave' and tick the overlay on price chart option
re-upload


Dynamic ZonesA port of the MT4 indicator of Mladen Rakic found at www.mql5.com
which is based on Dynamic Zones that was originally published in Stocks & Commodities 1996 issue.
Dynamic Zones is meant to be applied to oscillators to get dynamic overbought and oversold levels
quantified using statistical methods.


Greeny's Oscilator📊 Multi-Timeframe Oscillator
This custom oscillator tracks the position and alignment of trends across three different timeframes to support both strategic context and precise entries:
🔹 Blue Line – Fast Wave (Entry)
Represents the lowest timeframe, designed for entry timing. It reacts quickly to price action and highlights short-term momentum shifts.
On ultra-low timeframes like 10s, price constantly oscillates — every buy triggers a sell and vice versa. This makes the small wave oscillator ideal for precise entries.
• ✅ In balanced markets, it’s useful for both long and short trades.
• ⚠️ In trending markets, it’s best used to enter pullbacks in the direction of the higher trend.
🔸 Mid Line – Middle Trend Context
Represents the medium timeframe. It helps you identify whether the market is bullish, bearish, or neutral, useful as a confirmation layer before pulling the trigger.
🔴 Thick Line – Higher Timeframe Bias
Tracks the higher timeframe trend structure and serves as your directional anchor.
It helps you:
• Avoid trading against strong momentum (Above 50/ Below -50 -> wait for trend reversal on Mid/Thick line)
• Stay aligned with macro trend conditions
⚙️ Customization
Each line can be configured to use your preferred timeframe (e.g., 5m / 15m / 1h) and smoothing letting you adapt the oscillator to any strategy or asset.

Momentum TrackerMomentum Tracker - Advanced Multi-Timeframe Momentum Oscillator
Overview
The Momentum Tracker is a sophisticated momentum oscillator that employs a proprietary triple-layer exponential smoothing algorithm to measure market momentum with exceptional precision. This indicator transforms complex price movements into clear, actionable signals through an intuitive color-coded display system.
Key Features
• Advanced Calculation Engine
Triple-layer exponential smoothing for noise reduction
Proprietary momentum normalization algorithm
Oscillates smoothly between 0-100
• Multi-Timeframe Analysis (NEW!)
Analyze momentum from any timeframe on your current chart
Perfect for confirming higher timeframe trends on lower timeframe entries
Timeframe display badge for easy reference
• Dynamic Visual System
Blue: Rising momentum (bullish pressure)
Red: Falling momentum (bearish pressure)
Yellow: Neutral/consolidating (no clear direction)
• Reference Levels
90: Overbought zone
50: Equilibrium line
10: Oversold zone
• Professional Features
No repainting - uses only confirmed data
Works on all markets (Forex, Crypto, Stocks, Indices)
Compatible with all timeframes (1m to Monthly)
Clean, uncluttered display
How It Works
The Momentum Tracker uses a sophisticated multi-stage process:
Price Input: Calculates using typical price (HLC/3) for balanced market representation
Triple Smoothing: Applies three layers of adaptive exponential smoothing to filter market noise while preserving trend integrity
Momentum Normalization: Converts raw momentum into a bounded 0-100 oscillator
Dynamic Coloring: Instantly visualizes momentum direction through color changes
Trading Applications
1. Trend Identification
Blue line = Uptrend momentum
Red line = Downtrend momentum
Yellow line = Consolidation/indecision
2. Overbought/Oversold Conditions
Readings above 90 suggest overbought conditions
Readings below 10 suggest oversold conditions
Best used in conjunction with price action
3. Momentum Divergences
Spot regular and hidden divergences
Early warning of potential trend reversals
Confirmation tool for other signals
4. Multi-Timeframe Confirmation
View daily momentum on hourly charts
Confirm entry signals with higher timeframe momentum
Avoid trades against higher timeframe momentum
5. Entry/Exit Timing
Color changes can signal momentum shifts
Midline (50) crosses indicate trend bias changes
Extreme readings suggest potential reversal zones
Settings
• Timeframe: Select any timeframe for momentum calculation (leave empty for chart timeframe)
Best Practices
DO combine with price action and support/resistance levels
DO use multiple timeframe analysis for confirmation
DO wait for clear color changes before making decisions
DON'T use as a standalone trading system
DON'T trade solely based on overbought/oversold levels
DON'T ignore overall market context
Pro Tips
Divergence Trading: Look for momentum making lower highs while price makes higher highs (bearish divergence) or vice versa
Trend Following: Trade in the direction of the momentum color on higher timeframes
Range Trading: Use extreme readings (>90 or <10) for mean reversion trades in ranging markets
Confluence: Best signals occur when momentum aligns across multiple timeframes
Technical Details
Version: 6.0 (Pine Script v6)
Overlay: False (displays in separate pane)
Repainting: No
Calculation: Based on typical price (HLC/3)
Update Frequency: Real-time with each price tick
Risk Disclaimer
Trading financial instruments involves substantial risk and may result in loss of capital. This indicator is provided for informational and educational purposes only and should not be construed as investment advice. Always:
Use proper risk management
Updates
Latest Update: Added multi-timeframe functionality allowing momentum analysis from any timeframe on your current chart view.
Tags: #momentum #oscillator #trend #multitimeframe #norepaint #exponentialsmoothing #momentumindicator #technicalanalysis #trading #forex #crypto #stocks

Dynamic Regression Divergence (DRD)The Dynamic Regression Divergence (DRD) indicator is an adaptive oscillator designed to assess the deviation of the current price from its expected trend, as determined by linear regression. It calculates a regression line over a specified period and measures the difference between the actual price (e.g., the closing price) and the regression value, normalizing this deviation by the current market volatility (using standard deviation). The resulting value is displayed as an oscillator oscillating around zero.
Signals:
– When the oscillator exceeds a positive threshold (e.g., +1.5 standard deviations), it may indicate overbought conditions and a potential trend reversal to the downside.
– Conversely, when the oscillator falls below a negative threshold (e.g., -1.5 standard deviations), it signals oversold conditions and a possible reversal to the upside.
Advantages:
– Dynamic adaptation to changing market volatility.
– Simplicity of implementation using basic mathematical functions in Pine Script.
– A unique combination of trend analysis and normalized divergence measurement, helping traders identify moments of abnormal price behavior.
Индикатор Dynamic Regression Divergence (DRD) – это адаптивный осциллятор, разработанный для оценки отклонения цены от ожидаемой тенденции, полученной с помощью линейной регрессии. Он рассчитывает регрессионную линию на выбранном периоде и измеряет разницу между фактической ценой (например, ценой закрытия) и значением регрессии, нормируя её на основе текущей волатильности (с использованием стандартного отклонения). Полученное значение отображается в виде осциллятора, колеблющегося вокруг нуля.
Сигналы:
– Если осциллятор значительно превышает положительный порог (например, +1,5 стандартных отклонений), это может указывать на перекупленность и потенциальный разворот вниз.
– Если осциллятор опускается ниже отрицательного порога (например, -1,5 стандартных отклонений), это сигнализирует о перепроданности и возможном развороте вверх.
Преимущества:
– Динамичная адаптация к изменяющейся волатильности рынка.
– Простота реализации с использованием базовых математических функций Pine Script.
– Уникальное сочетание трендового анализа и нормировки отклонений, позволяющее трейдерам выявлять моменты аномального поведения цены.

Sri_Momentum Sri_Momentum - Advanced Oscillator for Market Trends
Description
The Sri_Momentum is a powerful momentum-based oscillator that helps traders analyze price trends and market strength. This indicator utilizes two simple moving averages (SMA) to calculate the Awesome Oscillator (AO) and a signal line for trend confirmation. The histogram dynamically changes color based on the crossover between AO and the signal line, providing clear bullish and bearish signals.
✅ Awesome Oscillator (AO) Calculation - Measures market momentum using a fast and slow SMA.
✅ Signal Line for Confirmation - A smoothed moving average of AO to help traders identify trend shifts.
✅ Dynamic Histogram Color Coding - Easy-to-interpret histogram with four colors indicating trend strength and direction.
✅ Custom Sensitivity Input - Adjusts the AO calculation to fine-tune responsiveness.
✅ Zero Line Reference - A baseline to differentiate bullish and bearish momentum.
How It Works
Fast SMA (default: 5-period) and Slow SMA (default: 34-period) are calculated based on the average of high and low prices.
AO (Awesome Oscillator) = (Fast SMA - Slow SMA) * Sensitivity
Signal Line = Smoothed AO using a 7-period SMA
Histogram Color Logic:
🔵 Strong Bullish → AO > Signal & AO ≥ 0 (Green)
🔴 Weak Bullish → AO > Signal & AO < 0 (Light Red)
🟢 Weak Bearish → AO < Signal & AO ≥ 0 (Light Green)
🔥 Strong Bearish → AO < Signal & AO < 0 (Dark Red)
How to Use the Sri_Momentum Indicator
📌 Bullish Momentum → When AO crosses above the Signal Line, and the histogram turns green.
📌 Bearish Momentum → When AO crosses below the Signal Line, and the histogram turns red.
📌 Trend Strength → Darker colors indicate stronger trends; lighter colors suggest weaker trends.
📌 Zero Line Crossover → If AO moves above zero, it suggests bullish strength; if below zero, bearish control.

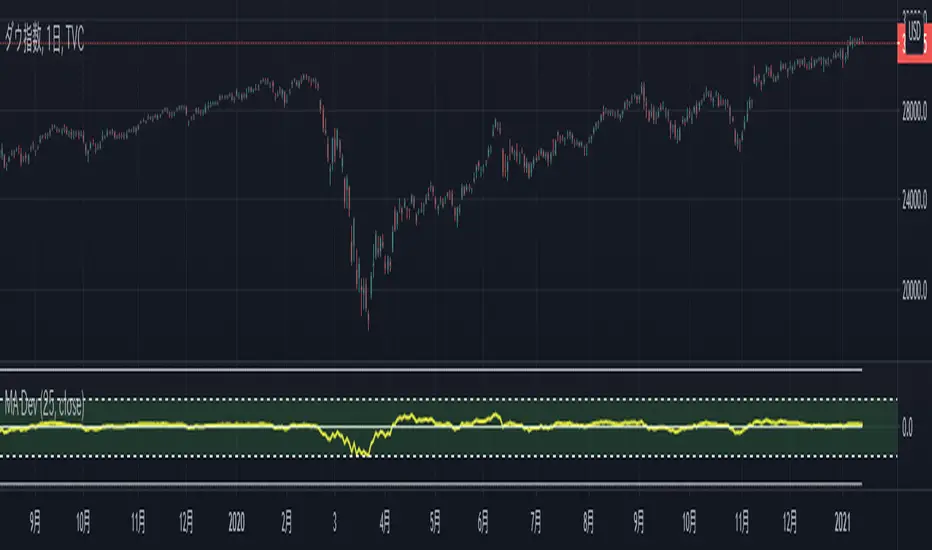
MA Deviation
Script description
A script that displays the deviation rate of the specified moving average line.
You can non-display the oscillator line by setting it.
Default setting
Moving average divergence rate : 25 SMA
Oscillator line (50) : display
Oscillator line (75) : non-display
Oscillator line (100) : non-display
スクリプトの説明
指定した移動平均線の乖離率を表示するスクリプトです。
設定によりオシレーター上の水平線の表示非表示を切り替えることができます。
デフォルト設定
移動平均乖離率:25 SMA
水平線(50):表示
水平線(75):非表示
水平線(100):非表示

S.PRO- Swift Oscillator
- Rapid Oscillator
- Acute Oscillator
- Fast Oscillator
- Slow Oscillator
- Creeping Oscillator

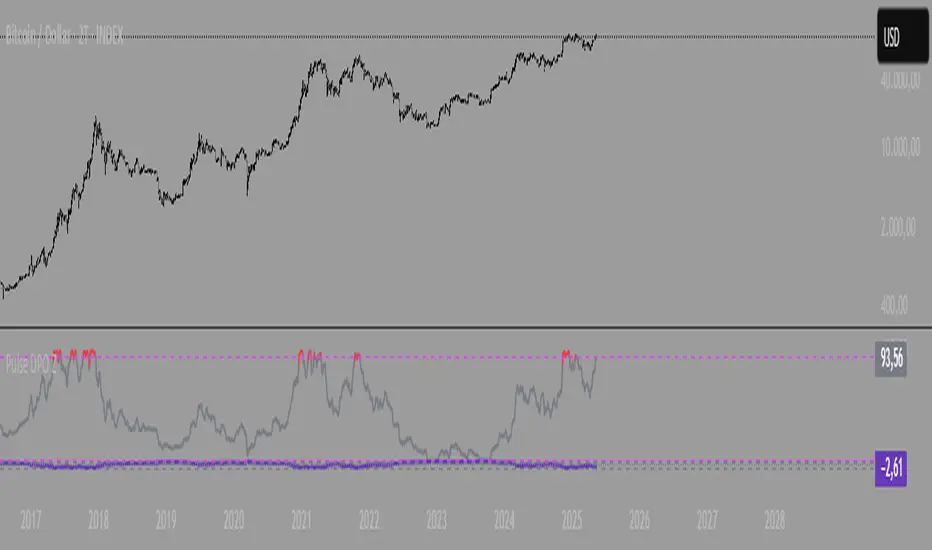
Pulse DPO with Z-Score📌 Pulse DPO with Z-Score — Indicator Description (English)
The Pulse DPO (Detrended Price Oscillator) helps identify major market cycle tops and bottoms by removing long-term trends and focusing on shorter-term price cycles.
This enhanced version includes:
A normalized oscillator (0–100) based on recent price deviations.
A smoothed signal to reduce noise.
A Z-Score transformation, scaling the output to a range from –3 to +3, where:
–3 represents extreme oversold conditions (former normalized value = 100),
+3 represents extreme overbought conditions (former normalized value = 1).
🔍 How it works:
The indicator subtracts a delayed moving average from price to isolate short-term cycles (DPO logic).
It then normalizes the oscillator within a lookback window.
Finally, it converts this to a Z-Score scale for easier interpretation of extremes.
🟢 Suggested Usage:
Consider Long entries or Short exits when Z-Score reaches –2 to –3 (deep oversold).
Consider Short entries or Long exits when Z-Score reaches +2 to +3 (deep overbought).
Use in combination with other signals for higher-confidence setups.