Nth Order Differencing Oscillator Perform higher order differencing through convolution, the result is equivalent to cascading N momentum oscillators of periods P :
mom(mom(mom(mom(x,P)...,P)
Settings
length - Period of the oscillator, indicate the lag to use (equivalent to the period in a momentum oscillator)
order - Differencing order, indicate how many times differencing is performed (number of times a momentum oscillator is cascaded)
src - Input of the indicator
Usage
Differencing consists in subtracting an input to a previous input, this is what the momentum oscillator performs. This is often done in order to remove longer-term variations in the price. Differencing also induces a 90-degree phase shift for all sinusoids in a signal, this is why oscillators can have this leading effect, as such higher differencing can sometimes help have a faster and more visible lead.
In red the indicator with period 50 and differencing order 2, below a momentum oscillator of the same period.
It is important to note that differencing is an operation that increases noise, in fact, you might have seen some oscillators use the median price hl2 instead of the closing price, this is because the median price contains less noise than the closing price, as such more differencing require a smoother input.
Here both the sma and the oscillator period are equal to 20 with a differencing order of 5.
In time series analysis the order of differencing is chosen depending on the order of integration, more simply put we should choose a differencing order that responds to the question: "How many time should I differentiate my time series so that the result is stationary?", for stocks prices this differencing order should be 1.
Technically speaking differencing orders higher than 3 might be overkill, as higher orders return noisier outputs that might no longer be representative of the original input.
here a period of 14 with differencing order of 20 is used, we can see more periodic results but they are not really representative of the closing prices.
Details
Simple differencing is actually achieved thought convolution, if we take a first-order difference x - x(1) , we can see that this is equivalent to 1*x + -1*x(1) , the coefficients are 1 and -1, for the momentum oscillator the difference is that the coefficients include 0 values. So we only need a function generating the coefficients of our Nth order difference oscillator, in order to get them lets analyze the impulse response of a cascaded change function.
Here 5 change function are cascaded, the coefficients are: (1,-5,10,-10,5,-1)
If you look at these coefficients and the ones of higher/lower order differences we can deduce various things
The impulse response is symmetric
The first coefficient is always 1 and the last always -1
The number of coefficients increase with higher differencing orders
The sign of the current coefficient is different from the sign of the previous one
From the shape of the impulse response, we can deduce that the coefficients of an Nth order differencing operator is a windowed series of 1,-1,1...,-1 , and that's actually the case, for an Nth order differencing operator the values of this window are given by the Nth row of the Pascal triangle.
There are various ways to get the values in the row of the Pascal triangle, one involving using the combination formula, however, we can do it way faster by using the recursive formula used in line number 13. Now that we have our coefficients we only need to separate them with 0 values and that's all.
Conclusion
We can see that oscillators are noisier than the original input signal, this is can be a desired effect in order to make lagging indicators more reactive, but it can also be overlooked due to the results appearing leading the price or just looking more predictable, however, we should note that higher-order differencing does not provide a consistent nor reliable solution toward minimizing lag, nor does classical oscillators.
The indicator is not useful, but if for some reason you require a lot of differencing operations to be done and don't want to use consecutive change or mom functions, then this script might results useful to you.
Search in scripts for "oscillator"

Range Oscillator (Zeiierman)█ Overview
Range Oscillator (Zeiierman) is a dynamic market oscillator designed to visualize how far the price is trading relative to its equilibrium range. Instead of relying on traditional overbought/oversold thresholds, it uses adaptive range detection and heatmap coloring to reveal where price is trading within a volatility-adjusted band.
The oscillator maps market movement as a heat zone, highlighting when the price approaches the upper or lower range boundaries and signaling potential breakout or mean-reversion conditions.
Highlights
Adaptive range detection based on ATR and weighted price movement.
Heatmap-driven coloring that visualizes volatility pressure and directional bias.
Clear transition zones for detecting trend shifts and equilibrium points.
█ How It Works
⚪ Range Detection
The indicator identifies a dynamic price range using two main parameters:
Minimum Range Length: The number of bars required to confirm that a valid range exists.
Range Width Multiplier: Expands or contracts the detected range proportionally to the ATR (Average True Range).
This approach ensures that the oscillator automatically adapts to both trending and ranging markets without manual recalibration.
⚪ Weighted Mean Calculation
Instead of a simple moving average, the script calculates a weighted equilibrium mean based on the size of consecutive candle movements:
Larger price changes are given greater weight, emphasizing recent volatility.
⚪ Oscillator Formula
Once the range and equilibrium mean are defined, the oscillator computes:
Osc = 100 * (Close - Mean) / RangeATR
This normalizes price distance relative to the dynamic range size — producing consistent readings across volatile and quiet periods.
█ Heatmap Logic
The Range Oscillator includes a built-in heatmap engine that color-codes each oscillator value based on recent price interaction intensity:
Strong Bullish Zones: Bright green — price faces little resistance upward.
Weak Bullish Zones: Muted green — uptrend continuation but with minor hesitation.
Transition Zones: Blue — areas of uncertainty or trend shift.
Weak Bearish Zones: Maroon — downtrend pressure but soft momentum.
Strong Bearish Zones: Bright red — strong downside continuation with low resistance.
Each color band adapts dynamically using:
Number of Heat Levels: Controls granularity of the heatmap.
Minimum Touches per Level: Defines how reactive or “sensitive” each color zone is.
█ How to Use
⚪ Trend & Momentum Confirmation
When the oscillator stays above +0 with green coloring, it suggests sustained bullish pressure.
Similarly, readings below –0 with red coloring, it suggests sustained bearish pressure.
⚪ Range Breakouts
When the oscillator line breaks above +100 or below –100, the price is exceeding its normal volatility range, often signaling breakout potential or exhaustion extremes.
⚪ Mean Reversion Trades
Look for the oscillator to cross back toward zero after reaching an extreme. These transitions (often marked by blue tones) can identify early reversals or range resets.
⚪ Divergence
Use oscillator peaks and troughs relative to price action to spot hidden strength or weakness before the next move.
█ Settings
Minimum Range Length: Number of bars needed to confirm a valid range.
Range Width Multiplier: Expands or contracts range width based on ATR.
Number of Heat Levels: Number of gradient bands used in the oscillator.
Minimum Touches per Level: Sensitivity threshold for when a zone becomes “hot.”
-----------------
Disclaimer
The content provided in my scripts, indicators, ideas, algorithms, and systems is for educational and informational purposes only. It does not constitute financial advice, investment recommendations, or a solicitation to buy or sell any financial instruments. I will not accept liability for any loss or damage, including without limitation any loss of profit, which may arise directly or indirectly from the use of or reliance on such information.
All investments involve risk, and the past performance of a security, industry, sector, market, financial product, trading strategy, backtest, or individual's trading does not guarantee future results or returns. Investors are fully responsible for any investment decisions they make. Such decisions should be based solely on an evaluation of their financial circumstances, investment objectives, risk tolerance, and liquidity needs.

Pivot Oscillator█ OVERVIEW
Pivot Oscillator is a versatile oscillator that measures market strength by comparing the current price to local price pivots. Values are scaled by ATR, normalized to a 0–100 range, and displayed along with an SMA line.
Oscillator: generates signals suitable for pullback strategies.
SMA line: serves as a momentum indicator.
█ CONCEPTS
Pivot Oscillator is designed with dual functionality:
- Oscillator & signals: ideal for pullback strategies, detecting local highs/lows and short-term reversals.
- SMA (Momentum): shows stable market-side dominance and filters price impulses.
Calculation logic:
- Oscillator = closing price − pivot line (derived from average high/low pivots).
Scaled by ATR and normalized to 0–100:
50 – bullish dominance,
< 50 – bearish dominance.
SMA is computed from smoothed oscillator values and serves as a momentum indicator.
█ FEATURES
Pivot Calculation:
- Pivot Length (lenSwing) – the number of bars used to identify local pivots (highs/lows). Higher values filter only larger extremes, while lower values make the oscillator react faster to local highs and lows.
- Pivot Level (pivotLevel) – determines the position of the pivot line between the average low and high pivots. A value of 0.5 places the pivotLine exactly halfway between the average high and low pivots; values closer to 0 or 1 shift the line toward the low or high pivots, respectively.
- Pivot Lookback (lookback) – the number of recent pivots used to calculate the average pivot, which smooths the pivotLine and reduces noise caused by individual extremes.
- Oscillator calculation: closing price − pivotLine (average of pivots computed from the above parameters).
The pivotLine is then scaled by ATR and normalized to a 0–100 range.
ATR Scaling:
- ATR period (atrLen)
- Multipliers (multUp / multDown) for upper and lower scaling.
Dynamic Colors:
- Oscillator > 50 → green (bullish)
- Oscillator < 50 → red (bearish)
SMA Line (Momentum):
- Smoothed oscillator (SMA) serves as a momentum indicator.
- Dynamic color indicates direction of SMA.
- Helps identify dominant market side and trend.
Overbought / Oversold Zones:
- Configurable OB/OS levels for both oscillator and SMA.
- Dynamic band colors: change depending on SMA relative to maOverbought / maOversold.
- Provides visual confirmation for potential corrections or strong momentum.
Gradients & Visualization:
- Oscillator and SMA gradients (3 layers) with adjustable transparency.
- Gradient visualization for OB/OS zones and oscillator.
- Full customization of colors, line width, and transparency.
Signals:
- Oscillator leaving oversold zone → long signal
- Oscillator leaving overbought zone → short signal
- OB/OS band colors dynamically reflect SMA levels for additional confirmation.
Alerts:
- OB/OS cross alerts.
█ HOW TO USE
Add the indicator to your TradingView chart → Indicators → search for “Pivot Oscillator”.
Parameter Configuration:
- Pivot Settings: pivot length, pivot level, pivot lookback.
- ATR Settings: ATR period, scaling multipliers.
- Threshold Levels: OB/OS levels for oscillator and SMA.
- Signal Settings: SMA length, extra smoothing.
- Style Settings: bullish/bearish colors, OB/OS lines, midline, text colors.
- Gradient Settings: enable/disable gradients and transparency.
Signal Interpretation:
BUY (Long):
- Oscillator leaves the oversold zone (OS crossover).
- OB/OS band color may additionally confirm the signal when SMA < maOversold.
SELL (Short):
- Oscillator leaves the overbought zone (OB crossunder).
- OB/OS band color may additionally confirm the signal when SMA > maOverbought.
█ APPLICATIONS
Pivot Oscillator and SMA can be scaled for different strategies:
- Pullback strategies: oscillator detects local highs/lows.
- Momentum / Trend: SMA shows market-side dominance and trend direction.
Adjust pivot and ATR parameters:
- Lower settings: faster reaction, suitable for scalping or intraday trading.
- Higher settings: more stable readings, suitable for swing trading or longer timeframes.
█ NOTES
- In strong trends, the oscillator may remain in extreme zones for extended periods – reflects dominance, not necessarily a reversal.
- OB/OS levels should be adapted to the instrument and pivot/ATR settings.
- Works best when combined with other tools: support/resistance, market structure, and volume analysis.

BTC Regime Oscillator (MC + Spread) [1D]ONLY SUPPOSED TO BE USED FOR BTC PERPS, AND SPOT LEVERAGING:
This is a risk oscillator that measures whether Bitcoin’s price is supported by real capital or is running ahead of it, and converts that into a simple risk-regime oscillator.
It's built with market cap, and FDV, and Z-scores compressed to -100 <-> 100
I created this indicator because I got tired of FOMO Twitter and Wall Street games.
DO NOT USE THIS AS A BEGIN-ALL-AND-END-ALL. YOU NEED TO USE THIS AS A CONFIRMATION INDICATOR, AND ON HTF ONLY (1D>) IF YOU USE THIS ON LOWER TIMEFRAMES, YOU ARE FEEDING YOUR MONEY TO A LOW-LIFE DING BAT ON WALL STREET. HERE IS HOW IT WORKS:
This indicator is Split up by
A) Market Cap
--> Represents real money in BTC
--> Ownership capital
--> If MC is rising, money is entering BTC
B) FDV (Fully Diluted Valuation)
--> For BTC: price(21M) (21,000,000)
--> Represents the theoretical valuation
--> Since BTC really has a fixed cap, FDV mostly tracks the price
C) Oscillators
Both MC and FDV are:
--> Logged (to handle scale)
--> Normalized (Z-score)
--> Compressed to -100 <-> 100
HERE ARE THREE THINGS YOU ARE GOING TO SEE ON THE CHART
A) The market cap oscillator (MC OSC)
--> Normalized trend of real capital
RISING: Indicates capital inflow
FALLING: Indicates capital outflow
B) FDV Oscillator
--> Normalized trend of valuation pressure
ABOVE MC: Price is ahead of capital
BELOW MC: Capital is keeping up
!!!! FDV IS CONTEXT NOT SIGNALS !!!!
C) Spread = (FDV - MC)
--> The difference between valuation and capital
(THIS IS THE CORE SIGNAL)
NEGATIVE: Capital is gonna lead price
NEAR 0: Balanced
POSITIVE: Price leads capital
(THIS MEANS STRESS FOR BTC, NOT DILLUTION!)
WHAT DOES -60, 0, 60 MEAN?:
--> These are meant to serve as risk zones, not buy/sell dynamics; this is not the same as an RSI oscillator.
A) 0 level
--> Price and capital are balanced
--> No structural stress
(TRADE WITH NORMAL POSITION SIZE, AND NORMAL EXPECTATIONS)
B) Below -60 (Supportive/Compressed)
--> BTC is relatively cheap to recent history
--> Capital supports price well
(ALWAYS REMEMBER TO CONFIRM THIS WITH WHAT THE CHART IS TELLING YOU)
--> Press trends
--> Use higher ATRs
--> Pullbacks are better here
C) Above 60 (Overextension, or fragile)
--> BTC is expensive relative to recent history
--> Price is ahead of capital
(ALWAYS REMEMBER TO CONFIRM THIS WITH WHAT THE CHART IS TELLING YOU)
--> Reduce leverage, use smaller ATR
--> Use lower ATRs, TP faster
--> Do not chase breakouts
--> Expect volatility and whipsaws
"Can I press trades right now? Or do I need to hog my capital?"
CONDITIONS:
Spread Less than 0 and below -60 = Press trades
Spread near 0 = Normal trading conditions
Spread is Greater than 0 or above 60+ = Capital protection

OI Volume Oscillator Cross DynamicsThe OI Volume Oscillator Cross Dynamics is a custom indicator designed to analyze the relationship between Open Interest (OI) and Volume Oscillator in the cryptocurrency markets. This tool aims to assist traders in identifying potential market sentiment shifts, enabling them to make informed trading decisions based on the dynamic interplay of these key market components.
Key Components:
Open Interest (OI): This component represents the total number of outstanding derivative contracts, such as futures and options, that have not been settled. Open Interest provides insights into market participation and trader commitment, offering a broader perspective on the flow of money into the market.
Volume Oscillator: The Volume Oscillator is a momentum indicator that showcases the difference between two volume moving averages. It is instrumental in identifying bullish or bearish market trends by providing insights into buying and selling pressure in the market.
Functional Dynamics:
Crossover Analysis: The indicator identifies points where the Volume Oscillator crosses above or below the Open Interest, marking potential shifts in market sentiment. These crossover points are visually represented, making them easily identifiable for analysis.
Visual Cues: The indicator uses visual shapes and colors to enhance interpretability. Bullish crossovers are marked with green upward triangles, while bearish crossovers are represented by red downward triangles.
Customization: The indicator allows for customization of the Volume Oscillator’s sensitivity through a multiplier, enabling traders to adjust the indicator according to their trading strategy and market outlook.
Usage Guidelines:
Bullish Scenario: A crossover of the Volume Oscillator above the Open Interest is interpreted as a bullish signal, indicating potential upward price movement due to increased buying pressure or trading activity.
Bearish Scenario: A crossover of the Volume Oscillator below the Open Interest is seen as a bearish signal, suggesting potential downward price movement due to increased selling pressure or reduced trading activity.
Conclusion:
The OI Volume Oscillator Cross Dynamics indicator is designed to provide traders with a nuanced perspective of market activity through the combined analysis of Open Interest and Volume Oscillator. Its design aims to offer valuable insights, allowing for a strategic approach to trading based on the observed market dynamics.
The code is open source and utilizes Binance info but you can alter the code to meet your needs to go beyond just Bitcoin if needed.

Lyapunov Hodrick-Prescott Oscillator w/ DSL [Loxx]Lyapunov Hodrick-Prescott Oscillator w/ DSL is a Hodrick-Prescott Channel Filter that is modified using the Lyapunov stability algorithm to turn the filter into an oscillator. Signals are created using Discontinued Signal Lines.
What is the Lyapunov Stability?
As soon as scientists realized that the evolution of physical systems can be described in terms of mathematical equations, the stability of the various dynamical regimes was recognized as a matter of primary importance. The interest for this question was not only motivated by general curiosity, but also by the need to know, in the XIX century, to what extent the behavior of suitable mechanical devices remains unchanged, once their configuration has been perturbed. As a result, illustrious scientists such as Lagrange, Poisson, Maxwell and others deeply thought about ways of quantifying the stability both in general and specific contexts. The first exact definition of stability was given by the Russian mathematician Aleksandr Lyapunov who addressed the problem in his PhD Thesis in 1892, where he introduced two methods, the first of which is based on the linearization of the equations of motion and has originated what has later been termed Lyapunov exponents (LE). (Lyapunov 1992)
The interest in it suddenly skyrocketed during the Cold War period when the so-called "Second Method of Lyapunov" (see below) was found to be applicable to the stability of aerospace guidance systems which typically contain strong nonlinearities not treatable by other methods. A large number of publications appeared then and since in the control and systems literature. More recently the concept of the Lyapunov exponent (related to Lyapunov's First Method of discussing stability) has received wide interest in connection with chaos theory . Lyapunov stability methods have also been applied to finding equilibrium solutions in traffic assignment problems.
In practice, Lyapunov exponents can be computed by exploiting the natural tendency of an n-dimensional volume to align along the n most expanding subspace. From the expansion rate of an n-dimensional volume, one obtains the sum of the n largest Lyapunov exponents. Altogether, the procedure requires evolving n linearly independent perturbations and one is faced with the problem that all vectors tend to align along the same direction. However, as shown in the late '70s, this numerical instability can be counterbalanced by orthonormalizing the vectors with the help of the Gram-Schmidt procedure (Benettin et al. 1980, Shimada and Nagashima 1979) (or, equivalently with a QR decomposition). As a result, the LE λi, naturally ordered from the largest to the most negative one, can be computed: they are altogether referred to as the Lyapunov spectrum.
The Lyapunov exponent "λ" , is useful for distinguishing among the various types of orbits. It works for discrete as well as continuous systems.
λ < 0
The orbit attracts to a stable fixed point or stable periodic orbit. Negative Lyapunov exponents are characteristic of dissipative or non-conservative systems (the damped harmonic oscillator for instance). Such systems exhibit asymptotic stability; the more negative the exponent, the greater the stability. Superstable fixed points and superstable periodic points have a Lyapunov exponent of λ = −∞. This is something akin to a critically damped oscillator in that the system heads towards its equilibrium point as quickly as possible.
λ = 0
The orbit is a neutral fixed point (or an eventually fixed point). A Lyapunov exponent of zero indicates that the system is in some sort of steady state mode. A physical system with this exponent is conservative. Such systems exhibit Lyapunov stability. Take the case of two identical simple harmonic oscillators with different amplitudes. Because the frequency is independent of the amplitude, a phase portrait of the two oscillators would be a pair of concentric circles. The orbits in this situation would maintain a constant separation, like two flecks of dust fixed in place on a rotating record.
λ > 0
The orbit is unstable and chaotic. Nearby points, no matter how close, will diverge to any arbitrary separation. All neighborhoods in the phase space will eventually be visited. These points are said to be unstable. For a discrete system, the orbits will look like snow on a television set. This does not preclude any organization as a pattern may emerge. Thus the snow may be a bit lumpy. For a continuous system, the phase space would be a tangled sea of wavy lines like a pot of spaghetti. A physical example can be found in Brownian motion. Although the system is deterministic, there is no order to the orbit that ensues.
For our purposes here, we transform the HP by applying Lyapunov Stability as follows:
output = math.log(math.abs(HP / HP ))
You can read more about Lyapunov Stability here: Measuring Chaos
What is. the Hodrick-Prescott Filter?
The Hodrick-Prescott (HP) filter refers to a data-smoothing technique. The HP filter is commonly applied during analysis to remove short-term fluctuations associated with the business cycle. Removal of these short-term fluctuations reveals long-term trends.
The Hodrick-Prescott (HP) filter is a tool commonly used in macroeconomics. It is named after economists Robert Hodrick and Edward Prescott who first popularized this filter in economics in the 1990s. Hodrick was an economist who specialized in international finance. Prescott won the Nobel Memorial Prize, sharing it with another economist for their research in macroeconomics.
This filter determines the long-term trend of a time series by discounting the importance of short-term price fluctuations. In practice, the filter is used to smooth and detrend the Conference Board's Help Wanted Index (HWI) so it can be benchmarked against the Bureau of Labor Statistic's (BLS) JOLTS, an economic data series that may more accurately measure job vacancies in the U.S.
The HP filter is one of the most widely used tools in macroeconomic analysis. It tends to have favorable results if the noise is distributed normally, and when the analysis being conducted is historical.
What are DSL Discontinued Signal Line?
A lot of indicators are using signal lines in order to determine the trend (or some desired state of the indicator) easier. The idea of the signal line is easy : comparing the value to it's smoothed (slightly lagging) state, the idea of current momentum/state is made.
Discontinued signal line is inheriting that simple signal line idea and it is extending it : instead of having one signal line, more lines depending on the current value of the indicator.
"Signal" line is calculated the following way :
When a certain level is crossed into the desired direction, the EMA of that value is calculated for the desired signal line
When that level is crossed into the opposite direction, the previous "signal" line value is simply "inherited" and it becomes a kind of a level
This way it becomes a combination of signal lines and levels that are trying to combine both the good from both methods.
In simple terms, DSL uses the concept of a signal line and betters it by inheriting the previous signal line's value & makes it a level.
Included:
Bar coloring
Alerts
Signals
Loxx's Expanded Source Types

Uptrick: Trend SMA Oscillator### In-Depth Analysis of the "Uptrick: Trend SMA Oscillator" Indicator
---
#### Introduction to the Indicator
The "Uptrick: Trend SMA Oscillator" is an advanced yet user-friendly technical analysis tool designed to help traders across all levels of experience identify and follow market trends with precision. This indicator builds upon the fundamental principles of the Simple Moving Average (SMA), a cornerstone of technical analysis, to deliver a clear, visually intuitive overlay on the price chart. Through its strategic use of color-coding and customizable parameters, the Uptrick: Trend SMA Oscillator provides traders with actionable insights into market dynamics, enhancing their ability to make informed trading decisions.
#### Core Concepts and Methodology
1. **Foundational Principle – Simple Moving Average (SMA):**
- The Simple Moving Average (SMA) is the heart of the Uptrick: Trend SMA Oscillator. The SMA is a widely-used technical indicator that calculates the average price of an asset over a specified number of periods. By smoothing out price data, the SMA helps to reduce the noise from short-term fluctuations, providing a clearer picture of the overall trend.
- In the Uptrick: Trend SMA Oscillator, two SMAs are employed:
- **Primary SMA (oscValue):** This is applied to the closing price of the asset over a user-defined period (default is 14 periods). This SMA tracks the price closely and is sensitive to changes in market direction.
- **Smoothing SMA (oscV):** This second SMA is applied to the primary SMA, further smoothing the data and helping to filter out minor price movements that might otherwise be mistaken for trend reversals. The default period for this smoothing is 50, but it can be adjusted to suit the trader's preference.
2. **Color-Coding for Trend Visualization:**
- One of the most distinctive features of this indicator is its use of color to represent market trends. The indicator’s line changes color based on the relationship between the primary SMA and the smoothing SMA:
- **Bullish (Green):** The line turns green when the primary SMA is equal to or greater than the smoothing SMA, indicating that the market is in an upward trend.
- **Bearish (Red):** Conversely, the line turns red when the primary SMA falls below the smoothing SMA, signaling a downward trend.
- This color-coded system provides traders with an immediate, easy-to-interpret visual cue about the market’s direction, allowing for quick decision-making.
#### Detailed Explanation of Inputs
1. **Bullish Color (Default: Green #00ff00):**
- This input allows traders to customize the color that represents bullish trends on the chart. The default setting is green, a color commonly associated with upward market movement. However, traders can adjust this to any color that suits their visual preferences or matches their overall chart theme.
2. **Bearish Color (Default: Red RGB: 245, 0, 0):**
- The bearish color input determines the color of the line when the market is trending downwards. The default setting is a vivid red, signaling caution or selling opportunities. Like the bullish color, this can be customized to fit the trader’s needs.
3. **Line Thickness (Default: 5):**
- This setting controls the thickness of the line plotted by the indicator. The default thickness of 5 makes the line prominent on the chart, ensuring that the trend is easily visible even in complex or crowded chart setups. Traders can adjust the thickness to make the line thinner or thicker, depending on their visual preferences.
4. **Primary SMA Period (Value 1 - Default: 14):**
- The primary SMA period defines how many periods (e.g., days, hours) are used to calculate the moving average based on the asset’s closing prices. The default period of 14 is a balanced setting that offers a good mix of responsiveness and stability, but traders can adjust this depending on their trading style:
- **Shorter Periods (e.g., 5-10):** These make the indicator more sensitive, capturing trends more quickly but also increasing the likelihood of reacting to short-term price fluctuations or "noise."
- **Longer Periods (e.g., 20-50):** These smooth the data more, providing a more stable trend line that is less prone to whipsaws but may be slower to respond to trend changes.
5. **Smoothing SMA Period (Value 2 - Default: 50):**
- The smoothing SMA period determines how much the primary SMA is smoothed. A longer smoothing period results in a more gradual, stable line that focuses on the broader trend. The default of 50 is designed to smooth out most of the short-term fluctuations while still being responsive enough to detect significant trend shifts.
- **Customization:**
- **Shorter Smoothing Periods (e.g., 20-30):** Make the indicator more responsive, better for fast-moving markets or for traders who want to capture quick trends.
- **Longer Smoothing Periods (e.g., 70-100):** Enhance stability, ideal for long-term traders looking to avoid reacting to minor price movements.
#### Unique Characteristics and Advantages
1. **Simplicity and Clarity:**
- The Uptrick: Trend SMA Oscillator’s design prioritizes simplicity without sacrificing effectiveness. By relying on the widely understood SMA, it avoids the complexity of more esoteric indicators while still providing reliable trend signals. This simplicity makes it accessible to traders of all levels, from novices who are just learning about technical analysis to experienced traders looking for a straightforward, dependable tool.
2. **Visual Feedback Mechanism:**
- The indicator’s use of color to signify market trends is a particularly powerful feature. This visual feedback mechanism allows traders to assess market conditions at a glance. The clarity of the green and red color scheme reduces the mental effort required to interpret the indicator, freeing the trader to focus on strategy execution.
3. **Adaptability Across Markets and Timeframes:**
- One of the strengths of the Uptrick: Trend SMA Oscillator is its versatility. The basic principles of moving averages apply equally well across different asset classes and timeframes. Whether trading stocks, forex, commodities, or cryptocurrencies, traders can use this indicator to gain insights into market trends.
- **Intraday Trading:** For day traders who operate on short timeframes (e.g., 1-minute, 5-minute charts), the oscillator can be adjusted to be more responsive, capturing quick shifts in momentum.
- **Swing Trading:** Swing traders, who typically hold positions for several days to weeks, will find the default settings or slightly adjusted periods ideal for identifying and riding medium-term trends.
- **Long-Term Trading:** Position traders and investors can adjust the indicator to focus on long-term trends by increasing the periods for both the primary and smoothing SMAs, filtering out minor fluctuations and highlighting sustained market movements.
4. **Minimal Lag:**
- One of the challenges with moving averages is lag—the delay between when the price changes and when the indicator reflects this change. The Uptrick: Trend SMA Oscillator addresses this by allowing traders to adjust the periods to find a balance between responsiveness and stability. While all SMAs inherently have some lag, the customizable nature of this indicator helps traders mitigate this effect to align with their specific trading goals.
5. **Customizable and Intuitive:**
- While many technical indicators come with a fixed set of parameters, the Uptrick: Trend SMA Oscillator is fully customizable, allowing traders to tailor it to their trading style, market conditions, and personal preferences. This makes it a highly flexible tool that can be adjusted as markets evolve or as a trader’s strategy changes over time.
#### Practical Applications for Different Trader Profiles
1. **Day Traders:**
- **Use Case:** Day traders can customize the SMA periods to create a faster, more responsive indicator. This allows them to capture short-term trends and make quick decisions. For example, reducing the primary SMA to 5 and the smoothing SMA to 20 can help day traders react promptly to intraday price movements.
- **Strategy Integration:** Day traders might use the Uptrick: Trend SMA Oscillator in conjunction with volume-based indicators to confirm the strength of a trend before entering or exiting trades.
2. **Swing Traders:**
- **Use Case:** Swing traders can use the default settings or slightly adjust them to smooth out minor price fluctuations while still capturing medium-term trends. This approach helps in identifying the optimal points to enter or exit trades based on the broader market direction.
- **Strategy Integration:** Swing traders can combine this indicator with oscillators like the Relative Strength Index (RSI) to confirm overbought or oversold conditions, thereby refining their entry and exit strategies.
3. **Position Traders:**
- **Use Case:** Position traders, who hold trades for extended periods, can extend the SMA periods to focus on long-term trends. By doing so, they minimize the impact of short-term market noise and focus on the underlying trend.
- **Strategy Integration:** Position traders might use the Uptrick: Trend SMA Oscillator in combination with fundamental analysis. The indicator can help confirm the timing of entries and exits based on broader economic or corporate developments.
4. **Algorithmic and Quantitative Traders:**
- **Use Case:** The simplicity and clear logic of the Uptrick: Trend SMA Oscillator make it an excellent candidate for algorithmic trading strategies. Its binary output—bullish or bearish—can be easily coded into automated trading systems.
- **Strategy Integration:** Quant traders might use the indicator as part of a larger trading system that incorporates multiple indicators and rules, optimizing the SMA periods based on historical backtesting to achieve the best results.
5. **Novice Traders:**
- **Use Case:** Beginners can use the Uptrick: Trend SMA Oscillator to learn the basics of trend-following strategies.
The visual simplicity of the color-coded line helps novice traders quickly understand market direction without the need to interpret complex data.
- **Educational Value:** The indicator serves as an excellent starting point for those new to technical analysis, providing a practical example of how moving averages work in a real-world trading environment.
#### Combining the Indicator with Other Tools
1. **Relative Strength Index (RSI):**
- The RSI is a momentum oscillator that measures the speed and change of price movements. When combined with the Uptrick: Trend SMA Oscillator, traders can look for instances where the RSI shows divergence from the price while the oscillator confirms the trend. This can be a powerful signal of an impending reversal or continuation.
2. **Moving Average Convergence Divergence (MACD):**
- The MACD is another popular trend-following momentum indicator. By using it alongside the Uptrick: Trend SMA Oscillator, traders can confirm the strength of a trend and identify potential entry and exit points with greater confidence. For example, a bullish crossover on the MACD that coincides with the Uptrick: Trend SMA Oscillator turning green can be a strong buy signal.
3. **Volume Indicators:**
- Volume is often considered the fuel behind price movements. Using volume indicators like the On-Balance Volume (OBV) or Volume Weighted Average Price (VWAP) in conjunction with the Uptrick: Trend SMA Oscillator can help traders confirm the validity of a trend. A trend identified by the oscillator that is supported by increasing volume is typically more reliable.
4. **Fibonacci Retracement:**
- Fibonacci retracement levels are used to identify potential reversal levels in a trending market. When the Uptrick: Trend SMA Oscillator indicates a trend, traders can use Fibonacci retracement levels to find potential entry points that align with the broader trend direction.
#### Implementation in Different Market Conditions
1. **Trending Markets:**
- The Uptrick: Trend SMA Oscillator excels in trending markets, where it provides clear signals on the direction of the trend. In a strong uptrend, the line will remain green, helping traders stay in the trade for longer periods. In a downtrend, the red line will signal the continuation of bearish conditions, prompting traders to stay short or avoid long positions.
2. **Sideways or Range-Bound Markets:**
- In range-bound markets, where price oscillates within a confined range without a clear trend, the Uptrick: Trend SMA Oscillator may produce more frequent changes in color. While this could indicate potential reversals at the range boundaries, traders should be cautious of false signals. It may be beneficial to pair the oscillator with a volatility indicator to better navigate such conditions.
3. **Volatile Markets:**
- In highly volatile markets, where prices can swing rapidly, the sensitivity of the Uptrick: Trend SMA Oscillator can be adjusted by modifying the SMA periods. A shorter SMA period might capture quick trends, but traders should be aware of the increased risk of whipsaws. Combining the oscillator with a volatility filter or using it in a higher time frame might help mitigate some of this risk.
#### Final Thoughts
The "Uptrick: Trend SMA Oscillator" is a versatile, easy-to-use indicator that stands out for its simplicity, visual clarity, and adaptability. It provides traders with a straightforward method to identify and follow market trends, using the well-established concept of moving averages. The indicator’s customizable nature makes it suitable for a wide range of trading styles, from day trading to long-term investing, and across various asset classes.
By offering immediate visual feedback through color-coded signals, the Uptrick: Trend SMA Oscillator simplifies the decision-making process, allowing traders to focus on execution rather than interpretation. Whether used on its own or as part of a broader technical analysis toolkit, this indicator has the potential to enhance trading strategies and improve overall performance.
Its accessibility and ease of use make it particularly appealing to novice traders, while its adaptability and reliability ensure that it remains a valuable tool for more experienced market participants. As markets continue to evolve, the Uptrick: Trend SMA Oscillator remains a timeless tool, rooted in the fundamental principles of technical analysis, yet flexible enough to meet the demands of modern trading.

Smart Money Oscillator [ChartPrime]The "Smart Money Oscillator " is a premium and discount zone oscillator with BOS and CHoCH built in for further analysis of price action. This indicator works by first determining the the premium and discount zones by using pivot points and high/lows. The top of this oscillator represents the current premium zone while the bottom half of this oscillator represents the discount zone. This oscillator functionally works like a stochastic oscillator with more sophisticated upper and lower bounds generated using smart money concept theories. We have included a moving average to allow the user to visualize the currant momentum in the oscillator. Another key feature we have included lagging divergences to help traders visualize potential reversal conditions.
Understanding the concepts of Premium and Discount zones, as well as Break of Structure (BoS) and Change of Character (CHoCH), is crucial for traders using the Smart Money Oscillator. These concepts are rooted in market structure analysis, which involves studying price levels and movements.
Premium Zone is where the price is considered to be relatively high or 'overbought'. In this zone, prices have risen significantly and may indicate that the asset is becoming overvalued, potentially leading to a reversal or slowdown in the upward trend.
The Discount Zone represents a 'discount' or 'oversold' area. Here, prices have fallen substantially, suggesting that the asset might be undervalued. This could be an indicator of a potential upward reversal or a pause in the downward trend.
Break of Structure (BoS) is about the continuation of a trend. In a bullish trend, a BoS is identified by the break of a recent higher high. In a bearish trend, it's the break of a recent Lower Low. BoS indicates that the trend is strong and likely to continue in its current direction. It's a sign of strength in the prevailing trend, whether up or down.
Change of Character (CHoCH) is an indication of a potential end to a trend. It occurs when there's a significant change in the market's behavior, contradicting the current trend. For example, in an uptrend characterized by higher highs and higher lows, a CHoCH may occur if a new high is formed but then is followed by an impulsive move downwards. This suggests that the bullish trend may be weakening and a bearish reversal could be imminent. CHoCH is essentially a sign of trend exhaustion and potential reversal.
With each consecutive BoS, the signal line of the oscillator will deepen in color. This allows you to visually see the strength of the current trend. The maximum strength of the trend is found by keeping track of the maximum number of consecutive BoS's within a window of 10. This calculation excludes periods without any BoS's to allow for a more stable max.
Quick Update is a feature that implements a more aggressive algorithm to update the highs and lows. Instead of updating the pivot points exclusively to update the range levels, it will attempt to use the current historical highs/lows to update the bounds. This results in a more responsive range at the cost of stability. There are pros and cons for both settings. With Quick Update disabled, the indicator will allow for strong reversals to register without the indicator maxing out. With Quick Update enabled, the indicator will show shorter term extremes with the risk of the signal being pinned to the extremities during strong trends or large movements. With Quick Update disabled, the oscillator prioritizes stability, using a more historical perspective to set its bounds. When Quick Update is enabled, the oscillator becomes more responsive, adjusting its bounds rapidly to reflect the latest market movements.
The Scale Offset feature allows the indicator to break the boundaries of the oscillator. This can be useful when the market is breaking highs or lows allowing the user to identify extremities in price. With Scale Offset disabled the oscillator will always remain inside of the boundaries because the extremities will be updated instantly. When this feature is enabled it will update the boundaries one step behind instead of updating it instantly. This allows the user to more easily see overbought and oversold conditions at the cost of incurring a single bar lag to the boundaries. Generally this is a good idea as this behavior makes the oscillator more sensitive to recent price spikes or drops, reflecting sudden market movements more accurately. It accentuates the extremities of the market conditions, potentially offering a more aggressive analysis. The main trade-off with the Scale Offset feature is between sensitivity and potential overreaction. It offers a more immediate and exaggerated reflection of market conditions but might also lead to misinterpretations in certain scenarios, especially in highly volatile markets.
Divergence is used to predict potential trend reversals. It occurs when the price of an asset and the reading of an oscillator move in opposite directions. This discrepancy can signal a weakening of the current trend and possibly indicate a potential reversal.
Divergence doesn't always lead to a trend reversal, but it's a warning sign that the current trend might be weakening. Divergence can sometimes give false signals, particularly in strongly trending markets where the oscillator may remain in overbought or oversold conditions for extended periods. The lagging nature of using pivot points to calculate divergences means that all divergences are limited by the pivot look forward input. The upside of using a longer look forward is that the divergences will be more accurate. The obvious con here is that it will be more delayed and might be useless by the time it appears. Its recommended to use the built in divergences as a way to learn how these are formed so you can make your own in real time.
By default, the oscillator uses a smoothing of 3 to allow for a more price like behavior while still being rather smooth compared to raw price data. Conversely, you can increase this value to make this indicator behave smoother. Something to keep in mind is that the amount of delay from real time is equal to half of the smoothing period.
We have included a verity of alerts in this indicator. Here is a list of all of the available alerts: Bullish BOS, Bearish BOS, Bullish CHoCH, Bearish CHoCH, Bullish Divergence, Hidden Bullish Divergence, Bearish Divergence, Hidden Bearish Divergence, Cross Over Average, Cross Under Average.
Below are all of the inputs and their tooltips to get you started:
Settings:
Smoothing: Specifies the degree of smoothing applied to the oscillator. Higher values result in smoother but potentially less responsive signals.
Average Length: Sets the length of the moving average applied to the oscillator, affecting its sensitivity and smoothness.
Pivot Length: Specifies the forward-looking length for pivot points, affecting how the oscillator anticipates future price movements. This directly impacts the delay in finding a pivot.
Max Length: Sets the maximum length to consider for calculating the highest values in the oscillator.
Min Length: Defines the minimum length for calculating the lowest values in the oscillator.
Quick Update: Activates a faster update mode for the oscillator's extremities, which may result in less stable range boundaries.
Scale Offset: When enabled, delays updating minimum and maximum values to enhance signal directionality, allowing the signal to occasionally exceed normal bounds.
Candle Color: Enables coloring of candles based on the current directional signal of the oscillator.
Labels:
Enable BOS/CHoCH Labels: Activates the display of BOS (Break of Structure) and CHoCH (Change of Character) labels on the chart.
Visual Padding: Turns on additional visual padding at the top and bottom of the chart to accommodate labels. Determines the amount of visual padding added to the chart for label display.
Divergence:
Divergence Pivot: Defines the number of bars to the right of the pivot in divergence calculations, influencing the oscillator's responsiveness.
Divergence Pivot Forward: Directly impacts latency. Longer periods results in more accurate results at the sacrifice of delay.
Upper Range: Sets the upper range limit for divergence calculations, influencing the oscillator's sensitivity to larger trends.
Lower Range: Determines the lower range limit for divergence calculations, affecting the oscillator's sensitivity to shorter trends.
Symbol: Allows selection of the label style for divergence indicators, with options for text or symbolic representation.
Regular Bullish: Activates the detection and marking of regular bullish divergences in the oscillator.
Hidden Bullish: Enables the identification and display of hidden bullish divergences.
Regular Bearish: Turns on the feature to detect and highlight regular bearish divergences.
Hidden Bearish: Activates the functionality for detecting and displaying hidden bearish divergences.
Color:
Bullish: Determines the minimum/maximum color gradient for bullish signals, impacting the chart's visual appearance.
Bearish: Defines the minimum/maximum color gradient for bearish signals, affecting their visual representation.
Average: Specifies the color for the average line of the oscillator, enhancing chart readability.
CHoCH: Sets the color for bullish/bearish CHoCH (Change of Character) signals.
Premium/Discount: Determines the color for the premium/discount zone in the oscillator's visual representation.
Text Color: Sets the color for the text in BoS/CHoCH labels.
Regular Bullish: Defines the color used to represent regular bullish divergences.
Hidden Bullish: Specifies the color for hidden bullish divergences.
Regular Bearish: Determines the color for hidden bearish divergences.
Divergence Text Color: Specifies the color for the text in divergence labels.

Momentum Probability Oscillator [SS]This is the momentum based probability indicator.
What it does?
This takes the average of MFI, Stochastics and RSI and plots it out as an independent oscillator.
It then tracks bullish vs bearish instances. Bullish is defined as a greater move from open to high than open to low and inverse for bearish.
It stores this data and these averages and plots these levels as a graph.
The graph depicts the max bullish values at the top, the min bearish values at the bottom and the averages in between:
It will plot the average "threshold" value in yellow:
The threshold value is key. A ticker trading above the threshold is generally bullish. Below is bearish.
The threshold value frequently acts as support and resistance levels (see below):
Resistance:
Support:
The indicator also shows you the amount of time a ticker has spent in each region, over a defined lookback period (defaulted to 500):
When you see that cumulatively, more time has been spent in a bullish range or a bearish range, it can help you ascertain the prevailing sentiment at that time.
The indicator will also calculate the average price range based on the underlying oscillator value. It does this through use of ATR based techniques, as its not usually possible to calculate a price from an oscillator:
This is intended as a general reference and not a precise target, as it is using ATR as opposed to the actual technical value itself.
As this is an oscillator, you can use it to look for divergences as well. The advantage to having it formulated in this way is:
a) You get the power of all 3 indicators (stochastics, MFI and RSI) in one and
b) You are adding context to the underlying technical reading. The indicator is plotting out the average, max and min ranges for the selected ticker and performing assessments based on these ranges that add context to the current PA.
You also have the ability to see the specific technical levels associated with each specific technical indicator. If you open up the settings menu and select "Show Table", this will appear:
This will show you the exact values of each of the technicals the indicator is using in its range assessment.
And that is basically the bulk of the indicator!
I use this predominately on the smaller timeframes, especially when there is a lot of chop, to ascertain the overall sentiment.
I also will reference it on the 1 hour to see what the prevailing sentiment is and whether the stock is at an area of technical resistance or support. For example, here is what I referenced on SPY today:
QUICK NOTE:
It works best with RTH (regular trading hours) turned on and ETH (extended trading hours) turned off!
That's it!
Hopefully you like it and leave your comments and suggestions below!

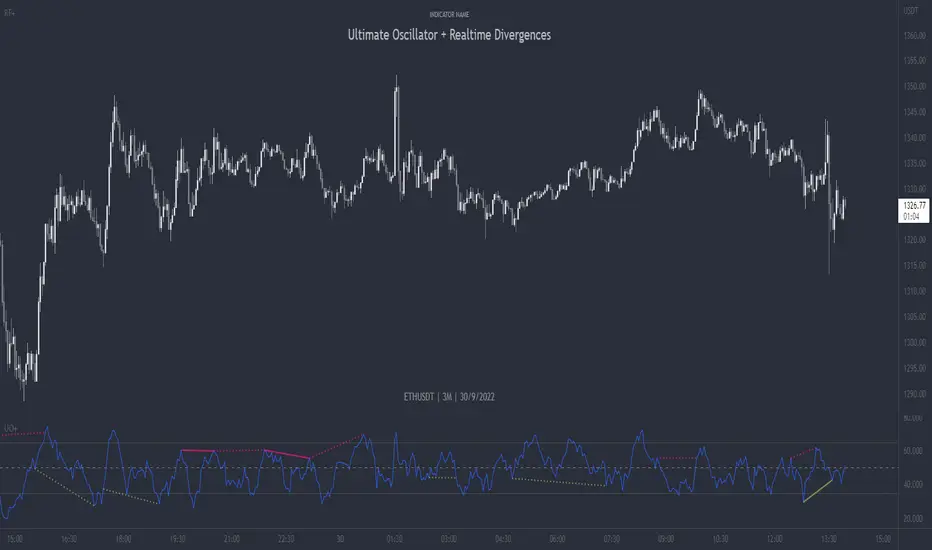
Ultimate Oscillator + Realtime DivergencesUltimate Oscillator (UO) + Realtime Divergences + Alerts + Lookback periods.
This version of the Ultimate Oscillator adds the following 5 additional features to the stock UO by Tradingview:
- Optional divergence lines drawn directly onto the oscillator in realtime
- Configurable alerts to notify you when divergences occur, as well as centerline crossovers.
- Configurable lookback periods to fine tune the divergences drawn in order to suit different trading styles and timeframes.
- Background colouring option to indicate when the UO has crossed the centerline, or optionally when both the UO and an external oscillator, which can be linked via the settings, have both crossed their centerlines.
- Alternate timeframe feature allows you to configure the oscillator to use data from a different timeframe than the chart it is loaded on.
This indicator adds additional features onto the stock Ultimate Oscillator by Tradingview, whose core calculations remain unchanged. Namely the configurable option to automatically and clearly draw divergence lines onto the oscillator for you as they occur in realtime. It also has the addition of unique alerts, so you can be notified as divergences occur without spending all day watching the charts. Furthermore, this version of the Ultimate Oscillator comes with configurable lookback periods, which can be configured in order to adjust the length of the divergences, in order to suit shorter or higher timeframe trading approaches.
The Ultimate Oscillator
Tradingview describes the Ultimate Oscillator as follows:
“The Ultimate Oscillator indicator (UO) indicator is a technical analysis tool used to measure momentum across three varying timeframes. The problem with many momentum oscillators is that after a rapid advance or decline in price, they can form false divergence trading signals. For example, after a rapid rise in price, a bearish divergence signal may present itself, however price continues to rise. The ultimate Oscillator attempts to correct this by using multiple timeframes in its calculation as opposed to just one timeframe which is what is used in most other momentum oscillators.”
More information on the history, use cases and calculations of the Ultimate Oscillator can be found here: www.tradingview.com
What are divergences?
Divergence is when the price of an asset is moving in the opposite direction of a technical indicator, such as an oscillator, or is moving contrary to other data. Divergence warns that the current price trend may be weakening, and in some cases may lead to the price changing direction.
There are 4 main types of divergence, which are split into 2 categories;
regular divergences and hidden divergences. Regular divergences indicate possible trend reversals, and hidden divergences indicate possible trend continuation.
Regular bullish divergence: An indication of a potential trend reversal, from the current downtrend, to an uptrend.
Regular bearish divergence: An indication of a potential trend reversal, from the current uptrend, to a downtrend.
Hidden bullish divergence: An indication of a potential uptrend continuation.
Hidden bearish divergence: An indication of a potential downtrend continuation.
Setting alerts.
With this indicator you can set alerts to notify you when any/all of the above types of divergences occur, on any chart timeframe you choose.
Configurable lookback values.
You can adjust the default lookback values to suit your prefered trading style and timeframe. If you like to trade a shorter time frame, lowering the default lookback values will make the divergences drawn more sensitive to short term price action.
How do traders use divergences in their trading?
A divergence is considered a leading indicator in technical analysis , meaning it has the ability to indicate a potential price move in the short term future.
Hidden bullish and hidden bearish divergences, which indicate a potential continuation of the current trend are sometimes considered a good place for traders to begin, since trend continuation occurs more frequently than reversals, or trend changes.
When trading regular bullish divergences and regular bearish divergences, which are indications of a trend reversal, the probability of it doing so may increase when these occur at a strong support or resistance level . A common mistake new traders make is to get into a regular divergence trade too early, assuming it will immediately reverse, but these can continue to form for some time before the trend eventually changes, by using forms of support or resistance as an added confluence, such as when price reaches a moving average, the success rate when trading these patterns may increase.
Typically, traders will manually draw lines across the swing highs and swing lows of both the price chart and the oscillator to see whether they appear to present a divergence, this indicator will draw them for you, quickly and clearly, and can notify you when they occur.
Disclaimer: This script includes code from the stock UO by Tradingview as well as the Divergence for Many Indicators v4 by LonesomeTheBlue.
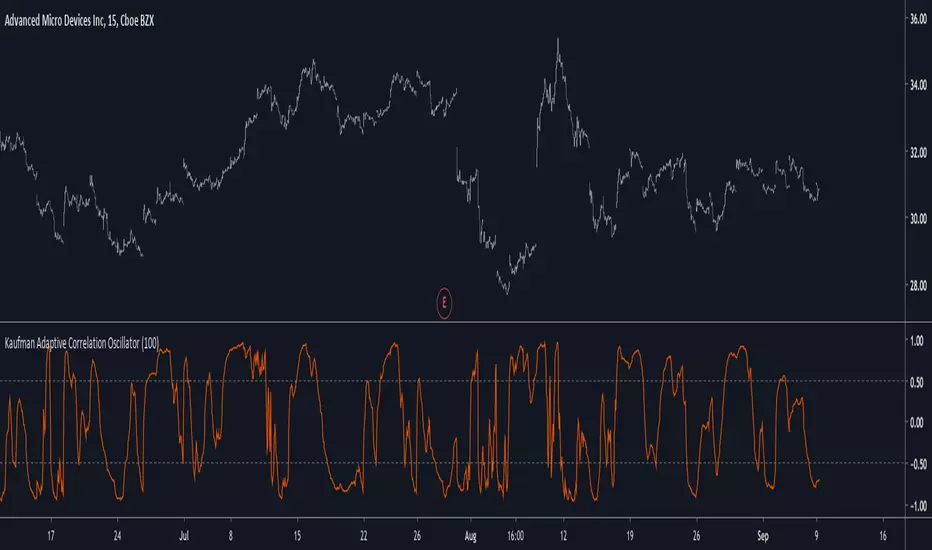
Kaufman Adaptive Correlation OscillatorIntroduction
The correlation oscillator is a technical indicator that measure the linear relationship between the market closing price and a simple increasing line, the indicator is in a (-1,1) range and rise when price is up-trending and fall when price is down-trending. Another characteristic of the indicator is its inherent smoothing which provide a noise free (to some extent) oscillator.
Such indicator use simple moving averages as well as estimates of the standard deviation for its calculation, but we can easily make it adaptive, this is why i propose this new technical indicator that create an adaptive correlation oscillator based on the Kaufman adaptive moving average.
The Indicator
The length parameter control the period window of the moving average, larger periods return smoother results while having a low kurtosis, which mean that values will remain around 1 or -1 a longer period of time. Pre-filtering apply a Kaufman adaptive moving average to the input, which allow for a smoother output.
No pre-filtering in orange, pre-filtering in yellow, period = 100 for both oscillators.
If you are not aware of the Kaufman adaptive moving average, such moving average return more reactive results when price is trending and smoother results when price is ranging, this also apply for the proposed indicator.
Conclusion
Classical correlation coefficients could use this approach, therefore the linear relationships between any variables could be measured. The fact that the indicator is adaptive add a certain potential, however such combination make the indicator have the drawback of kama + the correlation oscillator, which might appear at certain points.
Thanks for reading !
Fine-tune Inputs: Fourier Smoothed Volume zone oscillator WFSVZ0Use this Strategy to Fine-tune inputs for the (W&)FSVZ0 Indicator.
Strategy allows you to fine-tune the indicator for 1 TimeFrame at a time; cross Timeframe Input fine-tuning is done manually after exporting the chart data.
I suggest using "Close all" input False when fine-tuning Inputs for 1 TimeFrame. When you export data to Excel/Numbers/GSheets I suggest using "Close all" input as True, except for the lowest TimeFrame.
MEANINGFUL DESCRIPTION:
The Volume Zone oscillator breaks up volume activity into positive and negative categories. It is positive when the current closing price is greater than the prior closing price and negative when it's lower than the prior closing price. The resulting curve plots through relative percentage levels that yield a series of buy and sell signals, depending on level and indicator direction.
The Wavelet & Fourier Smoothed Volume Zone Oscillator (W&)FSVZO is a refined version of the Volume Zone Oscillator, enhanced by the implementation of the Discrete Fourier Transform . Its primary function is to streamline price data and diminish market noise, thus offering a clearer and more precise reflection of price trends.
By combining the Wavalet and Fourier aproximation with Ehler's white noise histogram, users gain a comprehensive perspective on volume-related market conditions.
HOW TO USE THE INDICATOR:
The default period is 2 but can be adjusted after backtesting. (I suggest 5 VZO length and NoiceR max length 8 as-well)
The VZO points to a positive trend when it is rising above the 0% level, and a negative trend when it is falling below the 0% level. 0% level can be adjusted in setting by adjusting VzoDifference. Oscillations rising below 0% level or falling above 0% level result in a natural trend.
HOW TO USE THE STRATEGY:
Here you fine-tune the inputs until you find a combination that works well on all Timeframes you will use when creating your Automated Trade Algorithmic Strategy. I suggest 4h, 12h, 1D, 2D, 3D, 4D, 5D, 6D, W and M.
When I ndicator/Strategy returns 0 or natural trend , Strategy Closes All it's positions.
ORIGINALITY & USFULLNESS:
Personal combination of Fourier and Wavalet aproximation of a price which results in less noise Volume Zone Oscillator.
The Wavelet Transform is a powerful mathematical tool for signal analysis, particularly effective in analyzing signals with varying frequency or non-stationary characteristics. It dissects a signal into wavelets, small waves with varying frequency and limited duration, providing a multi-resolution analysis. This approach captures both frequency and location information, making it especially useful for detecting changes or anomalies in complex signals.
The Discrete Fourier Transform (DFT) is a mathematical technique that transforms discrete data from the time domain into its corresponding representation in the frequency domain. This process involves breaking down a signal into its individual frequency components, thereby exposing the amplitude and phase characteristics inherent in each frequency element.
This indicator utilizes the concept of Ehler's Universal Oscillator and displays a histogram, offering critical insights into the prevailing levels of market noise. The Ehler's Universal Oscillator is grounded in a statistical model that captures the erratic and unpredictable nature of market movements. Through the application of this principle, the histogram aids traders in pinpointing times when market volatility is either rising or subsiding.
DETAILED DESCRIPTION:
My detailed description of the indicator and use cases which I find very valuable.
What is oscillator?
Oscillators are chart indicators that can assist a trader in determining overbought or oversold conditions in ranging (non-trending) markets.
What is volume zone oscillator?
Price Zone Oscillator measures if the most recent closing price is above or below the preceding closing price.
Volume Zone Oscillator is Volume multiplied by the 1 or -1 depending on the difference of the preceding 2 close prices and smoothed with Exponential moving Average.
What does this mean?
If the VZO is above 0 and VZO is rising. We have a bullish trend. Most likely.
If the VZO is below 0 and VZO is falling. We have a bearish trend. Most likely.
Rising means that VZO on close is higher than the previous day.
Falling means that VZO on close is lower than the previous day.
What if VZO is falling above 0 line?
It means we have a high probability of a bearish trend.
Thus the indicator returns 0 and Strategy closes all it's positions when falling above 0 (or rising bellow 0) and we combine higher and lower timeframes to gauge the trend.
In the next Image you can see that trend is negative on 4h, negative on 12h and positive on 1D. That means trend is negative.
I am sorry, the chart is a bit messy. The idea is to use the indicator over more than 1 Timeframe.
What is approximation and smoothing?
They are mathematical concepts for making a discrete set of numbers a
continuous curved line.
Fourier and Wavelet approximation of a close price are taken from aprox library.
Key Features:
You can tailor the Indicator/Strategy to your preferences with adjustable parameters such as VZO length, noise reduction settings, and smoothing length.
Volume Zone Oscillator (VZO) shows market sentiment with the VZO, enhanced with Exponential Moving Average (EMA) smoothing for clearer trend identification.
Noise Reduction leverages Euler's White noise capabilities for effective noise reduction in the VZO, providing a cleaner and more accurate representation of market dynamics.
Choose between the traditional Fast Fourier Transform (FFT) , the innovative Double Discrete Fourier Transform (DTF32) and Wavelet soothed Fourier soothed price series to suit your analytical needs.
Image of Wavelet transform with FAST settings, Double Fourier transform with FAST settings. Improved noice reduction with SLOW settings, and standard FSVZO with SLOW settings:
Fast setting are setting by default:
VZO length = 2
NoiceR max Length = 2
Slow settings are:
VZO length = 5 or 7
NoiceR max Length = 8
As you can see fast setting are more volatile. I suggest averaging fast setting on 4h 12h 1d 2d 3d 4d W and M Timeframe to get a clear view on market trend.
What if I want long only when VZO is rising and above 15 not 0?
You have set Setting VzoDifference to 15. That reduces the number of trend changes.
Example of W&FSVZO with VzoDifference 15 than 0:
VZO crossed 0 line but not 15 line and that's why Indicator returns 0 in one case an 1 in another.
What is Smooth length setting?
A way of calculating Bullish or Bearish (W&)FSVZO .
If smooth length is 2 the trend is rising if:
rising = VZO > ta.ema(VZO, 2)
Meaning that we check if VZO is higher that exponential average of the last 2 elements.
If smooth length is 1 the trend is rising if:
rising = VZO_ > VZO_
Use this Strategy to fine-tune inputs for the (W&)FSVZO Indicator.
(Strategy allows you to fine-tune the indicator for 1 TimeFrame at a time; cross Timeframe Input fine-tuning is done manually after exporting the chart data)
I suggest using " Close all " input False when fine-tuning Inputs for 1 TimeFrame . When you export data to Excel/Numbers/GSheets I suggest using " Close all " input as True , except for the lowest TimeFrame . I suggest using 100% equity as your default quantity for fine-tune purposes. I have to mention that 100% equity may lead to unrealistic backtesting results. Be avare. When backtesting for trading purposes use Contracts or USDT.

Wavelet & Fourier Smoothed Volume zone oscillator (W&)FSVZO Indicator id:
USER;e7a774913c1242c3b1354334a8ea0f3c
(only relevant to those that use API requests)
MEANINGFUL DESCRIPTION:
The Volume Zone oscillator breaks up volume activity into positive and negative categories. It is positive when the current closing price is greater than the prior closing price and negative when it's lower than the prior closing price. The resulting curve plots through relative percentage levels that yield a series of buy and sell signals, depending on level and indicator direction.
The Wavelet & Fourier Smoothed Volume Zone Oscillator (W&)FSVZO is a refined version of the Volume Zone Oscillator, enhanced by the implementation of the Discrete Fourier Transform. Its primary function is to streamline price data and diminish market noise, thus offering a clearer and more precise reflection of price trends.
By combining the Wavalet and Fourier aproximation with Ehler's white noise histogram, users gain a comprehensive perspective on volume-related market conditions.
HOW TO USE THE INDICATOR:
The default period is 2 but can be adjusted after backtesting. (I suggest 5 VZO length and NoiceR max length 8 as-well)
The VZO points to a positive trend when it is rising above the 0% level, and a negative trend when it is falling below the 0% level. 0% level can be adjusted in setting by adjusting VzoDifference. Oscillations rising below 0% level or falling above 0% level result in natural trend.
ORIGINALITY & USFULLNESS:
Personal combination of Fourier and Wavalet aproximation of a price which results in less noise Volume Zone Oscillator.
The Wavelet Transform is a powerful mathematical tool for signal analysis, particularly effective in analyzing signals with varying frequency or non-stationary characteristics. It dissects a signal into wavelets, small waves with varying frequency and limited duration, providing a multi-resolution analysis. This approach captures both frequency and location information, making it especially useful for detecting changes or anomalies in complex signals.
The Discrete Fourier Transform (DFT) is a mathematical technique that transforms discrete data from the time domain into its corresponding representation in the frequency domain. This process involves breaking down a signal into its individual frequency components, thereby exposing the amplitude and phase characteristics inherent in each frequency element.
This indicator utilizes the concept of Ehler's Universal Oscillator and displays a histogram, offering critical insights into the prevailing levels of market noise. The Ehler's Universal Oscillator is grounded in a statistical model that captures the erratic and unpredictable nature of market movements. Through the application of this principle, the histogram aids traders in pinpointing times when market volatility is either rising or subsiding.
DETAILED DESCRIPTION:
My detailed description of the indicator and use cases which I find very valuable.
What is oscillator?
Oscillators are chart indicators that can assist a trader in determining overbought or oversold conditions in ranging (non-trending) markets.
What is volume zone oscillator?
Price Zone Oscillator measures if the most recent closing price is above or below the preceding closing price.
Volume Zone Oscillator is Volume multiplied by the 1 or -1 depending on the difference of the preceding 2 close prices and smoothed with Exponential moving Average.
What does this mean?
If the VZO is above 0 and VZO is rising. We have a bullish trend. Most likely.
If the VZO is below 0 and VZO is falling. We have a bearish trend. Most likely.
Rising means that VZO on close is higher than the previous day.
Falling means that VZO on close is lower than the previous day.
What if VZO is falling above 0 line?
It means we have a high probability of a bearish trend.
Thus the indicator returns 0 when falling above 0 (or rising bellow 0) and we combine higher and lower timeframes to gauge the trend.
In the next Image you can see that trend is positive on 4h, neutral on 12h and positive on 1D. That means trend is positive.
I am sorry, the chart is a bit messy. The idea is to use the indicator over more than 1 Timeframe.
What is approximation and smoothing?
They are mathematical concepts for making a discrete set of numbers a
continuous curved line.
Fourier and Wavelet approximation of a close price are taken from aprox library.
Key Features:
You can tailor the indicator to your preferences with adjustable parameters such as VZO length, noise reduction settings, and smoothing length.
Volume Zone Oscillator (VZO) shows market sentiment with the VZO, enhanced with Exponential Moving Average (EMA) smoothing for clearer trend identification.
Noise Reduction leverages Euler's White noise capabilities for effective noise reduction in the VZO, providing a cleaner and more accurate representation of market dynamics.
Choose between the traditional Fast Fourier Transform (FFT), the innovative Double Discrete Fourier Transform (DTF32) and Wavelet soothed Fourier soothed price series to suit your analytical needs.
Image of Wavelet transform with FAST settings, Double Fourier transform with FAST settings. Improved noice reduction with SLOW settings, and standard FSVZO with SLOW settings:
Fast setting are setting by default:
VZO length = 2
NoiceR max Length = 2
Slow settings are:
VZO length = 5 or 7
NoiceR max Length = 8
As you can see fast setting are more volatile. I suggest averaging fast setting on 4h 12h 1d 2d 3d 4d W and M Timeframe to get a clear view on market trend.
What if I want long only when VZO is rising and above 15 not 0?
You have set Setting VzoDifference to 15. That reduces the number of trend changes.
Example of W&FSVZO with VzoDifference 15 than 0:
VZO crossed 0 line but not 15 line and that's why Indicator returns 0 in one case an 1 in another.
What is Smooth length setting?
A way of calculating Bullish or Bearish FSVZO.
If smooth length is 2 the trend is rising if:
rising = VZO > ta.ema(VZO, 2)
Meaning that we check if VZO is higher that exponential average of the last 2 elements.
If smooth length is 1 the trend is rising if:
rising = VZO_ > VZO_
Rising is boolean value, meaning TRUE if rising and FALSE if falling.
Mathematical equations presented in Pinescript:
Fourier of the real (x axis) discrete:
x_0 = array.get(x, 0) + array.get(x, 1) + array.get(x, 2)
x_1 = array.get(x, 0) + array.get(x, 1) * math.cos( -2 * math.pi * _dir / 3 ) - array.get(y, 1) * math.sin( -2 * math.pi * _dir / 3 ) + array.get(x, 2) * math.cos( -4 * math.pi * _dir / 3 ) - array.get(y, 2) * math.sin( -4 * math.pi * _dir / 3 )
x_2 = array.get(x, 0) + array.get(x, 1) * math.cos( -4 * math.pi * _dir / 3 ) - array.get(y, 1) * math.sin( -4 * math.pi * _dir / 3 ) + array.get(x, 2) * math.cos( -8 * math.pi * _dir / 3 ) - array.get(y, 2) * math.sin( -8 * math.pi * _dir / 3 )
Euler's Noice reduction with both close and Discrete Furrier approximated price.
w = (dft1*src - dft1 *src ) / math.sqrt(math.pow(math.abs(src- src ),2) + math.pow(math.abs(dft1 - dft1 ),2))
filt := na(filt ) ? 0 : c1 * (w*dft1 + nz(w *dft1 )) / 2.0 /math.abs(dft1 -dft1 ) + c2 * nz(filt ) - c3 * nz(filt )
Usecase:
First option:
Select the preferred version of DFT and noise reduction settings based on your analysis requirements.
Leverage the script to identify Bullish and Bearish trends, shown with green and red triangle.
Combine Different Timeframes to accurately determine market trend.
Second option:
Pull the data with API sockets to automate your trading journey.
plot(close, title="ClosePrice", display=display.status_line)
plot(open, title="OpenPrice", display=display.status_line)
plot(greencon ? 1 : redcon ? -1 : 0, title="position", display=display.status_line)
Use ClosePrice, OpenPrice and "position" titles to easily read and backtest your strategy utilising more than 1 Time Frame.
Indicator id:
USER;e7a774913c1242c3b1354334a8ea0f3c
(only relevant to those that use API requests)

Sentiment OscillatorPrice moves when there are more market takers than there are market makers at a certain price (i.e. price moves up when there are more market buys than limit sells and vice versa). The idea of this indicator is to show the ratio between market takers and market makers in a way that is intuitive to technical analysis methods, and hopefully revealing the overall sentiment of the market in doing so. You can use it in the same way you would other oscillators (histogram crossing zero, divergences, etc). The main difference between this and most volume-weighted indicators is that the price is divided by volume instead of multiplied by it, thus giving you a rough idea of how much "effort" it took to move the price. My hypothesis is that when more volume is needed to move the price, that means bulls and bears are not in agreement of what the "fair price" should be for an asset (e.g. if the candle closes only a bit higher than its open but there's a huge spike in volume, that tells you that a majority of the market are starting to think the price is too high and they've started selling).
Methods of Calculation
1. Price Change Per Volume
The main method this indicator uses to reveal market sentiment is by comparing price change to the volume of trades in a bar.
You will see this calculation plotted in its most basic form by ticking the "Show Bar per Bar Change/Volume" box in the inputs dialog. I personally found that the plots were too noisy and cannot be used in real time reliably due to the fact that there is not much volume at the open of a new bar. I decided to leave in the option to use this method, in case you'd like to experiment with it or get a better grasp of how the indicator works.
2. Exponential Moving Averages
In my quest to smooth out the plotted data, I experimented with exponential moving averages. Applying an EMA on the change per volume data did smooth it out a bit, but still left in a lot of noise. So I worked around it by applying the EMA to the price change first, and then dividing it by the EMA of the volume. The term I use for the result of this calculation is "Market Sentiment" (do let me know if you have a better-fitting term for it ;-)), and I have kept it as an option that you can use in the way you would use other oscillators like CMF, OBV, etc. This option is unticked by default.
3. MACD
I left "Market Sentiment" unchecked as the default option because I thought an easier way to use this indicator would be as a momentum indicator like the MACD . So that's what I turned it into! I applied another EMA on the Market Sentiment, added a slower EMA to subtract from the first, and now we have a MACD line. I added a signal line to subtract from the MACD , and the result is plotted as a histogram... ish . I used area instead of columns for plot style so you don't get confused when comparing with a regular MACD indicator, but you can always change it if an actual histogram is more your taste.
The "histogram" is the main gauge of sentiment change momentum and it is easiest to use, that is why it is the only calculation plotted by default.
Methods of Use
As I have mentioned before, you can use this as you would other oscillators.
-The easiest way to use this indicator is with the Momentum histogram, where crosses over 0 indicate increasing bullish sentiment, and crosses below 0 indicate increasing bearish sentiment. You may also spot occasional divergences with the histogram.
-For the Market Sentiment option, the easiest way to use it is to look for divergences.
-And if you use the "Price Change per Volume of Each Bar", well... I honestly don't know. I guess divergences would be apparent towards the close of a bar, but in realtime, I don't recommend you use this. Maybe if you'd like to study the market movement, looking at historical data and comparing price, volume , and Change per Volume of each bar would come in handy in a pseudo-tape-reading kind of way.
Anyway, that's my explanation of this indicator. The default values were tested on BTC/USDT (Binance) 4h with decent results. You'll have to adjust the parameters for different markets and timeframes.
I have published this as a strategy so you can test out how the indicator performs as you're tweaking the parameters.
I'm aware that the code might not be the cleanest as I have only started learning pine (and code in general) for about a month, so any suggestions to improve the script would be appreciated!
Good luck and happy trading :-)

Super Momentum OscillatorA new momentum oscillator. I uploaded this previously but it got deleted I believe because apparently my chart was too cluttered.
Hopefully this is good enough... made some updates as well since then.
What you have is six (!) momentum oscillators that can be weighed together however you please. They are centered on 0 with a fill so its also easy to overlay them (as shown).
Since momentum oscillators vary heavily chart to chart, in terms of resolution, I added that as an option so you can keep the hlines as they are.
Can be useful for spotting higher time frame moves on lower time frames without any of the repaint or needing 6 chart screens. Also a solid improvement over the indicators where people just throw a dozen different length plots together and you have no idea where to look in the end. IMO, at least.
Mix and match high and low lengths however you please.
Also it looks wicked with rasta colors. SMOke (super momentum oscillator kills everything)... your way into financial freedom, mon!

SuperTrend Oscillator MTF█ OVERVIEW
SuperTrend Oscillator MTF is a multi-timeframe version of the classic SuperTrend converted into an oscillator. Instead of drawing the SuperTrend line on the price chart, it displays the distance of the close from the SuperTrend line simultaneously for the current timeframe and two additional timeframes. This allows you to instantly see the trend direction and strength across three selected timeframes in a single window.
█ CONCEPT
The classic SuperTrend value is subtracted from price and normalized so that trend direction can be directly compared across different timeframes without switching charts.
- Value above zero = price below SuperTrend line → bearish trend
- Value below zero = price above SuperTrend line → bullish trend
- The further away from zero, the stronger the trend.
█ FEATURES
- Three SuperTrend Oscillator lines: current TF, TF1 and TF2
- Automatic detection of 3-timeframe agreement
- BUY and SELL labels that appear only when all three timeframes turn in the same direction at the same moment
- Circle signals on every zero-line cross of the current timeframe
- Configurable soft gradient fill (can be disabled)
- Zero line changes color (green/red/gray) depending on 3-TF agreement
- Fully customizable colors for each timeframe
- Built-in alerts for all signal types
█ HOW TO USE
Add the indicator to the chart → set two additional timeframes and adjust ATR Period and Factor to suit your trading style.
Main settings:
- ATR Period → default 10
- Factor → default 3.0 (higher = fewer signals)
- TF 1 and TF 2 → any timeframes (e.g. 1H+4H, 4H+D, D+W, etc.)
- Enable gradient → turn fill on/off
- Show BUY/SELL labels (3 TF agreement) → enable/disable the strongest signals
Interpretation:
Two types of signals:
- Green/red circles → current timeframe changes trend direction (faster signal)
- BUY/SELL labels → all three timeframes simultaneously switch to the same direction (strongest confluence)
- Additionally, the zero line turns green or red when all three trends are aligned.
█ APPLICATIONS
Perfect for:
- Trend-following with multi-timeframe confirmation
- Filtering false breakouts on lower timeframes
- Scalping & day trading (use fast circle signals)
- Swing & position trading (wait for full 3-TF agreement)
Best combined with:
- Support/resistance levels and supply/demand zones – enter long after a confirmed breakout and retest of a key level (e.g. Change of Character, Break of Structure, Order Block, 0.618–0.786 Fibonacci) only when the oscillator shows 3-TF agreement or at least a bullish circle. Hold the trade to the next significant resistance/supply zone.
- Volume and Volume Profile – confirm move strength with rising volume and high-volume nodes at the breakout level. Declining volume while moving away from zero may signal trend exhaustion.
- Classic oscillators (RSI, Stochastic, MACD) – use primarily for spotting divergences and overbought/oversold conditions. One of the safest exits is when a regular or hidden divergence appears on RSI/Stochastic in an extreme zone, even if SuperTrend Oscillator MTF still shows alignment.
█ NOTES
- Works on all markets and all timeframes
- BUY/SELL labels (3-TF agreement) are the cleanest and strongest signals
- Circle signals are faster but more prone to noise
- Higher ATR Period = fewer signals, higher quality

Ultimate Oscillator Trading StrategyThe Ultimate Oscillator Trading Strategy implemented in Pine Script™ is based on the Ultimate Oscillator (UO), a momentum indicator developed by Larry Williams in 1976. The UO is designed to measure price momentum over multiple timeframes, providing a more comprehensive view of market conditions by considering short-term, medium-term, and long-term trends simultaneously. This strategy applies the UO as a mean-reversion tool, seeking to capitalize on temporary deviations from the mean price level in the asset’s movement (Williams, 1976).
Strategy Overview:
Calculation of the Ultimate Oscillator (UO):
The UO combines price action over three different periods (short-term, medium-term, and long-term) to generate a weighted momentum measure. The default settings used in this strategy are:
Short-term: 6 periods (adjustable between 2 and 10).
Medium-term: 14 periods (adjustable between 6 and 14).
Long-term: 20 periods (adjustable between 10 and 20).
The UO is calculated as a weighted average of buying pressure and true range across these periods. The weights are designed to give more emphasis to short-term momentum, reflecting the short-term mean-reversion behavior observed in financial markets (Murphy, 1999).
Entry Conditions:
A long position is opened when the UO value falls below 30, indicating that the asset is potentially oversold. The value of 30 is a common threshold that suggests the price may have deviated significantly from its mean and could be due for a reversal, consistent with mean-reversion theory (Jegadeesh & Titman, 1993).
Exit Conditions:
The long position is closed when the current close price exceeds the previous day’s high. This rule captures the reversal and price recovery, providing a defined point to take profits.
The use of previous highs as exit points aligns with breakout and momentum strategies, as it indicates sufficient strength for a price recovery (Fama, 1970).
Scientific Basis and Rationale:
Momentum and Mean-Reversion:
The strategy leverages two well-established phenomena in financial markets: momentum and mean-reversion. Momentum, identified in earlier studies like those by Jegadeesh and Titman (1993), describes the tendency of assets to continue in their direction of movement over short periods. Mean-reversion, as discussed by Poterba and Summers (1988), indicates that asset prices tend to revert to their mean over time after short-term deviations. This dual approach aims to buy assets when they are temporarily oversold and capitalize on their return to the mean.
Multi-timeframe Analysis:
The UO’s incorporation of multiple timeframes (short, medium, and long) provides a holistic view of momentum, unlike single-period oscillators such as the RSI. By combining data across different timeframes, the UO offers a more robust signal and reduces the risk of false entries often associated with single-period momentum indicators (Murphy, 1999).
Trading and Market Efficiency:
Studies in behavioral finance, such as those by Shiller (2003), show that short-term inefficiencies and behavioral biases can lead to overreactions in the market, resulting in price deviations. This strategy seeks to exploit these temporary inefficiencies, using the UO as a signal to identify potential entry points when the market sentiment may have overly pushed the price away from its average.
Strategy Performance:
Backtests of this strategy show promising results, with profit factors exceeding 2.5 when the default settings are optimized. These results are consistent with other studies on short-term trading strategies that capitalize on mean-reversion patterns (Jegadeesh & Titman, 1993). The use of a dynamic, multi-period indicator like the UO enhances the strategy’s adaptability, making it effective across different market conditions and timeframes.
Conclusion:
The Ultimate Oscillator Trading Strategy effectively combines momentum and mean-reversion principles to trade on temporary market inefficiencies. By utilizing multiple periods in its calculation, the UO provides a more reliable and comprehensive measure of momentum, reducing the likelihood of false signals and increasing the profitability of trades. This aligns with modern financial research, showing that strategies based on mean-reversion and multi-timeframe analysis can be effective in capturing short-term price movements.
References:
Fama, E. F. (1970). Efficient Capital Markets: A Review of Theory and Empirical Work. The Journal of Finance, 25(2), 383-417.
Jegadeesh, N., & Titman, S. (1993). Returns to Buying Winners and Selling Losers: Implications for Stock Market Efficiency. The Journal of Finance, 48(1), 65-91.
Murphy, J. J. (1999). Technical Analysis of the Financial Markets: A Comprehensive Guide to Trading Methods and Applications. New York Institute of Finance.
Poterba, J. M., & Summers, L. H. (1988). Mean Reversion in Stock Prices: Evidence and Implications. Journal of Financial Economics, 22(1), 27-59.
Shiller, R. J. (2003). From Efficient Markets Theory to Behavioral Finance. Journal of Economic Perspectives, 17(1), 83-104.
Williams, L. (1976). Ultimate Oscillator. Market research and technical trading analysis.

+ Klinger OscillatorThis is a version of Stephen J. Klinger's, Klinger Oscillator (sometimes called Klinger Volume Oscillator). I've changed virtually nothing about the indicator itself, but added some lookback inputs for the EMAs the oscillator is derived from (traditionally 34 and 55), and added a few other things, as is my wont.
But what is the Klinger Oscillator? Essentially, the calculation looks at the high, low, and close of the current period, and compares that to the previous period's. If it is greater, it adds volume, and if it is less, it subtracts volume. It then takes an EMA of two different lookback periods of that calculation and subtracts one from the other. That's your oscillator. There is then made a signal line of the oscillator that a trader can use, in combination with the zero line, for taking trades. Investopedia has a good article on it, so if you're looking for more specifics, check there.
What I've done is add a selection of different moving averages that you may choose for the signal line. Usually it's a 13 period EMA, and that comes default, but here you could use an ALMA or HMA, or modular filter, etc. Find something that works for your style/algorithm.
Of course there are all the usual additions of mine with the various ways of coloring the indicator and candles, adjustable Donchian Bands, and alerts. A new addition that I've just added to all my indicators (oscillators, anyway) are divergences. This is more or less just a copy and paste of the divergence indicator available in TradingView. In this case you can set it to plot divergences off either the Klinger or the signal line. Depending on which one you choose you may have to adjust pivot lookbacks, and lookback range. I've kept the settings default from the RSI TradingView version.

Aggregated Scores Oscillator [Alpha Extract]A sophisticated risk-adjusted performance measurement system that combines Omega Ratio and Sortino Ratio methodologies to create a comprehensive market assessment oscillator. Utilizing advanced statistical band calculations with expanding and rolling window analysis, this indicator delivers institutional-grade overbought/oversold detection based on risk-adjusted returns rather than traditional price movements. The system's dual-ratio aggregation approach provides superior signal accuracy by incorporating both upside potential and downside risk metrics with dynamic threshold adaptation for varying market conditions.
🔶 Advanced Statistical Framework
Implements dual statistical methodologies using expanding and rolling window calculations to create adaptive threshold bands that evolve with market conditions. The system calculates cumulative statistics alongside rolling averages to provide both historical context and current market regime sensitivity with configurable window parameters for optimal performance across timeframes.
🔶 Dual Ratio Integration System
Combines Omega Ratio analysis measuring excess returns versus deficit returns with Sortino Ratio calculations focusing on downside deviation for comprehensive risk-adjusted performance assessment. The system applies configurable smoothing to both ratios before aggregation, ensuring stable signal generation while maintaining sensitivity to regime changes.
// Omega Ratio Calculation
Excess_Return = sum((Daily_Return > Target_Return ? Daily_Return - Target_Return : 0), Period)
Deficit_Return = sum((Daily_Return < Target_Return ? Target_Return - Daily_Return : 0), Period)
Omega_Ratio = Deficit_Return ≠ 0 ? (Excess_Return / Deficit_Return) : na
// Sortino Ratio Framework
Downside_Deviation = sqrt(sum((Daily_Return < Target_Return ? (Daily_Return - Target_Return)² : 0), Period) / Period)
Sortino_Ratio = (Mean_Return / Downside_Deviation) * sqrt(Annualization_Factor)
// Aggregated Score
Aggregated_Score = SMA(Omega_Ratio, Omega_SMA) + SMA(Sortino_Ratio, Sortino_SMA)
🔶 Dynamic Band Calculation Engine
Features sophisticated threshold determination using both expanding historical statistics and rolling window analysis to create adaptive overbought/oversold levels. The system incorporates configurable multipliers and sensitivity adjustments to optimize signal timing across varying market volatility conditions with automatic band convergence logic.
🔶 Signal Generation Framework
Generates overbought conditions when aggregated score exceeds adjusted upper threshold and oversold conditions below lower threshold, with neutral zone identification for range-bound markets. The system provides clear binary signal states with background zone highlighting and dynamic oscillator coloring for intuitive market condition assessment.
🔶 Enhanced Visual Architecture
Provides modern dark theme visualization with neon color scheme, dynamic oscillator line coloring based on signal states, and gradient band fills for comprehensive market condition visualization. The system includes zero-line reference, statistical band plots, and background zone highlighting with configurable transparency levels.
snapshot
🔶 Risk-Adjusted Performance Analysis
Utilizes target return parameters for customizable risk assessment baselines, enabling traders to evaluate performance relative to specific return objectives. The system's focus on downside deviation through Sortino analysis provides superior risk-adjusted signals compared to traditional volatility-based oscillators that treat upside and downside movements equally.
🔶 Multi-Timeframe Adaptability
Features configurable calculation periods and rolling windows to optimize performance across various timeframes from intraday to long-term analysis. The system's statistical foundation ensures consistent signal quality regardless of timeframe selection while maintaining sensitivity to market regime changes through adaptive band calculations.
🔶 Performance Optimization Framework
Implements efficient statistical calculations with optimized variable management and configurable smoothing parameters to balance responsiveness with signal stability. The system includes automatic band adjustment mechanisms and rolling window management for consistent performance across extended analysis periods.
This indicator delivers sophisticated risk-adjusted market analysis by combining proven statistical ratios in a unified oscillator framework. Unlike traditional overbought/oversold indicators that rely solely on price movements, the ASO incorporates risk-adjusted performance metrics to identify genuine market extremes based on return quality rather than price volatility alone. The system's adaptive statistical bands and dual-ratio methodology provide institutional-grade signal accuracy suitable for systematic trading approaches across cryptocurrency, forex, and equity markets with comprehensive visual feedback and configurable risk parameters for optimal strategy integration.

+ WaveTrend OscillatorI'm guessing most of you are familir with LazyBear's adaptation of the Wavetrend Oscillator; it's one of the most popular indicators on TradingView. I know others have done adaptations of it, but I thought I might as well, because that's kind of a thing I like doing.
In this version I've added a second Wavetrend plot. This is a thing I like to do. The longer plot gives you a longer timeframe momentum bias, and the shorter plot gives you entries and/or exits. Here we have one plot with a lookback period of 55, and another with the default set to 6 (change this to 14 if you think you might prefer something slower and that will plot similarly to the default RSI settings). With the traditional Wavetrend Oscillator there is a simple moving average on the WTO that is to help provide entries and exits. I've done away with this as there are already two plots, and I felt more would just clutter the indicator. Instead of plotting the SMA I've plotted the crosses along the bottom and top of the indicator. Also, as is not the case in LazyBear's version, this SMA length is adjustable. By default it is set to 3, which is the default setting on the original indicator.
I've also plotted background colors for when there is what I call a momentum shift. If one or the other oscillators crosses the centerline a colored bar is plotted. By default it is turned on for both WTOs, though in practice you might only want it on for the longer one.
I would say use of the indicator is similar to the original WTO or many other oscillators. Buying oversold and selling overbought, but being mindful of the momentum of the market. If the longer WTO is above the centerline it's best to be looking for dips to the centerline, or for an overbought signal by the faster WTO, and vice versa if the longer WTO is below the centerline. That said, you can also adjust the length of the SMA on the faster WTO to fine tune entries or exits, which is kind of how you would trade LazyBear's version. In this case you have that additional confirmation of market momentum.
You can set colored candles to either of the WTO plots via a dropdown menu.
There are alerts for overbought and oversold situations, centerline crosses, and Wavetrend crosses.
That's about it. Hope you enjoy this particular implementation of LazyBear's well known indicator.
Ah yes, last thing: Original version the source is set to hlc3. I've given you the opportunity to change that, so if you prefer using close you can, or whatever you want.

HTF Oscillators RSI/ROC/MFI/CCI/AO - Dynamic SmoothingThe Interplay of Time Frames: A Balanced View
Navigating the markets often involves interpreting trends from multiple angles. The HTF Oscillators with Dynamic Smoothing indicator enables you to do just that. This tool provides the option to integrate smoothed oscillator readings from Higher Time Frames (HTF) into lower time frame charts, such as a 1-minute chart. By doing so, the indicator offers a balanced viewpoint that bridges the gap between micro and macro perspectives, helping you make informed decisions without losing sight of the broader market context.
Features
Multi-Oscillator Support
Choose from a range of popular oscillators like the Relative Strength Index (RSI), Rate of Change (ROC), Money Flow Index (MFI), Commodity Channel Index (CCI), and Awesome Oscillator (AO). These oscillators are commonly used as foundational building blocks in trading strategy scripts by traders worldwide. Switch effortlessly between them, depending on your trading strategy and requirements. To maintain consistency and a familiar user experience, our script adopts the same visual aesthetics that you'll find in Pine Script indicators on TradingView: a sleek purple line for the oscillator and a transparent band filling. These visual elements are not only pleasing to the eye but also widely appreciated by the trading community.
Dynamic Smoothing
The unique dynamic smoothing feature calculates a smoothing factor based on the ratio of minutes between the Higher Time Frame (HTF) and your current time frame. This provides a sleek and responsive oscillator line that still holds the weight of the longer trend. One of the significant advantages of this feature is user experience; when you change your time frame, the HTF-values in your settings will remain consistent. This ensures that you can easily switch between different time frames without losing the insights provided by your selected HTF.
Visual Aids
Visual cues are an essential part of any trading strategy. The indicator not only plots signals to mark overbought and oversold conditions based on the dynamically smoothed oscillator but also provides you with the flexibility to customize your visual experience. You have the option to toggle on/off the display of these signals depending on your specific needs. Additionally, bands can be displayed at overbought and oversold levels, along with a reference middle line. If you switch between different oscillators (available in the parameter settings), remember to manually adjust the bands in the input settings to ensure signals matches with the type of oscillator to your liking.
User-Friendly Settings
We've grouped related settings together, making it easier for you to find what you're looking for. Adjust the oscillator type, length of bars, smoothing settings, and more with just a few clicks.
Information Table
A standout feature of this indicator is the real-time information table, which displays the values of all selected oscillators based on your specified Higher Time Frame (HTF) settings. This can be particularly useful for traders who depend on multiple indicators for their decision-making process. The data presented in the table is synchronized with the HTF options you've configured in the input settings, allowing for a more efficient and quick scan of values from higher time frames.
Educational Corner: The Power of the Information Table and Customization
The table incorporated into this indicator isn't just eye-candy; it's a practical tool designed to elevate your trading strategy. It dynamically displays real-time values of various oscillators for the HTF you've chosen. This is an exemplary use of TradingView's scripting capabilities to blend multiple indicators into a single visual panel, streamlining your analysis and decision-making process.
But here's the best part: You're not limited to what we've created. With some basic understanding of TradingView's scripting language, Pine Script, you can easily adapt this table to include different indicators that suit your unique trading style. The logic in the script is modular and can serve as a foundation for your own customized trading dashboard. So, go ahead, get creative and explore new combinations of indicators that will help you excel in your trading endeavors!
You no longer have to toggle between different charts or indicators to get the information you need; it's all there in one neatly organized table. We encourage you to tap into this feature and make it your own, empowering your trading like never before.
By doing so, you not only gain a more comprehensive toolset, but you also engage more deeply with your trading strategy, understanding its nuances and, ultimately, making more informed decisions.
Conclusion
The HTF Oscillators with Dynamic Smoothing is a versatile and powerful tool that brings together the best of both worlds: the perspective of higher time frames and the granularity of shorter ones. Its feature-rich setting options and real-time information table make it a potential useful addition to your trading toolkit.
Remember, while this indicator offers a comprehensive and smarter way to look at the markets, it is not a foolproof method for predicting market movements. Always use it in conjunction with other analysis methods and risk management strategies.
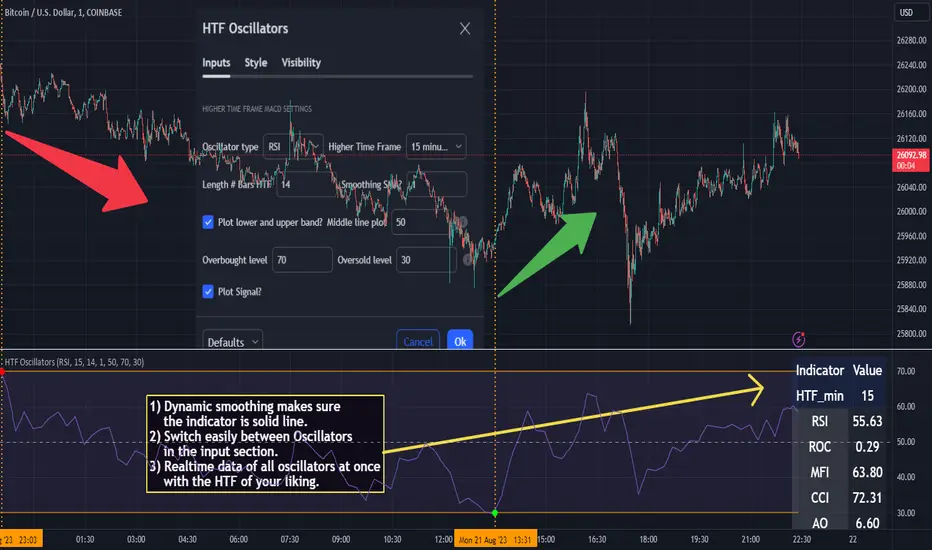
TheATR: Fisher Oscillator.Fisher Oscillator(FO).
The Fisher Oscillator is inspired by John Ehlers "Fisher Transform".
The oscillator highlights when prices have moved to an extreme, based on recent prices.
The FO may help in spotting turning points, in the short-medium trends of an asset, also, it helps in recognizing the asset's trends themselves, giving a picture of mkt conditions affected by less noise.
Fisher Oscillator Components.
Fisher V1 -> Main FO.
Fisher V2 -> Past Candle FO.
0-line threshold -> Directional Component.
How to read the Fisher Oscillator.
The FO is super easy to read by itself.. also, I coded some features which make it even easier to read.
It's suggestions, which we can call "Signals", come from 2 different sources, accessible thanks to the variable "Signals Type".
- 0-Line Crosses:
When the "Fisher V1" upcrosses the oscillator 0-line, the oscillator suggests a Long scenario.
When the "Fisher V1" downcrosses the oscillator 0-line, the oscillator suggests a Short scenario.
- Classic Lines Crosses:
When the "Fisher V1" upcrosses the "Fisher V2", the oscillator suggests a Long scenario.
When the "Fisher V1" downcrosses the "Fisher V2", the oscillator suggests a Short scenario.
Users will be able to recognise these Signals visually, thanks to some color customisation to the "Fisher V1" line, and thanks to the ability of the oscillator of plotting Signals.
TheATR Documentation regarding TheATR: Fisher Oscillator.
Researching and backtesting the FO, I noticed it's skill of being able to dynamically identify trend reversals with a nice degree of reliability.
Also, the FO's able to keep up with trends up to their tops/bottoms, as it's very responsive.
This makes the FO a trend-following oscillator in my personal view, because its nature of being very fast in detecting reversals will lead to many false reversals as well.
On the other face of this coin, if we look at the FO as a source for confirmations for a trend-following strategy, may be very useful.
To conclude, I would use the FO as a confirmation oscillator, in a trend-following strategy that needs to have other components.
Thanks for reading,
TheATR.

Oscillators Overlay w/ Divergencies/Alerts by DGTAn oscillator is a technical analysis tool that, simply said, gauge momentum, determine market trend direction and duration. For some oscillators, fluctuations are bounded by some upper and lower band, and traders use them to discover short-term overbought or oversold conditions.
Oscillators are often combined with moving average indicators to signal trend breakouts or reversals
Histogram, is the difference between the oscillator and signal lines, which oscillates above and below a center line and is used as a good indication of an asset's momentum
What to look for
- Signal Line Crossover is the most common signal produced by the oscillators
- Zero Line Crossovers have a very similar premise to Signal Line Crossovers
- Divergence , when the oscillator and actual price are not in agreement, is another signal created by the oscillators
- Overbought and Oversold , with any range-bound oscillator, conditions are a primary signal generated
Oscillators Overlay study
* Presents oscillators on top of the mian chart (price chart)
* A single indicator for many well known and custom oscillators
* Divergence detection
* Alerts for various condtions
The list of oscillators included;
- Awesome Oscillator (AO)
- Chaikin Oscillator (Chaikin Osc)
- Commodity Channel Index (CCI)
- Distance Oscillator
- Elder-Ray Bear and Bull Power
- Elliott Wave Oscillator (EWO)
- Klinger Oscillator
- Money Flow Index (MFI)
- Moving Average Convergence Divergence (MACD)
- Rate Of Change (ROC)
- Relative Strength Index (RSI)
- Stochastic (Stoch)
- Stochastic RSI (Stoch RSI)
- Volume Oscillator (Volume Osc)
- Wave Trend
In technical analysis, investors find oscillators to be important technical tools and consider them more effective when used in conjunction with other means of technical analysis
Disclaimer : Trading success is all about following your trading strategy and the indicators should fit within your trading strategy, and not to be traded upon solely
The script is for informational and educational purposes only. Use of the script does not constitutes professional and/or financial advice. You alone the sole responsibility of evaluating the script output and risks associated with the use of the script. In exchange for using the script, you agree not to hold dgtrd TradingView user liable for any possible claim for damages arising from any decision you make based on use of the script
