Nifty Candle Pattern IdentifierNifty Candle Pattern Identifier ✅ Doji ✅ Hammer ✅ Inverted Hammer ✅ Bullish Engulfing ✅ Bearish Engulfing ✅ Shooting StarPine Script® indicatorby rajags891130
Extreme Candle Pattern Visualizer🟠 OVERVIEW This indicator compares the current candle's percentage change against historical data, then highlights past candles with equal or bigger magnitude of movement. Also, for all the highlighted past candles, it tracks how far price extends before recovering to its starting point. It also provides statistical context through percentile rankings. IN SHORT: Quickly spot similar price movements in the past and understand how unusual the current candle is using percentile rankings. 🟠 CORE CONCEPT The indicator operates on two fundamental principles: 1. Statistical Rarity Detection The script calculates the percentage change (open to close) of every candle within a user-defined lookback period and determines where the current candle ranks in this distribution. A candle closing at -9% might fall in the bottom 5th percentile, indicating it's more extreme than 95% of recent candles. This percentile ranking helps traders identify statistically unusual moves that often precede reversals or extended trends. 2. Recovery Path Mapping Once extreme candles are identified (those matching or exceeding the current candle's magnitude), the indicator tracks their subsequent price action. For bearish candles, it measures how far price dropped before recovering back to the candle's opening price. For bullish candles, it tracks how high price climbed before returning to the open. This reveals whether extreme moves typically extend further or reverse quickly. 🟠 PRACTICAL APPLICATIONS Mean Reversion Trading: Candles in extreme percentiles (below 10% or above 90%) often signal oversold/overbought conditions. The recovery lines show typical extension distances, helping traders set profit targets for counter-trend entries. Momentum Continuation: When extreme candles show small recovery percentages before price reverses back, it suggests strong directional momentum that may continue. Stop Loss Placement: Historical recovery data reveals typical extension ranges after extreme moves, informing more precise stop loss positioning beyond noise but before major reversals. Pattern Recognition: By visualizing how similar historical extremes resolved, traders gain context for current price action rather than trading in isolation. 🟠 VISUAL ELEMENTS Orange Circles: Mark historical candles with similar or greater magnitude to current candle Red Lines: Track downward extensions after bearish extreme candles Green Lines: Track upward extensions after bullish extreme candles Percentage Labels: Show exact extension distance from candle close to extreme point Percentile Label: Color-coded box displaying current candle's statistical ranking Hollow Candles: Background rendering for clean chart presentation 🟠 ORIGINALITY This indicator uniquely combines statistical percentile analysis with forward-looking recovery tracking. While many indicators identify extreme moves, few show what happened next across multiple historical instances simultaneously. The dual approach provides both the "how rare is this?" question (percentile) and "what typically happens after?" answer (recovery paths) in a single visual framework. Pine Script® indicatorby osprey033699
Larry Williams Bonus Track PatternThis strategy trades the day immediately following an Inside Day, under specific directional and timing conditions. It is designed for daily-based setups but executed on intraday charts to ensure orders are placed exactly at the open of the following day, rather than at the daily bar close. Entry Conditions Only trades on Monday, Thursday, or Friday. The previous day must be an Inside Day (its high is lower than the prior high and its low is higher than the prior low). The bar before the Inside Day must be bullish (close > open). On the following day (t): The daily open must be below both the Inside Day’s high and the highest high of the two days before that. A buy stop is placed at the highest high of the three previous days (Inside Day and the two days before it). If the new day’s open is already above that level (gap up), the strategy enters long immediately at the open. Exit Rules Stop Loss: Fixed, defined in points or percentage (user input). FPO (First Profitable Open): the position is closed at the first daily open after the entry day where the open price is above the average entry price (the first profitable open). Notes The script must be applied on an intraday timeframe (e.g., 15-minute or 1-hour) so that the strategy can: Detect the Inside Day pattern using daily data (request.security). Execute orders in real time at the next day’s open. Running it directly on the daily timeframe will delay executions by one bar due to Pine Script’s evaluation model. Pine Script® strategyby xtradernet22
Triangle Pattern DetectorTriangle Pattern Detector Core Logic Breakdown Ascending Triangle: Horizontal resistance (top) and rising support (bottom). Overlay appears in blue. Descending Triangle: Horizontal support (bottom) and falling resistance (top). Overlay appears in red. Overlays: Draw triangle shapes on the price chart, matching common trading definitions (one horizontal leg).Pine Script® indicatorby Trader_n_Investor1173
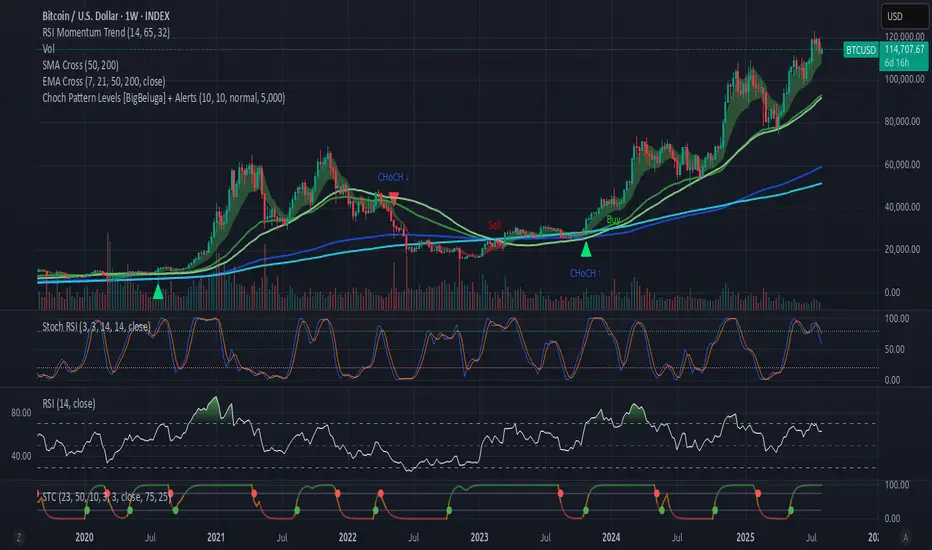
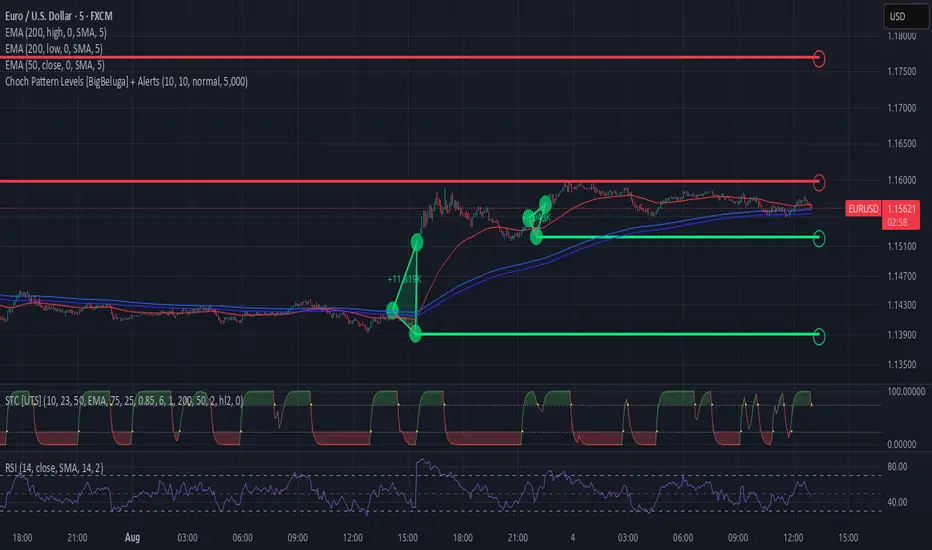
Choch Pattern Levels [BigBeluga] + AlertsChoch Pattern Levels highlights key structural breaks that can mark the start of new trends. By combining precise break detection with volume analytics and automatic cleanup, it provides actionable insights into the true intent behind price moves — giving traders a clean edge in spotting early reversals and key reaction zones. Added support for alarms.Pine Script® indicatorby mladenkata4058211249
Choch Pattern Levels [BigBeluga] + AlertsChoch Pattern Levels highlights key structural breaks that can mark the start of new trends. By combining precise break detection with volume analytics and automatic cleanup, it provides actionable insights into the true intent behind price moves — giving traders a clean edge in spotting early reversals and key reaction zones. Added alarms support.Pine Script® indicatorby mladenkata40582Updated 87
4 Flags Whale PatternThis indicator detects a unique 4-bar candlestick pattern characterized by alternating bullish and bearish candles (or vice versa), where all four candles have similar body sizes within a specified tolerance. Usage: This pattern may indicate a consolidation phase or a potential breakout zone after indecisive price action. Traders can use it to anticipate a directional move following the "tug-of-war" between buyers and sellers.Pine Script® indicatorby sachendrayUpdated 106
Fractal Pattern AnalysisFractal Pattern Key Elements and How to Read Them 1. Williams Fractals (Triangle Markers) Red Triangles Pointing Down: Bearish fractals - potential resistance points and selling opportunities Green Triangles Pointing Up: Bullish fractals - potential support points and buying opportunities When to Act: Look for bullish fractals forming during uptrends and bearish fractals during downtrends 2. Moving Averages Yellow Line (20 EMA): Short-term trend Blue Line (50 EMA): Medium-term trend Red Line (200 EMA): Long-term trend Interpretation: When shorter MAs cross above longer MAs, it's bullish; when they cross below, it's bearish Key Signal: The alignment of all three MAs (stacked in order) confirms a strong trend 3. Background Color Green Background: Uptrend (all MAs aligned bullishly) Red Background: Downtrend (all MAs aligned bearishly) Yellow Background: Sideways/neutral market (MAs not clearly aligned) 4. Market Structure Markers (Small Circles) Green Circles: Higher highs and higher lows (bullish structure) Red Circles: Lower highs and lower lows (bearish structure) Pattern Recognition: Multiple green circles suggest continuing uptrend; multiple red circles suggest continuing downtrend 5. Reversal Diamonds ("Rev" Markers) Yellow Diamonds: Potential trend reversal points Usage: These mark where the current trend might be changing direction Confirmation: Wait for price to close beyond the diamond before acting 6. Bollinger Bands (Blue Lines with Fill) Middle Band: 20-period SMA Upper/Lower Bands: Volatility channels Signals: Price touching upper band in uptrend is strength; touching lower band in downtrend is weakness Squeeze: When bands narrow, expect a volatility breakout soon 7. Status Table (Top Right) Shows current trend, volume direction, and overall signal at a glance "BUY" signal appears when multiple bullish conditions align "SELL" signal appears when multiple bearish conditions align Pine Script® indicatorby satsrin20
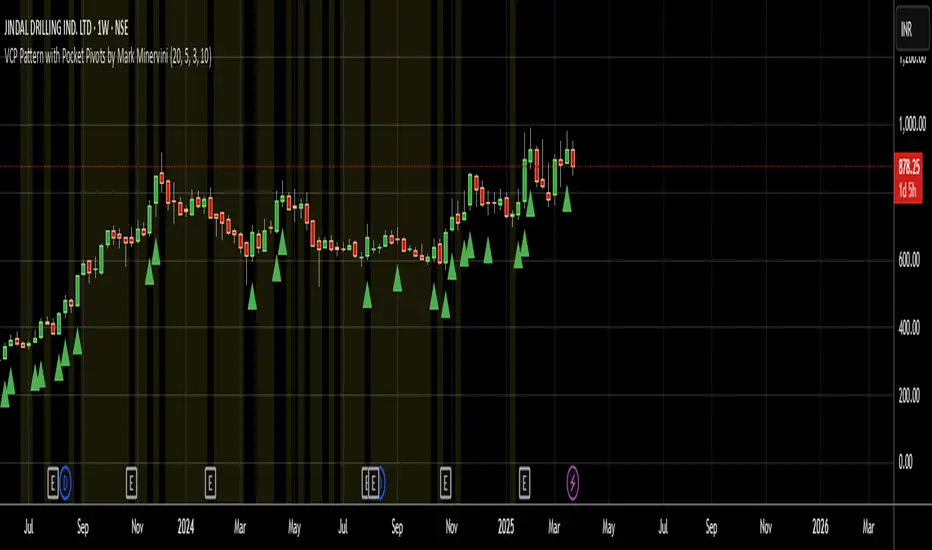
VCP Pattern with Pocket Pivots by Mark MinerviniBelow is a Pine Script designed to identify and plot Mark Minervini's Volatility Contraction Pattern (VCP) along with Pocket Pivots on TradingView. The VCP is characterized by a series of price contractions (tightening price ranges) with decreasing volume, often followed by a breakout. Pocket Pivots, a concept from Chris Kacher and Gil Morales, identify early buying opportunities within a consolidation or uptrend based on volume surges. This script combines both concepts to help traders spot potential setups. Pine Script® indicatorby ravihls33376
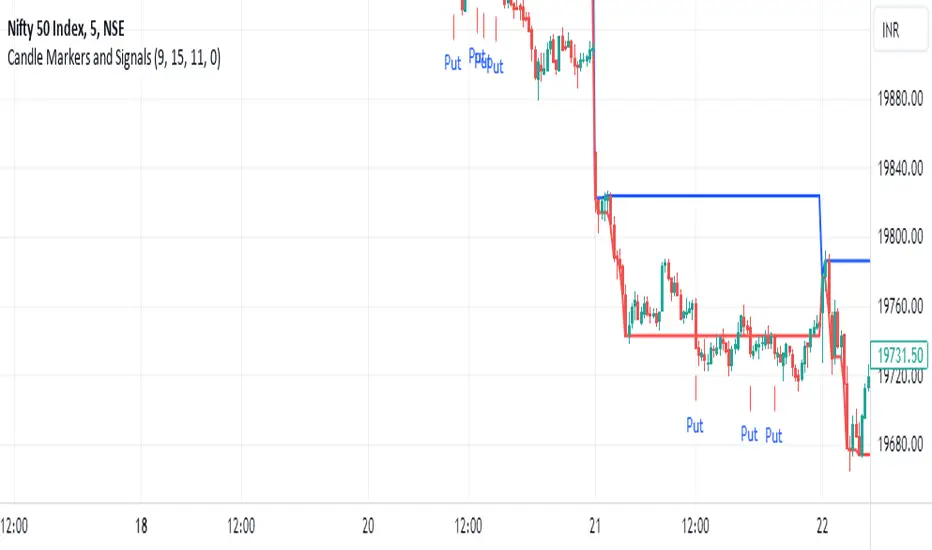
MFS-3 Bars Pattern Strategy3 Bar Pattern Strategy Detects an Ignite Candle followed by a Pullback Candle followed by a Confirmation Candle. A Box will be drawn around the setup and three arrows will identify I, P, C (Ignite, Pullback, Confirmation) the setup. The strategy will calculate a Stop Loss below the Low Price of the Ignite candle and a Take Profit at 2 times the Stop Loss giving a Risk to Reward Ratio of 1:2. Extra conditions are included to reduce false triggers: - A down trend must be detected using 3 SMA (Long, Medium, Short) that should be aligned from Long to Short one above the other. - The Ignite Candle's body must be BELOW the Short SMA An input form is available to adjust some strategy parameters. Performance Note ---------------------- Trading conditions are very strict, so most of the time, no signals will be detected in the Strategy window. This strategy should only be one of many strategies used for trade setups. Hope you enjoy it. Pine Script® strategyby poivronjauneUpdated 22227
Equilibrium Candles + Pattern [Honestcowboy]The Equilibrium Candles is a very simple trend continuation or reversal strategy depending on your settings. How an Equilibrium Candle is created: We calculate the equilibrium by measuring the mid point between highest and lowest point over X amount of bars back. This now is the opening price for each bar and will be considered a green bar if price closes above equilibrium. Bars get shaded by checking if regular candle close is higher than open etc. So you still see what the normal candles are doing. Why are they useful? The equilibrium is calculated the same as Baseline in Ichimoku Cloud. Which provides a point where price is very likely to retrace to. This script visualises the distance between close and equilibrium using candles. To provide a clear visual of how price relates to this equilibrium point. This also makes it more straightforward to develop strategies based on this simple concept and makes the trader purely focus on this relationship and not think of any Ichimoku Cloud theories. Script uses a very simple pattern to enter trades: It will count how many candles have been one directional (above or below equilibrium) Based on user input after X candles (7 by default) script shows we are in a trend (bg colors) On the first pullback (candle closes on other side of equilibrium) it will look to enter a trade. Places a stop order at the high of the candle if bullish trend or reverse if bearish trend. If based on user input after X opposite candles (2 by default) order is not filled will cancel it and look for a new trend. Use Reverse Logic: There is a use reverse logic in the settings which on default is turned on. It will turn long orders into short orders making the stop orders become limit orders. It will use the normal long SL as target for the short. And TP as stop for the short. This to provide a means to reverse equity curve in case your pair is mean reverting by nature instead of trending. ATR Calculation: Averaged ATR, which is using ta.percentile_nearest_rank of 60% of a normal ATR (14 period) over the last 200 bars. This in simple words finds a value slightly above the mean ATR value over that period. Big Candle Exit Logic: Using Averaged ATR the script will check if a candle closes X times that ATR from the equilibrium point. This is then considered an overextension and all trades are closed. This is also based on user input. Simple trade management logic: Checks if the user has selected to use TP and SL, or/and big candle exit. Places a TP and SL based on averaged ATR at a multiplier based on user Input. Closes trade if there is a Big Candle Exit or an opposite direction signal from indicator. Script can be fully automated to MT5 There are risk settings in % and symbol settings provided at the bottom of the indicator. The script will send alert to MT5 broker trying to mimic the execution that happens on tradingview. There are always delays when using a bridge to MT5 broker and there could be errors so be mindful of that. This script sends alerts in format so they can be read by tradingview.to which is a bridge between the platforms. Use the all alert function calls feature when setting up alerts and make sure you provide the right webhook if you want to use this approach. There is also a simple buy and sell alert feature if you don't want to fully automate but still get alerts. These are available in the dropdown when creating an alert. Almost every setting in this indicator has a tooltip added to it. So if any setting is not clear hover over the (?) icon on the right of the setting. The backtest uses a 4% exposure per trade and a 10 point slippage. I did not include a commission cause I'm not personaly aware what the commissions are on most forex brokers. I'm only aware of minimal slippage to use in a backtest. Trading conditions vary per broker you use so always pay close attention to trading costs on your own broker. Use a full automation at your own risk and discretion and do proper backtesting.Pine Script® strategyby Honestcowboy268
T-Wave Pattern IdentifierA T-wave might describe a pattern where the price movement forms a "T" shape on the chart, which could involve: Strong Vertical Movement (The Stem of the T): This could represent a sharp, decisive move in one direction (up or down), often occurring in a single candle or a few candles. This movement could be seen as the "stem" of the T. For example, a sudden spike up in price followed by a horizontal consolidation. Horizontal Movement (The Cross of the T): Following the sharp move, the price might consolidate sideways, forming a horizontal base or resistance/support level, which creates the top cross of the "T." This could indicate a pause or a consolidation phase after a significant move, where the price moves within a narrow range. Contexts Where a T-Wave Pattern Might Be Useful: Breakout Scenarios: If a T-wave forms after a significant upward or downward movement, it could suggest a potential continuation in the direction of the initial move, especially if the price breaks out of the consolidation range. Reversal Signals: Alternatively, the T-wave could act as a reversal pattern if the price fails to continue in the direction of the initial move and instead breaks out in the opposite direction. T-Wave Logic Example: Stem (Vertical Movement): Identify a candle or series of candles with a significant price move (e.g., a large-bodied candle with a relatively small wick). This shows momentum in one direction. Cross (Horizontal Movement): Following the vertical move, identify a consolidation phase where the price moves sideways in a relatively tight range. This could be visualized as a series of small candles with overlapping highs and lows.Pine Script® indicatorby bhaleraocedric43
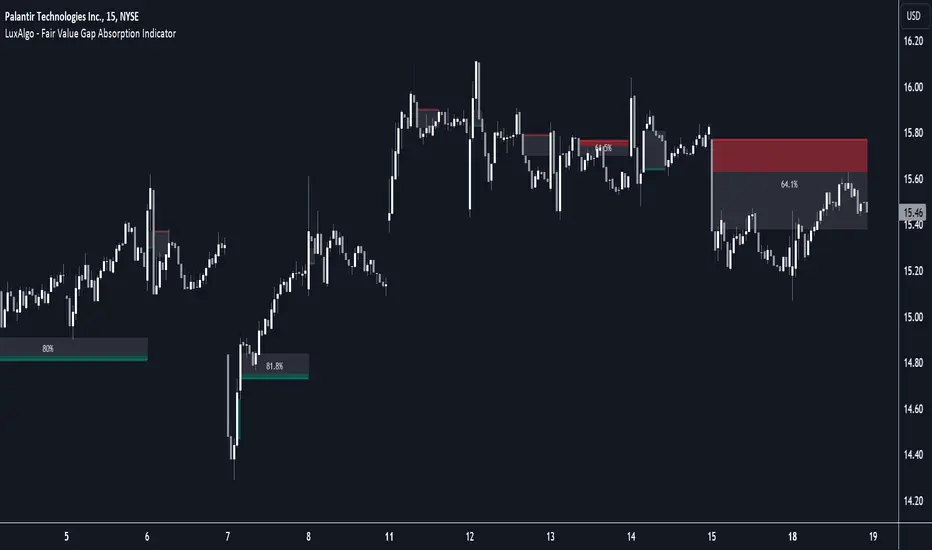
Fair Value Gap Absorption Indicator [LuxAlgo]The Fair Value Gap Absorption Indicator aims to detect fair value gap imbalances and tracks the mitigation status of the detected fair value gap by highlighting the mitigation level till a new fair value gap is detected. The Fair Value Gap (FVG) is a widely utilized tool among price action traders to detect market inefficiencies or imbalances. These imbalances arise when buying or selling pressure is significant, resulting in a large upward or downward move, leaving behind an imbalance in the market. 🔶 USAGE A fair value gap appears in a triple-candle pattern when there is a large candle whose previous candle’s high and subsequent candle’s low do not fully overlap the large candle. The space between these wicks is known as the fair value gap. Price can come back to these imbalance areas and mitigate them, however, this is sometimes a process involving multiple bars, the displayed imbalances by the indicator allow tracking the current mitigation level of a displayed imbalance. Fair value gaps can become a magnet for the price before continuing in the same direction. Traders commonly wait for the price to revert toward the fair value gap to clear out the imbalance before continuing to move toward the prevailing trend. 🔶 SETTINGS 🔹Fair Value Gaps Fair Value Gap Width Filter: defines the filtering multiplier, please refer to the tooltip of the input option for further details. Bullish, Imbalance and Mitigation: color customization option. Bearish, Imbalance and Mitigation: color customization option. Display Percentage of Mitigation: Display the percentage of the mitigation areas. Historical Fair Value Gaps: toggles the visibility of the historical fair value gaps. 🔶 LIMITATIONS Please note that filtering cannot be applied for the first 144 (atr fixed-length) candles since the atr value won't be present that is used for filtering. 🔶 RELATED SCRIPTS Fair-Value-Gap HTF-Fair-Value-Gap Liquidity-Voids-FVGPine Script® indicatorby LuxAlgoUpdated 2020 5.4 K
Ramanand23This is based on chart pattern and varified for more than 5 years backtested Pine Script® indicatorby nitin2005Updated 84
SimilarityMeasuresLibrary "SimilarityMeasures" Similarity measures are statistical methods used to quantify the distance between different data sets or strings. There are various types of similarity measures, including those that compare: - data points (SSD, Euclidean, Manhattan, Minkowski, Chebyshev, Correlation, Cosine, Camberra, MAE, MSE, Lorentzian, Intersection, Penrose Shape, Meehl), - strings (Edit(Levenshtein), Lee, Hamming, Jaro), - probability distributions (Mahalanobis, Fidelity, Bhattacharyya, Hellinger), - sets (Kumar Hassebrook, Jaccard, Sorensen, Chi Square). --- These measures are used in various fields such as data analysis, machine learning, and pattern recognition. They help to compare and analyze similarities and differences between different data sets or strings, which can be useful for making predictions, classifications, and decisions. --- References: en.wikipedia.org cran.r-project.org numerics.mathdotnet.com github.com github.com github.com Encyclopedia of Distances, doi.org ssd(p, q) Sum of squared difference for N dimensions. Parameters: p (float ) : `array` Vector with first numeric distribution. q (float ) : `array` Vector with second numeric distribution. Returns: Measure of distance that calculates the squared euclidean distance. euclidean(p, q) Euclidean distance for N dimensions. Parameters: p (float ) : `array` Vector with first numeric distribution. q (float ) : `array` Vector with second numeric distribution. Returns: Measure of distance that calculates the straight-line (or Euclidean). manhattan(p, q) Manhattan distance for N dimensions. Parameters: p (float ) : `array` Vector with first numeric distribution. q (float ) : `array` Vector with second numeric distribution. Returns: Measure of absolute differences between both points. minkowski(p, q, p_value) Minkowsky Distance for N dimensions. Parameters: p (float ) : `array` Vector with first numeric distribution. q (float ) : `array` Vector with second numeric distribution. p_value (float) : `float` P value, default=1.0(1: manhatan, 2: euclidean), does not support chebychev. Returns: Measure of similarity in the normed vector space. chebyshev(p, q) Chebyshev distance for N dimensions. Parameters: p (float ) : `array` Vector with first numeric distribution. q (float ) : `array` Vector with second numeric distribution. Returns: Measure of maximum absolute difference. correlation(p, q) Correlation distance for N dimensions. Parameters: p (float ) : `array` Vector with first numeric distribution. q (float ) : `array` Vector with second numeric distribution. Returns: Measure of maximum absolute difference. cosine(p, q) Cosine distance between provided vectors. Parameters: p (float ) : `array` 1D Vector. q (float ) : `array` 1D Vector. Returns: The Cosine distance between vectors `p` and `q`. --- angiogenesis.dkfz.de camberra(p, q) Camberra distance for N dimensions. Parameters: p (float ) : `array` Vector with first numeric distribution. q (float ) : `array` Vector with second numeric distribution. Returns: Weighted measure of absolute differences between both points. mae(p, q) Mean absolute error is a normalized version of the sum of absolute difference (manhattan). Parameters: p (float ) : `array` Vector with first numeric distribution. q (float ) : `array` Vector with second numeric distribution. Returns: Mean absolute error of vectors `p` and `q`. mse(p, q) Mean squared error is a normalized version of the sum of squared difference. Parameters: p (float ) : `array` Vector with first numeric distribution. q (float ) : `array` Vector with second numeric distribution. Returns: Mean squared error of vectors `p` and `q`. lorentzian(p, q) Lorentzian distance between provided vectors. Parameters: p (float ) : `array` Vector with first numeric distribution. q (float ) : `array` Vector with second numeric distribution. Returns: Lorentzian distance of vectors `p` and `q`. --- angiogenesis.dkfz.de intersection(p, q) Intersection distance between provided vectors. Parameters: p (float ) : `array` Vector with first numeric distribution. q (float ) : `array` Vector with second numeric distribution. Returns: Intersection distance of vectors `p` and `q`. --- angiogenesis.dkfz.de penrose(p, q) Penrose Shape distance between provided vectors. Parameters: p (float ) : `array` Vector with first numeric distribution. q (float ) : `array` Vector with second numeric distribution. Returns: Penrose shape distance of vectors `p` and `q`. --- angiogenesis.dkfz.de meehl(p, q) Meehl distance between provided vectors. Parameters: p (float ) : `array` Vector with first numeric distribution. q (float ) : `array` Vector with second numeric distribution. Returns: Meehl distance of vectors `p` and `q`. --- angiogenesis.dkfz.de edit(x, y) Edit (aka Levenshtein) distance for indexed strings. Parameters: x (int ) : `array` Indexed array. y (int ) : `array` Indexed array. Returns: Number of deletions, insertions, or substitutions required to transform source string into target string. --- generated description: The Edit distance is a measure of similarity used to compare two strings. It is defined as the minimum number of operations (insertions, deletions, or substitutions) required to transform one string into another. The operations are performed on the characters of the strings, and the cost of each operation depends on the specific algorithm used. The Edit distance is widely used in various applications such as spell checking, text similarity, and machine translation. It can also be used for other purposes like finding the closest match between two strings or identifying the common prefixes or suffixes between them. --- github.com www.red-gate.com planetcalc.com lee(x, y, dsize) Distance between two indexed strings of equal length. Parameters: x (int ) : `array` Indexed array. y (int ) : `array` Indexed array. dsize (int) : `int` Dictionary size. Returns: Distance between two strings by accounting for dictionary size. --- www.johndcook.com hamming(x, y) Distance between two indexed strings of equal length. Parameters: x (int ) : `array` Indexed array. y (int ) : `array` Indexed array. Returns: Length of different components on both sequences. --- en.wikipedia.org jaro(x, y) Distance between two indexed strings. Parameters: x (int ) : `array` Indexed array. y (int ) : `array` Indexed array. Returns: Measure of two strings' similarity: the higher the value, the more similar the strings are. The score is normalized such that `0` equates to no similarities and `1` is an exact match. --- rosettacode.org mahalanobis(p, q, VI) Mahalanobis distance between two vectors with population inverse covariance matrix. Parameters: p (float ) : `array` 1D Vector. q (float ) : `array` 1D Vector. VI (matrix) : `matrix` Inverse of the covariance matrix. Returns: The mahalanobis distance between vectors `p` and `q`. --- people.revoledu.com stat.ethz.ch docs.scipy.org fidelity(p, q) Fidelity distance between provided vectors. Parameters: p (float ) : `array` 1D Vector. q (float ) : `array` 1D Vector. Returns: The Bhattacharyya Coefficient between vectors `p` and `q`. --- en.wikipedia.org bhattacharyya(p, q) Bhattacharyya distance between provided vectors. Parameters: p (float ) : `array` 1D Vector. q (float ) : `array` 1D Vector. Returns: The Bhattacharyya distance between vectors `p` and `q`. --- en.wikipedia.org hellinger(p, q) Hellinger distance between provided vectors. Parameters: p (float ) : `array` 1D Vector. q (float ) : `array` 1D Vector. Returns: The hellinger distance between vectors `p` and `q`. --- en.wikipedia.org jamesmccaffrey.wordpress.com kumar_hassebrook(p, q) Kumar Hassebrook distance between provided vectors. Parameters: p (float ) : `array` 1D Vector. q (float ) : `array` 1D Vector. Returns: The Kumar Hassebrook distance between vectors `p` and `q`. --- github.com jaccard(p, q) Jaccard distance between provided vectors. Parameters: p (float ) : `array` 1D Vector. q (float ) : `array` 1D Vector. Returns: The Jaccard distance between vectors `p` and `q`. --- github.com sorensen(p, q) Sorensen distance between provided vectors. Parameters: p (float ) : `array` 1D Vector. q (float ) : `array` 1D Vector. Returns: The Sorensen distance between vectors `p` and `q`. --- people.revoledu.com chi_square(p, q, eps) Chi Square distance between provided vectors. Parameters: p (float ) : `array` 1D Vector. q (float ) : `array` 1D Vector. eps (float) Returns: The Chi Square distance between vectors `p` and `q`. --- uw.pressbooks.pub stats.stackexchange.com www.itl.nist.gov kulczynsky(p, q, eps) Kulczynsky distance between provided vectors. Parameters: p (float ) : `array` 1D Vector. q (float ) : `array` 1D Vector. eps (float) Returns: The Kulczynsky distance between vectors `p` and `q`. --- github.comPine Script® libraryby RicardoSantosUpdated 111182
The Golden Candlestick PatternThe Golden pattern is a three-candlestick configuration based on a variation of the golden ratio (2.618) from the Fibonacci sequence. The bullish Golden pattern is composed of a normal bullish candlestick with any type of body, followed by a bigger bullish candlestick with a close price that is at least 2.618 times the size of the first candlestick (high to low). Finally, there must be an important condition that is, a third candlestick that comes back to test the open of the second candlestick from where the entry is given. The bearish Golden pattern is composed of a normal bearish candlestick with any type of body, followed by a bigger bearish candlestick with a close price that is at least 2.618 times the size of the first candlestick (high to low). Finally, there must be an important condition that is, a third candlestick that comes back to test the open of the second candlestick from where the entry is given.Pine Script® indicatorby Sofien-Kaabar332
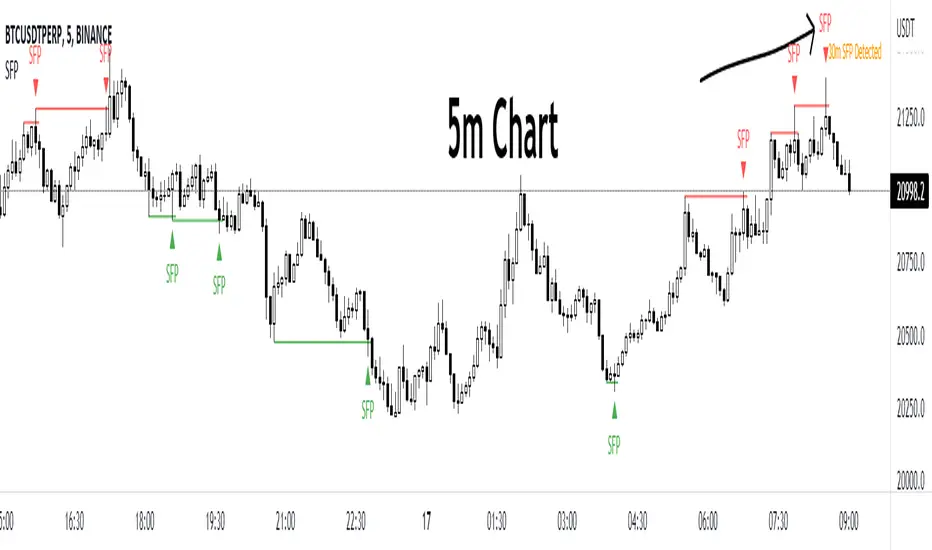
Swing Failure PatternThis script will remind you of a potential swing failure pattern (which is a grab for liquidity to go the other direction). You can't use this script on its own, hence the eyes to look for confluences ;-) Eyes will appear when the current high/low takes out the high/low of the last (by default) 100 highs/lows and will close below/above that last high/low. Extra settings: - ignore the last x amount of bars - choose a character instead of the eyes - choose a color for the character Happy trading! ;-)Pine Script® indicatorby Greg_00755 1.6 K
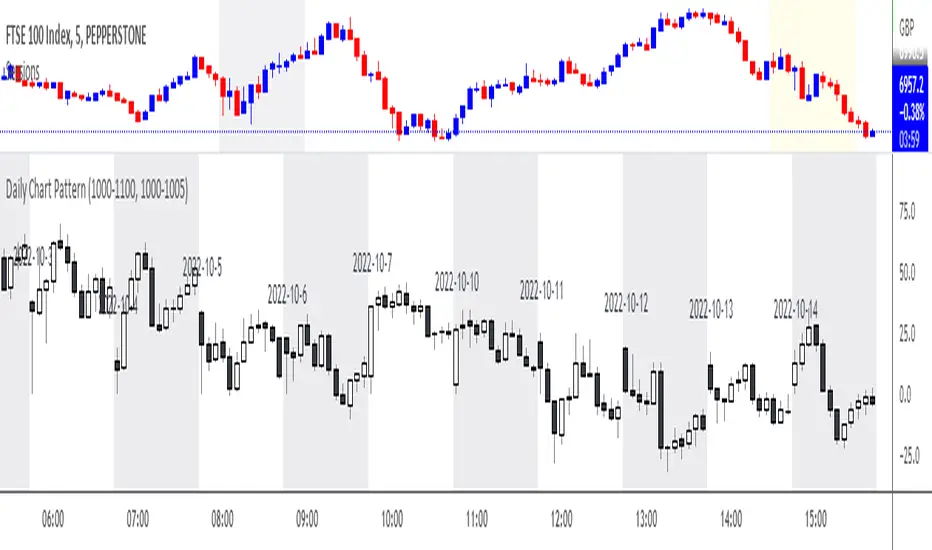
Daily Chart PatternWill automatically print all the candle pattern on the time range set, and move it to the right side for easy learning and simulationPine Script® indicatorby HastaAdhidayaUpdated 2237
Time Range Bar PatternThis will show candle pattern in separate window to maintain candle pattern and candle's shape consistently (as in big trading range, candle is much smaller and in small trading range, candle is much bigger) There are 4 parameters: - Bull color and bear color - clear enough - Candle Time Range - you can input time range you desire (remember you need to set the value based on chart time as well, for example if M5, then the time range need to be in M5 time range) - First Candle Time Range - need your help to input the first candle time range for easier calculation and visual (remember you need to set the value based on chart time as well, for example if M5, then the time range of first candle should be in 5 minutes period)Pine Script® indicatorby HastaAdhidayaUpdated 53
PopGun Trading, PG Pattern DetectorPopGun Bar Pattern Strategy PG Trading The indicator does the following: It detects the Outside Bar, the smaller inside Bar and the 3rd Pop Gun that is bigger, than the inside Bar. When the Pop Gun was detected, the indicator will calculate 3 targets for long and short trades. In our understanding, a Pop Gun is neutral. The next candles after the Pop Gun will decide if the PG breakout is bullish or bearish. So if one of the next candles after the PG is breaking the high or low of the PG Candle, this is a breakout confirmation and can traded long or short. We are using the PG Indicator for Stock, Futures and Index Trading. The Script uses 3 targets per default, but you can extend the target dots up to 6. If you want to see the targets in plain text, you can activate the PG Box. The targets are calculated really easy: Just the height of the candle multiplied with 1, 2 and 3 (4,5 and 6 additionally). In some communities there is an ATR calculation for more extended targets but it seems, that the ATR Calculation will sometimes lead to unreachable targets if the ATR is really high intraday... We trade PopGuns starting at M15 chart. I think PGs smaler than M15 are not worth a trade... Maybe i will add the ATR Function in the future just to compare the 2 ways to calculate PG targets. We are really doing well with 1,2,3 targets based on the PG Candle size. (Low to High). Please leave a comment if you have some feature requests or input to make this the best Pop Gun Indicator in Trading View ;-)Pine Script® indicatorby Roul_Charts11259
Swing Failure Pattern by EmreKbThe indicator detect to swing failure pattern and shows it. Swing Failure Pattern (or SFP) is a type of reversal pattern in which (swing) traders target stop-losses above a key swing low or below a key swing high to push the price in the other direction by generating enough liquidity.Pine Script® indicatorby EmreKb2727 3 K
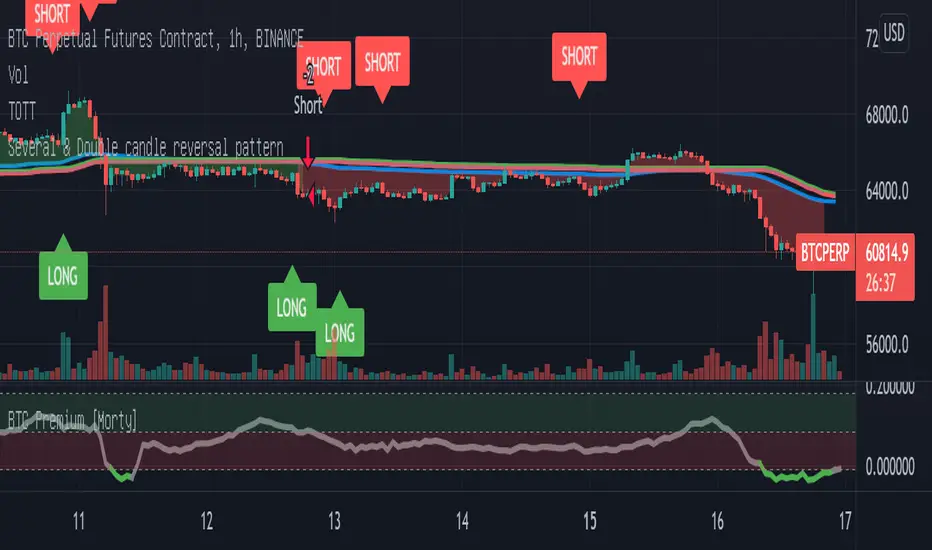
Double candlestick reversal patternDouble candlestick reversal pattern It can only be used as a reference for price behavior, and cannot be used alone. It must be combined with other indicators, otherwise it is useless This indicator does not constitute any investment advice, you are solely responsible for your profits and lossesPine Script® indicatorby Toby-JUpdated 84
Three Week Tight Pattern IndicatorThree Week Tight Pattern is a consolidation indicator which give extra buy point on strong fundamental stocks. You can read about it from IBD here: www.investors.com Pine Script® indicatorby GreatStockMark137