Price Action Toolkit Lite [UAlgo]The Price Action Toolkit Lite is a comprehensive indicator designed to enhance your chart analysis with advanced price action tools. This powerful toolkit combines multiple technical analysis concepts to provide traders with a clear visualization of market structure, liquidity levels, order blocks, and trend lines. By integrating these elements, the indicator aims to offer a holistic view of price action, helping traders identify potential entry and exit points, as well as key levels of interest in the market.
🔶 Key Features
Market Structure Analysis: The indicator includes a ZigZag feature to highlight significant market highs and lows, aiding in the visualization of market structure changes and trends.
Liquidity Sweeps Detection: It identifies and displays liquidity sweeps, which are crucial for recognizing potential market reversals and areas of interest where significant price action is likely to occur.
Order Blocks: Automatically detects and draws order blocks, highlighting areas of institutional buying and selling pressure, which can serve as key support and resistance levels.
Trend Lines: The toolkit can draw and extend trend lines based on pivot points, providing a clear view of prevailing market trends and potential breakout points.
Customizable Settings: Users can adjust various settings, including the length of the ZigZag, liquidity detection sensitivity, the number of order blocks to display, and trend line detection parameters, allowing for a tailored analysis experience.
🔶 Disclaimer
The "Price Action Toolkit Lite " is intended for educational and informational purposes only.
It is not financial advice and should not be construed as such. Trading in financial markets involves substantial risk, including the risk of loss.
Past performance is not indicative of future results.
🔷 Similar Scripts
Search in scripts for "price action"

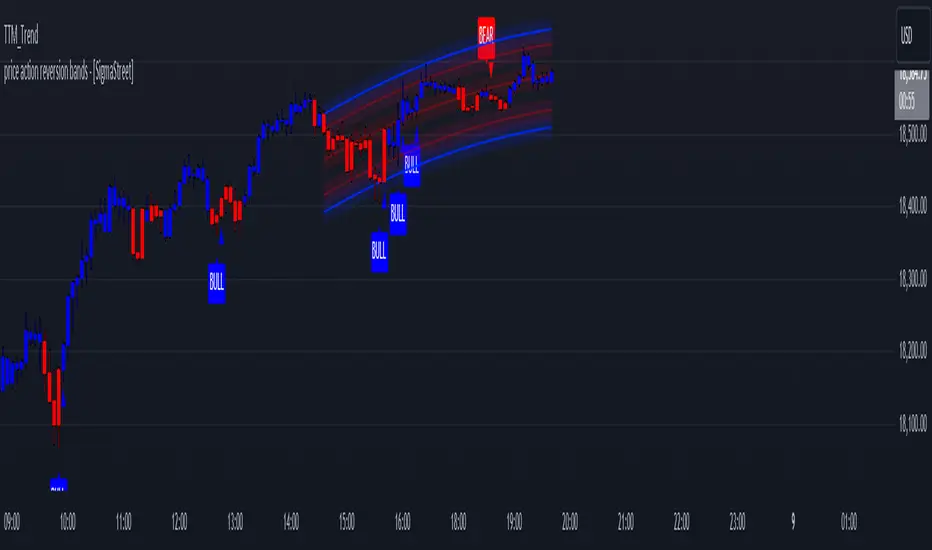
price action reversion bands - [SigmaStreet]█ OVERVIEW
The "Price Action Reversion Bands" is designed to help traders identify potential reversal zones through the integration of polynomial regression, fractal analysis, and pinbar detection. This tool overlays directly onto the price chart, providing dynamic visual cues and signals for market reversals. Its unique synthesis of these methodologies offers traders a powerful, multifaceted approach to market analysis.
█ CONCEPTS
Polynomial Regression Bands:
What It Does:
Models the main trend using a polynomial equation to create a middle trend line with dynamic support and resistance bands.
How It Works:
Calculates polynomial coefficients to plot a regression line and adjusts the bands according to market volatility and conditions.
Fibonacci Retracement Levels:
What It Does:
Provides additional lines inside the regression bands at key Fibonacci ratios to identify potential support and resistance areas.
How It Works:
Calculates retracement levels by identifying high and low points over the same period used to calculate the regression bands, applying Fibonacci ratios to these points.
Fractal Analysis:
What It Does: Identifies natural resistance and support levels, indicating potential reversal zones.
How It Works: Detects fractals based on a specific pattern of price action, using Williams Fractal methodology.
Pinbar Detection:
What It Does: Signals potential price reversals through pinbar candlestick patterns.
How It Works: Analyzes
candlesticks to identify pinbars which show a rejection of prices, suggesting possible reversals.
█ ORIGINALITY AND USEFULNESS
The price action reversion bands distinguishes itself through its innovative integration of several advanced analytical methods, providing traders with a holistic view of potential market reversals:
Unique Combination:
While many tools use these techniques in isolation, this indicator synergistically combines polynomial regression, Fibonacci retracement levels, fractal analysis, and pinbar detection. This multi-faceted approach allows traders to assess strength, potential reversal zones, and price rejection more effectively than using traditional single-method indicators.
Advanced Polynomial Regression Application:
Unlike standard regression tools that offer static insights, this indicator dynamically adjusts its regression bands based on real-time market volatility, providing a more accurate reflection of market conditions.
Enhanced Signal Reliability:
By using fractals and pinbars in conjunction to validate each other, the indicator significantly increases the reliability of its reversal signals. This dual-validation method filters out less probable signals, focusing on high-probability trading opportunities.
Customization and Flexibility:
It offers unprecedented customization options, allowing traders to fine-tune the tool according to their trading style and market conditions. Traders can adjust the polynomial degree, the sensitivity of the Fibonacci retracements, and even the definition of what constitutes a significant pinbar, making it highly adaptable to various trading scenarios.
Educational Value:
The indicator not only aids in trading but also serves as an educational tool that helps traders understand the interaction between different types of market analysis techniques. This contributes to a deeper knowledge base and better trading decisions over time.
These distinctive features make the "Price Action Reversion Bands - " not just another indicator but a comprehensive trading tool that enhances decision-making through a well-rounded analysis of market dynamics.
█ HOW TO USE
Installation and Setup:
Apply the indicator to your TradingView chart from the "Indicators" menu.
Select either polynomial regression or Fibonacci retracement as the basis for the bands through the indicator settings.
Reading the Indicator:
Monitor the approach of price to the upper and lower bands which indicate potential reversal zones.
Look for fractal and pinbar formations near these bands for additional signal confirmation.
Customization:
Adjust settings such as the polynomial degree, data window length, and engagement zones to tailor the bands to your trading style.
Modify visual aspects like color and line type for better clarity and personal preference.
█ FEATURES
Dynamic Adjustment:
Bands adjust in real-time based on incoming price data and selected settings.
Multiple Analysis Techniques: Combines several analytical techniques to provide a comprehensive view of potential market movements. The integration of polynomial regression with Fibonacci levels, supplemented by fractal and pinbar analysis, marks this tool as particularly innovative, offering a level of synthesis that enhances predictive accuracy and usability.
User-Friendly Customization: Allows for extensive customization to suit individual trading strategies and preferences.
█ LIMITATIONS
Market Dependency:
Performance may vary significantly across different markets and conditions.
Parameter Sensitivity: Requires fine-tuning of parameters to ensure optimal performance, which might demand a steep learning curve for new users.
█ NOTES
For best results, combine this tool with other forms of analysis, such as fundamental analysis and other technical indicators, to confirm signals and enhance decision-making.
█ THANKS
Special thanks to the PineCoders community the Pine Coders themselves for their foundational contributions to the concepts used in this script. Their pioneering work in the fields of technical analysis and Pine Script development has been invaluable. This script is a testament to the collaborative spirit of the TradingView developer community, integrating analytical techniques with innovative approaches to offer a tool that is both modern and cutting-edge.
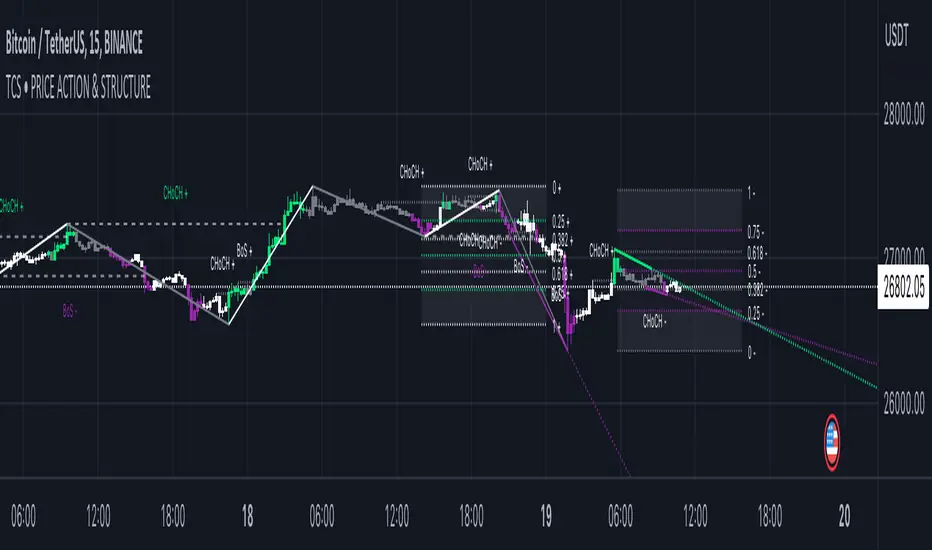
Price Action Toolkit | Flux Charts💎 GENERAL OVERVIEW
Introducing our new Price Action Toolkit indicator! Price Action Toolkit integrates key level strategy , traditional supply-demand analysis , and market structures to help traders in their decisions. Now with features that are available to use in multiple timeframes!
Features of the new Price Action Toolkit indicator :
Volumized Fair Value Gaps (FVGs)
Volumized Order & Breaker Blocks
Identification of Market Structures
Equal Highs & Lows
Buyside & Sellside Liquidity
Premium & Discount Zones
MTF Highs & Lows (Daily, Weekly, Monthly, Pre-Market)
Customizable Settings
📌 HOW DOES IT WORK ?
We believe that the analytical elements that are within this indicator work best when they co-exist with each other on the chart. Trading often requires taking multiple elements into consideration for better accuracy on market analysis. Thus, we combined some of the useful strategies in one indicator for ease of use.
1. Volumized Fair Value Gaps
Fair value gaps often occur when there is an imbalance in the market, and can be spotted with a specific formation on the chart.
The volume when the FVG occurs plays an important role when determining the strength of it, so we've placed two bars on the FVG zone, indicating the high & low volumes of the FVG. The high volume is the total volume of the last two bars on a bullish FVG, while the low volume is - of the FVG. For a bearish FVG, the total volume of the last two bars is the low volume. The indicator can also detect FVGs that exist in other timeframes than the current chart.
2. Volumized Order Blocks
Order blocks occur when there is a high amount of market orders exist on a price range. It is possible to find order blocks using specific formations on the chart.
The high & low volume of order blocks should be taken into consideration while determining their strengths. The determination of the high & low volume of order blocks are similar to FVGs, in a bullish order block, the high volume is the last 2 bars' total volume, while the low volume is the oldest bar's volume. In a bearish order block scenerio, the low volume becomes the last 2 bars' total volume.
3. Volumized Breaker Blocks
Breaker blocks form when an order block fails, or "breaks". It is often associated with market going in the opposite direction of the broken order block, and they can be spotted by following order blocks and finding the point they get broken, ie. price goes below a bullish order block.
The volume of a breaker block is simply the total volume of the bar that the original order block is broken. Often the higher the breaking bar's volume, the stronger the breaker block is.
4. Market Structures
Sometimes specific market structures form and break as the market fills buy & sell orders. Formed Change of Character (CHoCH) and Break of Structure (BOS) often mean that market will change direction, and they can be spotted by inspecting low & high pivot points of the chart.
5. Equal Highs & Lows
Equal Highs & Lows occur when there is a significant amount of difference between a candle's close price and it's high / low value, and it happens again in a specific range. EQH and EQL usually mean there is a resistance that blocks the price from going further up / down.
6. Buyside & Sellside Liquidity
Buyside & Sellside Liquidity zones are where most traders place their take-profits and stop-losses in their long / short positions. They are spotted by using high & low pivot points on the chart.
7. Premium & Discount Zones
The premium zone is a zone that is over the fair value of the asset's price, and the discount zone is the opposite. They are formed by the latest high & low pivot points.
8. MTF Highs / Lows
MTF Highs / Lows are actually pretty self-explanatory, you can enable / disable Daily, Weekly, Monthly & Pre-Market Highs and Lows.
🚩UNIQUENESS
Our new indicator offers a comprehensive toolkit for traders, combining multiple analytical elements with customizable settings to aid in decision-making across different market conditions and timeframes. The volumetric information of both FVGs and Order & Breaker Blocks will be present in your chart to serve you greater detail about them. The indicator also efficiently identifies market structures, liquidity zones and premium & discount zones to give you an insight about the current state of the market. And finally with the use of multiple timeframes , you can easily take a look at the bigger picture. We recommend reading the "How Does It Work" section of the descripton to get a better understanding about how this indicator is unique to others.
⚙️SETTINGS
1. General Configuration
Show Historic Zones -> This will show historic Fair Value Gaps, Order & Breaker Blocks and Sellside & Buyside liquidities which are expired.
2. Fair Value Gaps
Enabled -> Enables / Disables Fair Value Gaps
Volumetric Info -> The volumetric information of the FVG Zones will be rendered if activated.
Zone Invalidation -> Select between Wick & Close price for FVG Zone Invalidation.
Zone Filtering -> With "Average Range" selected, algorithm will find FVG zones in comparison with average range of last bars in the chart. With the "Volume Threshold" option, you may select a Volume Threshold % to spot FVGs with a larger total volume than average.
FVG Detection -> With the "Same Type" option, all 3 bars that formed the FVG should be the same type. (Bullish / Bearish). If the "All" option is selected, bar types may vary between Bullish / Bearish.
Detection Sensitivity -> You may select between Low, Normal or High FVG detection sensitivity. This will essentially determine the size of the spotted FVGs, with lower sensitivies resulting in spotting bigger FVGs, and higher sensitivies resulting in spotting all sizes of FVGs.
3. Order Blocks
Enabled -> Enables / Disables Order Blocks
Volumetric Info -> The volumetric information of the Order Blocks will be rendered if activated.
Zone Invalidation -> Select between Wick & Close price for Order Block Invalidation.
Swing Length -> Swing length is used when finding order block formations. Smaller values will result in finding smaller order blocks.
4. Breaker Blocks
Enabled -> Enables / Disables Breaker Blocks
Volumetric Info -> The volumetric information of the Breaker Blocks will be rendered if activated.
Zone Invalidation -> Select between Wick & Close price for Breaker Block Invalidation.
5. Timeframes
You can set and enable / disable up to 3 timeframes. Note that only higher timeframes than the current chart will work.
6. Market Structures
Break Of Structure ( BOS ) -> If the current structure of the market is broken in a bullish or bearish direction, it will be displayed.
Change Of Character ( CHoCH ) -> If the market shifts into another direction, it will be displayed.
Change Of Character+ ( CHoCH+ ) -> This will display stronger Change Of Characters if enabled.
7. Equal Highs & Lows
EQH -> Enables / Disables Equal Highs.
EQL -> Enables / Disables Equal Lows.
ATR Multiplier (0.1 - 1.0) -> Determines the maximum difference between highs / lows to be considered as equal. Lower values will result in more accurate results.
8. Buyside & Sellside Liquidity
Zone Width -> Determines the width of the liquidity zones, 1 = 0.025%, 2 = 0.05%, 3 = 0.1%.
9. Premium & Discount Zones
Enabled -> Enables / Disables Premium & Discount Zones.
10. MTF Highs / Lows
You can enable / disable Daily, Weekly, Monthly & Pre-Market Highs and Lows using this setting. You can also switch their line shapes between solid, dashed and dotted.

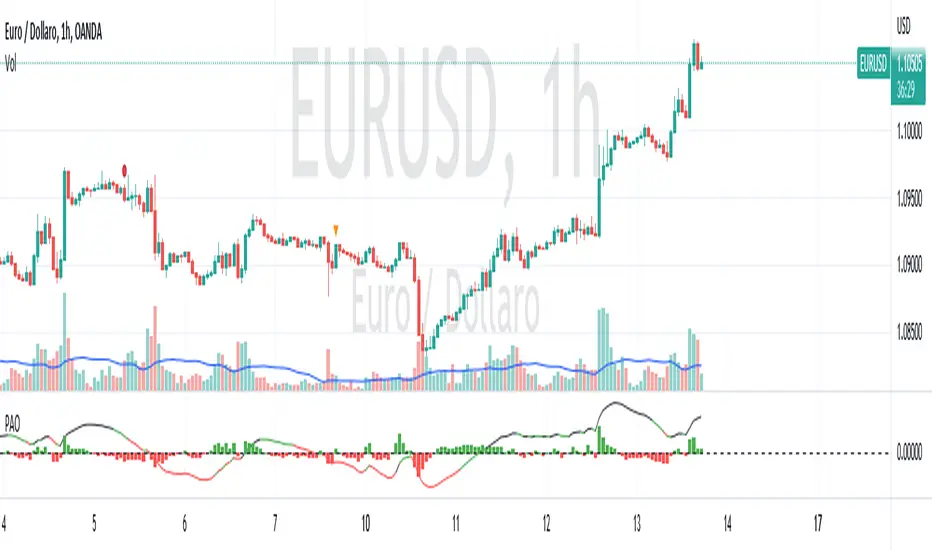
Price Action Oscillator with RSI--------- ENGLISH ---------
This oscillator combines the Price Action and the Relative Strength Index (RSI) to help identify potential buy and sell signals in a market. The Price Action Oscillator measures the difference between the closing price and a 20-period moving average, and then normalizes this value by dividing it by the standard deviation of the closing price from the same moving average. The result is an oscillator that oscillates around zero, with positive values indicating that the closing price is above the moving average and negative values indicating the opposite. The oscillator is then normalized again to smooth out the curve.
The RSI is also calculated using a 14-period setting. The color of the oscillator line is determined by its normalized value and the RSI level. A green color is used for averaging values, black for values when the RSI is above 70, and red for values when the RSI is below 30. A dashed line is also plotted at the zero level to help identify potential buy and sell signals.
Traders can use this script to identify potential buy and sell signals based on the cross of the oscillator line with the zero line, as well as the color of the oscillator line. A buy signal may be identified when the oscillator line crosses above the zero line and is colored black, while a sell signal may be identified when the oscillator line crosses below the zero line and is colored red.
---------- ITALIAN -------------
Questo oscillatore combina l'oscillatore Price Action e l'Indice di Forza Relativa (RSI) per aiutare a identificare potenziali segnali di acquisto e vendita in un mercato. L'oscillatore Price Action misura la differenza tra il prezzo di chiusura e una media mobile a 20 periodi, e poi normalizza questo valore dividendo la differenza per la deviazione standard della chiusura dalla stessa media mobile. Il risultato è un oscillatore che oscilla intorno allo zero, con valori positivi che indicano che il prezzo di chiusura è sopra la media mobile e valori negativi che indicano il contrario. L'oscillatore viene poi nuovamente normalizzato per levigare la curva.
L'RSI viene anche calcolato utilizzando una configurazione a 14 periodi. Il colore della linea dell'oscillatore è determinato dal suo valore normalizzato e dal livello RSI. Viene utilizzato il colore verde per i valori medi, nero per i valori quando l'RSI è superiore al 70 e rosso per i valori quando l'RSI è inferiore al 30. Viene anche disegnata una linea tratteggiata a livello dello zero per aiutare a identificare potenziali segnali di acquisto e vendita.
I trader possono utilizzare questo script per identificare potenziali segnali di acquisto e vendita in base all'incrocio della linea dell'oscillatore con la linea dello zero, nonché al colore della linea dell'oscillatore. Un segnale di acquisto può essere identificato quando la linea dell'oscillatore incrocia sopra la linea dello zero e viene colorata di nero, mentre un segnale di vendita può essere identificato quando la linea dell'oscillatore incrocia sotto la linea dello zero e viene colorata di rosso.
Price Action Trading System v0.3 by JustUncleL with modifcationsThe base of this script is the Price Action Trading System from JustUncle .
I have first combined it with script ADX and DI by BeikabuOyaji to indicate when the +DI is above the -DI and the ADX is above 20. This is represented by crosses at the top of the page: green indicating that the +DI is above the -DI and ADX above 20, and red if -DI is above the +DI and ADX above 20. If the ADX is increasing in slope while the +DI is above the -DI, an up green arrow is shown at the bottom of the page, indicating an increase in this trend, and the slope of the ADX is increasing and the -DI is above the +DI, a down arrow is shown at the bottom. One could think to a green cross with a green up arrow as a potential buy opportunity, and a red cross with a red down arrow as a potential sell opportunity.
Next, I have combined this script with the Indicator: WaveTrend Oscillator from Lazybear . If the oscillator has readings below -45 and the slope of the line is increasing, a green diamond appears above the chart. This indicates a potential buy opportunity. If the oscillator has readings above 50 and the slope of the line is decreasing, a red diamond appears above the chart. This indicates a potential sell opportunity. Now if the slope of the oscillator is rising significantly but does not hit the -45 threshold to start its increase, but is negative in value, a green flag appears at the top of the page. This represents a potential buy opportunity. If the slope of the oscillator is significantly decreasing and is positive in value, a red flag appears at the bottom of the page. This represents a potential sell opportunity.
The base of this script, the Price Action Trading System v0.3 by JustUncle , has many of its own features that I have kept. If the MACD is positive, the background colour is green. If it is negative, the colour is red. If the CCI and RSI indicate an oversold opportunity and the MACD is positive, you get an up olive arrow below the chart. If they indicate an overbought opportunity and the MACD is negative, you get a red down arrow above the chart. If the CCI value stays oversold after a green arrow, the candle chart turns turquoise, and if overbought, turns black after a red arrow.
You can use these indicators in combination to help you with your trading strategy.

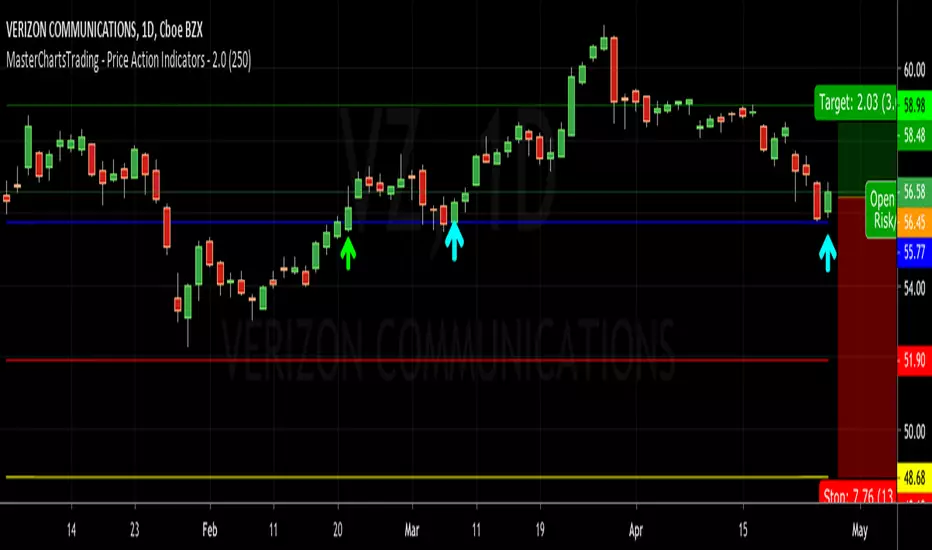
MasterChartsTrading - Price Action Indicators - 2.0Price action is easy to visualize.
It is very easy to read price action if you have a reference point. These support/resistance lines are there to help you read where the buyers and sellers are likely to make a stand.
You can also think of these indicators as moving pivot points.
MasterChartsTrading Price Action Indicators show good price levels to enter or exit at trade.
The Blue indicator line serves as a Bullish Trend setter.
If your instrument closes above the Blue line, we think about going Long (buying).
For commodities and Forex, when your trading instrument closes below the Red line, we think about Shorting (selling).
For Stocks, I prefer to use the Yellow line as my Bearish Trend setter (on Daily charts ).
Be sure to hit that Follow button! Please find me on social networks via the link on my profile page for more ideas from @MasterCharts!
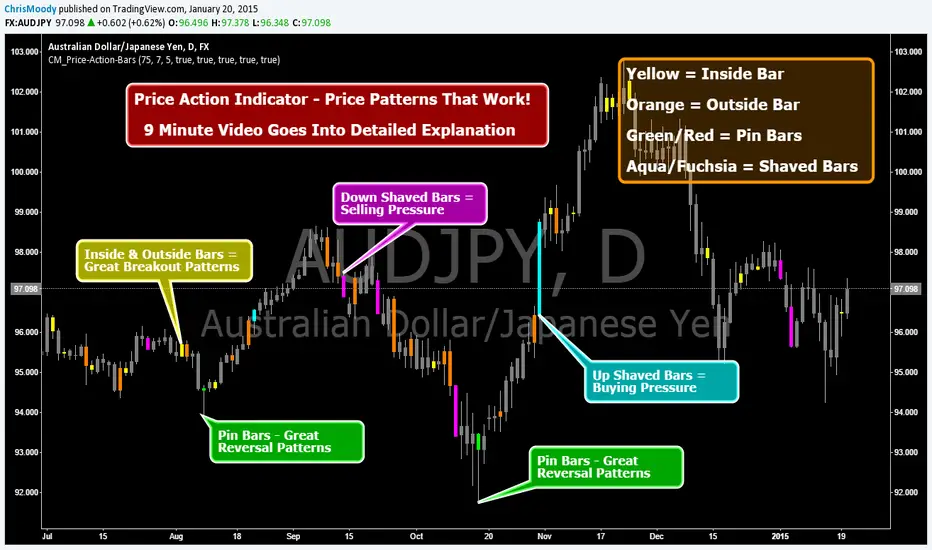
CM_Price-Action-Bars-Price Patterns That Work!Price Action Indicator - Price Patterns That Work!
9 Minute Video Goes Into Detailed Explanation
4 Simple but Effective Price Patterns!
Yellow = Inside Bar – Breakout Patterns
Orange = Outside Bar – Breakout Patterns
Green/Red = Pin Bars
Aqua/Fuchsia = Shaved Bars
***MANY Features and Customizing Options…Detailed Overview In Video.
How To Turn Bars Patterns On And Off.
Ways To Customize.
General Thought Process of the 4 Price Action Patterns.
What Each Setting in the Inputs Tab Does.
***Special Announcement. Video Below Just Updated. Received a Special Promotion from the creator of these Price Action Bars and Many other Price Action Setups. Hedge Fund Manager and Founder of 2ndSkiesForex.com Chris Capre.
1st 10 minutes of Video is covering throughout process and how to implement the Indicators.
2nd 12 minutes covers a Special Promotion offered to TradingView members directly from Chris Capre.
Video Link Below.
vimeopro.com
This Version of the video will be taken down 2/01/2015 and the original video will be uploaded again.
Price Action Strength/Machine Learning Hybrid Score SystemThis indicator combines Price Action Strength (PAS) with a Machine Learning (ML) derived signal to form a dynamic hybrid momentum model. It helps visualize underlying trend quality and predictive strength, and includes optional Bollinger Bands for volatility context.
PAS (Price Action Strength):
Measures directional momentum using the slope of a linear regression and candle body bias. The slope can be normalized by ATR or price and is smoothed using EMAs for stability.
ML Score:
Computes a predictive signal using multiple technical features (such as distance from recent highs/lows, EMA change, SMA slope, and MACD histogram). The result is z-scored and smoothed via WMA for noise reduction.
Hybrid Score:
Dynamically weights PAS and ML signals. PAS dominates when ML confidence is low; ML influence increases as predictive strength rises. Produces a smooth, normalized hybrid curve oscillating around zero.
Bollinger Bands (optional):
Can be plotted on the ML smooth line, PAS normalized line, or Hybrid Score (selectable). Configurable length and multiplier to visualize volatility and overbought/oversold zones.
Visualization:
- PAS (blue), ML (orange), and Hybrid (aqua) plotted together.
- Background shading indicates bullish (green) or bearish (red) hybrid momentum.
- Optional Bollinger Bands for visual reference.
Inputs:
- PAS length, smoothing, and signal EMA
- ATR normalization toggle
- ML toggle, smoothing, and weighting scale
- Bollinger Bands toggle, source, length, and multiplier
Usage:
- Hybrid Score above zero suggests bullish momentum
- Hybrid Score below zero suggests bearish momentum
- Bollinger Band extremes can highlight potential turning points
- Better results on higher timeframes (i.e. 1H+)
Companion Indicator:
This indicator pairs with "PAS/ML Hybrid Score System Metrics & Signals " , a separate tool that displays trade signals and performance metrics directly on the price chart. Use both together for a full analytical workflow.

Price Action Patterns DetectorIt's something like "Price Action Candlestick Pattern Detector." That is, it's an indicator that detects not only Pinbars and Engulfing but also all popular candlesticks in Price Action (Doji, Hammer, Shooting Star, Inside Bar, etc.)

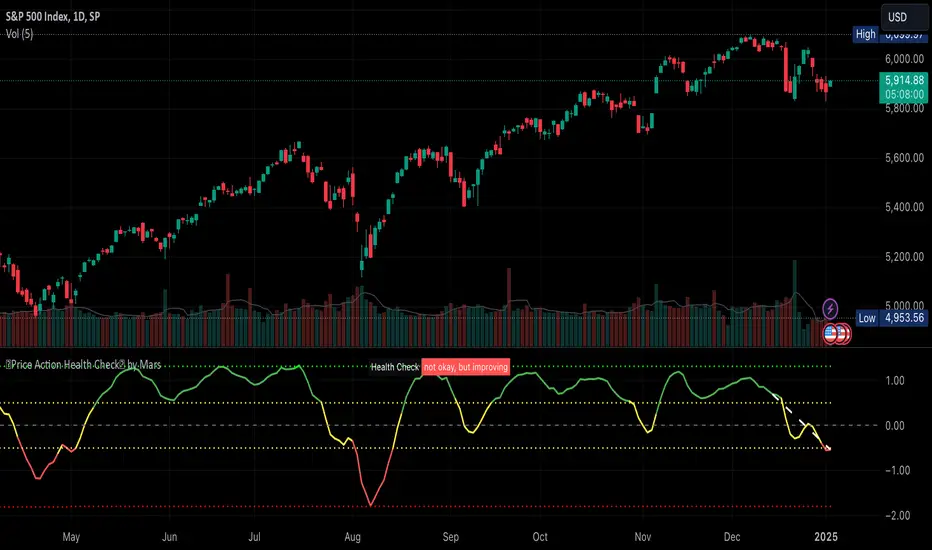
Price Action Health CheckThis is a price action indicator that measures market health by comparing EMAs, adapting automatically to different timeframes (Weekly/Daily more reliable) and providing context-aware health status.
Key features:
Automatically adjusts EMA periods based on timeframe
Measures price action health through EMA separation and historical context
Provides visual health status with clear improvement/deterioration signals
Projects a 13-period trend line for directional context
Trading applications:
Identify shifts in market health before major trend changes
Validate trend strength by comparing current readings to historical averages
Time entries/exits based on health status transitions
Filter trades using timeframe-specific health readings
I like to use it to keep SPX in check before deciding the market is going down.
Note: For optimal analysis, use primarily on Weekly and Daily timeframes where price action patterns are more significant.
Price Action SignalsIndicator that shows buy/sell signals based on price action as it relates to a 20 day moving average. If the candle is above the 20 day moving average, we look for candles with long wicks on the top indicating selling pressure. If the candle is below the 20 day moving average we look for candles with a long bottom wick indicating buying pressure. The rules for the wick and the price action can be modified by the user. The two user defined parameters are price movement and wick length.
For instance, the user can choose to only show arrows when candle has moved by X amount. The smaller the timeframe, the smaller the amount. I Recommended the following values when looking at SPY:
On a 1m chart: .10 cents
5min chart: .15 cents
15m chart: .25 cents
1h chart: 1 dollar,
1D chart: 2 dollars
Your mileage will vary.
With the wicks, you choose a percentage. You can choose to only show an arrow above or below a candle if the wick size is at least x% the size of the candle body.

Price Action All In One IndicatorIf you are the one who is "Price Action" style & does not want to use many indicators or complex indicators or you are an ICT (The Inner Circle Trader)
student or ICT charter, this simple beautiful All In One Indicator is right for you.
The indicator has the following functions.
TIME ZONE SETTING
The default timezone is New York Time GMT-4, if you leave the time zone setting blank, it will use the symbol timezone. Note that the trading time changes with one hour delay in winter. so if you just trade forex, and leave the time zone setting blank, TradingView will adjust the symbol timezone automatically for you or don't forget to change the timezone setting GMT-4 or GMT-5 depending on daylight saving time.
STATISTIC PANEL
You can choose which panel to show through settings.
Session Info Panel : pips info of ADR, Asian, London, and New York sessions.
Trend Panel : showing trend (up/down) of
5m/15m/1h/4h/D/W time frames (TF)
4MA (default values: SMA with lengths: 20–50–100–200)
Money Management Panel : in trading, money management is very important. Just put the % risk, & stop loss value below, the indicator will calculate a suitable size/amount for each trade.
Size by Lots: input stop loss in pips
Size by Units: input stop loss in % (of price)
(*)Units size is calculated by % stop loss & current bar close price. You have to determine a stop-loss price to convert to % stop loss by yourself.
TIME SEPARATORS
We can choose which time separators we want to display. The indicator has 5 options: Anchor Time/Day/Week/Month/Quarter. Of course, we can choose to show just one or all 5 of them.
With Anchor Time you can choose which time you want to draw a vertical line for better timing analysis. This can show up to 2 Anchor Time lines. The default values are 00:00 (New York Midnight Opening) and 08:30 (New York Session Opening). You also have an option to show the past lines or not.
About Day Separator, cause TradingView has supported Session Breaks in Setting but if you don't like to use it or when enabling, it distracts you, you can use mine. My favorite trading dates are Tuesday & Wednesday.
PRICE LEVELS
For intraday trading, the high/low/close of the previous day, the previous week, ADR (default period is 5) are very important key levels. You can choose which one you like to show for better analysis. Of course, you can change the color & style of the lines. This is also my favorite indicator.
This indicator also has an option to show up to 2 price lines at a specific time, you can choose the price type (high/low/close/open) that you want to display. The default time values are:
Specific Time 1: 0:00. (New York Midnight Opening Price)
Specific Time 2: 8:30 am. (New York Session Opening Price)
ACCUMULATION ZONE
The market tends to reprice the higher/lower to the old high/low or imbalance/fair value price to promote buy/sell stops or to provide smart money pricing for long/short entries. Typically, it redistributes quickly and you must learn to anticipate them at key levels intraday. Weak short/long holders will be squeezed in the retracement.
Except for the open price, the price changes continuously until the closing time, so the accumulation area can also be changed in real-time, but if you combine it with other information when analyzing, you can predict/determine whether the zone has been established or not with high probability. In short, price needs time to be accumulated, I usually don't pay attention to this daily zone till London open/close or New York sessions
Not only daily zone, but the indicator also supports higher timeframes accumulation zone from
SESSION & STD
There are 3 sessions: Asian, London, New York. The default values are below (New York Time).
Asian: 19:00 ~ 00:00
London Open (London KillZone): 01:00 ~ 05:00
New York Open (New York KillZone): 07:00 ~ 10:00
If you do not want to show the label, just leave the label values blank or change them to whatever you want.
This is one of my favorite functions. I use it on 15m, 30m, 1h TF for Forex intraday trading. My favorite trading sessions are London Open & New York Open.
You also can choose to show or not Standard Deviations (STD). The default values are set for Asian Range STD and max STD levels can be shown are 5. I use the following 3 types of STD (New York Time):
CBDR (Central Bank Deviations) STD: 14:00 ~ 20:00
Flout STD: 15:00 ~00:00
Asian Range STD: 19:00 ~ 00:00
LOOKBACK HIGH/LOW/MID
Can show high/low/mid of the data ranges on the daily/4h chart. The default values are:
- 20–40–60 days back from today for daily TF.
- 30–60–90 bars back from the latest bar for 4h TF.
The default anchor bar for calculating the lookback is the latest one but with:
- 4h TF: we can change the lookback from the 1st day of the week.
- Daily TF: we can change the lookback from the 1st day of the month.
The indicator also has options showing the high/low/mid (equilibrium level) lines for better analysis. Especially, on daily TF, we have the option that can show up to 4 lines (25% for each one) of the data range.
Of course, you can change the colors or the style of the high/low/mid lines.
The lookback can be shown on the lower TFs for better detection when the market structure is shifted.
MAGIC BARS
Fractal bar : The bar's color is changed when the divergence occurs between the price & RSI. You can change the RSI period (default value is 14) & RSI source. (open/high/low/close,…)
Imbalance bar or liquidity void or fair value gap - whatever you call it. This is my favorite indicator when trading on all TFs.You can choose to extend the last n imbalance bars if you like in the settings. I make sure I covered all cases of imbalance/fair value gap.
OLD HIGH/LOW
First, this function is not used as the common Support & Resistance that retail traders usually use, so I call it Old High/Low. I usually use it in 2 ways:
Detect the next buy/sell stops that Market Makers aim to manipulate.
Detect whether market structure shifted or not (Break of structure)
In settings you can:
Set the period to detect high/low levels, the default value is 10. My other favorite values are 6 & 2.
On a lower time frame, you might want to set it to a large number to remove noise.
On a higher time frame, a small number is enough, I think.
Choose the numbers of the last lines you want to show on your chart.
Of course, the style of lines can be changed easily.
TRENDLINES
A very simple trendline with default pivot left strength is 10.
By default, trendline uses high/low price but you have the "Using close price" option.
LINEAR REGRESSION CHANNEL
The Linear Regression Channel is a three-line technical indicator used to analyze the upper and lower limits of an existing trend. It is a statistical tool used to predict the future from past data and is used to determine trend direction or when prices may be overextended.
You can choose
To fill the background or not
To show inner/outer lines or not
To change the colors/line styles of upper zone, lower zone, upper lines, lower lines, midline
DIRECTION BOX
Working on all TFs, this looks like the same with lookback function but if you would like to display them in a box for easily focusing/comparing with other symbols or for detecting divergence in a specific period. The indicator also has a setting to show or hide lines connecting between lows or highs.
Another example of how I use High/Low connecting lines to detect divergence between S&P 500 and NASDAQ 100.
ZIG ZAG
Can show up to 2 ZigZag lines.
This is suitable for traders who have difficulty in detecting key levels (recent high/low) of the prices to confirm market structure or just for drawing Fibonacci easily at those levels.
MA (Moving Average)
I believe that this is one of the most used indicators for every trader. There are 5 types of MA to choose from: EMA, SMA, WMA, VWMA, SMMA(RMA).
This can show up to 4 MAs. You can choose the source (close/high/low,…) for each one. My favorite values are 34 & 89 EMA.
This indicator also supports MA Bands. You can select which MA you want to display the bands, and the "width" of the bands can be changed via the settings.
WATERMARK
It's just a simple function but I think it's very useful for those who want to add Copyright info to the chart, to prevent others from copying it.
Others/known issues/limitations
In forex or stock (things that are traded only on weekdays), TradingView's does not include the latest bars till Monday so the Day Separator cannot fill that space. Because TradingView deals with those bars as Sunday's ones so I set the color of Sunday the same as Friday for good UI/UX. On Crypto charts, the indicator shows without problems.
If you see "Internal server study error", please try closing the current TradingView tab in your browser and reopening it in a new tab. The error will disappear.
Because TradingView does not provide any detailed error information when such "general error" occurs. It's very difficult to detect which function is causing this error or is there something that caused TradingView "overloaded" through a long time running/loading on that tab? Honestly, I don't know exactly the cause, but in my experience, this error often occurs in the following cases:
When you have the TradingView Tab open for hours. In my case, I usually leave TradingView tab open overnight & when I come back the next day, this error might appear. (I'm a Mac user & I almost never shut down my Mac)
When you change settings too many times, especially settings of drawing objects like line width in a using session, it might cause this error.
So, after changing the setting or when you come back for the next trade, please save & close that TradingView tab, and then open a new one, everything will work fine.
You can see the images below that show I have tested my indicator from 1-minute time frame, enabled all functions, change every setting to max values & everything still works fine.

Price Action IndexI've created a simple oscillator which I think does a good job of easily showing you when price is worth watching or not. I think all too often you get stuck looking at something like an RSI and end up trading noise.
From my observations and experiences, I've found that there are 2 major catalysts for price movement--
Price is either trending and reaches a top or bottom, or
Price is consolidating and ready to make a move in some direction
These movements can be seen quite well from a Bollinger Band, which is what mostly gave me the inspiration. When I watch a chart with a BB on it I see that either you're looking to trade price moving out of a squeeze or riding price up/down the band until it crosses over and makes a move to the moving average.
My solution was to multiply the direction of price by the strength of its deviation.
Price gets converted into a signal between -1.0 (bottom of the range) and 1.0 (top of the range)
Standard Deviation gets converted into a stochastic signal between 0 (next to no deviation from mean) and 100 (highest deviation in lookback)
These 2 get multiplied by each other
The result tells you if price action is trending bullish and if its approaching max strength (perhaps Overbought), example: Price is hitting highs (1.0) and deviation is also at its highest (100) = 100, opposite for bearish
Result can also tell you if price is at the top of the range but the deviation is so tiny and we're mostly pinned to the mean (1.0 * 5 = only 5)
How to Trade this Indicator--
If the indicator is stuck near the middle and purple:
- Don't make directional trades or you'll be eaten alive by the chop
- Good idea to sell options, Iron Condors/Butterflies, etc
- Wait for a move to breakout --> the purple will fade away and give way to a direction
--- As in all trading scenarios, be mindful of fakeouts/short moves to one direction that very quickly get reversed
If the indicator is heading higher:
- This would indicate there is a bull trend going on, get long
- If we are reaching the overbought area, this is an ideal place to take profits or look at spreads like Bearish Call Spreads (sell calls)
- I think you can make your own determination of when to sell by either selling when we're in the overbought area (if it reaches there) or staying bullish so long as it is above the zone
If the indicator is heading lower:
- Bear trend, shorting is possible
- Can use this as a contrarian signal to buy lows
A couple of charts with the indicator and a purple squeeze box I've drawn (can sometimes get noisy in real-time, but hindsight is 20/20)--
Bitcoin on Daily with default 20 length
Gamestop on 30 minute time frame with 100 length
Please feel free to use this indicator for your trading or your own indicators. This particular script is very stripped down/bare bones from what I have been working on as an ongoing project. If TradingView ever returns scripts you can sell, I would probably open that up for a small premium.

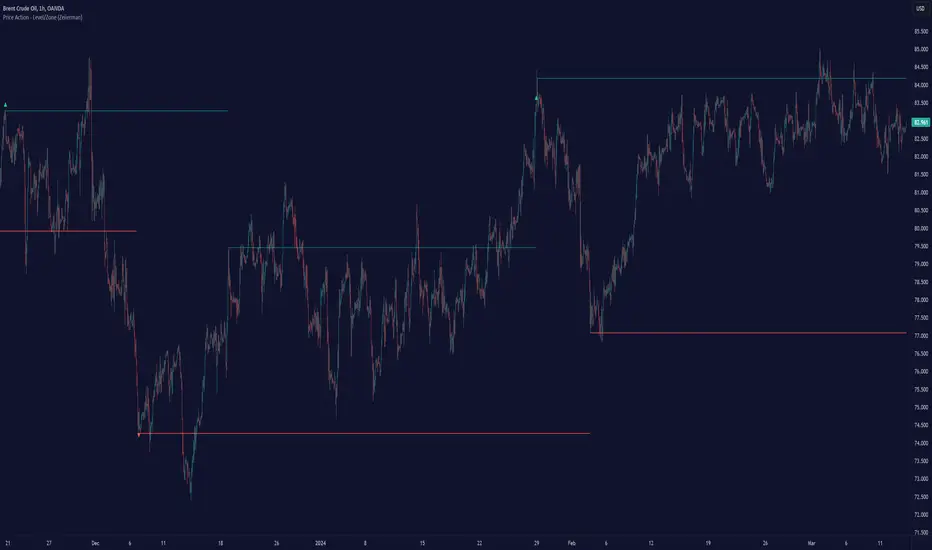
Price Action - Level/Zone (Expo)Price Action - Level/Zone (Expo) indicator identifies buying and selling pressure that has an impact on the price movement. This is visualized by a Zone, or Levels or with Barcolors depending on which settings are used.
Depending on the selected settings the indicator can identify buying and selling pressure which pushes the price further in the trend direction and it can show exhausted buyers/sellers which is seen in reversal points.
HOW TO USE
1. Use the indicator to identify buying and selling pressure.
2. Use the indicator to identify exhausted buyers and sellers.
3. Use the indicator to identify reversal points, pullbacks, or trend shifts.
4. Use the indicator to buy/short-sell breakouts of the zones.
5. Use the indicator to buy/short-sell when the price re-test the zones.
-> Try the indicator on Heikin Ashi Candles , but it works as good at any type of candlestick, bars, Renko, or line break.
INDICATOR IN ACTION
4 hour chart
4 hour chart
I hope you find this indicator useful , and please comment or contact me if you like the script or have any questions/suggestions for future improvements. Thanks!
I will continually work on this indicator, so please share your experience and feedback as it will enable me to make even better improvements. Thanks to everyone that has already contacted me regarding my scripts. Your feedback is valuable for future developments!
ACCESS THE INDICATOR
• Contact me on TradingView or use the links below
-----------------
Disclaimer
Copyright by Zeiierman.
The information contained in my scripts/indicators/ideas does not constitute financial advice or a solicitation to buy or sell any securities of any type. I will not accept liability for any loss or damage, including without limitation any loss of profit, which may arise directly or indirectly from the use of or reliance on such information.
All investments involve risk, and the past performance of a security, industry, sector, market, financial product, trading strategy, or individual’s trading does not guarantee future results or returns. Investors are fully responsible for any investment decisions they make. Such decisions should be based solely on an evaluation of their financial circumstances, investment objectives, risk tolerance, and liquidity needs.
My scripts/indicators/ideas are only for educational purposes!
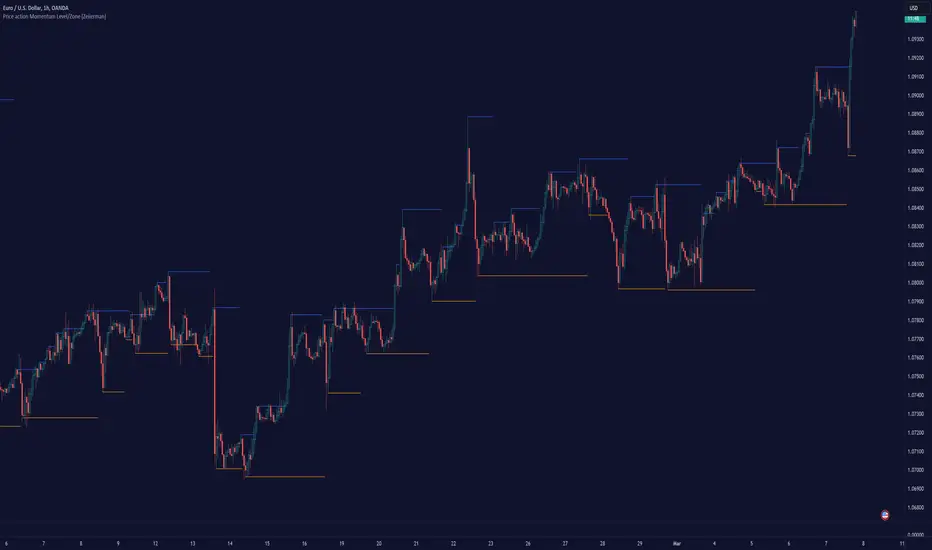
Price action Momentum Level/Zone (Expo) Price action Momentum Levels/Zones (Expo) indicator identifies relatively stronger Up and Down Momentum. This is visualized by a Zone, or Levels or with Barcolors depending on which settings are used.
When the market has relatively stronger momentum it can be a sign that the sellers or buyers are exhausted and the market has to pause, make a pullback, or make a trend shift.
HOW TO USE
1. Use the indicator to identify relatively stronger momentum.
2. Use the indicator to identify pullbacks or trend shifts.
3. Use the indicator to buy/short-sell breakouts of the zones.
4. Use the indicator to buy/short-sell when the price re-test the zones.
INDICATOR IN ACTION
4 hour chart
I hope you find this indicator useful , and please comment or contact me if you like the script or have any questions/suggestions for future improvements. Thanks!
I will continually work on this indicator, so please share your experience and feedback as it will enable me to make even better improvements. Thanks to everyone that has already contacted me regarding my scripts. Your feedback is valuable for future developments!
ACCESS THE INDICATOR
• Contact me on TradingView or use the links below
-----------------
Disclaimer
Copyright by Zeiierman.
The information contained in my scripts/indicators/ideas does not constitute financial advice or a solicitation to buy or sell any securities of any type. I will not accept liability for any loss or damage, including without limitation any loss of profit, which may arise directly or indirectly from the use of or reliance on such information.
All investments involve risk, and the past performance of a security, industry, sector, market, financial product, trading strategy, or individual’s trading does not guarantee future results or returns. Investors are fully responsible for any investment decisions they make. Such decisions should be based solely on an evaluation of their financial circumstances, investment objectives, risk tolerance, and liquidity needs.
My scripts/indicators/ideas are only for educational purposes!
Price action by AtonidasThere are 2 main functions in this "tool/indicator":
Price action indicator and alert: By default, this does not show opposite trend price action unless you turn it on in the indicator setting!
4 EMA indicators: Hide this indicator by the tickbox in the indicator setting!
If there are any bugs, please let me know.
Thanks

Price Action and 3 EMAs Momentum plus Sessions FilterThis indicator plots on the chart the parameters and signals of the Price Action and 3 EMAs Momentum plus Sessions Filter Algorithmic Strategy. The strategy trades based on time-series (absolute) and relative momentum of price close, highs, lows and 3 EMAs.
I am still learning PS and therefore I have only been able to write the indicator up to the Signal generation. I plan to expand the indicator to Entry Signals as well as the full Strategy.
The strategy works best on EURUSD in the 15 minutes TF during London and New York sessions with 1 to 1 TP and SL of 30 pips with lots resulting in 3% risk of the account per trade. I have already written the full strategy in another language and platform and back tested it for ten years and it was profitable for 7 of the 10 years with average profit of 15% p.a which can be easily increased by increasing risk per trade. I have been trading it live in that platform for over two years and it is profitable.
Contributions from experienced PS coders in completing the Indicator as well as writing the Strategy and back testing it on Trading View will be appreciated.
STRATEGY AND INDICATOR PARAMETERS
Three periods of 12, 48 and 96 in the 15 min TF which are equivalent to 3, 12 and 24 hours i.e (15 min * period / 60 min) are the foundational inputs for all the parameters of the PA & 3 EMAs Momentum + SF Algo Strategy and its Indicator.
3 EMAs momentum parameters and conditions
• FastEMA = ema of 12 periods
• MedEMA = ema of 48 periods
• SlowEMA = ema of 96 periods
• All the EMAs analyse price close for up to 96 (15 min periods) equivalent to 24 hours
• There’s Upward EMA momentum if price close > FastEMA and FastEMA > MedEMA and MedEMA > SlowEMA
• There’s Downward EMA momentum if price close < FastEMA and FastEMA < MedEMA and MedEMA < SlowEMA
PA momentum parameters and conditions
• HH = Highest High of 48 periods from 1st closed bar before current bar
• LL = Lowest Low of 48 periods from 1st closed bar from current bar
• Previous HH = Highest High of 84 periods from 12th closed bar before current bar
• Previous LL = Lowest Low of 84 periods from 12th closed bar before current bar
• All the HH & LL and prevHH & prevLL are within the 96 periods from the 1st closed bar before current bar and therefore indicative of momentum during the past 24 hours
• There’s Upward PA momentum if price close > HH and HH > prevHH and LL > prevLL
• There’s Downward PA momentum if price close < LL and LL < prevLL and HH < prevHH
Signal conditions and Status (BuySignal, SellSignal or Neutral)
• The strategy generates Buy or Sell Signals if both 3 EMAs and PA momentum conditions are met for each direction and these occur during the London and New York sessions
• BuySignal if price close > FastEMA and FastEMA > MedEMA and MedEMA > SlowEMA and price close > HH and HH > prevHH and LL > prevLL and timeinrange (LDN&NY) else Neutral
• SellSignal if price close < FastEMA and FastEMA < MedEMA and MedEMA < SlowEMA and price close < LL and LL < prevLL and HH < prevHH and timeinrange (LDN&NY) else Neutral
Entry conditions and Status (EnterBuy, EnterSell or Neutral)(NOT CODED YET)
• ENTRY IS NOT AT THE SIGNAL BAR but at the current bar tick price retracement to FastEMA after the signal
• EnterBuy if current bar tick price <= FastEMA and current bar tick price > prevHH at the time of the Buy Signal
• EnterSell if current bar tick price >= FastEMA and current bar tick price > prevLL at the time of the Sell Signal

Price Action ChannelsHere are the brand new Price Action Channels.
As time passes and the portfolio grows not only in volume but in assets managed, I have found out that what's needed from technical analysis can't occupy so much time in decision making. Why? I hope you take into consideration other critical variables that affect the market, such as fundamentals, market sentiment, news, the world economy, and so on. Thus, I want to make obvious TA is not supposed to give you miracle formulas. In my investments, technicals count for about 33% of my decision formula.
Now about the indicator.
I'm a big fan of simplicity, and the fact is, everything is numbers and their universal rules.
So the approach we take is entirely following rules of statistics, taking into consideration the maximum amount of data to quantify and qualify moves(changes in price towards a single direction).
Once those moves are defined, we measure their average size, which is the average price range in one direction.
After that, we qualify them by using frequencies and figuring out how often each move happens, let's say:
Asset X, 10% of the times when it moves upwards it's +1%
Asset X, 14% of the times when it moves upwards it's +1,1%
Asset X, 21% of the times when it moves upwards it's +1.3%
Asset X, 25% of the times when it moves upwards it's +1.5%
Asset X, 15% of the times when it moves upwards it's +1.6%
Asset X, 10% of the times when it moves upwards it's +1,7%
Asset X, 5% of the times when it moves upwards it's +2%
With that data, we establish the size of the range and the most reasonable boundaries and thresholds.
This is meant for channels. We consider there are 3 market conditions: Channels(Trending), Sideways, Spikes(abnormal price changes).
So if you try to apply this indicator for huge movements, like news related pumps and such it won't work as it's supposed, since our approach here is to define what's "normal", and such spikes are anomalies.
Sideway assets are doable but not advisable.
We plot all the numbers in a panel, so it's easily readable while trading, and you can fully control where it appears on your screen.
The indicator counts with following features in the Panel:
Channel Sampling Size: Short-term, Mid-term, Long-term
Risk Exposure: Minimum, Low, Modest, Medium, Moderate, High, Maximum
Filtered Price Action
Trading Assist
X & Y Panel Position
Study Strong.

Price Action - Delivery Algorithm (Zeiierman)█ Overview
Price delivery algorithms in trading refer to complex computational algorithms used to determine the optimal price for executing trades. These algorithms are particularly relevant in electronic and algorithmic trading environments where large volumes of trades are executed automatically.
These algorithms are designed to analyze market data, including prices, volumes, and historical trends, to determine the most favorable price at which to execute a trade. They can take into account various factors such as market liquidity, price impact, and timing to optimize trade execution.
█ How It Works
Optimal price zones can be calculated in many different ways; we have decided to use a cycle method that determines the current dominant trend. The indicator functions by isolating a trend within a specific frequency range from various data.
Filter Logic and Loop:
The indicator computes a weighted average of historical prices over a range of past data points. It employs a loop to iterate over these past data points, applying a unique weight to each, depending on its position relative to the trend period.
Weight Calculation:
Weights are determined using triangle wave functions. The triangle wave function ensures that the weighting oscillates in synchronization with the desired trend period.
Summation:
The indicator aggregates the weighted prices from past periods to generate a single value for each point in time. This value signifies the strength and direction of the trend at the specified frequency. The results are used to determine the specific price zones.
█ How to Use
The price zones help traders identify the best times to enter and exit the market, similar to how support and resistance zones are used. The strategy is based on using price delivery algorithm zones to enter the market in areas commonly used by institutions for placing larger orders. The main advantage of this strategy is having the support of these heavier players.
█ Settings
Delivery Algorithm: This setting allows you to select the calculation method for the Delivery Algorithm. There are several options including "Price", "Swing High", "Swing Low", "Swing Mean", "Momentum", "Expansion", and "Volume". Each option represents a different way of analyzing market data, focusing on different aspects of price action or market dynamics. The choice here will influence how the algorithm interprets and responds to market data.
The corresponding length value is about the responsiveness of the Delivery Algorithm. Adjusting this value affects the algorithm's sensitivity to changes in market conditions. A higher value makes the algorithm more responsive, meaning it will react more strongly to recent market changes. This could be useful in volatile markets. On the other hand, a lower value makes the algorithm less responsive, resulting in more gradual adjustments. This might be preferable in more stable market conditions to avoid reacting to what might be considered 'market noise.'
Delivery Sensitivity: This setting adjusts the sensitivity of the algorithm's calculations to price movements. A higher value tends to smooth out the algorithm's output by considering a wider range of price data, which can be useful for identifying longer-term trends. A lower value makes the algorithm more sensitive to recent price movements, which can be helpful for short-term trading or scalping strategies. The option to enable Scalping Mode is particularly relevant for traders focusing on short-term, quick trades.
-----------------
Disclaimer
The information contained in my Scripts/Indicators/Ideas/Algos/Systems does not constitute financial advice or a solicitation to buy or sell any securities of any type. I will not accept liability for any loss or damage, including without limitation any loss of profit, which may arise directly or indirectly from the use of or reliance on such information.
All investments involve risk, and the past performance of a security, industry, sector, market, financial product, trading strategy, backtest, or individual's trading does not guarantee future results or returns. Investors are fully responsible for any investment decisions they make. Such decisions should be based solely on an evaluation of their financial circumstances, investment objectives, risk tolerance, and liquidity needs.
My Scripts/Indicators/Ideas/Algos/Systems are only for educational purposes!

Price Action Channel ( PAC ) - Restoration by YardleyRosetteOriginal script PACMASTER by JustUncleL.
I (YardleyRosette) have republished this indicator with the fixed and optimal settings nearest to MetaTrader4 Traders Dynamic Index ("SYNERGY") Price Action Channel.
Therefore I feel I have to accredit myself for selecting the optimal settings as best intended by CompassFX .
Basic Rules:
Solid filled Heikin Ashi above (golden) yellow PAC indicates strong upmove, trend trade ( Buy ). Solid filled Heikin Ashi under (golden) yellow PAC indicates strong downmove, trend trade ( Sell ).
Weak Heikin Ashi bars signal weakness as if of ranging/consolidating market conditions, especially when price is within PAC . This is an alert zone in which not to trade or to close trade for possible reversed direction.
2nd Channel made for assistance due to the unfixable precision settings when compared to MetaTrader4's Price Action Channel. MT4 displaces PAC in a certain manner TradingView has no script for programming.
Price ActionThis script is an alternative version of ChrisMoody's Price Action indicator, which is quite useful.
However, I found it a little intrusive with all the colors. I wanted something more subtle, so I made this.
The only difference is that this one uses shapes to highlight the candlestick patterns, and I dropped the Inside Bar indicator for simplicity.

Price Action + Fractals DetectorThe Price Action Patterns Detector indicator also includes a Fractal (WICK.ED style). This way, you'll see Pinbar, Engulfing, Doji, Inside/Outside Bar, Morning/Evening Star formations, and fractals will appear. 🔥

Price Action and market structure [Tcs] | PAThis indicator shows in real time the clearest and most complete vision of the price market structure, without considering volumes.
It has been developed mainly to identify price retracements in order to find the best entries in the market, but it include also other features which can be helpful for traders.
The indicator detects and highlight on the chart the market movement in multiple ways, including swing high, swing lows, the break of structure (BoS), change of character (CoCh), possible retracement movement, trend-lines generated through pivots, fibonacci and quarters theory levels based on previous pivot and daily, weekly and monthly highs and lows.
It can be set up on two different pivots look-back, one faster and one slower, to simplify the development of strategies for traders.
A longer look-back can detect a "slower" and less noisy structure, which can be more useful to detect massive retracements, while a shorter look-back can be useful to detect faster market moves, perfect for scalpers and to develop small price movement strategies.
Indicator features:
- Trend detection highlighted with colors - candles are colored in four different colors, and it's possible to choose if detect the fast and slow trend:
• Bullish move after structure break – green
• Bullish retracements – gray
• Bearish move after structure break – purple
• Bearish retracements – white
In this way traders can have a realtime vision of when the market is retracing in order to find better entries than entry immediately on a break of structure. It can be integrated with order blocks, ema or others indicators which can be helpful as support or resistance.
- Pivots and structure labels - in order to identify immediately if the trend is bullish, bearish or is changing direction:
• BoS + and BoS - are the bullish and bearish break of structure, respectively, and are colored to indicate a slower look-back, in gray to indicate a faster pivot look-back
• CoCh + and CoCh - are the bullish and bearish change of characters, respectively, and are colored to indicate a slower look-back.
• HH, HL, LL, and LH indicate the pivots of the trend. Al the pivots appear just when the pivots, based on fast or slow pivot look-back are confirmed
- Zigzag - The zigzag line helps to remove market noise and read the market structure in a simpler way.
• It's possible to select the zigzag line based on the slow or fast trend.
• Fast pivot look-back
•Slow pivot look-back
- Quarters theory and Fibonacci retracement:
• It creates a retracement that can be based on the fast or slow trend and small or big market move.
• The retracement is both bullish and bearish and includes the major Fibonacci levels and the most valuable areas from the quarters theory of market retracement.
• This helps to detect good entry points.
- Support and resistance, Daily, weekly, and monthly high, lows - just to heave a more clear view of important levels:
• It plots the highest and lowest pivot points based on the selected look-back.
• It plots the highs and lows of the day, week, and month.
- Trendlines:
• It plots the trend-lines based on past pivots.
• Here as well, it is possible to choose between fast and slow trend pivot look-back.
It's important to highlight that the indicator remarks on all facets of pure price action, not the smart money concept or liquidity areas.
Please note that this indicator is for educational purposes only and should not be used for trading without further testing and analysis.