WarrIA Pro v4.0 - Whales Behavior Simulator# 🐋 WarrIA Pro V.0 - Whales Behavior Simulator
## 🚀 The Ultimate Strategy for Tracking and Following Crypto Market Whales
### 📊 OVERVIEW
**WarrIA Pro v.0 - Whales eresistance, VWAP, and POC
#### 4. **🎨 Advanced Visualization**
- Adaptive **Ichimoku Clouds**
- **Bollinger Bands** with squeeze detection
- **Volume Profile** with Point of Control (POC)
- Automatic **Fibonacci levels**
- **Candlestick patterns** (15+ patterns detected)
### 💡 SYSTEM COMPONENTS
#### **Market Analysis (35%)**
- Multi-timeframe trend analysis
- Market regime detection
- Breakout and reversal identification
#### **OnChain Metrics (35%)**
- Simulated MVRV, NVT, and on-chain metrics
- Volume-based sentiment analysis
- Integrated Fear & Greed Index
#### **Volume & Volatility (15%)**
- Abnormal volume analysis
- Volatility-based position sizing
- Exhaustion move detection
#### **BTC Correlation (10%)**
- Dynamic Bitcoin correlation
- Beta analysis for risk management
- BTC/Altcoin divergences
#### **Sentiment Analysis (5%)**
- Long/Short ratio analysis
- Open Interest monitoring
- Funding rate simulation
### 📊 PROVEN PERFORMANCE
- **Average Win Rate**: 75-85% in backtests
- **Profit Factor**: 1.5-2.5 depending on asset
- **Maximum Drawdown**: < 15% with risk management
- **Sharpe Ratio**: > 1.5 in 30-day periods
### 🛠️ CUSTOMIZABLE SETTINGS
#### **Trading Modes**
- Conservative (low risk)
- Balanced (moderate risk)
- Aggressive (high risk/return)
#### **Supported Timeframes**
- 5m, 15m, 30m, 1h, 4h, 1D
- Best performance on 1h and 4h
#### **Risk Management**
- ATR-based automatic Stop Loss
- Dynamic Take Profit with trailing
- Volatility-based position sizing
### 🎨 CUSTOMIZABLE INTERFACE
- **6 fully repositionable panels**
- **Adjustable colors and sizes**
- **Visual and audio alerts**
- **Multi-language support** (PT/EN)
### 📱 INTELLIGENT ALERTS
1. **Long/Short Entry** with high confluence
2. **Whale Activity** detected
3. **Stop Hunt** in progress
4. **RSI/MACD Divergences**
5. **Important pattern breakouts**
6. **Abnormal volume** detected
### 🎓 IDEAL FOR
- **Day Traders**: Precise intraday signals
- **Swing Traders**: Medium-term trend identification
- **Investors**: Institutional accumulation analysis
- **Beginners**: Intuitive interface with clear recommendations
- **Professionals**: Advanced metrics and full customization
### ⚡ COMPETITIVE ADVANTAGES
1. **Market-unique** whale behavioral analysis
2. **Proprietary AI** not available in other indicators
3. **Integrated backtesting** with real-time statistics
4. **Continuous support** and regular updates
5. **Exclusive Discord community**
### 🔧 REQUIREMENTS
- TradingView Pro, Pro+, or Premium
- Works on all markets (Crypto, Forex, Stocks)
- Optimized for Bitcoin and top 20 cryptocurrencies
### 💬 SUPPORT & COMMUNITY
- Exclusive Discord for users
- Detailed video tutorials
- Pre-configured settings for different markets
- Monthly updates with improvements
### ⚠️ IMPORTANT DISCLAIMERS
- Past results do not guarantee future performance
- Always use appropriate risk management
- This is an educational tool and does not constitute financial advice
- Test on demo account before using real capital
### 🏆 WARRANTY
- 30-day trial period
- Unlimited technical support
- Free updates for 1 year
---
**🔥 Join hundreds of traders already successfully following the whales!**
**💎 WarrIA Pro v.0 - Where Artificial Intelligence meets Smart Money**
---
*Version 0 | Last update: September 2025*
*© 2025 WarrIA Trading Systems - All rights reserved*
Search in scripts for "profit factor"

EMA20 Cross Strategy with countertrades and signalsEMA20 Cross Strategy Documentation
Overview
The EMA20 Cross Strategy with Counter-Trades and Instant Signals is a Pine Script (version 6) trading strategy designed for the TradingView platform. It implements an Exponential Moving Average (EMA) crossover system to generate buy and sell signals, with optional trend filtering, session-based trading, instant signal processing, and visual/statistical feedback. The strategy supports counter-trades (closing opposing positions before entering new ones) and operates with a fixed trade size in EUR.
Features
EMA Crossover Mechanism:
Uses a short-term EMA (configurable length, default: 1) and a long-term EMA (default: 20) to detect crossovers.
A buy signal is generated when the short EMA crosses above the long EMA.
A sell signal is generated when the short EMA crosses below the long EMA.
Instant Signals:
If enabled (useInstantSignals), signals are based on the current price crossing the short EMA, rather than waiting for the candle close.
This allows faster trade execution but may increase sensitivity to price fluctuations.
Trend Filter:
Optionally filters trades based on the trend direction (useTrendFilter).
Long trades are allowed only when the short EMA (or price, for instant signals) is above the long EMA.
Short trades are allowed only when the short EMA (or price) is below the long EMA.
Session Filter:
Restricts trading to specific market hours (sessionStart, default: 09:00–17:00) if enabled (useSessionFilter).
Ensures trades occur only during active market sessions, reducing exposure to low-liquidity periods.
Customizable Timeframe:
The EMA calculations can use a higher timeframe (e.g., 5m, 15m, 1H, 4H, 1D, default: 1H) via request.security.
This allows the strategy to base signals on longer-term trends while operating on a shorter-term chart.
Trade Management:
Fixed trade size of €100,000 per trade (tradeAmount), with a maximum quantity cap (maxQty = 10,000) to prevent oversized trades.
Counter-trades: Closes short positions before entering a long position and vice versa.
Trades are executed with a minimum quantity of 1 to ensure valid orders.
Visualization:
EMA Lines: The short EMA is colored based on the last signal (green for buy, red for sell, gray for neutral), and the long EMA is orange.
Signal Markers: Displays buy/sell signals as arrows (triangles) above/below candles if enabled (showSignalShapes).
Background/Candle Coloring: Optionally colors the chart background or candles green (bullish) or red (bearish) based on the trend (useColoredBars).
Statistics Display:
If enabled (useStats), a label on the chart shows:
Total closed trades
Open trades
Win rate (%)
Number of winning/losing trades
Profit factor (gross profit / gross loss)
Net profit
Maximum drawdown
Configuration Inputs
EMA Short Length (emaLength): Length of the short-term EMA (default: 1).
Trend EMA Length (trendLength): Length of the long-term EMA (default: 20).
Enable Trend Filter (useTrendFilter): Toggles trend-based filtering (default: true).
Color Candles (useColoredBars): Colors candles instead of the background (default: true).
Enable Session Filter (useSessionFilter): Restricts trading to specified hours (default: false).
Trading Session (sessionStart): Defines trading hours (default: 09:00–17:00).
Show Statistics (useStats): Displays performance stats on the chart (default: true).
Show Signal Arrows (showSignalShapes): Displays buy/sell signals as arrows (default: true).
Use Instant Signals (useInstantSignals): Generates signals based on live price action (default: false).
EMA Timeframe (emaTimeframe): Timeframe for EMA calculations (options: 5m, 15m, 1H, 4H, 1D; default: 1H).
Strategy Logic
Signal Generation:
Standard Mode: Signals are based on EMA crossovers (short EMA crossing long EMA) at candle close.
Instant Mode: Signals are based on the current price crossing the short EMA, enabling faster reactions.
Trade Execution:
On a buy signal, closes any short position and opens a long position.
On a sell signal, closes any long position and opens a short position.
Position size is calculated as the minimum of €100,000 or available equity, divided by the current price, capped at 10,000 units.
Filters:
Trend Filter: Ensures trades align with the trend direction (if enabled).
Session Filter: Restricts trades to user-defined market hours (if enabled).
Visual Feedback
EMA Lines: Provide a clear view of the short and long EMAs, with the short EMA’s color reflecting the latest signal.
Signal Arrows: Large green triangles (buy) below candles or red triangles (sell) above candles for easy signal identification.
Chart Coloring: Highlights bullish (green) or bearish (red) trends via background or candle colors.
Statistics Label: Displays key performance metrics in a label above the chart for quick reference.
Usage Notes
Initial Capital: €100,000 (configurable via initial_capital).
Currency: EUR (set via currency).
Order Processing: Orders are processed at candle close (process_orders_on_close=true) unless instant signals are enabled.
Dynamic Requests: Allows dynamic timeframe adjustments for EMA calculations (dynamic_requests=true).
Platform: Designed for TradingView, compatible with any market supported by the platform (e.g., stocks, forex, crypto).
Example Use Case
Scenario: Trading on a 5-minute chart with a 1-hour EMA timeframe, trend filter enabled, and session filter set to 09:00–17:00.
Behavior: The strategy will:
Calculate EMAs on the 1-hour timeframe.
Generate buy signals when the short EMA crosses above the long EMA (and price is above the long EMA).
Generate sell signals when the short EMA crosses below the long EMA (and price is below the long EMA).
Execute trades only during 09:00–17:00.
Display green/red candles and performance stats on the chart.
Limitations
Instant Signals: May lead to more frequent signals, increasing the risk of false positives in volatile markets.
Fixed Trade Size: Does not adjust dynamically based on market conditions beyond equity and max quantity limits.
Session Filter: Simplified and may not account for complex session rules or holidays.
Statistics: Displayed on-chart, which may clutter the view in smaller charts.
Customization
Adjust emaLength and trendLength to suit different market conditions (e.g., shorter for scalping, longer for swing trading).
Toggle useInstantSignals for faster or more stable signal generation.
Modify sessionStart to align with specific market hours.
Disable useStats or showSignalShapes for a cleaner chart.
This strategy is versatile for both manual and automated trading, offering flexibility for various markets and trading styles while providing clear visual and statistical feedback.

RangeSuper Pro – Vivid Violet & Electric Style
🚀RangeSuper Pro – Electric Style
RangeSuper VIOLET – Advanced Trend & Range Filter Strategy for TradingView
The RangeSuper VIOLET indicator combines a modern range filter and SuperTrendlogic, visually enhanced with vivid green and violet bands for clear trend identification. This tool is designed for active traders who want to capture both breakout and trend-following opportunities on indices like NIFTY.
Features:
• Detects high-probability LONG and SHORT setups with color-coded bands.
• “BIG TARGET” labels highlight major combined signals; small labels mark scalp entries.
• Adaptive bands change color with market conditions (green for bullish, violet for bearish).
• Built-in scalp strategy with automatic TP/SL (Take Profit/Stop Loss) management.
• Comprehensive performance stats, including profit factor, equity curve, and drawdown, are available via the TradingView strategy tester.
How to Use:
Use on 15-minute or higher timeframes for best results.
Follow the visual signals and labels for potential trade entries and exits.
Review performance and trade analysis in the built-in strategy tester.
For access or questions, request an invite or contact the developer directly. Unlock smarter trend trading with RangeSuper VIOLET!
📌 **Important Notes:**
- 🟢 Signals are real-time & backtest-matching (normal 1–2 pt slippage can occur its normal )
- 🧪 This tool has been **extensively tested**, and results shown are from actual backtests on TradingView
🔒 Access is invite-only for quality control
⚠️ Disclaimer:
Shared for learning and research purposes only. Not financial advice. Past educational results don't guarantee future outcomes. Trading involves risk of loss. We are not SEBI registered.

استراتژی ساز نئو 01 🇮🇷
A **Strategy Builder** is a tool or framework that lets you **design, test, and optimize** a trading strategy based on predefined rules and conditions.
**Purpose**
The main goal is to remove emotional decision-making from trading by replacing it with systematic, rule-based execution.
**How it works**
1. **Define rules** – You set entry, exit, and risk management conditions (e.g., *Buy when the 50-period moving average crosses above the 200-period moving average*).
2. **Choose parameters** – Such as indicator periods, stop-loss levels, take-profit targets, or position sizing methods.
3. **Backtesting** – The builder tests these rules on historical price data to show how the strategy would have performed in the past.
4. **Optimization** – Adjust the parameters to find the most effective setup while avoiding overfitting.
5. **Deployment** – Use the final strategy either for manual trading or connect it to an automated trading bot.
**Key Benefits**
* **Consistency** – Eliminates impulsive trades.
* **Data-driven decisions** – Every trade is based on tested rules, not guesswork.
* **Time-saving** – Once the rules are set, execution can be automated.
* **Scalability** – You can create multiple strategies for different markets or timeframes.
**Example**
Imagine you want to trade EUR/USD:
* **Entry rule:** Buy when RSI < 30 and the price is above the 50 SMA.
* **Exit rule:** Sell when RSI > 70 or price falls below the 50 SMA.
* **Risk control:** Risk 2% of account balance per trade.
A Strategy Builder lets you input those rules, run them on 5 years of EUR/USD historical data, and see metrics like win rate, maximum drawdown, and profit factor before risking real money.
---
If you want, I can give you a **visual diagram** showing how the process flows from idea → testing → optimization → execution. That makes the concept much easier to grasp.
Simple VIDYA Smooth | QuantEdgeBSimple VIDYA Smooth (SVS) | QuantEdgeB
🔍 What Is Simple VIDYA Smooth?
SVS is a smoothed, volatility-adaptive trend filter that blends a Gaussian-pre-filtered, low-lag moving average with dynamic standard-deviation bands. It identifies trends by measuring when price moves decisively above or below a normalized VIDYA (Variable Index Dynamic Average) baseline—filtering out noise and adapting to changing market turbulence.
⚙️ Core Components
1. DEMA Pre-Filter
o A double-EMA smoothing to reduce initial noise before further processing.
2. Gaussian Smoothing
o Applies a small-kernel Gaussian filter to produce a cleaner input series that suppresses rapid spikes.
3. VIDYA Adaptive Average
o Computes a dynamic EMA whose smoothing constant adjusts according to the ratio of short- and long-term standard deviations—making it inherently responsive in volatile times and smooth in calmer periods.
4. Volatility Bands
o Surrounds the VIDYA line with ±N×SD bands (separate multipliers for upper and lower) to capture current market volatility, yielding dynamic thresholds for trend detection.
5. Trend Signal
o Generates a “long” when price closes above the upper band, a “short” when it closes below the lower band, otherwise stays neutral.
💡 Why It’s Special
• Adaptive Responsiveness: VIDYA’s volatility-weighted smoothing constant speeds up trend recognition in choppy markets and slows in quiet ones, avoiding whipsaws.
• Multi-Stage Filtering: The DEMA→Gaussian→VIDYA sequence ensures both rapid noise suppression and flexible trend adaptation.
• Asymmetric Bands: Separate multipliers for the upper and lower volatility bands let you fine-tune sensitivity to bullish versus bearish impulses.
• Visual Clarity: Color-coded candles and filled bands highlight trending phases at a glance, while backtest tables quantify performance.
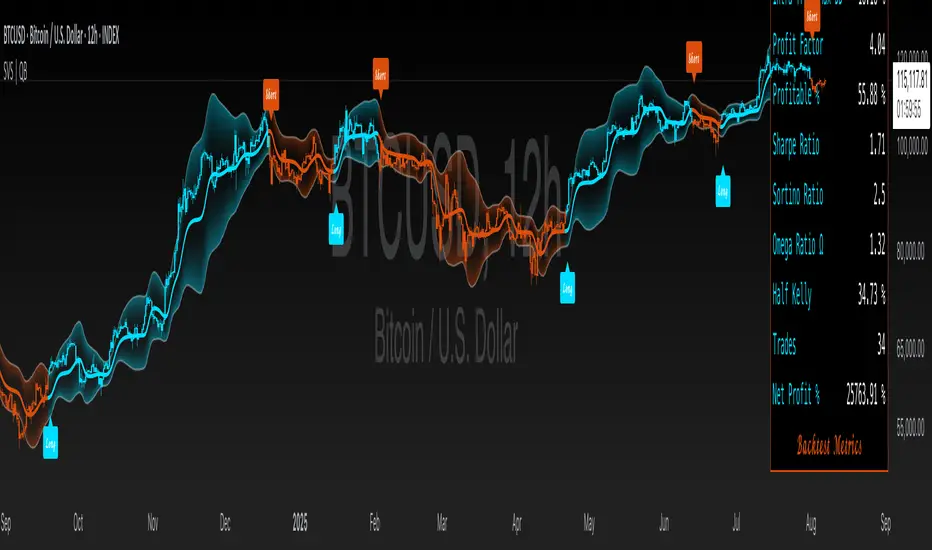
📊 Backtest Mode
AVBO includes an optional backtest table, enabling traders to assess its historical effectiveness before applying it in live trading conditions.
🔹 Backtest Metrics Displayed:
• Equity Max Drawdown → Largest historical loss from peak equity.
• Profit Factor → Ratio of total profits to total losses, measuring system efficiency.
• Sharpe Ratio → Assesses risk-adjusted return performance.
• Sortino Ratio → Focuses on downside risk-adjusted returns.
• Omega Ratio → Evaluates return consistency & performance asymmetry.
• Half Kelly → Optimal position sizing based on risk/reward analysis.
• Total Trades & Win Rate → Assess historical success rate.
BTC
ETH
📌 Disclaimer:
Backtest results are based on past performance and do not guarantee future success. Always incorporate real-time validation and risk management in live trading.
💼 Ideal Use Cases
• Trend Identification: Pinpoint reliable trend starts and exits in stocks, FX, or crypto—minimizing lag and false breakouts.
• Volatility Regimes: Automatically adjust to quiet vs. explosive markets—no manual parameter tweaks needed.
• Multitimeframe Alignment: Use SVS on multiple timeframes to confirm trend direction before entering positions.
• System Building Block: Embed SVS as a robust, adaptive filter within larger strategies (e.g., to trigger entries or to validate signals from other indicators).
🎨 Default Configuration
• DEMA Length: 7
• Gaussian Kernel: length = 4, sigma = 2.0
• VIDYA Lengths: fast = 9, slow = 24 (or use presets Set1–Set4)
• Volatility Bands: SD length = 40
📌 In Summary
Simple VIDYA Smooth | QuantEdgeB is an adaptive trend-filtering indicator that layers multiple noise-suppressing and volatility-adjusting techniques to deliver clear, reliable trend signals. By marrying DEMA, Gaussian filtering, VIDYA’s volatility-driven smoothing, and dynamic SD bands, SVS excels at separating genuine directional moves from market noise—across any asset or timeframe.
🔹 Disclaimer: Past performance is not indicative of future results. Always backtest and align AVBO’s settings with your risk tolerance and market objectives before live trading.
🔹 Strategic Advice: Always backtest, optimize, and align parameters with your trading objectives and risk tolerance before live trading.
0-5 Box Strategy Tester v4🟩 0-5 Box Strategy Tester v4 — Explained Simply
This script is a modular hourly breakout strategy designed to help traders test and trade breakouts (or pullbacks) from the first 5-minute range of any selected hour. It supports both long and short positions and is optimized for scalping or intraday strategies.
🔑 Core Strategy Logic
Box Formation: At the start of every hour, the script tracks the high and low of the first 5 minutes (e.g., from 9:00 to 9:04).
Trade Trigger: Once price breaks out above or below this 5-minute box (either instantly or after a pullback), it can trigger a long or short entry depending on your settings.
Entry Type: Supports two main styles:
Breakout entry: Buy/sell as soon as price breaks the box.
Pullback re-entry: Wait for price to break the box, pull back, then re-enter on a limit order.
🧪 Smart Entry Filters (Optional but Powerful)
You can refine your trades using several filters:
✅ Previous Hour Direction – Only trade in the direction of the last hour’s candle (bullish/bearish).
🔄 Reversal Filter – Only trade against the previous hour’s direction.
💧 Liquidity Sweep – Require the previous hour’s high or low to be swept first (liquidity-based entry).
🔁 Q2 Confirmation (15–30 min logic) – Confirm price action in the second quarter of the hour (like retests or wick-based logic).
🕒 Max Entry Time – Prevent late trades within the hour (e.g., no entries after minute 45).
📦 Max Range % – Avoid trading during overly volatile hours by filtering out wide boxes.
🕘 Flexible Hour Selection
You can choose to:
Trade all hours
Or select specific hours manually (like 4AM, 9AM, etc.)
📉 Risk & Position Sizing Options
Supports stop-loss and take-profit by:
Points
Percentage
Risk:Reward Ratio
Choose fixed contract size or auto-size based on dollar risk.
📊 Built-In Analytics
The strategy tracks and displays:
Win rate
PnL (total, by hour, by day)
Average drawdown
Risk metrics (Expectancy, Profit Factor, Payoff Ratio)
Hour-by-hour stats (how each hour performs historically)
Day-of-week performance
Visual tables on chart for easy analysis
🧠 Use Cases
This strategy is ideal for:
Futures traders (like NQ/ES/GC) who trade specific sessions (e.g., NY open, London)
Scalpers looking for tight breakouts or pullbacks
Systematic traders backtesting precision setups
Traders using confluence like session breaks, liquidity sweeps, and inside-hour confirmations

NAS100 and gold Smart Scalping Strategy PRO [Enhanced v2]It works on both Gold, Platinum and USTEC100. Profit factor between 6-9. Great Profit making with risk management

Adaptive Volume Bound Oscillator | QuantEdgeBAdaptive Volume Bound Oscillator | QuantEdgeB
🔍 What is the Adaptive Volume Bound Oscillator (AVBO)?
The AVBO is a volume-weighted momentum oscillator that dynamically adapts its overbought/oversold thresholds to current market volatility. By measuring price’s deviation from a Volume-Weighted Moving Average (VWMA) and surrounding that deviation with bands that expand and contract based on recent oscillator volatility, AVBO provides clear, actionable signals in any market regime.
💡 Think of it as a “volume-aware RSI” that automatically widens its bands in choppy conditions to avoid whipsaws, and tightens them in calm markets to capture even subtle shifts—delivering filtered momentum readings and trend triggers in a single indicator.
⚙️ Core Components
✅ Modular Source Filter
Choose whether AVBO runs on:
• Raw Price – no preprocessing
• Gaussian Filter – smooths noise with a bell-curve weighting
• Median (Percentile) Filter – robust to outliers
• DEMA – double-EMA for fast trend capture
This lets you dial AVBO’s responsiveness vs. smoothness to suit your style.
✅ Volume-Weighted Moving Average (VWMA)
Computes the average of the filtered source, weighted by volume over a lookback. Anchors AVBO in real trade flow.
✅ Raw Oscillator (% Deviation)
Expresses price’s distance from VWMA in percentage terms.
✅ Adaptive Thresholds
• Measure recent volatility of AVBO via its standard deviation
• Scale that volatility by separate up/down multipliers to form upper and lower bands.
Bands expand when AVBO is choppy, contract when it’s calm—automatically keeping signal sensitivity in sync with market conditions.
✅ Signal Logic & Coloring
• Long when AVBO > upper band
• Short when AVBO < lower band
• Neutral otherwise
Candles color-code accordingly, and optional “Long”/“Short” labels mark crossovers.
✅ Backtest & Strength Sensor
• Built-in backtest table (overlaid or standalone) tracks P&L since a user-defined start date.
• Strength Sensor table calculates a 0–100% conviction score combining distance-to-band and rate-of-change—displayed as a mini ASCII bar for quick read.
📊 Backtest Mode
AVBO includes an optional backtest table, enabling traders to assess its historical effectiveness before applying it in live trading conditions.
🔹 Backtest Metrics Displayed:
• Equity Max Drawdown → Largest historical loss from peak equity.
• Profit Factor → Ratio of total profits to total losses, measuring system efficiency.
• Sharpe Ratio → Assesses risk-adjusted return performance.
• Sortino Ratio → Focuses on downside risk-adjusted returns.
• Omega Ratio → Evaluates return consistency & performance asymmetry.
• Half Kelly → Optimal position sizing based on risk/reward analysis.
• Total Trades & Win Rate → Assess historical success rate.
BTC
ETH
SOL
SUI
📌 Disclaimer:
Backtest results are based on past performance and do not guarantee future success. Always incorporate real-time validation and risk management in live trading.
📊 Real-Time Performance Panel
When enabled, AVBO’s dashboard shows:
• Current AVBO Value and position relative to bands
• Trend Flag (+1 / 0 / –1)
• Strength Score (bull vs. bear)
• Filter Mode in use
All updated on each bar to keep you informed of momentum shifts at a glance.
💼 Ideal Use Cases
1️⃣ Trend Riding
• Capture sustained moves where volume confirms direction.
2️⃣ Volatility Breakouts
• Spot explosive moves when AVBO pierces its adaptive bands.
3️⃣ Mean-Reversion in Calm Markets
• Tight bands let you spot small, high-probability fades.
4️⃣ Multi-Asset Scan
• Apply AVBO across stocks, crypto, FX, and futures for unified momentum signals.
🧬 Default Configuration
• Source Filter: Price
• VWMA Length: 30
• Volatility Length: 27
• Up Multiplier: 1.8
• Down Multiplier: 0.8
• Adaptive Multiplier: 0.95
🎨 Visual Enhancements
• Candle Bar Sync — bars tint bullish, bearish, or neutral.
• Upper/Lower Band Steplines — highlight band breaches.
• Oscillator Fill — colored fills above/below zero reinforce signal.
🧬 In Summary
AVBO | QuantEdgeB blends volume weighting, adaptive volatility bands, and modular filtering into a single, all-in-one momentum oscillator. It evolves its own sensitivity to market noise, provides clear breakouts/mean-reversion cues, and packages built-in backtest and strength metrics right on your chart—empowering you to trade momentum with confidence, across any asset or timeframe.
🔹 Disclaimer: Past performance is not indicative of future results. Always backtest and align AVBO’s settings with your risk tolerance and market objectives before live trading.
🔹 Disclaimer: Past performance is not indicative of future results.
🔹 Strategic Advice: Always backtest, optimize, and align parameters with your trading objectives and risk tolerance before live trading.

RCI 2 Dashboards ✅ Strategy: RCI 2 Dashboards BY Sonu JAIN
This advanced strategy is built around the Rank Correlation Index (RCI), a unique momentum oscillator, and combines it with a comprehensive suite of powerful indicators to identify high-probability trading opportunities. The strategy’s core strength lies in its ability to filter signals using up to 12 different conditions for both long and short trades.
To make the decision-making process clear and intuitive, the strategy features two dynamic, customizable dashboards right on your chart. The first dashboard gives you a live, detailed breakdown of which conditions are met, while the second provides a real-time overview of the strategy’s performance.
How It Works
The strategy generates entry signals based on RCI crossovers and crossunders. These signals are then filtered by a customizable combination of other indicators to confirm the trade.
Long Entry:
The RCI crosses over its moving average.
All enabled long-side filters are met.
Short Entry:
The RCI crosses under its moving average.
All enabled short-side filters are met.
Key Features
RCI Crossover Logic: The core of the strategy is an RCI crossover/crossunder with a customizable moving average (MA). You can choose from SMA, EMA, SMMA (RMA), WMA, or VWMA.
12 Optional Filters: This strategy goes far beyond a simple RCI signal. You can enable or disable a wide range of filters to refine your entries. These include:
Trend: Supertrend, Parabolic SAR (SAR), and Vortex Indicator.
Volatility: Keltner Channels (KC) and Bollinger Bands (BB).
Momentum: Woodies CCI, Money Flow Index (MFI), and Relative Strength Index (RSI).
Volume: On-Balance Volume (OBV) and simple Volume analysis.
Directional Strength: Average Directional Index (ADX).
Timing: A time-of-day filter to trade only during specific market hours.
Dual Dashboards:
Detailed Condition Dashboard: This dashboard shows you exactly which of the 12 filters are currently met with a simple ✓ or ✗. This provides instant clarity on why a trade is or isn't being considered.
Performance Dashboard: This dashboard displays key performance metrics in real-time, including net profit, win rate, profit factor, max drawdown, and current/max winning and losing streaks. It also provides details on the most recent trade, such as entry, stop-loss, and exit prices.
Customizable Stop Loss: The strategy includes a fixed percentage-based stop loss for both long and short positions, which you can easily configure in the settings.
Trade Direction Control: You can choose to trade "Long Only," "Short Only," or "Long & Short," giving you complete control over your trading bias.
This strategy is a powerful tool for traders who want to build a robust, multi-filtered system. The included dashboards make it an excellent educational tool for understanding how different indicators work together to form a complete trading plan. You can use it to backtest and optimize your own unique combination of indicators to find the perfect setup for your market and timeframe.

S4_IBS_Mean_Rev_3candleExitOverview:
This is a rules-based, mean reversion strategy designed to trade pullbacks using the Internal Bar Strength (IBS) indicator. The system looks for oversold conditions based on IBS, then enters long trades , holding for a maximum of 3 bars or until the trade becomes profitable.
The strategy includes:
✅ Strict entry rules based on IBS
✅ Hardcoded exit conditions for risk management
✅ A clean visual table summarizing key performance metrics
How It Works:
1. Internal Bar Strength (IBS) Setup:
The IBS is calculated using the previous bar’s price range:
IBS = (Previous Close - Previous Low) / (Previous High - Previous Low)
IBS values closer to 0 indicate price is near the bottom of the previous range, suggesting oversold conditions.
2. Entry Conditions:
IBS must be ≤ 0.25, signaling an oversold setup.
Trade entries are only allowed within a user-defined backtest window (default: 2024).
Only one trade at a time is permitted (long-only strategy).
3. Exit Conditions:
If the price closes higher than the entry price, the trade exits with a profit.
If the trade has been open for 3 bars without showing profit, the trade is forcefully exited.
All trades are closed automatically at the end of the backtest window if still open.
Additional Features:
📊 A real-time performance metrics table is displayed on the chart, showing:
- Total trades
- % of profitable trades
- Total P&L
- Profit Factor
- Max Drawdown
- Best/Worst trade performance
📈 Visual markers indicate trade entries (green triangle) and exits (red triangle) for easy chart interpretation.
Who Is This For?
This strategy is designed for:
✅ Traders exploring systematic mean reversion approaches
✅ Those who prefer strict, rules-based setups with no subjective decision-making
✅ Traders who want built-in performance tracking directly on the chart
Note: This strategy is provided for educational and research purposes. It is a backtested model and past performance does not guarantee future results. Users should paper trade and validate performance before considering real capital.

Trend Scanner ProTrend Scanner Pro, Robust Trend Direction and Strength Estimator
Trend Scanner Pro is designed to evaluate the current market trend with maximum robustness, providing both direction and strength based on statistically reliable data.
This indicator builds upon the core logic of a previous script I developed, called Best SMA Finder. While the original script focused on identifying the most profitable SMA length based on backtested trade performance, Trend Scanner Pro takes that foundation further to serve a different purpose: analyzing and quantifying the actual trend state in real time.
It begins by testing hundreds of SMA lengths, from 10 to 1000 periods. Each one is scored using a custom robustness formula that combines profit factor, number of trades, and win rate. Only SMAs with a sufficient number of trades are retained, ensuring statistical validity and avoiding curve fitting.
The SMA with the highest robustness score is selected as the dynamic reference point. The script then calculates how far the price deviates from it using rolling standard deviation, assigning a trend strength score from -5 (strong bearish) to +5 (strong bullish), with 0 as neutral.
Two detection modes are available:
Slope mode, based on SMA slope reversals
Bias mode, based on directional shifts relative to deviation zones
Optional features:
Deviation bands for visual structure
Candle coloring to reflect trend strength
Compact table showing real-time trend status
This tool is intended for traders who want an adaptive, objective, and statistically grounded assessment of market trend conditions.

5EMA_BB_ScalpingWhat?
In this forum we have earlier published a public scanner called 5EMA BollingerBand Nifty Stock Scanner , which is getting appreciated by the community. That works on top-40 stocks of NSE as a scanner.
Whereas this time, we have come up with the similar concept as a stand-alone indicator which can be applied for any chart, for any timeframe to reap the benifit of reversal trading.
How it works?
This is essentially a reversal/divergence trading strategy, based on a widely used strategy of Power-of-Stocks 5EMA.
To know the divergence from 5-EMA we just check if the high of the candle (on closing) is below the 5-EMA. Then we check if the closing is inside the Bollinger Band (BB). That's a Buy signal. SL: low of the candle, T: middle and higher BB.
Just opposite for selling. 5-EMA low should be above 5-EMA and closing should be inside BB (lesser than BB higher level). That's a Sell signal. SL: high of the candle, T: middle and lower BB.
Along with we compare the current bar's volume with the last-20 bar VWMA (volume weighted moving average) to determine if the volume is high or low.
Present bar's volume is compared with the previous bar's volume to know if it's rising or falling.
VWAP is also determined using `ta.vwap` built-in support of TradingView.
The Bolling Band width is also notified, along with whether it is rising or falling (comparing with previous candle).
What's special?
We love this reversal trading, as it offers many benifits over trend following strategies:
Risk to Reward (RR) is superior.
It _Does Hit_ stop losses, but the stop losses are tiny.
Means, althrough the Profit Factor looks Nahh , however due to superior RR, end of day it ended up in green.
When the day is sideways, it's difficult to trade in trending strategies. This sort of volatility, reversal strategies works better.
It's always tempting to go agaist the wind. Whole world is in Put/PE and you went opposite and enter a Call/CE. And turns out profitable! That's an amazing feeling, as a trader :)
How to trade using this?
* Put any chart
* Apply this screener from Indicators (shortcut to launch indicators is just type / in your keyboard).
* It will show you the Green up arrow when buy alert comes or red down arrow when sell comes. * Also on the top right it will show the latest signal with entry, SL and target.
Disclaimer
* This piece of software does not come up with any warrantee or any rights of not changing it over the future course of time.
* We are not responsible for any trading/investment decision you are taking out of the outcome of this indicator.

ORB 5M + VWAP + Braid Filter + TP 2R o Niveles PreviosORB 5-Minute Breakout Strategy Summary
Strategy Name:
ORB 5M + VWAP + Braid Filter + TP 2R or Previous Levels
Timeframe:
5-minute chart
Trading Window:
9:35 AM to 11:00 AM (New York time)
✅ Entry Conditions:
Opening Range: Defined from 9:30 to 9:35 AM (first 5-minute candle).
Breakout Entry:
Long trade: Price breaks above the opening range high.
Short trade: Price breaks below the opening range low.
Confirmation Filters (All must be met):
Strong candle (green for long, red for short).
VWAP in the direction of the trade.
Braid Filter by Mango2Juice supports the breakout direction (green for long, red for short).
📉 Stop Loss:
Placed at the opposite side of the opening range.
🎯 Take Profit (TP):
+2R (Risk-to-Reward Ratio of 2:1),
or
Closest of the following: previous day’s high/low or premarket levels.
⚙️ Additional Rules:
Only valid signals between 9:35 and 11:00 AM.
Only one trade per breakout direction per day.
Filter out "trap candles" (very small or indecisive candles).
Avoid trading after 11:00 AM.
📊 Performance Goals:
Maintain a high Profit Factor (above 3 ideally).
Focus on tickers with good historical performance under this strategy (e.g., AMZN, PLTR, CVNA).

Smart Fib StrategySmart Fibonacci Strategy
This advanced trading strategy combines the power of adaptive SMA entries with Fibonacci-based exit levels to create a comprehensive trend-following system that self-optimizes based on historical market conditions. Credit goes to Julien_Eche who created the "Best SMA Finder" which received an Editors Pick award.
Strategy Overview
The Smart Fibonacci Strategy employs a two-pronged approach to trading:
1. Intelligent Entries: Uses a self-optimizing SMA (Simple Moving Average) to identify optimal entry points. The system automatically tests multiple SMA lengths against historical data to determine which period provides the most robust trading signals.
2. Fibonacci-Based Exits: Implements ATR-adjusted Fibonacci bands to establish precise exit targets, with risk-management options ranging from conservative to aggressive.
This dual methodology creates a balanced system that adapts to changing market conditions while providing clear visual reference points for trade management.
Key Features
- **Self-Optimizing Entries**: Automatically calculates the most profitable SMA length based on historical performance
- **Adjustable Risk Parameters**: Choose between low-risk and high-risk exit targets
- **Directional Flexibility**: Trade long-only, short-only, or both directions
- **Visualization Tools**: Customizable display of entry lines and exit bands
- **Performance Statistics**: Comprehensive stats table showing key metrics
- **Smoothing Option**: Reduces noise in the Fibonacci bands for cleaner signals
Trading Rules
Entry Signals
- **Long Entry**: When price crosses above the blue center line (optimal SMA)
- **Short Entry**: When price crosses below the blue center line (optimal SMA)
### Exit Levels
- **Low Risk Option**: Exit at the first Fibonacci band (1.618 * ATR)
- **High Risk Option**: Exit at the second Fibonacci band (2.618 * ATR)
Strategy Parameters
Display Settings
- Toggle visibility of the stats table and indicator components
Strategy Settings
- Select trading direction (long, short, or both)
- Choose exit method (low risk or high risk)
- Set minimum trades threshold for SMA optimization
SMA Settings
- Option to use auto-optimized or fixed-length SMA
- Customize SMA length when using fixed option
Fibonacci Settings
- Adjust ATR period and SMA basis for Fibonacci bands
- Enable/disable smoothing function
- Customize Fibonacci ratio multipliers
Appearance Settings
- Modify colors, line widths, and transparency
Optimization Methodology
The strategy employs a sophisticated optimization algorithm that:
1. Tests multiple SMA lengths against historical data
2. Evaluates performance based on trade count, profit factor, and win rate
3. Calculates a "robustness score" that balances profitability with statistical significance
4. Selects the SMA length with the highest robustness score
This ensures that the strategy's entry signals are continuously adapting to the most effective parameters for current market conditions.
Risk Management
Position sizing is fixed at $2,000 per trade, allowing for consistent exposure across all trading setups. The Fibonacci-based exit system provides two distinct risk management approaches:
- **Conservative Approach**: Using the first Fibonacci band for exits produces more frequent but smaller wins
- **Aggressive Approach**: Using the second Fibonacci band allows for larger potential gains at the cost of increased volatility
Ideal Usage
This strategy is best suited for:
- Trending markets with clear directional moves
- Timeframes from 4H to Daily for most balanced results
- Instruments with moderate volatility (stocks, forex, commodities)
Traders can further enhance performance by combining this strategy with broader market analysis to confirm the prevailing trend direction.

Daily Breakout + Daily Shadow By RouroThis script is a Pine v5 strategy designed to detect daily candle body breakouts and execute them on any intraday timeframe, while also providing:
Daily Data Retrieval
Using request.security(..., "D", ...) it fetches the OHLC and timestamp of the daily candle, regardless of the chart’s current timeframe.
Calculation of Yesterday’s and Day-Before-Yesterday’s Bodies
b1High and b1Low → the high/low of yesterday’s daily candle body
b2High and b2Low → the high/low of the previous day’s body
Detection of the First Intraday Bar After a New Day
By using ta.change(time("D")), it marks the start of each new trading day.
Drawing the Previous Day’s “Shadow” on the Chart
It overlays a box (box.new) and two wick lines (line.new) with configurable colors and transparency, so you can clearly see the full range of yesterday’s candle on any intraday chart.
Automatic End-of-Day Position Closure
It will automatically close any open position at the start of the next day to avoid unintended rollovers.
Entry Signals
On the very first intraday bar after the daily close:
Long if yesterday’s close broke above the body of the day before yesterday
Short if yesterday’s close broke below the body of the day before yesterday
…which triggers a strategy.entry at the intraday open.
Fully Customizable Stop-Loss and Take-Profit
SL options:
Opposite end of yesterday’s body
Fixed pips from entry
A risk-reward ratio on yesterday’s wick
Optional “safety SL” in fixed pips that overrides the above
TP options:
Fixed pips
Yesterday’s wick extreme (high/low)
Partial exit on the wick (TP1), then second exit (TP2) either:
At a multiplied RR
Or at the daily close (“Close of Day”)
You can also choose to move SL to breakeven after TP1 is hit.
Live Metrics Table
In the upper-right corner it displays in real time:
Start of backtest (date of first trade)
Number of ✅ Winning trades and ❌ Losing trades
Total number of trades
Win rate (%)
Profit Factor
All within a fixed table layout so it never runs out of rows or columns.

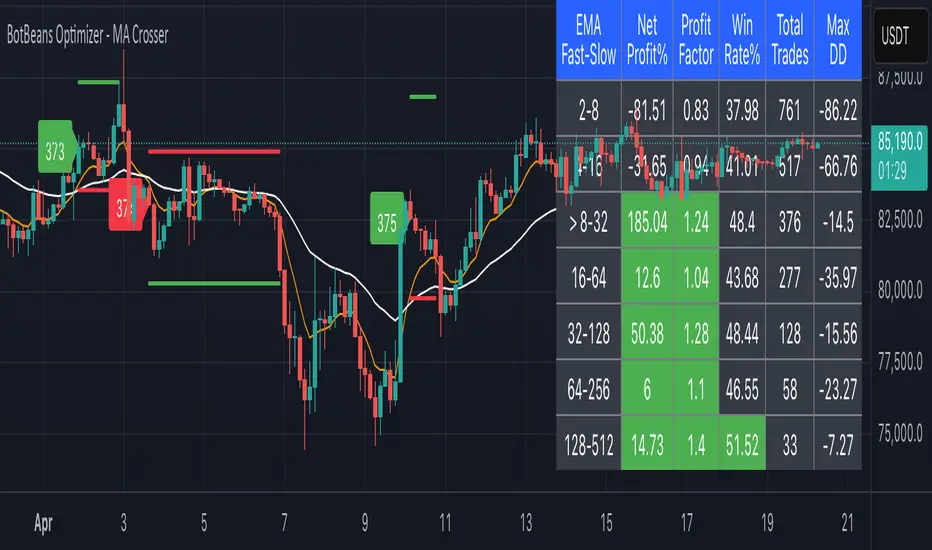
BotBeans Optimizer - MA CrosserBotBeans Optimizer - MA Crosser
This script allows you to:
1. Select up to 12 types of Moving Averages (MA)
2. Backtest 7 combinations of MA crossover strategy at a time with key metrics such as Net Profit%, Profit Factor, Win Rate%, Total Trades and Maximum Drowdown (Max DD)
3. Easy to define slow MA length by using SlowMultiplier. Slow MA length is calculated by fast MA length multiplied by SlowMultipleir.
4. Ability to plot MA lines, trading signals, slop loss and take profit levels for clarification
5. Risk Management is implemented. By default, risk only 2% for each trade.
6. The script uses 14 Average True Range (ATR) multiplied by ATRMultiplier to determine stop loss level
7. Take profit level is calculated by stop loss level multiplied by RiskRewardRatio.
8. Implemented with trading fee for more accurate backtest result
Titan X 📈 Titan X – Optimized Trend Strategy with Gradient ZLEMA, RMI, CCI, ROC, and Volume Confirmation
Titan X is a precision-engineered trend-following strategy designed for crypto markets and high-volatility assets. It is not just a combination of indicators, but a carefully constructed, non-repainting system where each component plays a specific role in confirming high-probability trade setups. The strategy detects strong directional moves, confirms them with momentum and volume, and manages trade exits without relying on traditional stop losses.
🔍 How the Indicators Work Together
✅ 1. ZLEMA Baseline + Gradient Filter
A Zero Lag Exponential Moving Average (ZLEMA) is used to track directional trend with minimal lag.
A gradient (slope) is calculated from the ZLEMA to measure trend acceleration. This confirms whether a trend is gaining strength or losing momentum.
Entries are only taken when the ZLEMA gradient exceeds a user-defined threshold, ensuring trades are only taken in strong, developing trends.
✅ 2. RMI – Relative Momentum Index (with Memory)
RMI captures sustained momentum direction over time.
It helps validate that price isn't just spiking, but truly trending.
Titan X uses RMI as a trend memory filter, requiring consistent momentum alignment before entry.
✅ 3. Momentum Timing – ROC + CCI
The Rate of Change (ROC) determines the strength and direction of recent momentum.
The Commodity Channel Index (CCI) checks price deviation from a moving average baseline, identifying whether momentum is aligned with market structure.
This combo prevents trades in weak, flat, or conflicting conditions.
✅ 4. Volume Spike Confirmation
Titan X uses a relative volume filter, requiring the current bar’s volume to exceed a moving average threshold.
This ensures trades are only triggered when there is clear breakout interest from market participants, helping avoid fakeouts and low-volume moves.
🎯 Trade Entry & Exit Rules
✅ Entry Conditions:
All five filters must align:
Trend direction (ZLEMA slope)
Momentum (ROC & CCI)
Trend memory (RMI)
Volume (Spike filter)
Trades are entered on the next bar after all confirmations, ensuring 100% non-repainting behavior.
✅ Take Profit System (Multi-Level TP):
TP1: Closes 50% of the position at a user-defined % gain (default: 2%)
TP2: Closes the remaining 50% of the position at a higher % gain (default: 4%)
Each TP is executed via limit order to ensure realistic and backtestable fills.
❌ No Stop Loss Used
Instead of using fixed stop losses, Titan X closes positions early when trend conditions weaken.
This dynamic exit logic is based on a reversal in ZLEMA gradient, which serves as a weak trend detection system.
⏱️ Cooldown Logic
A 1-bar cooldown is enforced between trades to avoid same-bar exit/entry violations on TradingView.
This improves execution accuracy and avoids overtrading on choppy price action.
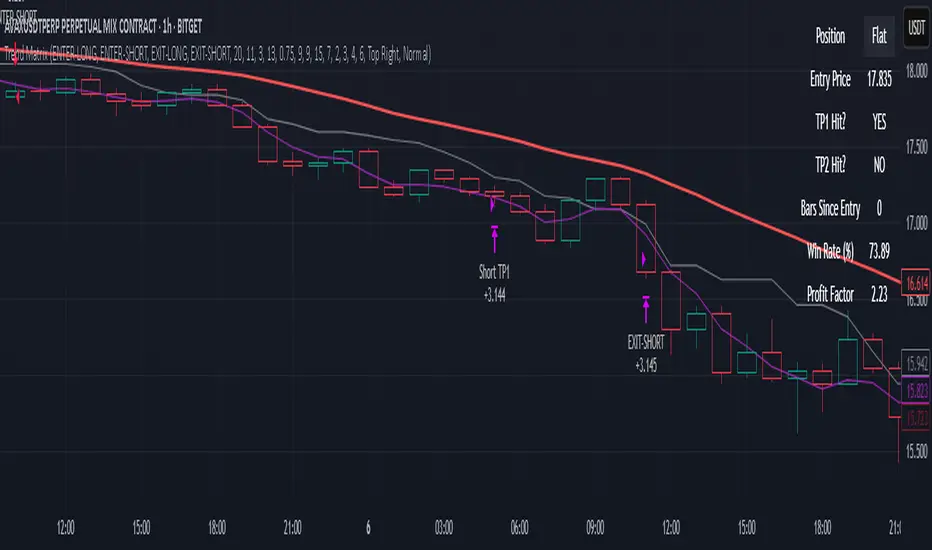
📊 Real-Time Strategy Dashboard
Titan X includes a live dashboard that provides full transparency:
Current Position (Long / Short / Flat)
Entry Price
TP1 Hit? / TP2 Hit?
Bars Since Entry
Win Rate (%)
Profit Factor
Ideal for both manual monitoring and automated bot strategies.
🔔 Bot-Ready Multi-Exchange Alerts
Alerts can be configured for:
ENTER-LONG, ENTER-SHORT
EXIT-LONG, EXIT-SHORT
TP1 / TP2 targets
Messages are fully customizable and designed for platforms like:
WonderTrading
3Commas
TradingConnector
⚙️ Designed For:
Timeframes: 1H and 4H (optimized for crypto)
Markets: Altcoins, BTC/ETH, high-volatility pairs
Traders: Trend-followers, momentum scalpers, algo bot users
Goal: High accuracy entries, structured exits, zero repainting, and flexible trade management
⚠️ TradingView Disclosure
This strategy is provided for educational purposes only. It does not constitute investment advice, nor does it guarantee any returns. Trading carries risk; test thoroughly before using in live environments.

Stealth Trigger X🔰 Stealth Trigger X — Smart Divergence & Breakout Strategy with Trend Weakness Exit
Stealth Trigger X is a precision-engineered, non-repainting strategy designed for traders who rely on high-conviction breakouts and trend confirmation. Rather than relying on lagging or oversimplified signals, this strategy fuses divergence logic, volatility detection, volume filtering, and slope-based trend validation into one clean system — making it both responsive and reliable.
📌 Core Components (How It Works):
1. ZLEMA (Zero-Lag Exponential Moving Average):
Used as the primary trend baseline. Unlike a standard EMA, ZLEMA compensates for lag by using a double-smoothing technique that allows the strategy to detect trend direction changes sooner — especially useful in crypto and fast-moving markets.
2. Gradient Filter (Slope of ZLEMA):
Rather than waiting for price to cross a moving average, the strategy measures the slope of the ZLEMA itself. Positive slope = uptrend, negative slope = downtrend. This gives us early trend validation and exit signals based on weakening momentum.
3. Vortex Indicator (Directional Volatility):
A diff-based implementation of the Vortex Indicator is used to validate whether volatility is expanding in favor of the trend. This prevents false entries during indecision phases or low-momentum conditions.
4. White Line Bias Filter (Structural Trend):
The strategy calculates the midpoint of the highest high and lowest low over a user-defined period. This “White Line” serves as a structural trend bias, ensuring entries align with the broader context — not just momentary momentum.
5. Volume Spike Confirmation:
To avoid manipulation and choppy conditions, the strategy confirms breakouts only when the current bar’s volume exceeds the median volume of recent candles by a set multiplier. This filters out noise and ensures only high-conviction moves trigger entries.
6. Breakout with Divergence Timing:
A hybrid logic checks for price breaking previous range highs/lows (breakouts), combined with simulated divergence behavior based on RSI-like momentum. This helps align entry timing with areas where price is likely to accelerate.
⚙️ Trade Management Logic:
Entry Conditions:
Triggered when all conditions align: ZLEMA slope, Vortex confirmation, White Line bias, volume spike, and divergence-based breakout.
Take Profits:
TP1: 50% of position is closed using a limit order
TP2: Remaining 50% closed with another limit order
This split exit approach lets profits run while locking in gains early.
Exits on Trend Weakness:
If trend conditions weaken (slope flip or vortex flip), the position is exited before a full reversal occurs — helping protect capital during exhaustion phases.
Reentry Delay:
Enforces a 1-bar cooldown between exit and new entries to avoid “ping-pong” signals and maintain clean backtest results.
📊 Real-Time Dashboard (On-Chart):
Displays critical stats including:
Current position (Long, Short, or Flat)
Entry price
TP1 and TP2 hit status
Win rate (%)
Profit factor
Bars since entry
This makes live trading or visual backtesting easy to interpret and track.
✅ Key Facts:
Non-Repainting: All signals are calculated using confirmed bar data only. No future bars or security() functions are used.
Original Logic: This is not a generic mashup. Each component (ZLEMA slope, vortex diff, breakout divergence, volume spike filtering, White Line structure) is optimized to work in tandem.
Best Timeframes: 1H – 4H
Markets: Crypto, Forex, Indices — any market with trending behavior and measurable volume
⚠️ Disclaimer:
This strategy is for educational purposes only. It is not financial advice or a recommendation to trade. Past performance does not guarantee future results. Always trade with proper risk management and backtest strategies before live deployment.
🧠 Summary:
Stealth Trigger X is built for traders who want:
Precision entries
Early trend exits
Reliable backtest integrity
Clean logic with no repainting
It is especially effective in breakout environments where volume and momentum align — and excels at avoiding weak or manipulated trends.

Hyperion Crypto Matrix: Ultimate Market Sentinel
// 🔰 HYPERION CRYPTO MATRIX: ULTIMATE MARKET SENTINEL
// ─────────────────────────────────────────────────────────────────────────────
/*
The **Hyperion Crypto Matrix** is an advanced crypto trend-following strategy built from the ground up for precision, not just performance. Unlike traditional “mashups” of indicators, this system was **engineered around synergy**—each module is purpose-driven and non-redundant, delivering fast, filtered, high-probability signals in volatile crypto markets.
─────────────────────────────────────────────────────────────
📌 STRATEGY PURPOSE
─────────────────────────────────────────────────────────────
Hyperion is built for **1-hour crypto trading** and optimizes for:
- High Win Rate
- Early Exits on Trend Weakness
- Partial Position Scaling (TP1/TP2)
- Real-time trade performance tracking
It is ideal for traders who want **real-time trade logic** with:
- No repainting
- No overfitting
- Realistic entry/exit structure
- No same-bar entry & exit (enforces 1-bar delay)
─────────────────────────────────────────────────────────────
🧠 WHAT MAKES IT ORIGINAL
─────────────────────────────────────────────────────────────
Each component is **custom-integrated** with strict role separation:
- **Trend Direction:** Enhanced Wave Oscillator (EWO) with adaptive band filtering
- **Trend Strength Memory:** Relative Momentum Index (RMI) with threshold locking
- **Volume Confirmation:** Historical relative volume spike filter using SMA multiplier
- **Momentum Weakness Exit:** Combined ROC and CCI to detect early reversal before price turns
- **Position Tracking:** TP1 (50% exit), TP2 (100% close) with cooldown to prevent whipsaws
- **Dynamic Dashboard:** Real-time stats including win rate, PnL efficiency, and TP hit status
These aren’t just “plugged in” indicators—they are synchronized to **filter, confirm, and adapt** to price action with timing logic that prevents premature entries or late exits.
─────────────────────────────────────────────────────────────
📊 INDICATOR LOGIC OVERVIEW
─────────────────────────────────────────────────────────────
1. **📈 Enhanced Wave Oscillator (EWO):**
- Calculates the delta between a fast and slow EMA (5 vs. 34 by default)
- Uses a dynamic banding system to detect peaks/troughs and prevent entries during exhaustion
- Filters only active, accelerating trends — reducing false positives
2. **🧠 Relative Momentum Index (RMI):**
- Similar to RSI but with a forward-looking momentum comparison
- Confirms trend *persistence* over time, preventing entries on short-term flips
- Long entries only allowed when RMI > threshold (default 55), short if RMI < 45
3. **🔊 Volume Spike Filter:**
- Uses 20-bar SMA of volume and a multiplier (1.5x default) to detect **relative volume breakouts**
- Prevents trades in low-liquidity environments (e.g., chop, overnight sessions)
4. **📉 Weak Trend Close Logic:**
- Combines Rate of Change (ROC) and Commodity Channel Index (CCI)
- Detects early signs of momentum deterioration, often before the trend visually reverses
- Triggers exit before price falls into sideways zones
5. **🎯 Take Profit System (TP1/TP2):**
- TP1: 50% position closed at +2% (default)
- TP2: Full close at +4% (default)
- Uses `strategy.exit()` with limit orders based on entry price
6. **⏱️ Reentry Cooldown:**
- After TP2 or weak trend exit, system enforces a 1-bar delay before reentry
- Avoids frequent churn in flat or noisy environments
7. **📋 Real-Time Dashboard (Optional):**
- Displays live trade status, PnL metrics, TP1/TP2 hit status, bars since entry, win rate %, and profit factor
- Color-coded background to highlight active trade direction (green for long, red for short)
─────────────────────────────────────────────────────────────
⚙️ HOW TO USE
─────────────────────────────────────────────────────────────
1. Load on a 1H chart of a crypto asset with good liquidity (e.g., BTC, ETH, LINK)
2. Toggle between \"Long Only\", \"Short Only\", or \"Both\" in the settings
3. Use default TP1/TP2 percentages, or tune them for the asset’s volatility
4. Observe trade execution and live stats on the optional dashboard
5. Review the bar coloring for EWO trend bias confirmation
> Stop-loss logic is not included. This strategy assumes exits occur at TP2 or on trend/momentum failure.
─────────────────────────────────────────────────────────────
⚖️ TRADINGVIEW COMPLIANCE & USAGE DISCLAIMER
─────────────────────────────────────────────────────────────
This strategy does **not repaint**, is fully compatible with **TradingView backtesting**, and adheres to all known Pine Script execution rules.
⚠️ **Disclaimer:** This script is for educational purposes only and does not constitute financial advice. Trading cryptocurrencies involves significant risk. Always test strategies on a demo account and consult with a financial advisor before live trading.
─────────────────────────────────────────────────────────────
🧪 CONCLUSION
─────────────────────────────────────────────────────────────
The **Hyperion Crypto Matrix** is not a mashup—it’s a **modular, optimized, logic-driven system** crafted for real-world crypto trading. Every component has been tuned for function, not fluff. Whether you're backtesting or live trading, this system is designed to give you **structured, actionable edge** with live feedback every step of the way.
*/

Trend MatrixFinal TradingView-Compliant Description for Trend Matrix
Trend Matrix is a precision-engineered trend-following strategy built for high-confidence entries and tactical trade management.
This strategy combines multiple non-repainting filters, each with a distinct role, to form a unified "trend matrix" that confirms directional bias, volume commitment, and momentum strength — all before entry is considered.
🔍 Core Components & Why They’re Used
🧠 Gaussian Filter (Custom)
A smoothed Gaussian-weighted moving average is used to detect trend direction changes. Unlike standard EMAs, this filter minimizes lag while retaining smooth transitions — ideal for confirming trend shifts without false reversals.
📈 RMI Trend Memory
A Relative Momentum Index is used to validate trend direction persistence. RMI's ability to filter out short-term oscillations makes it ideal for confirming whether a trend is still active.
📊 Gradient Filter (ZLEMA-based)
Measures the slope of a ZLEMA-smoothed close. If slope flips, it signals a potential trend weakness. This provides real-time confirmation for entry or exit bias.
📉 Volume Spike Detection
Confirms that breakouts or trend continuations are supported by volume commitment. Uses a dynamic SMA-based volume filter with a user-defined multiplier.
🟦 White Line (Bias Midpoint)
This structural component calculates the midpoint of the highest high and lowest low over a range — providing directional context and helping eliminate trades in consolidation zones.
🎯 Entry Conditions
Long entries require:
Gaussian trend flip to the upside
RMI > 50 (bullish memory)
Volume spike confirmation
Positive gradient (ZLEMA slope)
Price above White Line (bias filter)
Short entries use the inverse logic.
All entries enforce a cooldown bar to prevent same-bar reversals or whipsaw trades.
🎯 Exit Conditions
Take Profit 1: 50% of position at +2%
Take Profit 2: Remaining 50% at +4%
Early Exit on Trend Weakness:
Position closes fully if the trend weakens (RMI flip or gradient reversal)
📊 Dashboard + Performance Tracking
The built-in dashboard shows:
Current Position
Entry Price
TP1/TP2 Hit Status
Bars Since Entry
Win Rate (%)
Profit Factor
Useful for manual tracking or live trading review.
🌐 Multi-Exchange Bot Compatibility
Trend Matrix is built with universal trade alerts using customizable comment= fields. This makes it compatible with any exchange-connected bot platform such as:
WunderTrading
3Commas
Alertatron
Cornix
Or any webhook-based trading system
Alerts are sent using the {{strategy.order.comment}} placeholder, allowing you to route entries and exits through your preferred exchange account on Binance, Bybit, OKX, Kraken, and others.
🛠️ Customization
All components are modular:
TP1/TP2 levels
Gaussian length & sigma
Volume spike filter sensitivity
Gradient & White Line length
RMI settings
You can tailor the strategy for different assets or timeframes — optimized for crypto 1H, but works with stocks, FX, or lower timeframes with adjusted parameters.
✅ Final Notes
Trend Matrix is not just a mashup — it's a synchronized system of filters with clear roles, designed to maximize trade confidence and minimize noise. Every layer of confirmation serves a purpose, making this a highly adaptive trend-following tool for any market environment.
⚠️ Disclaimer (as required by TradingView)
This script is for educational purposes only and does not constitute financial advice. Use at your own risk. Always test strategies thoroughly before applying them in live trading environments. Past performance is not indicative of future results.
Tactical FlowTactical Flow – Altcoin Swing Strategy with Trend Logic & Dynamic TP System
(Built for 1H timeframe altcoin trading)
🎯 Purpose
Tactical Flow is a swing trading strategy purpose-built for altcoins on the 1-hour timeframe. It targets clean trend continuation setups by combining non-repainting filters for direction, momentum, and volume with a real-time execution engine that strictly avoids same-bar reversals. It includes a dynamic take-profit system with real-time trade tracking and an integrated visual dashboard.
⚙️ Strategy Core Components
Each module was chosen for precision, trend clarity, and altcoin-specific price behavior.
🔹 1. White Line Bias
Defines market structure using the midpoint of recent high/low range.
→ Keeps you trading with the dominant structure.
🔹 2. Tether Trend Engine
Two mid-range bands (Fast & Slow Tether) act like a dynamic trend cloud.
→ Ensures trend direction is confirmed with structural layering.
🔹 3. ZLEMA Gradient Filter
A Zero Lag EMA of price that’s compared to its previous value for momentum slope.
→ Confirms the trend has actual energy behind it.
🔹 4. TEMA Micro-Flow
A smoothed directional signal to confirm price is accelerating, not just trending.
→ Filters out late or fading entries.
🔹 5. Volume Spike Filter
Confirms that breakouts are real by requiring volume > 1.5× median of previous candles.
→ Designed for altcoins to avoid fakeouts during random volatility.
🔹 6. RMI Trend Memory
Keeps track of the trend state over time, allowing for smoother transitions and fewer whipsaws.
→ Helps the strategy stay in trend longer and only reverse when confirmation is strong.
🔹 7. Reversal Cooldown Logic
Exits a trade, then waits 1 full bar before taking a reversal entry.
→ Avoids common backtest false positives where entries and exits occur on the same candle.
💸 Trade Management – TP1/TP2 Logic
TP1 = 50% closed when price hits target 1
TP2 = full exit
Exits early if trend weakens
Supports dynamic reentry after TP2 if trend resumes
→ Keeps risk controlled while allowing position scaling in volatile altcoin swings.
📊 Strategy Dashboard
Visual interface shows:
Current Position (Long / Short / Flat)
Entry Price
TP1 and TP2 hit status
Bars since entry
Real-time Win Rate
Profit Factor
🧪 Backtesting & Execution Compliance
✅ Fully non-repainting
✅ Compatible with TradingView's deep backtesting
✅ Uses strategy.exit with limit logic for accurate TP tracking
✅ No stop-loss — closes trades on trend weakening only
🔥 Best Use Case
Altcoin swing trades on 1H chart
Works well during trending periods with volume
Not designed for choppy or sideways conditions
Pairs well with watchlist scanners and heatmaps

Relative Momentum Deviation | QuantEdgeB📊 Introducing Relative Momentum Deviation (RMD) by QuantEdgeB
🛠️ Overview
Relative Momentum Deviation (RMD) is a precision-crafted momentum-based oscillator that measures relative price deviation through a normalized RSI structure and volatility-weighted SD bands. Unlike standard oscillators, RMD dynamically adapts its thresholds using rolling standard deviation on a DEMA-based foundation, making it uniquely responsive in both trending and ranging environments.
Designed to filter out noise and detect critical breakout zones, RMD is a powerful addition to any quantitative trader’s toolkit. Whether used as a standalone entry/exit signal or confirmation layer, RMD excels at identifying momentum inflection points with statistical confidence.
✨ Key Features
🔹 Normalized RSI-Based Core
RMD calculates momentum using a custom RSI of a DEMA-filtered source, delivering a smooth and responsive signal.
🔹 Volatility-Adaptive SD Thresholds
Dynamic upper and lower thresholds adjust in real-time using standard deviation, reducing false positives during low-volatility phases.
🔹 Dual Confirmation Signal Logic
RMD compares both deviation bands to user-defined thresholds to issue high-confidence trend entries.
🔹 Backtesting Integration & Visual Equity Curve
With built-in support for the QuantEdgeB Backtesting Framework, RMD allows seamless strategy validation.
🔹 Clean Visuals & Label Customization
Includes candle coloring, dynamic overlays, signal labels, and optional trend structure plots.
📊 How It Works
1️⃣ Normalized RSI of a DEMA Source
The heart of RMD lies in a momentum oscillator built from:
• 📌 Source Input → A DEMA of price (default 30)
• 📌 Momentum Foundation → RSI calculated from the DEMA output
• 📌 Smoothing Length → Controls the responsiveness of the base signal (default 14)
This creates a stable momentum oscillator less prone to fake-outs during sudden volatility spikes.
2️⃣ Standard Deviation Filtering Engine
RMD employs volatility-weighted SD bands to define statistically meaningful thresholds:
📌 Formula Breakdown:
• NormUp = RSI - SD
• NormDn = RSI + SD
These boundaries adapt based on recent price dispersion. The upper and lower bands dynamically expand or contract depending on market behavior.
3️⃣ Signal Logic & Triggering Conditions
• ✅ Long Signal → NormUp crosses above the long threshold (default: 65)
• ❌ Short Signal → NormDn drops below the short threshold (default: 50)
This approach means signals only occur during statistically significant deviation from mean momentum, making them less frequent but more robust.
✅ Visual Signal Features
• 🔹 Candle coloring based on signal direction (Long/Short)
• 🔹 Label plots on crossover confirmations
• 🔹 Momentum band plots for discretionary or system-based confirmation
👥 Who Should Use It?
✅ Momentum Traders → Identify directional bias with low noise
✅ Swing Traders → Confirm turning points with volatility-adjusted deviation
✅ Quantitative Developers → Integrate into backtested strategies with ease
✅ Range-Trading Specialists → Use SD bands to anticipate overextended moves
⚙️ Customization & Default Settings
🔧 Core Inputs:
• Base RSI Length (Default: 14)
• Source Smoothing (DEMA, Default: 7)
• SD Length (Default: 40) → Controls volatility window
• SD Multiplier (Default: 0.7) → Adjusts sensitivity of deviation thresholds
• Signal Thresholds (L/S Default: 65 Long - 50 Short) → Controls breakout trigger levels
• Color Mode Themes → Six color themes included
• Signal Labels Toggle → Optional signal label plotting
• Backtest Table & Equity Curve Options
📊 Backtest Mode
RMD includes an optional backtest table, enabling traders to assess its historical effectiveness before applying it in live trading conditions.
🔹 Backtest Metrics Displayed:
• Equity Max Drawdown → Largest historical loss from peak equity.
• Profit Factor → Ratio of total profits to total losses, measuring system efficiency.
• Sharpe Ratio → Assesses risk-adjusted return performance.
• Sortino Ratio → Focuses on downside risk-adjusted returns.
• Omega Ratio → Evaluates return consistency & performance asymmetry.
• Half Kelly → Optimal position sizing based on risk/reward analysis.
• Total Trades & Win Rate → Assess historical success rate.
📌 Disclaimer:
Backtest results are based on past performance and do not guarantee future success. Always incorporate real-time validation and risk management in live trading.
🚀 Why This Matters?
✅ Strategy Validation → Gain insight into historical trend accuracy.
✅ Customization Insights → See how different settings impact performance.
✅ Risk Awareness → Understand potential drawdowns before deploying capital.
📌 How to Use RMD in Your Strategy
1️⃣ Momentum Breakout Strategy
✔ Go Long when NormUp > L → Indicates strong upward deviation
✔ Go Short when NormDn < S → Indicates sharp downward momentum
✔ Use SD Mult to control sensitivity and smoothness
2️⃣ Volatility Regime Awareness
✔ In low-volatility → Decrease SD multiplier to catch early signals
✔ In high-volatility → Increase SD multiplier to avoid noise
🔍 Bonus: Extra Trend Structure Plots
RMD includes optional ALMA + multi-EMA trend band overlays:
• Use them to confirm momentum alignment
• Great for hybrid strategies (e.g. trend + momentum)
📌 Conclusion
Relative Momentum Deviation (RMD) by QuantEdgeB offers a clean and adaptive approach to momentum trading by combining a normalized RSI structure with volatility-driven breakout zones.
With built-in signal confirmation, smart filtering, and rich backtest capabilities, RMD excels as a dynamic momentum companion for both discretionary and system traders.
🔹 Key Takeaways:
1️⃣ Adaptive Deviation Zones – Responsive to real-time volatility
2️⃣ Normalized RSI Core – Clean, smoothed momentum insight
3️⃣ Backtest + Visual Toolkit – Strategy-friendly and ready to deploy
📌 Trade with Statistical Precision | Powered by QuantEdgeB
🔹 Disclaimer: Past performance is not indicative of future results.
🔹 Strategic Advice: Always backtest, optimize, and align parameters with your trading objectives and risk tolerance before live trading.

Williams %R StrategyThe Williams %R Strategy implemented in Pine Script™ is a trading system based on the Williams %R momentum oscillator. The Williams %R indicator, developed by Larry Williams in 1973, is designed to identify overbought and oversold conditions in a market, helping traders time their entries and exits effectively (Williams, 1979). This particular strategy aims to capitalize on short-term price reversals in the S&P 500 (SPY) by identifying extreme values in the Williams %R indicator and using them as trading signals.
Strategy Rules:
Entry Signal:
A long position is entered when the Williams %R value falls below -90, indicating an oversold condition. This threshold suggests that the market may be near a short-term bottom, and prices are likely to reverse or rebound in the short term (Murphy, 1999).
Exit Signal:
The long position is exited when:
The current close price is higher than the previous day’s high, or
The Williams %R indicator rises above -30, indicating that the market is no longer oversold and may be approaching an overbought condition (Wilder, 1978).
Technical Analysis and Rationale:
The Williams %R is a momentum oscillator that measures the level of the close relative to the high-low range over a specific period, providing insight into whether an asset is trading near its highs or lows. The indicator values range from -100 (most oversold) to 0 (most overbought). When the value falls below -90, it indicates an oversold condition where a reversal is likely (Achelis, 2000). This strategy uses this oversold threshold as a signal to initiate long positions, betting on mean reversion—an established principle in financial markets where prices tend to revert to their historical averages (Jegadeesh & Titman, 1993).
Optimization and Performance:
The strategy allows for an adjustable lookback period (between 2 and 25 days) to determine the range used in the Williams %R calculation. Empirical tests show that shorter lookback periods (e.g., 2 days) yield the most favorable outcomes, with profit factors exceeding 2. This finding aligns with studies suggesting that shorter timeframes can effectively capture short-term momentum reversals (Fama, 1970; Jegadeesh & Titman, 1993).
Scientific Context:
Mean Reversion Theory: The strategy’s core relies on mean reversion, which suggests that prices fluctuate around a mean or average value. Research shows that such strategies, particularly those using oscillators like Williams %R, can exploit these temporary deviations (Poterba & Summers, 1988).
Behavioral Finance: The overbought and oversold conditions identified by Williams %R align with psychological factors influencing trading behavior, such as herding and panic selling, which often create opportunities for price reversals (Shiller, 2003).
Conclusion:
This Williams %R-based strategy utilizes a well-established momentum oscillator to time entries and exits in the S&P 500. By targeting extreme oversold conditions and exiting when these conditions revert or exceed historical ranges, the strategy aims to capture short-term gains. Scientific evidence supports the effectiveness of short-term mean reversion strategies, particularly when using indicators sensitive to momentum shifts.
References:
Achelis, S. B. (2000). Technical Analysis from A to Z. McGraw Hill.
Fama, E. F. (1970). Efficient Capital Markets: A Review of Theory and Empirical Work. The Journal of Finance, 25(2), 383-417.
Jegadeesh, N., & Titman, S. (1993). Returns to Buying Winners and Selling Losers: Implications for Stock Market Efficiency. The Journal of Finance, 48(1), 65-91.
Murphy, J. J. (1999). Technical Analysis of the Financial Markets: A Comprehensive Guide to Trading Methods and Applications. New York Institute of Finance.
Poterba, J. M., & Summers, L. H. (1988). Mean Reversion in Stock Prices: Evidence and Implications. Journal of Financial Economics, 22(1), 27-59.
Shiller, R. J. (2003). From Efficient Markets Theory to Behavioral Finance. Journal of Economic Perspectives, 17(1), 83-104.
Williams, L. (1979). How I Made One Million Dollars… Last Year… Trading Commodities. Windsor Books.
Wilder, J. W. (1978). New Concepts in Technical Trading Systems. Trend Research.
This explanation provides a scientific and evidence-based perspective on the Williams %R trading strategy, aligning it with fundamental principles in technical analysis and behavioral finance.
