Improved Volume Based Indicator# Improved Volume Based Indicator
## Overview
The Improved Volume Based Indicator is a technical analysis tool designed to identify potential trading opportunities based on volume patterns, price action, and trend direction. This indicator combines volume analysis with moving averages and the Average True Range (ATR) to generate buy and sell signals.
## Key Components
1. Volume Analysis
- Tracks consecutive volume direction (up or down) for 3 periods
- Calculates volume ratio compared to a short-term moving average
2. Trend Direction
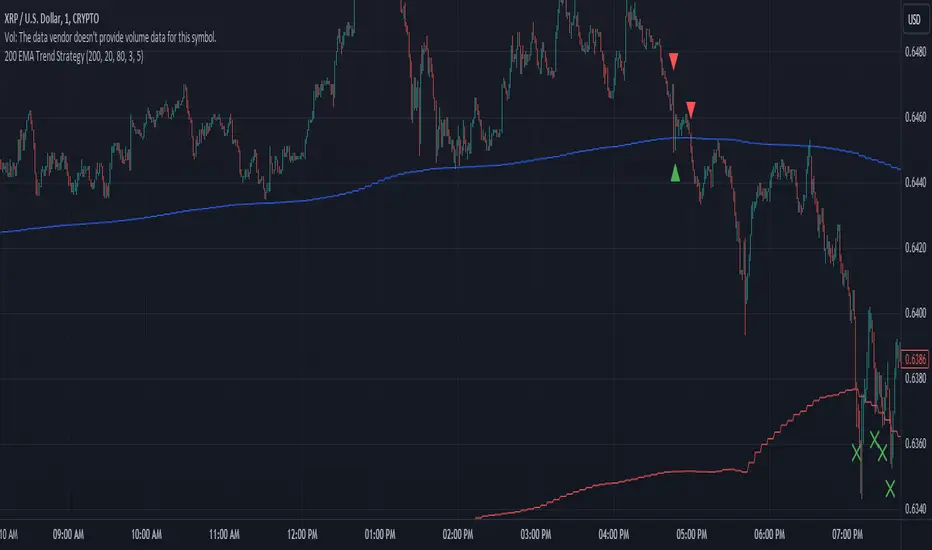
- Uses a 200-period Exponential Moving Average (EMA) to determine overall trend
3. Volatility Measurement
- Incorporates the Average True Range (ATR) for stop-loss and take-profit calculations
## Signal Generation
### Buy Signal Criteria
1. Three consecutive periods of up volume (close > open)
2. Volume ratio > 1.5 (current volume is 50% higher than the short-term average)
3. Current price is above the 200 EMA
### Sell Signal Criteria
1. Three consecutive periods of down volume (close < open)
2. Volume ratio > 1.5 (current volume is 50% higher than the short-term average)
3. Current price is below the 200 EMA
## Risk Management
The indicator calculates stop-loss and take-profit levels based on the ATR:
- Stop Loss: ATR * 1.5 (default)
- Take Profit: ATR * 2.5 (default)
These levels are adjustable through input parameters.
## Usage
1. Add the indicator to your chart
2. Adjust input parameters as needed:
- Volume Period (2-5)
- ATR Period (default 14)
- ATR Multipliers for Stop Loss and Take Profit
- EMA Period (default 200)
3. Monitor for buy and sell signals
4. Use the provided stop-loss and take-profit levels for risk management
## Interpretation
- Buy signals suggest potential upward price movement
- Sell signals suggest potential downward price movement
- Always consider other factors and perform additional analysis before making trading decisions
## Limitations
- This indicator may generate false signals in choppy or ranging markets
- It's best used in conjunction with other technical analysis tools and fundamental analysis
- Past performance does not guarantee future results
Remember to thoroughly test this indicator on historical data and in various market conditions before using it in live trading.
---
# 改進的基於交易量的指標
## 概述
改進的基於成交量的指標是一種技術分析工具,旨在根據成交量模式、價格行為和趨勢方向識別潛在的交易機會。此指標將成交量分析與移動平均線和平均真實波動幅度 (ATR) 結合起來,以產生買入和賣出訊號。
## 關鍵部件
1. 成交量分析
- 追蹤 3 個週期的連續成交量方向(向上或向下)
- 計算與短期移動平均線相比的成交量比率
2. 趨勢方向
- 使用 200 週期指數移動平均線 (EMA) 來確定整體趨勢
3. 波動率測量
- 納入平均真實波動範圍 (ATR) 以進行停損和停盈計算
## 訊號生成
### 購買訊號標準
1. 連續三個週期的成交量上漲(收盤>開盤)
2.成交量比率>1.5(目前成交量較短期平均高50%)
3. 當前價格高於200 EMA
### 賣出訊號標準
1.連續三個週期的成交量下跌(收盤<開盤)
2.成交量比率>1.5(目前成交量較短期平均高50%)
3. 目前價格低於200 EMA
## 風險管理
此指標根據 ATR 計算停損和止盈水準:
- 停損:ATR * 1.5(預設)
- 止盈:ATR * 2.5(預設)
這些等級可透過輸入參數進行調整。
## 用法
1. 將指標加入您的圖表中
2. 根據需要調整輸入參數:
- 卷期 (2-5)
- ATR 週期(預設 14)
- 用於停損和止盈的 ATR 乘數
- EMA 週期(預設 200)
3. 監控買賣訊號
4. 使用提供的停損和停利水準進行風險管理
## 解釋
- 買進訊號表示價格可能上漲
- 賣出訊號表示價格可能下跌
- 在做出交易決策之前始終考慮其他因素並進行額外分析
## 限制
- 此指標可能會在波動或波動的市場中產生錯誤訊號
- 最好與其他技術分析工具和基本面分析結合使用
- 過去的表現並不能保證未來的結果
請記住,在實際交易中使用該指標之前,請根據歷史數據和各種市場條件徹底測試該指標。
Pine Script® indicator