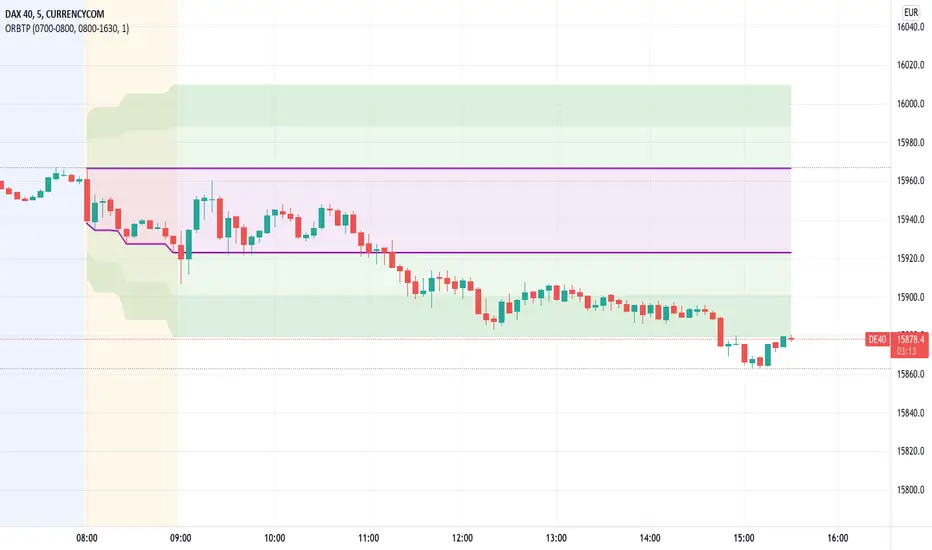
Open Range Breakout With Take Profit Zones
Open Range Breakout With Take Profit Zones prints the open range and profitable zones based on the high and low during the opening hours.
This indicator can be used to prepare breakout trades following the OPR strategy. The time window for the open range as well as for the market hours can be configured. Also custom alerting templates allow to create alerts when a breakout out of the opening range occurs or when 50% take profit level is reached.
The background of pre and post market hours is coloured according to the configured time windows.
This indicator was written to support scalping and day trading. It does not calculate or display results on hourly, daily or weekly charts.
The open range and trading hours must be adjusted to the market time zone of your instrument. Also please take care that these settings are saved on the layout and not per instrument. Eventually create multiple layouts for instruments with different market time zones.
Search in scripts for "profitable"
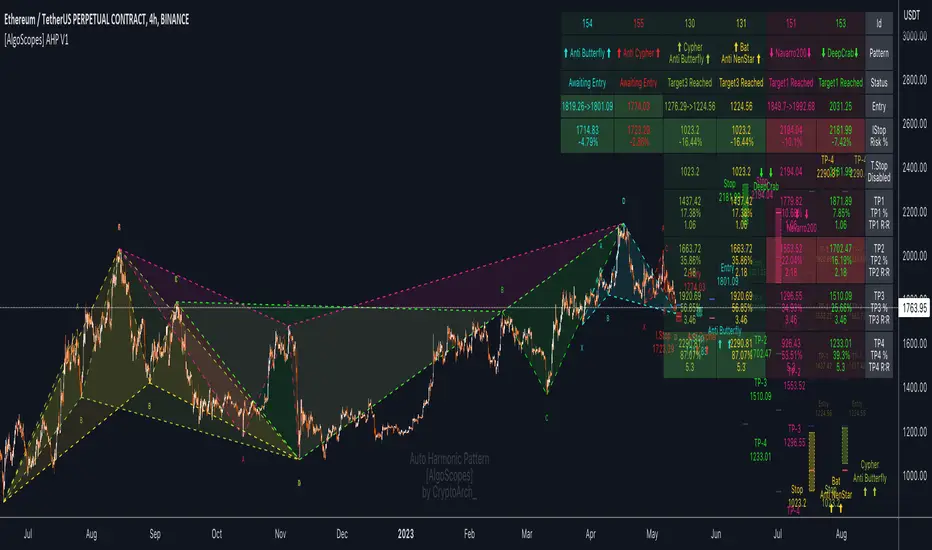
Auto Harmonic Pattern - PRO [AlgoScopes] V1Harmonic Patterns is a powerful tool for identifying potential reversal areas in the financial markets. Auto Harmonic Pattern Pro it is based on the work of Scott Carney, a renowned trader and author who developed the concept of harmonic patterns.
Scott Carney's extensive research and contributions have greatly enhanced our understanding of market patterns and their application in trading. Auto Harmonic Pattern Pro is adapted from Scott Carney's original work on harmonic patterns, as well as other sources that have contributed to the recognition and understanding of harmonic patterns beyond Carney's initial research.
Auto Harmonic Pattern Pro offers traders a valuable tool for identifying potential reversal zones in the markets. We would like to express our gratitude to Scott Carney for his pioneering work in developing harmonic patterns, as well as to the various contributors and sources that have expanded our knowledge and understanding of harmonic patterns beyond Carney's original research.
Remember to always practice proper risk management and combine the indicator's signals with other technical analysis tools for a comprehensive trading approach.
For more information about Scott Carney and his work on harmonic patterns, you can find additional resources on his official website.
💠 ABOUT THE SCRIPT
💎 DISPLAY
⚬ The following things are displayed by default on the chart
🔸 Live patterns in trade with XABCD labels. (filled major triangle)
🔸 Entry, Stop and Target levels on chart for all live patterns. Target level are dimmed along with reducing size when they become irrelevant
🔸 Open Trades Stat table - Show patterns ID, patterns name, status for patterns, size&age, Entry, I.Stop, T.Stop and Targets (TP1 - TP4).
⚬ Highlighted present stop (and/or trailing stop if is enabled) and next target
⚬ When there are multiple patterns on chart, Entry, Stop, and Target labels & lines & PRZ* boxes are created with specific distance from each other to provide clarity to the users
*(potential reversal zone)
⬜ SETTINGS
⚬ Let's talk about some of the settings. Almost all of these settings have already been optimized and tested over time, but for some tickers it might be better to do a new test.
💎 ZIGZAG
🔸 Length - Default is set to 8. User can change settings but it is a good idea to keep with fibonacci (5, 13, 21, 34, 55 etc)
🔸 Depth - This setting is for how many pivots indicator scan to find harmonic pattern. By default it is set as 200
🔸 Recursive Algorithm - Enabled will use recursive instead standard zigzag
💎 HARMONIC PATTERN SETTINGS
🔸 Trade Direction - Default is set to show all (bearish and bullish) harmonic patterns. Can be filtered to bullish or bearish direction.
🔸 Error Percent - Default is 8. That is error percent tolerance from perfect pattern ratio.
🔸 Maximum patterns - Maximum patterns allowed on chart at any time
⚬ When it reaches the maximum patterns and the indicator finds a new one, the old patterns will be removed
- (important for algo traders because alerts for those removed patterns will no longer be a trigger)
🔸 Pattern size
⚬ Without filter will show all patterns (regardless of size)
⚬ Show only patterns for user preference size (no more two patterns because is smaller of 280 bars)
🔸 External Filter - It can be used to filter harmonic patterns. You can build your own custom trend based scripts and use it with AHP to filter trades.
⚬ The structure of the external script must be
1 for Long/Bullish patterns
-1 for Short/Bearish patterns
2 for all (Long and Short patterns)
0 Trade is not allowed
🔸 Filter Pattern Starts
⚬ When Filter starts is enabled pattern will start for logical pivot (see example)
⚬ Disabled filter will show more patterns (still can be very profitable)
💎 STOP & ENTRY & TRAILING STOP
🔸 Trail Entry Price - If Entry is still not reached and the price is still in PRZ zone, at the new high/low will adjust Entry.
⚬ Open Stats table will show the first Entry (when patterns were found) as well as the last corrected Entry (when patterns reached Entry level).
⚬ Disable this option Entry will remain at the level when patterns are found.
🔸 Enable Targets (awaiting entry) - enabled will show potential Targets for "awaiting entry" patterns (not active patterns because they have not yet reached Entry).
⚬ The Open stats table will show all other information, risk %, R:R etc).
⚬ Risky trade but with very good R:R (not recommended for inexperienced traders, very high risk of trading hitting Stop before reaching a Target)
🔸 Stop Distance - By default is set to 5. That is percent from the last low/high when the pattern reaches Entry. Stop trail from price till pattern reached Entry level.
🔸 Entry Distance - By default is set to 16. Same for SL that is percent distance from live price. You can increase/decrease percent but remember you have to give space between live price and the entry.
⚬ If entry is close to price, trade will become active too quickly
⚬ Remember if you change Stop Distance as well as Entry Distance to check Risk : Reward (recommended R:R for the first target is about 1:1)
🔸 Trailing Type - Options for trailing type, Continuous, Stepped, Breakeven and Disabled.
⚬ Continuous - When the price reaches "Trailing Active" (initial level for activating the trailing stop), T.Stop will start from Entry or Initial Stop (based on "Trailing Starts") and follow the price by Distance or Percent (based on "Trailing by").
- example one (trailing starts from Initial Stop when TP1 reached by distance/price on picture 1 and by percent on picture 2)
- example two (trailing starts from Entry when TP1 reached by distance/price on picture 1 and by percent on picture 2)
⚬ Stepped - when price reaches Trailing Active (initial level for activating the trailing stop), T.Stop will move to the previous level
- (If "Trailing Active" is set to Target2, then T.Stop will move to Target1 when price reached TP2)
⚬ Breakeven - when price reaches Trailing Active (initial level for activating the trailing stop), T.Stop will move to Entry and stay there the entire time for that harmonic trade
- (till reached all targets or reached T.Stop)
🔸 Trailing Active - When will the Trailing Stop be activated ("Trailing Type" must be enabled)
🔸 Trailing by - Distance or Percent
⚬ Distance - T.Stop will follow live price by initial distance
⚬ Percent - T.Stop will follow live price by initial percent
🔸 Trailing Starts - Entry or Initial Stop
⚬ Entry - T.Stop will start trailing from Entry level
⚬ I.Stop - T.Stop will start trailing from initial Stop level
- (Check Continuous picture for information)
💎 TARGET
🔸 Base - The level from which the calculation for Targets is made.
🔸 Target 1/Target 4 dropdown - Targets are set by default and set in the dropdown most often used for those targets.
🔸 Target 1/Target 4 custom - If the desired ratio is not in the dropdown, then it is possible to manually enter the desired ratio.
⚬ (If you want to change some of the targets, maybe to confluence with support/resistance)
💎 PATTERNS
🔸 Harmonic Patterns Type
⚬ Enable/Disable harmonic patterns by Type of patterns (for Classic and Anti patterns)
⚬ By default all patterns are enabled (for standard patterns). Users can control and select/deselect all Classic, Anti or Non Standard patterns but also disable individual patterns.
⚬ For some patterns (like Shark and Navarro 200) we change PRZ or place in different Type groups. That is just cosmetic things.
🔸 Classic - This includes all and most popular Harmonic Patterns.
⚬ Gartley (Type I)
⚬ Bat (Type I)
⚬ Butterfly (Type II)
⚬ Crab (Type II)
⚬ Deep Crab (Type II)
⚬ Cypher (Type II)
⚬ Shark (Type III)
⚬ Nenstar (Type IV)
🔸 Anti Patterns
⚬ Anti Nenstar (Type I)
⚬ Anti Shark (Type II)
⚬ Anti Cypher (Type II)
⚬ Anti Crab (Type II)
⚬ Anti Butterfly (Type III)
⚬ Anti Bat (Type IV)
⚬ Anti Gartley (Type IV)
⚬ Navarro 200 (Type IV)
🔸 Non Standard -
⚬ White Swan
⚬ Black Swan
⚬ 3 Drive
⚬ Anti 3 Drive
⚬ Wolfe
⚬ Snorm
⚬ 121 Pattern
⚬ 5-0 Pattern
⚬ Sea Pony
⚬ Leonardo
💎 PATTERN DISPLAY OPTION
🔸 Pattern Lines Size - thickness for harmonic patterns
🔸 Pattern Lines Type - type for harmonic pattern lines (solid, dotted, dashed)
🔸 Fill XAB/BCD - major harmonic triangle
🔸 Fill ABC/XBD - minor harmonic triangle
🔸 Enable XABCD Label - labels for harmonic pattern
🔸 XABCD Label Size - size for harmonic xabcd labels
🔸 Enable Ratio Label & Line - lines and labels that connect harmonic patterns levels and that show the patterns ratio
🔸 Ratio Label Size - ratio labels size
⚬ Lines for pattern ratio are set by default dashed and can’t be changed.
💎 PRZ & ENTRY | STOP | TARGET SETTINGS
🔸 Entry & Stop & Target Labels - by default is set to small (opt small & normal)
🔸 Entry & Stop & Target Lines - by default is set to show lines & labels & price (opt lines & labels & price or lines & labels or disable all)
🔸 PRZ Box size - size in bars for PRZ box
⚬ Added option when it is not readable on chart pattern names or entry/stop/targets offset
⚬ Maximum (last pattern) can be drawn up to 500 bars in future or you will get error for script (use this option only when you need)
🔸 PRZ Box Type of Spacing - distance between PRZ boxes. "Auto" will make the maximum distance when there are more than 3 patterns on the chart for better visibility
- (the maximum can be projected up to 500 bars in the future)
🔸 PRZ Box Manual Spacing - manual distance between PRZ boxes if is “PRZ Box Type of Spacing” set to manual
💎 STATS AND DISPLAY
⚬ These settings can be used to manage display of open and close statistic tables
🔸 Open Trades - By default is enabled and set to the top right position.
🔸 Closed Trades - By default is disabled and set to bottom left position.
⚬ The size of the table can be changed (by default it is set to small)
🔸 Enable Tool Tip for Table - can be enabled/disabled. Shows important information for each section related to Open or Closed tables.
⚬ Recommended enabled until everything related to tables is understood, and later disabled (it starts to get annoying when you accidentally cross the tables with the mouse and tooltip box pop up)
💎 OPEN STATS
🔸 Percentage - show percentage for Targets and Stops
🔸 Risk/Reward - show patterns risk to reward for each Targets
🔸 Size/Age - show patterns size (from X to D in bars) and patterns age (distance in bars when patterns “In Trade”)
🔸 Live % & R:R - enabled will show live % and R:R if you take trade in that moment
💎 CLOSED STATS
🔸 Percentage - show stats by percent instead of numbers
🔸 Display Mode - Closed trade table have three display option, Compact, Detailed and Selective
⚬ Compact - show stats for Long/Bullish and Short/Bearish patterns
⚬ Selective - show stats just for active patterns
⚬ Detailed - show stats for each enabled patterns
- All stats is for “Backtest Bars” if enabled.
- I removed some things from the previous indicator (R:R as well as trailing R:R and win rate) because I think they are not relevant in Closed Table for trade or for statistics (Open Table have that)
💎 PATTERN | CHART COLOR THEME
⚬ By default it is set to Light color theme. Color theme will affect pattern lines, XABCD labels, ratio lines and label, entry/sl/targets labels and text in the open statistics table.
🔸 Dark Theme / Light Theme - Users can change any default individual color for dark or light theme (transparency too).
⚬ Light/Dark Theme suits dark or light chart background or user can change all color to preferred trade style.
⚬ Users have extra control to change all color to preferred trade style.
💎 ALERTS
⚬ Alerts - These settings help users to choose the type of alerts they want to receive.
🔸 New - New Harmonic Pattern is identified
🔸 Entry - Harmonic Pattern reached Entry level
🔸 Target 1/Target4 - Alert when patterns reached on of Target levels
🔸 Closure - Harmonic Pattern trade is closed. Reached all Targets or Stop or Trailing Stop (if is enabled)
🔸 Long & Short placeholders - Enabled will change for alerts Bullish/Bearish text for Long/Short text
⚬ example of custom alerts with some placeholders
💎 BACKTEST WINDOW
🔸 Backtest bars - Enabled will scan patterns for that bar range (default is set to 5000)
🔷 TOOL TIP
⚬ In setting you have help from tooltip to give you almost all this information for easy understanding. Hover mouse above tool tip and windows with info will appear.
⚬ On the chart, tool tip is added for each individual Harmonic pattern to show extra information (pattern ratio, type of harmonic and where often that pattern appears in Elliott wave fractal)
⚬ Tooltip for tables will also provide all the information related to Open and Closed tables. Disabled tooltip for tables will hide all information, but the tooltip for patterns will still remain.
🔴 Possible Errors
⚬ If a mistake is made in the settings and, for example, TP2 is set to 0.618 ratio and TP3 is changed to 0.5 ratio
- (the larger target is set to a smaller ratio than the smaller target), a red text will appear over most charts to indicate the error.
⚬ If Trailing Type is enabled and "Trailing Active" and "Trailing Starts" are set to the same level (Entry), a red text will appear on the charts to indicate an error
- (change "Trailing Active" to a higher level, TP1, or lower "Trailing Starts " to "I.Start")
Bjorgum Key Levels
Key Levels Aims to capture 3 of the most significant points in price action
Breakouts
False Breakouts (Traps)
Back Checks
These 3 points alone, if properly identified, can be some of the most significant points of movement in the price history of an asset and bring significant gains to traders, if capitalized on. Here are a few examples of these setups
Breakouts
Breakouts can bring significant rallies as the market swings one sided after key levels are breached. This entry type can bring large trending runs to follow. Momentum is on your side, but the trade off is a higher entry.
False Breakouts
Also known as a bull trap or a bear trap, false breaks can lead to swift and significant reversals and potential for a large and sudden move to the opposite side. When a key level breakout fails to hold, parties entering to capitalize on the "epic breakout" can get left holding the bag forcing them to exit at a loss, which can double the force of pressure. Traps can bring swift gains from good entry prices. However, price is still in a larger trend against you so momentum is weak, so price action is susceptible to roll over.
Backchecks
Back checks are pull backs in trend that find middle ground to the 2 areas already described. Both momentum and entry price are decent, but risk is defined as a key level has flipped offering entry with stops below demand, or above supply.
Combining these 3 methods helps to diversify risk, understand trend development, and bring steady gains. This script helps to identify these points to traders with analysis of key levels, price structure, and trend direction, while providing visual signals and alerts for when they occur.
Best of luck in your coding and trading and thank you for your support

SuperTrend WMA V1.5 (2021)STRATEGY version of SuperTrend WMA V1.5 (2021) Indicator:
The most important thing is to stay on top of the average probability. We are trying to create a model of mean that differs in the form of two time periods merged into one period.
SuperTrend WMA is the most important indicator for Market Trend analysis.
This is the version you can trade for the following. Trend by M15 is the most profitable trend on Trend following
SuperTrend V1.5 (2021) The settings cannot be modified because we believe that the numbers we set for the market will be exact and accurate. with trading experience and proper use
You can use the 1 minute ( M1 ) interval to check the market gap in the 1 day boundary.
You can use the 15 minute ( M15 ) interval to check the market gap in the 1 week boundary.
You can use the 4 hour ( H4 ) interval to check the market gap in the 1 Month boundary.
All three of these periods can be used together because they are the corresponding periods with the market averages.
We use averages to read market probabilities. It consists of complex time gaps built up to 3 different average levels.
The line WMA Green indicates an uptrend where we believe not to sell during that period. It will put you at risk of losing.
The line WMA Red indicates a possible downtrend. We intend not to make a purchase during that time as it may damage you.
Buy or sell signals are on the words. BUY OR SELL, The use of signals must be based on the trend.
For example, an uptrend would like to buy only, not sell because it is against the average.
We believe that anything can fool us, but the average cannot tell us this is why we intend for everyone to use the indicator SuperTrend WMA V1.5 ( 2021 )
And we sincerely hope that it'll be useful to everyone. And our team will continue to develop to make the use better.

PeCryptoThe PeCrypto Indicator is a momentum indicator developed by tradewithpecunia. The indicator is made with 5+ robust indicators for the crypto charts. The indicator has been made with the concepts of support and resistance, ascending/ descending channel, flag, and pole pattern & rising/falling wedges with the crossover of 3+ moving averages. Different parameters (mathematical calculations for each) have been set by us for each mentioned concept above. According to the parameter set by us, the indicator detects different trends in the price using 3 different algorithms. With the help of sigma calculations and the use of 4 different slopes the indicator catches momentum at different positions, according to the parameter set, and generates signal using the conjunction of both the above-mentioned rules. We call this a Kayo cum Shelve system because utilizing the concepts it finds the signals and after satisfying the parameters it generates the final signals. This ensures that there is a momentum check and enough buy and sell signals are generated.
Using 4 parameters for upper bound/lower bounds and divergence rules the catch for median points has been done. 7+ & 7- lengths are looked at from the median points where we have put the stop loss.
Note:
If you are using this script, you acknowledge that the past performance is not necessarily the indication of future results and there are many more factors that go into being a profitable trader.
Before you proceed:
We are not SEBI Registered Analysts and shall not be culpable for any loss incurred directly or indirectly. Our indicator is no holy grail system. Investment in the stock market is subject to market risk. Trading in stocks, futures, or options is not suitable for every trader and involves a considerable risk of loss.
The market may fluctuate, and the user always has a risk of loss, thus, we won’t be liable for any losses incurred while using our indicator, our trading ideas, or our approach.

[CP]Pivot Boss Floor Pivots with ATR Dilation and Dynamic LevelsINTRODUCTION:
Compared to all the Pivot Indicators available on Trading View Public Library, this Floor Pivots Indicator differentiates itself in two major original ways:
Dilates the Pivot Support/Resistance Levels into Support/Resistance Bands based on volatility
Displays the S/R Levels Dynamically , that is, only those levels will be shown that are close enough to the price resulting in much cleaner looking charts.
There were a few features whose logic I had figured out, but I could not implement them due Pine Script’s Limitation (they should really work on increasing Pine Script’s capacity instead of adding more and more features to the language in order to make it look ‘better’):
Showing multiple timeframe pivots at the same time (not possible due to Pine Script’s limitation on the ‘Max Number of Outputs’ )
Automatic Detection of highly profitable Double Hot Pivot Zones (DPZ), also due to the ‘Max Number of Outputs’ limit
GENERAL USER INPUTS:
Most of the settings are self-explanatory, however, a few of them need some explanation:
Show Floor Pivots Dynamically – This will turn ON the dynamic pivot levels, please note that this function will work ONLY IN INTRADAY timeframes.
Dynamic Pivot ATR Period – Period over which the ATR value is calculated to show the pivots dynamically.
ATR Threshold for Dynamic Floor Pivots – Simply put, the indicator will start displaying Pivot Levels if they fall within the 2*ATR distance (default value) of the price. You can increase this number if the volatility increases and vice-versa.
Use ATR to Dilate Intraday Pivot Levels – This will turn ON Floor Pivot Dilation, turning pivot ‘lines’ into ‘bands’ .
ATR Dilation Factor – This number decides the width of the Pivot bands. Larger this number, thicker the bands. Typically, high volatility stocks will require a higher number.
ATR Period – Same as Dynamic Pivot ATR Period, but for Pivot Level Dilation.
INDICATOR USAGE EXAMPLES:
This indicator works great in conjunction with my Pivot Boss Candlestick Scanner indicator.
There are a lot of optimizations I have done in the code, although it looks trivial at first glance, but it's fairly complex.
Feel free to use it and modify it as you wish.
Here are a few examples where the indicator has shown great entries and exits, with the default settings:
NIFTY 5m Chart
Reliance 5m Chart
Tesla 5m Chart
Bitcoin-USDT 15m Chart
FINAL WORDS:
Please understand that I have Cherry Picked the examples to showcase the capability of the indicator and its usage.
DO NOT conflate the accuracy of examples with the accuracy of this indicator.
Once you start using floor pivots, you will realize that a lot of days simply don’t give any high probability setups and you will simply sit out of the market and do nothing (which is a good thing).
If you really want to learn how to use Pivots, read the book ’Secrets of a Pivot Boss’ . This book can change your life.

PE BandPE Band is computed from the historical patterns of the Price Earnings Ratio (PE Ratio) for each individual stock. The advantage of the PE Band is its consideration for both the fundamental factor (i.e. profitability) and the historical trading pattern of a stock. But if you need to adjust to your favorite PE Band, you can still enter the PE figures in settings.
The use of PE Band is especially meaningful for listed companies, which have profitable track records. For a stock with stable earnings, its price tends to move within the PE Band. In other words, the stock price in one extreme tends move to the other extreme within the Band.

RockIt Algo Profit Track X (Add-on to RockIT Algo)The RockIT Algo Profit / Loss Tracker is an add-on for the RockIT Algo Indicator. It provides the profit / loss realized for each buy or sell signal. This way you can visually view the performance and make profitable decisions.
The RockIT Algo Indicator is designed to generate buy (Long) / sell (Short) signals & is developed using statistical analysis & forecasting techniques. The algorithm takes into consideration different dynamic variables of short, medium and long term price actions and high probability patterns to project future direction. It is suited for all types of trading and can be used for any stocks, forex pairs and crypto.
Disclaimer
TheStreetATM is not registered as financial or investment advisors. You take the responsibility of making the final decision based on the tools, education and information we provide. Trading stocks can lead to very large losses, and we strongly recommend to consult any registered financial advisor before making any decision based on information provided by “RockIT” Algo®. Thank you. We strongly advice to paper trade before making real trading decisions.

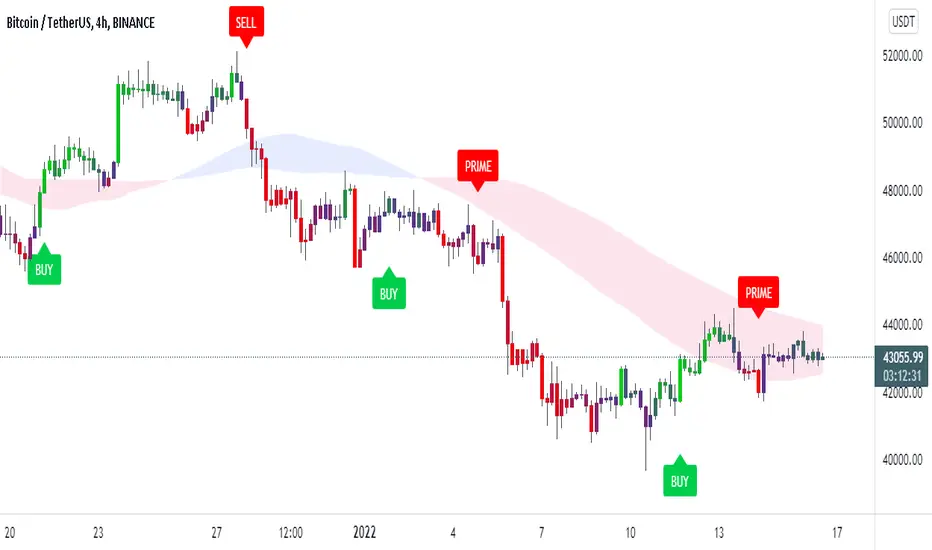
Trendorithm PrimeTrendorithm Prime is a toolkit made up of several different innovative indicators, designed by our team of developers. Get access now and create your own, unique trading strategies using our - all in one algorithm.
Our algorithm works in any market and focuses on finding the direction of the trends and remove noise from the price, for smooth understanding of the market.
Extra Confirmation
Using binomial distribution, the past values are processed to interpret the direction of trend.
After that, the signals are triggered based the volatility of the market,which is derived from the averages of candle size. All of these signals were optimised for each timeframe using timeframe multiplier.
Setting a lesser value on quotient adjusts the lookback length and volatility conditions, thus producing more number of signals that supports scalping trades. Higher the number in quotient, the frequency of trades reduce which helps the trader to hold trades for longer time.
Our Confirmation Signals helps to analyze the direction of trends for all markets and all timeframes, it boosts Trader’s confidence prior taking trades.
We made our Confirmation Signals flexible in order to suit any kind of trading style.
By adjusting the Quotient value in the settings, Traders can control the frequency of signals generated easily.
The Confirmation Signals includes a special type of signal called "Prime" which includes candle coloring to see the strength of the trend.
Our Candle-system is designed in 3 different colorings.
Green ( Bullish )
Red ( Bearish )
Purple (possible reversal or the possible formation of a new trend)
Trendo Cloud
The power of moving averages is always ultimate. This cloud made up of multiple moving averages acts as a dynamic support and resistance. The color and width of the cloud is used to find potential entry and exit points for trades.
Trend Catcher and Trend Chaser
The trend catcher is a trend-following indicator moves close to the price that aims to estimate the recent trend of price. It indicates green in uptrend and red in case of a downtrend.
The trend chaser is similar to the previous Trend Catcher, but it aims to chase long-term trends.
They are specially calculated from the highs and lows of price. Acts as a filter for confirmation signals and provides clarity for the direction of trend.
All of these functionalities tend to help users understand the market conditions as trending or ranging.
If you are using this script, you acknowledge that past performances are not indicative of future results and that there are a lot of factors required that go into being a profitable trader.
You can see the Author’s instructions below to get access to this prime indicator.
Power Oscillator MTF
Power Oscillator MTF
ENGLISH:
At ApiDevelopers, we develop solutions for traders , these indicators are built based on effective strategies that we learn from some profitable traders or historically effective strategies.
This time we present the Power Oscillator MTF indicator. This is a multitemporal indicator based on the Squeeze Momentum Indicator (SQZMON) and the Elliot Waves , which allows you to see in a single graph the main and secondary waves that move the market, it is a reality that the market moves by waves, in fact it is the largest and oldest truth that exists in financial markets, but no one had been able to create an indicator that would allow us to see the fluctuations of those waves and understand how they affect the direction of the market, we at ApiDev achieve it and bring it to you. If you want to access this indicator and see how it works, understand how the side panel calculates the strength of the market and if you want to know the advanced alert system it has, please visit the link of our website found in the access buttons direct, or in the AUTHOR INSTRUCTIONS box.
ESPAÑOL:
En ApiDevelopers, desarrollamos soluciones para traders , estos indicadores los construimos en base a estrategias efectivas que aprendemos de algunos trader rentables ó de estrategias históricamente efectivas.
En esta oportunidad les presentamos el indicador Power Oscillator MTF. Este es un indicador multitemporal basado en el Squeeze Momentum Indicator (SQZMON) y las Ondas de Elliot , el cual te permite ver en una sola grafica las ondas principales y secundarias que mueven el mercado, es una realidad que el mercado se mueve por ondas, de hecho es la verdad más grande y antigua que existe en los mercados financieros, pero nadie había podido crear un indicador que permitiera ver las fluctuaciones de esas ondas y entender como estas afectan la dirección del mercado, nosotros en ApiDev lo logramos y lo traemos para ti. Si deseas acceder a este indicador y ver cómo funciona, entender cómo el panel lateral calcula la fuerza del mercado y si deseas conocer el sistema de alertas avanzado que posee, por favor visita el enlace de nuestra página web que se encuentra en los botones de acceso directo, o en la caja de INSTRUCCIONES DEL AUTOR.

PecuniaThe Pecunia indicator
It is a momentum indicator developed by tradewithpecunia. Our indicator is made with more than 4+ robust indicators. The indicator makes use of double top/ double bottom, price action movement, rectangle breakouts & divergence concepts with the crossover of 3+ moving averages.
Different parameters (mathematical calculations for each) have been set by us for each mentioned concept above. The indicator detects different trends in the price using 2 different algorithms. The use of 4 slopes has been done which catches momentum at different positions, according to the parameter set. We call this a knockout system because only when all the parameters are satisfied the buy and sell signal is generated. Even if one parameter fails the signals are not generated, this ensures that there is a momentum check and enough buy and sell signals are produced.
Using 4 parameters for upper bound/lower bounds the catch for median points has been done. 10+ & 10- lengths are looked at from the median points where we have put the stop loss.
Value points
1) The Trade Entry – The indicator continuously looks for suitable data values which when match with the parameters set by us, results in the generation of buy and sell signals. Once the condition is met, the buy and sell signals are displayed on the charts in real-time. Further one can set up an alert that is displayed on the screen and can be modified as an automated alert utilizing the trading view platform’s alert function.
2) The Order Execution – It is recommended to execute the order just before the candle is ended to avoid any hassle or the user can execute the order at the following candle to avoid any false signals set off due to volatility. The choice of instrument to use is the trader’s discretion keeping in mind their own risk/reward involved.
3) Exit Triggers – For an ongoing buy signal, you have to exit or book your profits from the trade at the sell signal. And for an ongoing sell signal, you have to exit or book your profits from the trade at the buy signal. If there is an ongoing buy or sell signal and it’s not moving in our desired trend then you have to take the stop loss at the trade exit signal or its opposite trade signal.
Color Notations:
By default, the color of the buy signal is green and the color of the sell signal is red. The color of the Trade Exit signal is black. Although the user can change the color of the signals at their convenience.
The Features:
1) Easy to understand signal bars
2) Easily distinguishable Buy and Sell signals
3) One must take into consideration that there is no holy grail method
Note:
If you are using this script, you acknowledge that the past performance is not necessarily the indication of future results and there are many more factors that go into being a profitable trader.
Before you proceed:
We are not SEBI Registered Analysts and shall not be culpable for any loss incurred directly or indirectly. Our indicator is no holy grail system. Investment in the stock market is subject to market risk. Trading in stocks, futures, or options is not suitable for every trader and involves a considerable risk of loss.
The market may fluctuate, and the user always has a risk of loss, thus, we won’t be liable for any losses incurred while using our indicator, our trading ideas, or our approach.

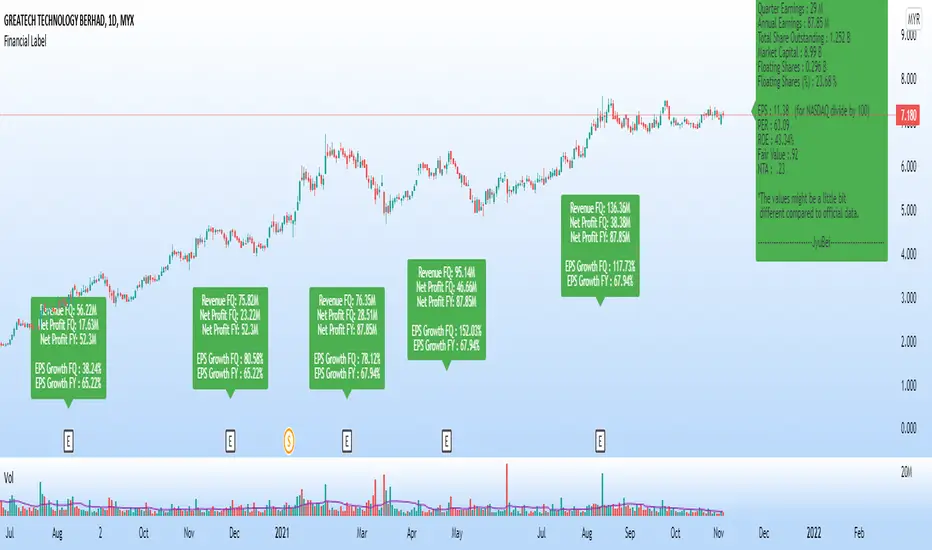
Financial Label
5 Magic Numbers, C, A & S (for CANSLIM) in 1 label.
This label shows:
1. Latest Quarter Earnings (QR)
2. Annual Earnings (AR)
3. Total Share Outstanding
4. Market Capital
5. Floating Shares
6. Earning per Share (EPS)
7. Price per Earning Ratio (P/E Ratio @ PER)
8. Return On Equity (ROE)
9. Fair Value (FV)
10. Non Tangible Asset (NTA)
This label will show the data only on charts that have financial data only.
Warrants, futures, crypto, etc. will not have any display on this label.
Suitable for all markets including US, Asia, Europe and others.
Thus, no currency symbol ($,¥,€, RM, etc.) will be displayed, only numbers.
Green label means EPS is positive - profitable company.
Red label means EPS is negative - loss making company.
Note:
1. The values might be a little bit different from official data, due to type of data taken & calculations, as we have a few formulas for each data.
2. Please confirm more accurate data from your trusted and official source of data.
Vgnomics ScalperVGNOMICS Scalper is a tool to help you find great scalping opportunities. There is great variety of ways to use this indicator to get amazing results. The VGNOMICS Scalper is a new trading indicator that can be used in any market. The technique we combine with this indicator is easy to learn and apply to your trades, but practice makes perfect. This indicator is based on a mathematical calculation that always occurs, no matter which time-frame, market, asset, option, stock or crypto.
How does it work?
The script determines whether we have a bullish or bearish trend based on a combination of price action and moving averages.
When the price crosses this trend, a buy or sell signal is placed (green or red arrow). The indicator will then draw 5 colored dots extended with 5 colored lines. Every line or dot represents a possible entry / exit position. These values are chosen based of a mathematical formula on the previous price movements.
The distance between the red en the black line is calculated from the price action from the current and previous candle.
If there was a big price movement, the distance between the black and the red line will be much greater than when the price action is much smaller.
The distance between the blue and the black line is always the same distance as the distance between the red and the black line.
The yellow line will always represent the high or the low, depending on whether there's a short or a long signal.
These lines tend to be key levels between which the price will bounce.
There are many ways to use and interpret these levels.
How to trade with this indicator?
We have allot of different strategies that can be implemented for this indicator.
But we will explain 3 working strategies that work for us.
Scalp trading is one of the most profitable forms of trading. They can lead to very high profits but are very hard to achieve. In this tutorial we will show you how the VGNOMICS Scalper indicator can assist you with locating great scalp opportunities.
The tutorial below is just one example of how this indicator can be used. Every line represents a key price level at which scalping opportunities can take place.
Strategy 1
Long position:
1) A green arrow at the bottom of the screen indicates a potential long position.
2) Wait for the candle to close. (The signal is only confirmed when the candle closes)
3) Candle closed.
4) Place a limit order for a long position at the yellow line. (Entry)
5) Place a take profit order at the orange line. (Exit)
6) Order is filled. (Long position)
7) Take profit at the orange line. (Exit)
8) Yellow line (entry) gets respected most of the time.
Short position:
1) A red arrow at the bottom of the screen indicates a potential short position.
2) Wait for the candle to close. (The signal is only confirmed when the candle closes)
3) Candle closed.
4) Place a limit order for a short position at the yellow line. (Entry)
5) Place a take profit order at the orange line. (Exit)
6) Order is filled. (Short position)
7) Take profit at the orange line. (Exit)
This strategy does not include a stoploss. It's up to you to implement this indicator in your own strategy. Stoploss orders could be placed at the lines (Key price levels) below / above your entry.
For example:
The stoploss order could have been placed on the black line, or alternatively, we could have placed a second long order on the black line and exit at the yellow line while we place a stoploss order on the blue line. (see strategy 2)
The price tends to swing between these key levels and can be used in various ways.
Strategy 2
Long position (same strategy for short postion but for a red arrow):
1) A green arrow at the bottom of the screen indicates a potential long position.
2) Wait for the candle to close. (The signal is only confirmed when the candle closes)
3) Candle closed.
4) Place a limit order for a long position at the yellow line. (Entry)
5) Place a take profit order at the orange line. (Exit)
6) Order is filled. (Long position)
7) Price did not reach our profit target orange line. (Exit)
8) Place a second limit order with the same size for a long position at the black line. (Entry)
9) Order is filled. (Long position)
10) Place a take profit order at the yellow line. (Exit)
11) Take profit at the yellow line and break even order for the first position. (Exit)
Strategy 3
Long position (same strategy for short postion but for a red arrow):
1) A green arrow at the bottom of the screen indicates a potential long position.
2) Wait for the candle to close. (The signal is only confirmed when the candle closes)
3) Candle closed.
4) Place a limit order for a long position at the black line. (Entry)
5) Order is filled. (Long position)
6) Place take profit orders at the yellow/orange/red line. (Exit)
7) Take profit. (Exit)
You want to use this indicator?
Go to the VGNOMICS website.

B4Signals Brackets PremiumB4Signals Brackets is a geometrical indicator that quantifies the price action in a pivot zone. It uses historical pricing to identify time and price alignments in order to forecast price levels. Price levels identified by B4Signals Brackets are significant support/resistance points. A decisive price break of these points results in very profitable trade opportunities.
B4Signals Brackets indicator is a very powerful price forecasting tool. Trade entry points identified with B4Signals Brackets are highly accurate on their own but they become very powerful when integrated into the rest of the B4 suite of indicators. Each entry is confirmed and validated with the the B4Signals Trading System before opening a position.
B4Signals Brackets features:
Dynamically calculated price bands during the significant times in the market
Price breakouts and forecast of price targets
Significant support and resistance price points
Traders can enable and customize the following:
Select the dynamic update time blocks and update times (changing these settings are not recommended)
Customize the visibility of the background shading of brackets
Setup alerts and get notified:
Trade entries are triggered
Disclaimer
Copyright by B4Signals.
The information contained in our scripts/indicators/ideas does not constitute financial advice or a solicitation to buy or sell any securities of any type. We will not accept liability for any loss or damage, including without limitation any loss of profit, which may arise directly or indirectly from the use of or reliance on such information.
All investments involve risk, and the past performance of a security, industry, sector, market, financial product, trading strategy, or individual’s trading does not guarantee future results or returns. Investors are fully responsible for any investment decisions they make. Such decisions should be based solely on an evaluation of their financial circumstances, investment objectives, risk tolerance, and liquidity needs.

Algo Trading (Nifty & BankNifty)What is Algo Trading ( Nifty & Bank Nifty ) Indicator?
There are many 9 to 5 working professionals who have some spare money to invest each month but they can not do active trading because they are busy with their full time job.
So they wish to have an automated system which could take and close trades for them with a proven back-tested strategy, proper money management, ability to trade within particular timings, pre-defined maximum loss they can bear and so on.
This indicator facilities all such needs of working professionals.
How this indicator generates signals?
This indicator generates signals in 3 ways:
(a) Pricing action validated by Jump in Volume
(b) Moving Average Crossovers
(c) Zeta Force Signals as generated by our proprietary formula for Bank Nifty & Nifty
Once a threshold value is crossed, the Buy/Sell signal (LE & SE) appears on the chart and algo keeps track of the current state. Then this state is remembered for the loss or profit the trade is generating and position is closed either when loss crosses the set limit or when profitable trade starts receding.
What are the various features of this indicator?
(a) You can define your session timing i.e. the time period when you want your trades to be taken. For example: between 1000 hrs to 1330 hrs or so on.
(b) You can choose to close all positions by EOD . ( EOD is defined by the user. For example, if you set the session timing between 9:30 to 11:00 am, then indicator will not take any trades outside
this range).
(c) You can define the total loss you can bear during a particular day. For example, if total loss is 5% for the day, the algo stops taking further trades.
(d) You can set up either manual alerts for each event, for example Buy, Sell, Buy Close, Sell Close where you can customize the message you want to display or you can select the 'Any Alert()
function call' option which will generate pop up messages in TradeTron or Algoji friendly format. These signals can be routed to 3rd party platforms for execution. If you have TradeTron or
Algoji Account, you can enter your API key in algo settings, and after that the messages generated will contain your API Key by default.
What are the limitations of this indicator?
You can not make money with any indicator or algo if market is narrow range bound.
For you to make money, there must be a trend or mini-trend. Sometimes, price starts trending for a while and then reverses back. In such cases, multiple Stop Loss Hits might occur.
Can I use this for Option Trading also?
Deep in the money options behave like Futures only. So yes, you can use this algo for Options Trading by buying Deep in the money options.
Can I use this for trading in stocks or any other instrument?
No. The code has been hard-wired for Bank Nifty & Nifty (Indian Indices) only. A different, generic version of this algo is in the pipeline which can be used for Forex or Commodity and Stocks.

Pivot Expotential Moving AveragesPivot MA's indicator is a combination of the following:
Pivot SMA
Pivot EMA's
Pullback to EMA Band
Pivot EMA's Cross Over
Pivot Double-EMA's Cross Over
Modified Pivot EMA's Cross Over
All the pivot EMA’s calculations are based on "Profiting With Pivot-Based Moving Averages" book by Frank Ochoa.
How to use it :-
One should have to refer this book for in depth usage of this indicator.
You can use the option's provided in the indicator and the signals have been generated according to the concept in this book.
Don't turn on multiple option's, it becomes clumsy to look.
Description:-
1. Pullback to PEMA Band:-
Perhaps the most trader-friendly PEMA setup is the PEMA Pull-Back, because it forces you to trade in the direction of an established trend.
In this, u get the signal when the price retraces to 13 EMA and closes above the PEMA Band.
It is like Buy the Dips & Sell the Rips. The idea of the PEMA Pull-Back is to buy the market at a discount during an uptrend, and sell the market at a premium during a down trend.
2. PEMA Cross Over :-
The PEMA Crossover fires a signal when the fast EMA crosses the slow EMA.
If the fast EMA crosses above the slow EMA, a long signal is fired; whereas, if the fast EMA crosses below the slow EMA, a short signal is fired.
Depending on your trader personality, you will have to choose the periodicities of the two moving averages to suit your taste.
Some combination of EMA's are provided.
3. Double EMA Cross Over :-
A double exponential moving average (DEMA) is basically the EMA of an EMA, meaning the output is the second derivative of the original exponential moving average.
While an EMA is a faster moving average than the SMA, the DEMA is on another level in terms of speed.
4. Modified PEMA Cross Over :-
This system is an ultra-fast PEMA crossover signal that has built-in trend confirmation.
The Modified PEMA Crossover system fires signals in the direction of the prevailing trend, as measured by a larger moving average.
For Example, Take (1,3),21 combination. In this we use 1- and 3-period pivot EMA’s for crossovers, and use a 21-period pivot EMA for trend confirmation.
1 and 3 period EMA's are not shown in the chart, Only 21 EMA and signals are shown for clear view.
Therefore, this system will only allow bullish crossover signals to fire when price is above the 21-period pivot EMA, and will only allow bearish crossover signals to fire when price is below the 21-period average.
In essence, the results are usually highly qualified “buy the dip, and sell rip” type of opportunities.
Disclaimer :-
The PEMA setups that are covered in this indicator offer some of the ways to approach the market using moving averages.
Not all setups and styles of trading will fit all traders, no matter how profitable the approach.
You must use what fits your trader profile and your trading approach.
Thank You ..

Smart Oscillator PremiumThe Smart Oscillator Premium indicator is a clever oscillator that helps you estimate the direction of trends. It is adaptive to a variety of markets and timeframes and provides rich and colorful visuals using a vibrant color scheme. Aiming to keep things simple, the oscillator only needs one parameter, the length of your base moving average, which defaults to 32.
Overview
As seen in the image above we provide key metrics to assist in choosing smart entry and exit points.
Key Features:
Get a better idea of the trend direction.
Spot divergences in price movements from your chosen moving average.
Using our Smart Candle technology better estimate tops and bottoms.
Using our Whale Sonar technology spot opportunities to enter and exit.
Smart Bollinger Bands using custom Fibonacci levels.
While we believe our default theme is attractive, we expose all style settings to the user to meet their preferences.
Alerts for divergences, with more coming soon.
Road Map:
While we believe this indicator should currently be used in a discretionary manner, we are currently working towards providing you with automated entry/exit signals. We also believe user feedback is a big part of the development process. You can leave us any suggestions or features you may want implemented via our Discord server.
Disclaimer:
By using this script you acknowledge past performance is not necessarily indicative of future results and there are many more factors that go into being a profitable trader.
Access:
See the authors instructions below to get access to our Premium Indicator suite.

RobocanThis script is equipped with
🔵 Robo 2
It offers strategic trading entry and exit points. Truly unique tool for technical analysis for the financial market as it includes calculation of specific metrics like MACD, ATR and RSI.
🔵 Bull & Bear
The signal can be a fairly valuable tool. Momentum is one of those aspects of the market that is crucial to understanding price movements, yet it is so hard to get a solid grip on. It can be used in some instances to generate quality signals but much like with any signal generating indicator, it should be used with caution.
When indicator gives you " Bull " signal , short term momentum is now rising faster than the long term momentum. This can present a bullish buying opportunity.
When indicator gives you "Bear " signal, short term momentum is now falling faster then the long term momentum. This can present a bearish selling opportunity.
🔵 Robo's Cloud
The indicator inspired from Ichimoku CLoud, it uses an unique formula to generate clouds on its own system!
" BUY or ENTER "when the price breaks the Cloud in the direction of the breakout (UP ) and the cloud turns to green colour. Stay in the market until the cloud turns to red colour. Let's assume that You are a swing trader and use 1D candles as long as The candle is above the "green " cloud , you should continue with a trend! No need to hurry to sell until you see the " red " cloud.
🔵 Super Robo
It can perform greatly in a bull and bear market
It's unique algorithm find profitable coins based on "Early Bird + Buy 2 + Volume "gives you ENTRY and EXIT ideas
It works perfectly on the 1W - 3D - 1D charts
🔵 Hell & Moon
When the “Moon or Hell “closes below top of the closing price, a Moon - Buy signal is generated
It works perfectly on the 1W - 1D - 3H charts
🔵 Early Bird Signals
Being an early bird rather than a night owl will naturally lead you to become more successful in trading. There is no secret magic formula to success; this is something you must accept. Trading success is the result of a ‘simple’ list made up of four things: hard work, timing, persistence , and a good dose of Early Bird signals.
it provides high risk & high reward opportunities.
Dont use more than 3 Robo signals at the same time on the chart. Why?
Example, Robo 2 already included 3 different indicators in the formula.
Robo 2 : Truly unique tool for technical analysis for the financial market as it includes calculation of specific metrics like SAR + MACD + Price Movement that gives you ENTRY and EXIT ideas ( Buy 2 & Sell 2 )
If you use more than 3 robo signals, you try to use around " 10 - 12 " different indicators at the same time!
DON'T DO IT!
To get maximum results from your robo advisors, follow the advice below ;
A ) 3 robo signals
B ) 3 robo signals + 1 side strategy
A or B + Pick one bonus below
Dynamic Support Resistance,
Fibonacci Levels
Pivot Support Resistance
Robo signals :
Robo 1
Robo 2
Super EngineeringRobo
Robo 3
Robo 4
Bull & Bear
Hell & Moon
Early Bird
EngineeringRobo's cloud
Ultimate MA crossover strategy
Side strategies :
McGinley Dynamic
Bollinger Bands Strategy
MA 20 & MA 50
MA 50 & MA 200
EMA Trendlines
Robo ( 2 + 3 ) shows you that if the signals are covering each other. So, It is good to keep open it when you use Robo 2 and Robo 3 at the same time.
If you are following any signals, you should always wait for the candle close before buying or selling.
The signal can come and go anytime during the live candle. ALL indicators do that, that is not considered repainting.
Repainting is when a signal appears, the candle is closed, and when you refresh the chart it disappeared. It is logical that until the candle is closed the signal is not decided yet, hence the alert setup as Once per bar Close.
Deluxe never repaints! Yes, you heard it right: you will never have to worry about signal changing after the candle is closed.
________________________________________________________________________Timeframes_____________________________________________________________________
Our recommendations to get the best results:
Swing Trading Crypto : Use 1D Time Frame Candles
Swing Trading Stocks : Use 1W Time Frame Candles
Swing Trading Commodities : Use 1W Time Frame Candles
Day Trading Crypto : Use 3H Time Frame Candles
Day Trading Stocks : Use 1D Time Frame Candles
Day Trading Commodities : Use 1D Time Frame Candles
Not recommended any other time frames.
It gives you all the tools and information you need for day-to-day trading and investing, while also keeping a great buy and sell signals! No excuse to lose in any financial market anymore! Try now!
How can you add the algorithm into your chart?
1. Login to TradingView.com
2. From the homepage, click on ‘Chart’ in the top navigation bar
3. Select “Indicators” on the top-center-middle panel
4. In the indicator library, type "Robocan "
5. Use the website link below to obtain access to this indicator

Trend lines + Pivot Levels + Candlestick PatternsThis is a pure PRICE ACTION indicator that will show you possible trend lines, pivot lines and candlestick patterns at once.
it has been designed to determine upper and lower trend lines in the chart and you can set candlestick patterns on them with alerts!
it means that you add the indicator to the chart and set the alert and done!
whenever a pinbar or engulf or breakout(in both directions) happens, you will be notified by alerts.
you also have pivot lines on the chart by this indicator. you can set the candlesticks on pivots instead of trend lines, so if you are a fan of support and resistance you can have this one, it depends on you.
all of the pivots and trend lines and also the candle sticks are customizable, so you can exactly select the pinbar, engulfing or breakout candle that matches with your mindset. for example you can set a pinbar that long shadow is 4 times or 3 times greater than the body, it's on you.
you can also customize trendlines or pivot lines, if you are scalper you can set it to small trend lines and if you are day trader or long term trader you can set it to the number that fits with your strategy.
trends and pivots will be updated automatically and there is no need to set it every time.
Be PROFITABLE!
$kMagician /*

Gap RiderThis Indicator allows you to make statistics on the performance of any underlying on the days in which an opening gap occurs.
Specifically, the indicator was designed for "0 dte" options trades. In fact, it is possible to find parameters that give a good statistical advantage by opening a spread in the direction of the gap, creating a trade that has a risk-return ratio of 1: 1.
The indicator shows flags on the graph (green in case of gap up, red in case of gap down) and colored boxes (green in case the stock closed in the direction of the gap, red in case the stock closed in the opposite direction to the gap, yellow in the event that the stock closed at a distance that did not allow the spread in options to close in maximum loss or maximum profit, and therefore in breakeven)
The statistics panel, on the other hand, contains all the information necessary to search for parameters that give the trader a good statistical advantage.
In the settings you can filter the days of the week, only gap up or only gap down, ATR thresholds (volatility), points or minimum percentage for which a gap is taken into account, measure of the breakeven (which for options traders should represent the half the width of the spread to open), large gaps filter that takes into consideration only gaps that open out of range compared to the previous session. The Lookback parameter of course is used to set how many bars to take into account for the statistics.
Parameters and recommended strategy:
TODAY 31/08/2021 - Lookback 500 bars (2 years)
UNDERLYING: SPX
FILTERS: only Monday and Wednesday, only gap up, only gap> 0.01%
STRATEGY: exactly at opening, cover an ATM spread in the direction of the gap (example: gap up, I open a long call spread) that has the opening price as a break even, with a risk-return ratio of 1: 1 and leave it open until closing session, or set take profit at 90-95%. It is advisable to take into consideration the SPX statistics but to operate on the ES future so as to be able to open the spread a couple of minutes before the opening of the cash session and prevent the trade from "running away" due to too sudden movements of the opening. .
RESULTS:
124 Trade
70% profitable trades
30% losing trades
Max drawdown 3 trades
So assuming a spread on ES 10 points wide, each trade would gain or lose $ 250, applying the described strategy we would have in two years, investing only $ 250, a profit of $ 12500, with a max drawdown of $ 750. We would therefore have a profit of 5000%, or rather 2500% per year on the invested capital, with a drawdown of a much lower proportion of the profit ($ 750 compared to $ 6250 of annual profit).
The strategy is infinitely scalable by increasing the options contracts used and the impact of the commissions is almost zero.
MONEY MANAGEMENT: Example on a 50K account, with a spread that earns or loses $ 500, in two years it earns $ 25,000, therefore about 12500 per year, with a max drawdown of $ 1500, therefore 25% per year on the ENTIRE ACCOUNT with a maximum drawdown of 3%.
Note: the test was performed without a break even parameter, so the actual result will be more moderate, but of the same explosive nature.
** BUG STILL LOOKING FOR SOLUTION **
only in case the filters are set to take into account ONLY the gap down, the drawdown count in the statistics panel shows an incorrect result "

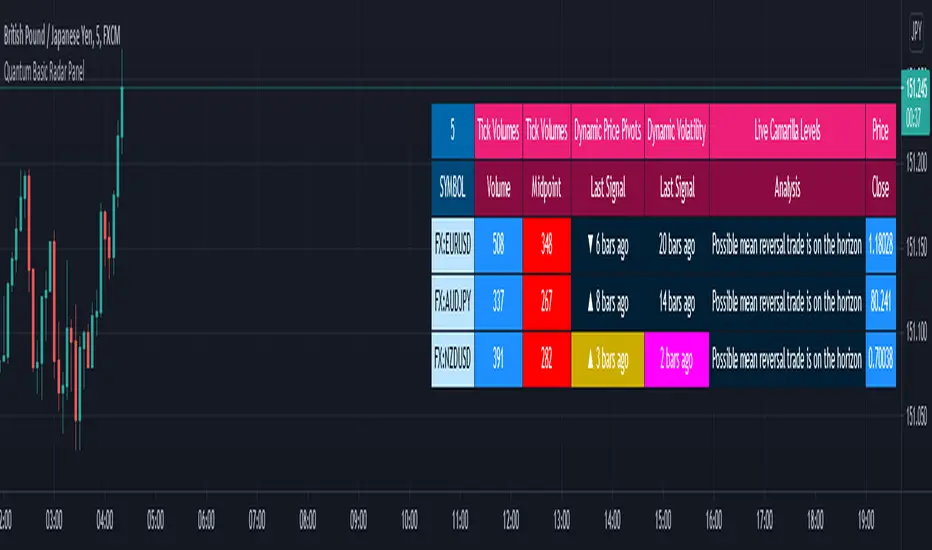
Quantum Basic Radar PanelOverview
One of the biggest issues trading any market is in keeping track of trading opportunities as they arise across all the various timeframes without having multiple monitors or charts open and this is where the Radar Panel steps in. Using TradingView’s Table function, we have incorporated a host of our leading indicators on the panel which can be applied to any timeframe and from which you can instantly spot opportunities as they arise whether in terms of trend, reversals, volatility, or volume. In addition, when using a scanner such as this, it also highlights broad sentiment if, for example, you have added currency pairs from the same matrix or a group of stocks from the same sector. And you can of course have multiples open across the various timeframes.
The Quantum Radar Panel is a powerful indicator that keeps track of indicator signals of up to 10 different symbols in real time. For each symbol, it can display the current signals of 4 Quantum Trading indicators namely:
Quantum Tick Volumes
Quantum Dynamic Price Pivots
Quantum Dynamic Volatility
Quantum Live Camarilla Levels
It can also display the current Open, High, Low, and Close prices of each symbol. Each indicator has 1 or more columns allotted to them to display information about their respective signals. Below we will discuss what each indicator does and how it displays its signals in the Radar Panel.
Tick Volumes
Volume is a powerful leading indicator, yet few traders ever take advantage of its awesome power. Why? Because identifying volume trends using the standard indicator can be confusing, and judging volume height even more so!
The Quantum Tick Volumes indicator takes a simple tool and makes it come to life! First, it paints the volume bar to match the candle. This makes it quick and easy to identify buying and selling volume with the associated price action.
Second, the Quantum Tick Volume indicator displays a dynamic mid-point, instantly telling you whether volumes are high, average or low in the session. No more guesswork! Volume analysis made simple – making it easy to spot profitable trading opportunities – fast!
In the Radar Panel, the Tick Volumes indicator displays 2 columns -Volume and Midpoint.
Columns
Volume – this column displays the current volume of the symbol and changes colors according to the sentiment of the current candle.
Midpoint – this column displays half of the highest volume bar within the current day and it is visible in intraday timeframes only
Dynamic Price Pivots
The Quantum Dynamic Price Pivots indicator could best be described as the Swiss army knife of trading. Power, simplicity and functionality all in one tool. Many traders struggle to identify reversal points based on price action alone. Why? Because you need to have a complete understanding of candlesticks, candles and candle patterns.
The dynamic pivot appears once a three-candle price pattern is created. This is one of the first signs of a possible change in sentiment, based on the price action alone. A pivot high in an uptrend, and pivot low in a down trend. So, whether you are trading long or short, the Quantum Dynamic Price Pivots indicator will instantly give you a visual signal to – pay attention! Powerful, yet so simple, and two indicators in one!
In the Radar Panel, the Dynamic Price Pivots indicator displays the last signal (isolated high or isolated low) and the number of bars since it was last seen.
Column
Last Signal – this column displays the last pivot arrow that appeared in the chart in the form of an upward (isolated low) or downward (isolated high) arrow and the number of bars since it was detected. The cell turns yellow when the arrow is seen in the last 3 bars or less.
Dynamic Volatility
Volatility can be both good and bad. Great for making money fast. Not so good when you’re on the losing side! But how do you know when a market is volatile. Is the price action you are seeing normal for that currency pair? And more importantly, what is normal?
The Quantum Dynamic Volatility indicator is designed with one objective in mind. To show you, dynamically volatile price action. You then decide, based on the price action, whether to wait, or take advantage. One of the hardest things to learn in trading, is when to stay out. The Quantum Dynamic Volatility indicator makes this child’s play – keep you safe. It could almost be called your safety belt!
In the Radar Panel, the Dynamic Volatility indicator displays the number of bars since a volatile candle was last seen.
Column
Last Signal – this column displays the number of bars since a volatile candle was detected. The cell turns magenta when the signal is seen in the last 3 bars or less.
Live Camarilla Levels
What is the Camarilla protocol, how does it work and what will it do for me?
Put simply it is a chameleon of an indicator and will appeal whether you are a more discretionary type of trader, making and taking decisions yourself, or if you prefer a more systematic or mechanical approach often associated with an EA for example. With the Camarilla levels indicator both approaches can be embraced and accommodated.
The Camarilla protocol has its roots in the open outcry trading pits, where traders considered floor pivots an essential tool. Based on these original ideas and incorporating the Camarilla equation we have developed a unique indicator which delivers clear and precise price-based support and resistance levels, which act as targets for profits, triggers for potential reversals, signals for possible breakouts, and finally stop loss placement. So, if you’re a swing or reversal trader, it’s the perfect indicator. Equally if you prefer breakout trading, again it’s the perfect indicator. And all with predetermined and clear levels for any price objectives and profit targets, with stop loss placement covered also.
In other words, a complete indicator, and one which is delivered with potential trading setups built in to help you see when key levels are being approached or breached. And to help you further when using the indicator, we have also included some simple messages to guide you as the various levels are approached and tested.
In the Radar Panel, the Live Camarilla Levels indicator displays the 12 Camarilla levels in descending order, R6 to R1 and S1 to S6, as well as the Analysis based on where the current price is situated among the 12 levels.
Columns
Analysis – this column displays messages that can guide you as the various levels are approached and tested.
R6 – R1, S1 – S6 (12 columns) – these columns display the 12 Camarilla levels calculated for the current timeframe and each one changes colors depending on the current price
OHLC Prices
Apart from the 4 Quantum indicators, the Radar Panel also displays the current OHLC prices of each symbol.
Open
High
Low
Close
Their color changes depending on the current price action.
With the portability of the TradingView platform, having the Radar Panel in your set of tools truly puts all the power of 4 Quantum indicators right at your fingertips. Get yours now.
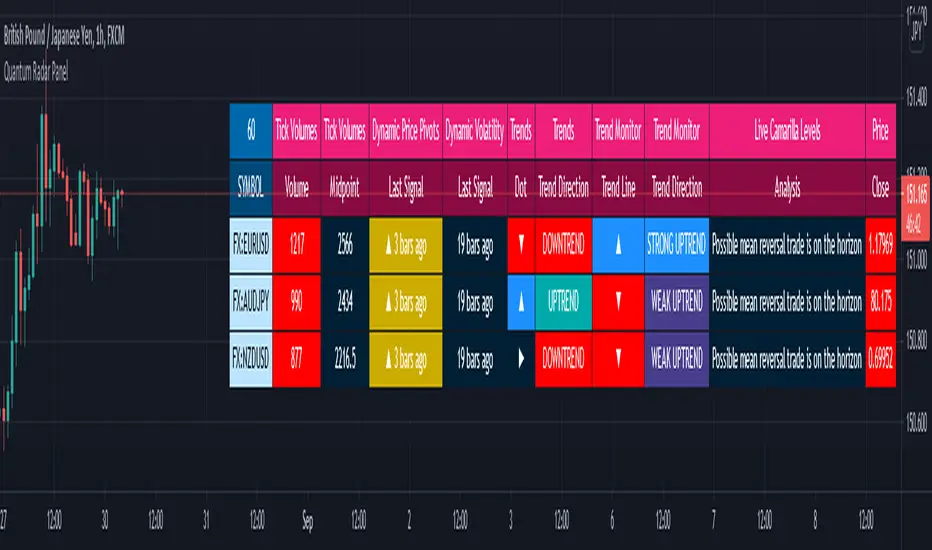
Quantum Radar PanelOverview
One of the biggest issues trading any market is in keeping track of trading opportunities as they arise across all the various timeframes without having multiple monitors or charts open and this is where the Radar Panel steps in. Using TradingView’s Table function, we have incorporated a host of our leading indicators on the panel which can be applied to any timeframe and from which you can instantly spot opportunities as they arise whether in terms of trend, reversals, volatility, or volume. In addition, when using a scanner such as this, it also highlights broad sentiment if, for example, you have added currency pairs from the same matrix or a group of stocks from the same sector. And you can of course have multiples open across the various timeframes.
The Quantum Radar Panel is a powerful indicator that keeps track of indicator signals of up to 10 different symbols in real time. For each symbol, it can display the current signals of 6 Quantum Trading indicators namely:
Quantum Tick Volumes
Quantum Dynamic Price Pivots
Quantum Dynamic Volatility
Quantum Trends
Quantum Trend Monitor
Quantum Live Camarilla Levels
It can also display the current Open, High, Low, and Close prices of each symbol. Each indicator has 1 or more columns allotted to them to display information about their respective signals. Below we will discuss what each indicator does and how it displays its signals in the Radar Panel.
Tick Volumes
Volume is a powerful leading indicator, yet few traders ever take advantage of its awesome power. Why? Because identifying volume trends using the standard indicator can be confusing, and judging volume height even more so!
The Quantum Tick Volumes indicator takes a simple tool and makes it come to life! First, it paints the volume bar to match the candle. This makes it quick and easy to identify buying and selling volume with the associated price action.
Second, the Quantum Tick Volume indicator displays a dynamic mid-point, instantly telling you whether volumes are high, average or low in the session. No more guesswork! Volume analysis made simple – making it easy to spot profitable trading opportunities – fast!
In the Radar Panel, the Tick Volumes indicator displays 2 columns -Volume and Midpoint.
Columns
Volume– this column displays the current volume of the symbol and changes colors according to the sentiment of the current candle.
Midpoint – this column displays half of the highest volume bar within the current day and it is visible in intraday timeframes only
Dynamic Price Pivots
The Quantum Dynamic Price Pivots indicator could best be described as the Swiss army knife of trading. Power, simplicity and functionality all in one tool. Many traders struggle to identify reversal points based on price action alone. Why? Because you need to have a complete understanding of candlesticks, candles and candle patterns.
The dynamic pivot appears once a three-candle price pattern is created. This is one of the first signs of a possible change in sentiment, based on the price action alone. A pivot high in an uptrend, and pivot low in a down trend. So, whether you are trading long or short, the Quantum Dynamic Price Pivots indicator will instantly give you a visual signal to – pay attention! Powerful, yet so simple, and two indicators in one!
In the Radar Panel, the Dynamic Price Pivots indicator displays the last signal (isolated high or isolated low) and the number of bars since it was last seen.
Column
Last Signal – this column displays the last pivot arrow that appeared in the chart in the form of an upward (isolated low) or downward (isolated high) arrow and the number of bars since it was detected. The cell turns yellow when the arrow is seen in the last 3 bars or less.
Dynamic Volatility
Volatility can be both good and bad. Great for making money fast. Not so good when you’re on the losing side! But how do you know when a market is volatile. Is the price action you are seeing normal for that currency pair? And more importantly, what is normal?
The Quantum Dynamic Volatility indicator is designed with one objective in mind. To show you, dynamically volatile price action. You then decide, based on the price action, whether to wait, or take advantage. One of the hardest things to learn in trading, is when to stay out. The Quantum Dynamic Volatility indicator makes this child’s play – keep you safe. It could almost be called your safety belt!
In the Radar Panel, the Dynamic Volatility indicator displays the number of bars since a volatile candle was last seen.
Column
Last Signal – this column displays the number of bars since a volatile candle was detected. The cell turns magenta when the signal is seen in the last 3 bars or less.
Trends
All traders know that price is a leading indicator. Yet few traders ever discover how to correctly interpret the start of a new trend, or indeed the end of an old one. To add further complexity, markets spend over 70% of their time in congestion, moving sideways in a narrow range. The traders worst enemy.
What’s the answer? Step forward – the Quantum Trends indicator. With this simple and elegant indicator, dynamic trends are painted for you instantly and dynamically, in real time. In trading any market, you need to be quick on your feet, and the Quantum Trends indicator delivers in spades! But even better, not only will it signal your possible entry and exit, but it also signals a market in congestion – equally important. Knowing when to stay out, is just as important as knowing when to get in.
In the Radar Panel, the Trends indicator displays where the last trend dot is heading and the sentiment of the dot or the trend direction.
Columns
Dot – this column displays whether the current trend dot is going upwards, downwards, or sideways
Trend Direction – this column displays the sentiment of the current trend dot and its color
Trend Monitor
One of the hardest things to do in trading, is to stay in, and take the maximum profit from any position. You know how it goes. You get in and all is going well. Then the market reverses. You get frightened, and close out. What happens next?
Yes, you guessed it – the market reverses again and starts to move fast. Now it’s too late. You have missed out on some great profits, and are left wishing you had stayed in.
That’s why we developed the Quantum Trend Monitor. It does just that. It monitors the strength of the trend. It will help you stay in, when your emotion is telling you to get out. The Trend Monitor will give you the confidence, not just to stay in, but to take the maximum profit from each and every trade.
In the Radar Panel, the Trend Monitor indicator displays where the trend line (one of Trend Monitor’s 2 modes) is heading at and the current sentiment or trend direction.
Columns
Trend Line – in the indicator proper, the trend line shows the progression or steepness of the trend’s momentum, and this information is simplified as the direction of the line, whether it is going upwards, downwards, or sideways.
Trend Direction – this column displays the current sentiment and its color
Live Camarilla Levels
What is the Camarilla protocol, how does it work and what will it do for me?
Put simply it is a chameleon of an indicator and will appeal whether you are a more discretionary type of trader, making and taking decisions yourself, or if you prefer a more systematic or mechanical approach often associated with an EA for example. With the Camarilla levels indicator both approaches can be embraced and accommodated.
The Camarilla protocol has its roots in the open outcry trading pits, where traders considered floor pivots an essential tool. Based on these original ideas and incorporating the Camarilla equation we have developed a unique indicator which delivers clear and precise price-based support and resistance levels, which act as targets for profits, triggers for potential reversals, signals for possible breakouts, and finally stop loss placement. So, if you’re a swing or reversal trader, it’s the perfect indicator. Equally if you prefer breakout trading, again it’s the perfect indicator. And all with predetermined and clear levels for any price objectives and profit targets, with stop loss placement covered also.
In other words, a complete indicator, and one which is delivered with potential trading setups built in to help you see when key levels are being approached or breached. And to help you further when using the indicator, we have also included some simple messages to guide you as the various levels are approached and tested.
In the Radar Panel, the Live Camarilla Levels indicator displays the 12 Camarilla levels in descending order, R6 to R1 and S1 to S6, as well as the Analysis based on where the current price is situated among the 12 levels.
Columns
Analysis – this column displays messages that can guide you as the various levels are approached and tested.
R6 – R1, S1 – S6 (12 columns) – these columns display the 12 Camarilla levels calculated for the current timeframe and each one changes colors depending on the current price
OHLC Prices
Apart from the 6 Quantum indicators, the Radar Panel also displays the current OHLC prices of each symbol.
Open
High
Low
Close
Their color changes depending on the current price action.
With the portability of the TradingView platform, having the Radar Panel in your set of tools truly puts all the power of 6 Quantum indicators right at your fingertips. Get yours now.
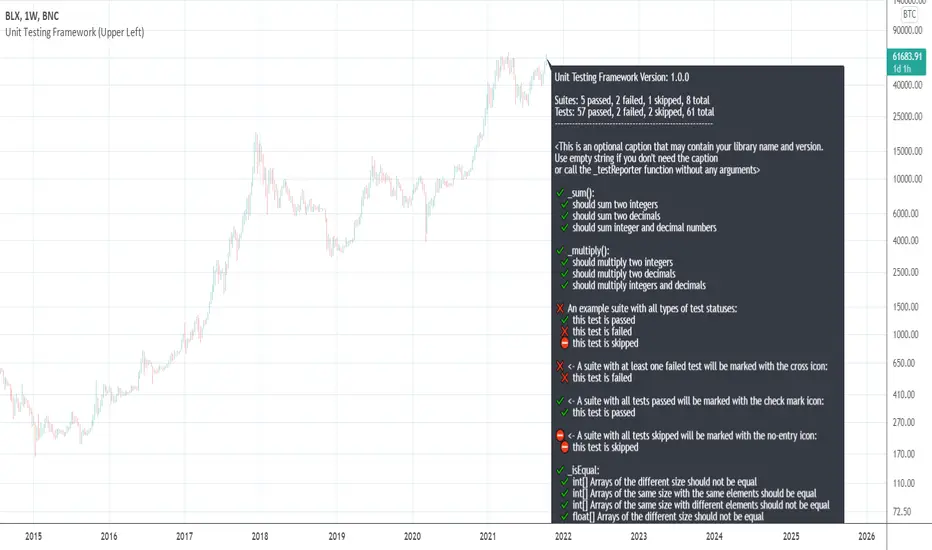
[UTILS] Unit Testing FrameworkTL;DR
This script doesn't provide any buy/sell signals.
This script won't make you profitable implicitly.
This script is intended for utility function testing, library testing, custom assertions.
It is free and open-source.
Introduction
About the idea: is not exclusive, programmers tend to use this method a lot and for a long time.
The point is to ensure that parts of a software, "units" (i.e modules, functions, procedures, class methods etc), work as they should, meet they design and behave as intended. That's why we use the term "Unit testing".
In PineScript we don't have a lot of entities mentioned above yet. What we have are functions. For example, a function that sums numbers should return a number, a particular sum. Or a professor wrote a function that calculates something or whatever. He and you want to be sure that the function works as expected and further code changes (refactoring) won't break its behaviour. What the professor needs to do is to write unit tests for his function/library of functions. And what you need to do is to check if the professor wrote tests or not.
No tests = No code
- Total test-driven development
Ok, it is not so serious, but very important in software development. And I created a tool for that.
I tried to follow the APIs of testing tools/libs/frameworks I worked or work with: Jasmine (Javascript), Mocha/Chai (Javascript), Jest (Javascript), RSpec (Ruby), unittest (Python), pytest (Python) and others. Got something workable but it would be much easier to implement (and it would look much better) if PineScript had a higher-order functions feature.
API
_describe(suiteName: string)
A function to declare a test suite. Each suite with tests may have 2 statuses:
✔️ Passed
❌ Failed
A suite is considered to be failed if at least one of the specs in it has failed.
_it(specName: string, actual: any, expected: any)
A function to run a test. Each test may have 3 statuses:
✔️ Passed
❌ Failed
⛔ Skipped
Some examples:
_it("is a falsey value", 1 != 2, true)
_it("is not a number", na(something), true)
_it("should sum two integers", _sum(1, 2), 1)
_it("arrays are equal", _isEqual(array.from(1, 2), array.from(1, 2)), true)
Remember that both the 'actual' and 'expected' arguments must be of the same type.
And a group of _it() functions must be preceded by a _describe() declaration (see in the code).
_test(specName: string, actual: any, expected: any)
An alias for _it . Does the same thing.
_xit(specName: string, actual: any, expected: any)
A function to skip a particular test for a while. Doesn't make any comparisons, but the test will appear in the results as skipped.
This feature is unstable and may be removed in the future releases.
_xtest(specName: string, actual: any, expected: any)
An alias for _xit . Does the same thing.
_isEqual(id_1: array, id_2: array)
A function to compare two arrays for equality. Both arrays must be of the same type.
This function doesn't take into account the order of elements in each array. So arrays like (1, 2, 3) and (3, 2, 1) will be equal.
_isStrictEqual(id_1: array, id_2: array)
A function to compare two arrays for equality. Both arrays must be of the same type.
This function is a stricter version of _isEqual because it takes into account the order of elements in each array. So arrays like (1, 2, 3) and (3, 2, 1) won't be equal.
Usage
To use this script to test your library you need to do the following steps:
1) Copy all the code you see between line #5 and #282 (Unit Testing Framework Core)
2) Place the copied code at the very beginning of your script (but below study())
3) Start to write suites and tests where your code ends. That's it.
NOTE
The current version is 0.0.1 which means that a lot of things may be changed on the way to 1.0.0 - the first stable version.