Search in scripts for "pullback"

Pullback Trading [Fhenry0331]The indicator is taken from Alexander Elders "Triple Screen System," minus using the Weekly MACD as a filter/trend. I believe waiting for the force index and the weekly MACD histogram to line-up is uber conservative and a trader will miss too many signals (In my opinion).
The indicator is for a pullback trader. A trader that waits for a trend to develop then enters on a pullback.
The indicator defines an uptrend start: as the 13 ema crossing above the 26 ema. It defines a downtrend start: as the 13 ema crossing below the 26 ema.
The pullback in an uptrend: 13 ema is above the 26 ema. Elders-Force-Index is below the zero line. Price low has crossed below the 13 ema (one can also say price closes below the 13 ema if they so wish).
The pullback in a downtrend: 13 ema is below the 26 ema. Elders-Force-Index is above the zero line. Price high has also crossed above the 13 ema.
Please note that the pullback signals do not necessitate an automatic buy or sell (the instrument can be still pulling back deeper and not ready to resume it's trend.) One should place orders above (long) or below (short) bars with the pullback signals. Do so on signals until orders are filled.
Although the indicator is meant for pullbacks one can make an aggressive entry at the onset of a crossover of ema's.
For clarity background colors has been added to the indicator.
works well on daily time frame. Also look at intraday (5) minute time frame on trending stocks (news, earnings, volume, etc.)
Keep It Simple.
Enjoy!

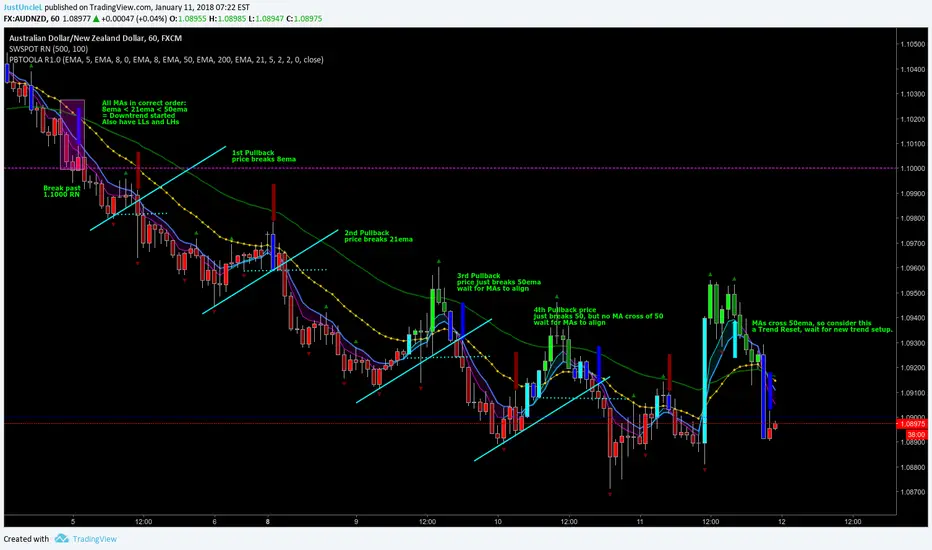
Pullback Trading Tool ALT R1.0 by JustUncleLThis study is an alternative Pullback Tool to my previous versions "Pullback Trading Tool R#.# by JustUncleL". This version aims to provide a cleaner but powerful trading tool. It incorporates the majority of the indicators needed to analyse trade Trends for Pullbacks and Reversals. You can optionally use Heikin Ashi candle or Renko charts. The notes here are mainly in reference to using standard Candlestick 60min signal chart (or Anchor chart time frame), other higher time frames can be used instead as Anchor Time Frames such as 240min(4hr) or 1440min(Daily).
NOTE: A Pullback is synomous to Retracement, generally a Pullback refers to a large Retracement of 100pips or more. In the context of this Tool and any comments related to it, a Pullback will be the same as a Retracement.
Incorporated within this tool are the following indicators:
1. Three Moving Averages (EMA by default) that can optionally be Anchored to a Higher Time Frame:
DodgerBlue = EMA08 (default)
Green = EMA50 (default)
Gray = EMA200 (default), disabled by default.
2. One Anchored Signal Moving Average line Yellow EMA21 (default).
3. Two Un-Anchored Moving Averages as Ribbon, can be disabled.
Aqua = EMA03 (default)
Fuchsia = EMA08 (default)
4. Display Pivots and optional Pivot Levels. By default Pivot is set to : 2 candles RHS of Pivot and 2 candles LHS of Pivot; this is the setting required to show standard Fractal points.
5. Optional HH, LH, LL, HL finder to help with drawing Trend lines and mini Trend Lines.
6. Coloured coded Bar based on the signal MA:
the Standard candle colours:
Blue = candle open and closed above signal MA.
Red = candle open and closed below signal MA.
Yellow = Candle stradle across signal MA.
the Grab candles scheme:
Lime = Bull candle open and closed above signal MA.
Green = Bear candle open and closed above signal MA.
Red = Bull candle open and closed below signal MA.
DarkRed = Bear candle open and closed below signal MA.
Aqua = Bull candle closed across signal MA.
Blue = Bear candle stradle across signal MA.
7. Alert entry arrows generated within a Trend or at the start of a new trend.
An Uptrend is defined as anchored fast (8ema) above anchored signal (21ema) above anchored medium (50ema).
A Downtrend is defined as anchored fast (8ema) below anchored signal (21ema) below anchored medium (50ema).
A Pullback generates an red (short entry) or green (long entry) arrow when price crosses anchored fast or signal MAs and then crosses back to return to trend direction.
A Trend Break, which is defined as any of the MAs crossing breaking trend, generates a blue (short) or aqua (long) arrow and then make new trend (in same or new trend direction).
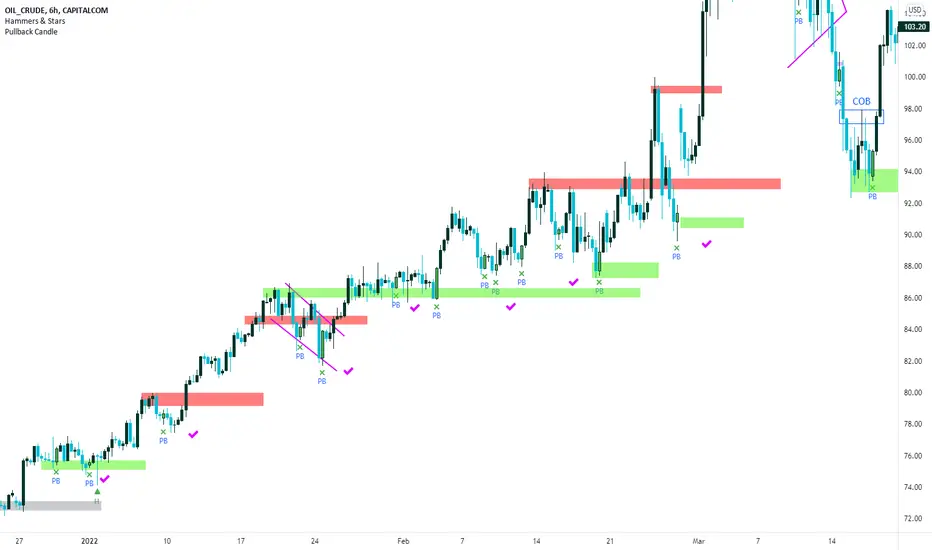
Pullback Trading Tool R5-65 by JustUncleLBy request this is an updated version of the "PullBack Trading Tool": removes experimental "OCC" channel, added option to display ribbons or just single moving average lines, added alert arrows for "PB" exits, added alertcondition for TV alarm subsystem, added some extract options for Pivot points and general cleanup of code.
Description:
This project incorporates the majority of the indicators needed to analyse and trade Trends for Pullbacks, swings and reversals.
Incorporated within this tool are the following indicators:
1. Major industry (Banks) recognised important EMAs in an EMA Ribbon:
Lime = EMA5 (Optional Display)
DodgerBlue = EMA12 (Optional Display)
Red = EMA36 (Optional display)
Green = EMA89
Blue = EMA200
Black = EMA633
2. The 5 EMA (default) High/Low/Close Price Action Channel (PAC), the PAC channel display is disabled by default.
3. Optionally display Fractals and optional Fractal levels
4. Optional HH, LH, LL, HL finder.
5. Optional Buy/Sell "PB" exit Alerts with Optional 200EMA filter.
6. Coloured coded Bar high lighting based on the PAC:
blue = bar closed above PAC
red = bar closed below PAC
gray = bar closed inside PAC
7. Alert condition sent to TradingView's Alarm subsystem for PB exits.
8. Pivot points with optional labels.
9. EMA5-12 Ribbon is displayed by default.
10.EMA12-36 Ribbon is displayed by default
Set up and hints:
I am unable to provide a full description here, as Pullback Trading incorporates a full trading Methodology, there are a number of articles and books written on the subject.
Set the chart to Heikin Ashi Candles (optional).
I also add a "Sweetspot Gold R3" indicator to the chart as well to help with support and resistance finding and shows where the important "00" lines are.
First on a weekly basis say Sunday night or Monday morning, analyse the Daily and Weekly charts to establish overall trends, and support/resistant levels. Draw significant mini trend lines (2/3 TL), vertical trend lines (VTL) and S/R levels. Can use the Pivots points to guide VTL drawing and Fractals to help guide 2/3 TL drawing.
Once the trend direction and any potential major reversals highlighted, drop down to lower timeframe chart and draw appropriate mini Trend line (2/3 TL) matching the established momentum direction. Take note of potential pull backs from and of the EMAs, in particular the EMA5-12 ribbon, EMA12-36 Ribbon and the 200EMA. Can use the Pivots and/or Fractals points to guide your 2/3 TL drawing.
Set a TradingView alarm on the "PBTOOL alert", with the default settings this normally occurs before or during the Break of the manually drawn TL lines.
Once alerted check to see if the TL is broken and is returning to trend away from the EMA lines, this is indicated by bar colour change to trend directional colour.
You can trade that alert or drop down to even lower time frames and perform the same TL analysis there to find trades at the lower TF. Trading at lower TF you will allow tighter Stop loss settings.
Other than the "SweetSpot Gold R3" indicator, you should not need any other indicator to successfully trade trends for Pullbacks and reversals. If you really want another indicator I suggest a momentum one for example: AO ( Awesome Oscillator ), MACD or Squeeze Momentum.

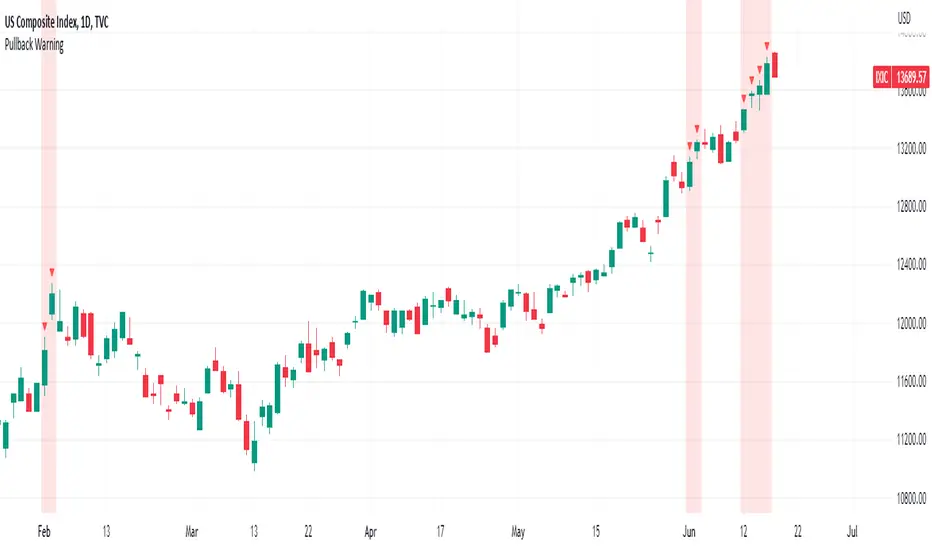
Pullback WarningThe Pullback Warning indicator is a simple indicator that highlights the potential for a market pullback, by measuring distances between certain key moving averages.
John Pocorobba recently shared in his general market updates, research showing that when the distance between the closing price and the 9 day exponential moving average is greater than the distance between the 9 day exponential moving average and the 20 day exponential moving average a pullback is likely.
While this condition occurs frequently, I added sensitivity options to try and filter out the noise. The sensitivity is based on the closing price’s extension from the 50 day simple moving average. Depending on your level of sensitivity, only signals that occur when price is extended either 5, 6, or 7 percent away from the 50 sma will be plotted.
Choose how to see the signal:
Highlight Background
Plot a symbol at desired location
Note this signal works best on indexes, not individual securities.
Follow the Trend - Trade PullbacksKindly follow the rules stated below for entry, exit and stop loss. Not every Buy / Sell signal will be profitable.
Timeframe of the chart acts as current timeframe. You need to choose 2 more as middle and higher timeframes.
This indicator is based on candlesticks, ATR and CCI indicators and the logic provides buy / sell signals at the pullbacks of the trend depicted by higher timeframe, that must be respected throughout.
Enter the long / short trade respectively when the indicator gives buy / sell signal after price has gone below the green / above the red line for higher timeframe.
Stop loss shall be low / high of recent swing. Exit when the price closes below / above the middle timeframe, to be used as trailing target.
Use it for any instrument for any timeframe of your choice.
For example, check the shared chart. It is a 1 min intraday, but the indicator can be used for short or long term positional trades as well.
Enter long at 14102, with stop loss 14077. Trailing target is achieved at 14156 giving a Risk:Reward ratio of 1:2.
Another Buy signal is observed around same level and uptrend continues till day end, again for a Risk:Reward ratio of approx. 1:2.
Rules to follow for Long trades -
Enter long position at Buy signal given after price has moved below green line of higher timeframe.
Exit the position when price closes below orange / blue line of middle timeframe.
Stop loss must be at low of recent swing, appearing just before the Buy signal.
Rules to follow for Short trades -
Enter short position at Sell signal given after price has moved above red line of higher timeframe.
Exit the position when price closes above orange / blue line of middle timeframe.
Stop loss must be at high of recent swing, appearing just before the Sell signal.

Scalping PullBack Tool R1 by JustUncleLDescription
This study project is a Scalping Pullback trading Tool that incorporates the majority of the indicators needed to analyse and scalp Trends for Pull Backs and reversals on 1min, 5min or 15min charts. The set up utilies Heikin Ashi candle charts. Incorporated within this tool are the following indicators:
1. Major industry (Banks) recognised important EMAs in an EMA Ribbon:
Green = EMA89
Blue = EMA200
Black = EMA633
2. The 36EMA (default) High/Low+Close Price Action Channel (PAC).
3. Fractals
4. HH, LH, LL, HL finder to help with drawing Trend lines and mini Trend Lines.
5. Coloured coded Bar high lighting based on the PAC:
blue = bar closed above PAC
red = bar closed below PAC
gray = bar closed inside PAC
red line = EMA36 of bar close
Setup and hints:
Set the chart to Heikin Ashi Candles.
Add "Sweetspot Gold10" indicator to the chart as well to help with support and resistance finding and shows where the important "00" and "0" lines are.
When price is above the PAC(blue bars) we are only looking to buy as price comes back to the PAC
When price is below the PAC(red bars), we are only looking to sell when price comes back to the PAC
What we’re looking for when price comes back into the PAC we draw mini Trendlines utilising the Fractals and HH/LL points to guide your TL drawing.
Now look for the trend to pull back and break the drawn TL. That's is when we place the scalp trade.
So we are looking for continuation signals in terms of a strong, momentum driven pullbacks (normally short term 10-20 pips) of the EMA36.
The other EMAs are there to check for other Pullbacks when EMA36 is broken.
Other than the SweetSpot Gold10 indicator, you should not need any other indicator to scalp the pullbacks.
References:
Fractals V8 by RicardoSantos
Price Action Trading System v0.3 by JustUncleL
SweetSpot Gold10 R1 by JustUncleL
www.swing-trade-stocks.com
www.forexstrategiesresources.com

EMA Pullback Speed Strategy 📌 **Overview**
The **EMA Pullback Speed Strategy** is a trend-following approach that combines **price momentum** and **Exponential Moving Averages (EMA)**.
It aims to identify high-probability entry points during brief pullbacks within ongoing uptrends or downtrends.
The strategy evaluates **speed of price movement**, **relative position to dynamic EMA**, and **candlestick patterns** to determine ideal timing for entries.
One of the key concepts is checking whether the price has **“not pulled back too much”**, helping focus only on situations where the trend is likely to continue.
⚠️ This strategy is designed for educational and research purposes only. It does not guarantee future profits.
🧭 **Purpose**
This strategy addresses the common issue of **"jumping in too late during trends and taking unnecessary losses."**
By waiting for a healthy pullback and confirming signs of **trend resumption**, traders can enter with greater confidence and reduce false entries.
🎯 **Strategy Objectives**
* Enter in the direction of the prevailing trend to increase win rate
* Filter out false signals using pullback depth, speed, and candlestick confirmations
* Predefine Take-Profit (TP) and Stop-Loss (SL) levels for safer, rule-based trading
✨ **Key Features**
* **Dynamic EMA**: Reacts faster when price moves quickly, slower when market is calm – adapting to current momentum
* **Pullback Filter**: Avoids trades when price pulls back too far (e.g., more than 5%), indicating a trend may be weakening
* **Speed Check**: Measures how strongly the price returns to the trend using candlestick body speed (open-to-close range in ticks)
📊 **Trading Rules**
**■ Long Entry Conditions:**
* Current price is above the dynamic EMA (indicating uptrend)
* Price has pulled back toward the EMA (a "buy the dip" situation)
* Pullback depth is within the threshold (not excessive)
* Candlesticks show consecutive bullish closes and break the previous high
* Price speed is strong (positive movement with momentum)
**■ Short Entry Conditions:**
* Current price is below the dynamic EMA (indicating downtrend)
* Price has pulled back up toward the EMA (a "sell the rally" setup)
* Pullback is within range (not too deep)
* Candlesticks show consecutive bearish closes and break the previous low
* Price speed is negative (downward momentum confirmed)
**■ Exit Conditions (TP/SL):**
* **Take-Profit (TP):** Fixed 1.5% target above/below entry price
* **Stop-Loss (SL):** Based on recent price volatility, calculated using ATR × 4
💰 **Risk Management Parameters**
* Symbol & Timeframe: BTCUSD on 1-hour chart (H1)
* Test Capital: \$3000 (simulated account)
* Commission: 0.02%
* Slippage: 2 ticks (minimal execution lag)
* Max risk per trade: 5% of account balance
* Backtest Period: Aug 30, 2023 – May 9, 2025
* Profit Factor (PF): 1.965 (Net profit ÷ Net loss, including spreads & fees)
⚙️ **Trading Parameters & Indicator Settings**
* Maximum EMA Length: 50
* Accelerator Multiplier: 3.0
* Pullback Threshold: 5.0%
* ATR Period: 14
* ATR Multiplier (SL distance): 4.0
* Fixed TP: 1.5%
* Short-term EMA: 21
* Long-term EMA: 50
* Long Speed Threshold: ≥ 1000.0 (ticks)
* Short Speed Threshold: ≤ -1000.0 (ticks)
⚠️Adjustments are based on BTCUSD.
⚠️Forex and other currency pairs require separate adjustments.
🔧 **Strategy Improvements & Uniqueness**
Unlike basic moving average crossovers or RSI triggers, this strategy emphasizes **"momentum-supported pullbacks"**.
By combining dynamic EMA, speed checks, and candlestick signals, it captures trades **as if surfing the wave of a trend.**
Its built-in filters help **avoid overextended pullbacks**, which often signal the trend is ending – making it more robust than traditional trend-following systems.
✅ **Summary**
The **EMA Pullback Speed Strategy** is easy to understand, rule-based, and highly reproducible – ideal for both beginners and intermediate traders.
Because it shows **clear visual entry/exit points** on the chart, it’s also a great tool for practicing discretionary trading decisions.
⚠️ Past performance is not a guarantee of future results.
Always respect your Stop-Loss levels and manage your position size according to your risk tolerance.

LNL Pullback ArrowsBuying the dip has never been easier! LNL Pullback Arrows are here to pinpoint the best possible entries for the trend following setups. With the Pullback Arrows, trader can pick his own approach and risk level thanks to four different types of arrows. The goal of these arrows is to force the traders to scale in & out of trades which is in my opinion crucial when it comes to trend following strategies. These arrows were designed primarily for the daily & weekly time frame (swing trading).
Four Types of Pullback Arrows:
1. Aggro Arrows - Ideal for aggresive approach during parabolic trends. Sometimes trends are so strong that the price barely revisits the daily 8 EMA. This is where the aggro arrows can perfectly pinpoint the aggresive high risk entries. Ideal for halfsize or 1/4 size of the full position. Aiming for quick 1-2 day moves targeting the recent high/low. These arrows could be also named as scalping arrows for the swing traders. A quick In & Out.
2. HalfSize Arrows - Medium risk approach. First arrows to scale in. HalfSize arrows are the first sign that the pullback might be ending, yet there is still some space left for an even deeper pullback. That is the reason why they are called half-size. Ideally taken with half-sized position. When trading the HalfSize Arrows, It is better to have some "spare ammo in the gun" ready to use.
3. FullSize Arrows - Regular risk approach. These arrows represent a zone where the core of the posititon should be taken. The point of validity for the trend is not that far away, meaning the risk can be kept tight. Ideal for scailing the other halfs or quarters of the full position. Also great for more conservative traders or environments with higher volatility.
4. Rare Arrows - Offer the best risk to reward entries during the trend. Rare Arrows should be the "last kick" of the retracement, therefore stops can be positioned really tight. They either trigger the stop immidiately or they provide another juicy leg up or down in the direction of the trend. However, they really do appear rarely.
Simple EMA Cloud:
A simple cloud based on 21 and 55 exponential moving averages. This default length creates a pullback zone that is wide enough for the conservative traders but also give the opportunities to more aggresive traders. Alternatives such as 8 & 21, or 21 & 34 are forming the zone that is too aggresive and usually too thin. Of course, cloud can be fully adjusted or turned off completely. The only role of the cloud is to gauge the trend.
Tips & Tricks:
1.Importance of the Scailing
- As already stated, scailing is crucial to this since there is no way of knowing the exact level at which the price magically bounce every time. It is hard to tell where and which EMA will be respected. How can we know it will be 21 EMA every time? or 34 EMA or 10 EMA or 100 SMA or 50 DMA ... Single MA does not make a trend. This is the reason why scailing is so important. Scailing can make a difference.
2. Nothing is Perfect
- Same as any other study, nothing works 100% perfectly. Sometimes the setup will go right against you and sometimes the price will fade away sideways and breaks off the structure of the trend. This is not a magic certainty tool. This is just another probability tool.
3. Point of Validity & Other Studies
- Even though the pullback arrows can be a stand-alone strategy. It is important to use other indicators that visualize the actual trend. Whether its EMA Cloud or EMAs or DMI Bars or Keltner Channels, there should be something that validates the trend, something that tells the trend is over. (Pullback Arrows are not showing the actual stops!).
Hope it helps.

Breakouts & Pullbacks [Trendoscope®]🎲 Breakouts & Pullbacks - All-Time High Breakout Analyzer
Probability-Based Post-Breakout Behavior Statistics | Real-Time Pullback & Runup Tracker
A professional-grade Pine Script v6 indicator designed specifically for analyzing the historical and real-time behavior of price after strong All-Time High (ATH) breakouts. It automatically detects significant ATH breakouts (with configurable minimum gap), measures the depth and duration of pullbacks, the speed of recovery, and the subsequent run-up strength — then turns all this data into easy-to-read statistical probabilities and percentile ranks.
Perfect for swing traders, breakout traders, and anyone who wants objective, data-driven insight into questions like:
“How deep do pullbacks usually get after a strong ATH breakout?”
“How many bars does it typically take to recover the breakout level?”
“What is the median run-up after recovery?”
“Where is the current pullback or run-up relative to historical ones?”
🎲 Core Concept & Methodology
Indicator is more suitable for indices or index ETFs that generally trade in all-time highs however subjected to regular pullbacks, recovery and runups.
For every qualified ATH breakout, the script identifies 4 distinct phases:
Breakout Point – The exact bar where price closes above the previous ATH after at least Minimum Gap bars.
Pullback Phase – From breakout candle high → lowest low before price recovers back above the breakout level.
Recovery Phase – From the pullback low → the bar where price first trades back above the original breakout price.
Post-Recovery Run-up Phase – From the recovery point → current price (or highest high achieved so far).
Each completed cycle is stored permanently and used to build a growing statistical database unique to the loaded chart and timeframe.
🎲 Visual Elements
Yellow polyline triangle connecting Previous ATH / Pullback point(start), New ATH Breakout point (end), Recovery point (lowest pullback price), and extends to recent ATH price.
Small green label at the pullback low showing detailed tooltip on hover with all measured values
Clean, color-coded statistics table in the top-right corner (visible only on the last bar)
Powerful Statistics Table – The Heart of the Indicator
The table constantly compares the current situation against all past qualified breakouts and shows details about pullbacks, and runups that help us calculate the probability of next pullback, recovery or runup.
🎲 Settings & Inputs
Minimum Gap
The minimum number of bars that must pass between breaking a new ATH and the previous one.
Higher values = stricter filter → only the strongest, cleanest breakouts are counted.
Lower values = more data points (useful on lower timeframes or very trending instruments).
Recommendation:
Daily charts: 30–50
4H charts: 40–80
1H charts: 100–200
🎲 How to Use It in Practice
This indicator helps investors to understand when to be bullish, bearish or cautious and anticipate regular pullbacks, recovery of markets using quantitative methods.
The indicator does not generate buy/sell signals. However, helps traders set expectations and anticipate market movements based on past behavior.

EdgeFlow Pullback [CHE]EdgeFlow Pullback \ — Icon & Visual Guide (Deep Dive)
TL;DR (1-minute read)
⏳ Hourglass = Pending verdict. A countdown runs from the signal bar until your Evaluation Window ends.
✔ Checkmark (green) = OK. After the evaluation window, price (HLC3) is on the correct side of the EMA144 for that signal’s direction.
✖ Cross (red) = Fail. After the evaluation window, price (HLC3) is on the wrong side of the EMA144.
▲ / ▼ Triangles = the actual PB Long/Short signal bar (sequence completed in time).
Small lime/red crosses = visual markers when HLC3 crosses EMA144 (context, not trade signals).
Orange line = EMA144 (baseline/trend filter).
T3 line color = Context signal: green when T3 is below HLC3, red when T3 is above HLC3.
Icon Glossary (What each symbol means)
1) ⏳ Hourglass — “Pending / Countdown”
Appears immediately when a PB signal fires (Long or Short).
Shows `⏳ currentBars / EvaluationBars` (e.g., `⏳ 7/30`).
The label stays anchored at the signal bar and its original price level (it does not drift with price).
During ⏳ you get no verdict yet. It’s simply the waiting period before grading.
2) ✔ Checkmark (green) — “Condition met”
Appears after the Evaluation Window completes.
Logic:
Long signal: HLC3 (typical price) is above EMA144 → ✔
Short signal: HLC3 is below EMA144 → ✔
The label turns green and text says “✔ … Condition met”.
This is rules-based grading, not PnL. It tells you if the post-signal structure behaved as expected.
3) ✖ Cross (red) — “Condition failed”
Appears after the Evaluation Window completes if the condition above is not met.
Label turns red with “✖ … Condition failed”.
Again: rules-based verdict, not a guarantee of profit or loss.
4) ▲ “PB Long” triangle (below bar)
Marks the exact bar where the 4-step Long sequence completed within the allowed window.
That bar is your signal bar for Long setups.
5) ▼ “PB Short” triangle (above bar, red)
Same as above, for Short setups.
6) Lime/Red “+” crosses (tiny cross markers)
Lime cross (below bar): HLC3 crosses above EMA144 (crossover).
Red cross (above bar): HLC3 crosses below EMA144 (crossunder).
These crosses are context markers; they’re not entry signals by themselves.
The Two Clocks (Don’t mix them up)
There are two different time windows at play:
1. Signal Window — “Max bars for full sequence”
A pullback signal (Long or Short) only fires if the 4-step sequence completes within this many bars.
If it takes too long: reset (no signal, no triangle, no label).
Purpose: avoid stale setups.
2. Evaluation Window — “Evaluation window after signal (bars)”
Starts after the signal bar. The label shows an ⏳ countdown.
When it reaches the set number of bars, the indicator checks whether HLC3 is on the correct side of EMA144 for the signal direction.
Then it stamps the signal with ✔ (OK) or ✖ (Fail).
Timeline sketch (Long example):
```
→ ▲ PB Long at bar t0
Label shows: ⏳ 0/EvalBars
t0+1, t0+2, ... t0+EvalBars-1 → still ⏳
At t0+EvalBars → Check HLC3 vs EMA144
Result → ✔ (green) or ✖ (red)
(Label remains anchored at t0 / signal price)
```
What Triggers the PB Signal (so you know why triangles appear)
LONG sequence (4 steps in order):
1. T3 falling (the pullback begins)
2. HLC3 crosses under EMA144
3. T3 rising (pullback ends)
4. HLC3 crosses over EMA144 → PB Long triangle
SHORT sequence (mirror):
1. T3 rising
2. HLC3 crosses over EMA144
3. T3 falling
4. HLC3 crosses under EMA144 → PB Short triangle
If steps 1→4 don’t complete in time (within Max bars for full sequence), the sequence is abandoned (no signal).
Lines & Colors (quick interpretation)
EMA144 (orange): your baseline trend filter.
T3 (green/red):
Green when T3 < HLC3 (price above the smoothed path; often supportive in up-moves)
Red when T3 > HLC3 (price below the smoothed path; often pressure in down-moves)
HLC3 (gray): the typical price the logic uses ( (H+L+C)/3 ).
Label Behavior (anchoring & cleanup)
Each signal creates one label at the signal bar with ⏳.
The label is position-locked: it stays at the same bar index and y-price it was born at.
After the evaluation check, the label text and color update to ✔/✖, but position stays fixed.
The indicator keeps only the last N labels (your “Show only the last N labels” input). Older ones are deleted to reduce clutter.
What You Can (and Can’t) Infer from ✔ / ✖
✔ OK: Structure behaved as intended during the evaluation window (HLC3 finished on the correct side of EMA144).
Inference: The pullback continued in the expected direction post-signal.
✖ Fail: Structure ended up opposite the expectation.
Inference: The pullback did not continue cleanly (chop, reversal, or insufficient follow-through).
> Important: ✔/✖ is not profit or loss. It’s an objective rule check. Use it to identify market regimes where your entries perform best.
Input Settings — How they change the visuals
T3 length:
Shorter → faster turns, more signals (and more noise).
Longer → smoother turns, fewer but cleaner sequences.
T3 volume factor (0–1, default 0.7):
Higher → more curvature/smoothing.
Typical sweet spot: 0.5–0.9.
EMA length (baseline) default 144:
Smaller → faster baseline, more cross events, more aggressive signals.
Larger → slower, stricter trend confirmation.
Max bars for full sequence (signal window):
Smaller → only fresh, snappy pullbacks can signal.
Larger → allows slower pullbacks to complete.
Evaluation window (after signal):
Smaller → verdict arrives quickly (less tolerance).
Larger → gives the trade more time to prove itself structurally.
Show only the last N labels:
Controls chart clutter. Increase for more history, decrease for focus.
(FYI: The “Debug” toggle exists but doesn’t draw extra overlays in this version.)
Practical Reading Flow (how to use visuals in seconds)
1. Triangles catch your eye: ▲ for Long, ▼ for Short. That’s the setup completion.
2. ⏳ label starts—don’t judge yet; let the evaluation run.
3. Watch EMA slope and T3 color for context (trend + pressure).
4. After the window: ✔/✖ stamps the outcome. Log what the market was like when you got ✔.
Common “Why did…?” Questions
Q: Why did I get no triangle even though T3 turned and EMA crossed?
A: The 4 steps must happen in order and within the Signal Window. If timing breaks, the sequence resets.
Q: Why did my label stay ⏳ for so long?
A: That’s by design until the Evaluation Window completes. The verdict only happens at the end of that window.
Q: Why is ✔/✖ different from my PnL?
A: It’s a structure check, not a profit check. It doesn’t know your entries/exits/stops.
Q: Do the small lime/red crosses mean buy/sell?
A: No. They’re context markers for HLC3↔EMA crosses, useful inside the sequence but not standalone signals.
Pro Tips (turn visuals into decisions)
Entry: Use the ▲/▼ triangle as your trigger, in trend direction (check EMA slope/market structure).
Stop: Behind the pullback swing around the signal bar.
Exit: Structure levels, R-multiples, or a reverse HLC3↔EMA cross as a trailing logic.
Tuning:
Intraday/volatile: shorter T3/EMA + tighter Signal Window.
Swing/slow: default 144 EMA + moderate windows.
Learn quickly: Filter your chart to show only ✔ or only ✖ windows in your notes; see which sessions, assets, and volatility regimes suit the system.
Disclaimer
No indicator guarantees profits. Sweep2Trade Pro \ is a decision aid; always combine with solid risk management and your own judgment. Backtest, forward test, and size responsibly.
The content provided, including all code and materials, is strictly for educational and informational purposes only. It is not intended as, and should not be interpreted as, financial advice, a recommendation to buy or sell any financial instrument, or an offer of any financial product or service. All strategies, tools, and examples discussed are provided for illustrative purposes to demonstrate coding techniques and the functionality of Pine Script within a trading context.
Any results from strategies or tools provided are hypothetical, and past performance is not indicative of future results. Trading and investing involve high risk, including the potential loss of principal, and may not be suitable for all individuals. Before making any trading decisions, please consult with a qualified financial professional to understand the risks involved.
By using this script, you acknowledge and agree that any trading decisions are made solely at your discretion and risk.
Enhance your trading precision and confidence 🚀
Happy trading
Chervolino

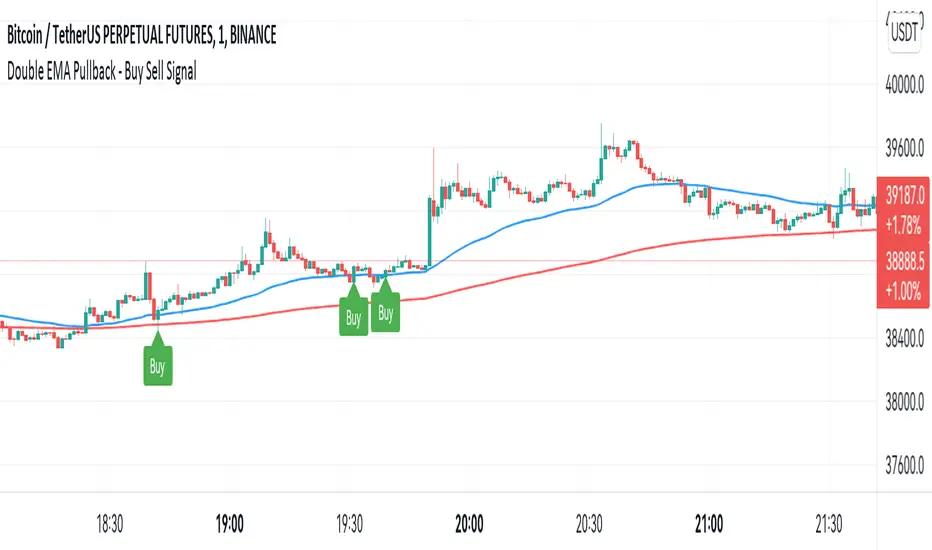
Double EMA WIth Pullback Buy Sell Signal - Smarter AlgoBuilt with love "Double EMA With Pullback Buy Sell Signal "
This indiator will help you to find a Double EMA Pullback Signal
You can combine with your own strategy, or use this purely
DISCLAIMER :
Measure the risk first before use it in real market
Backtest The Strategy was very important, so you know the probability
Fundamentally Logical :
Pullback (Some Previous candle is Red for Bull Pullback vice versa)
the Entry candle must be a Candlestick Pattern
Features :
1. Double EMA
2. Pullback Signal
How to use it :
1. Adjust the Pullback Backstep
2. Adjust the EMA Period
3. Adjust the Style to your preferences
Regards,
Hanabil
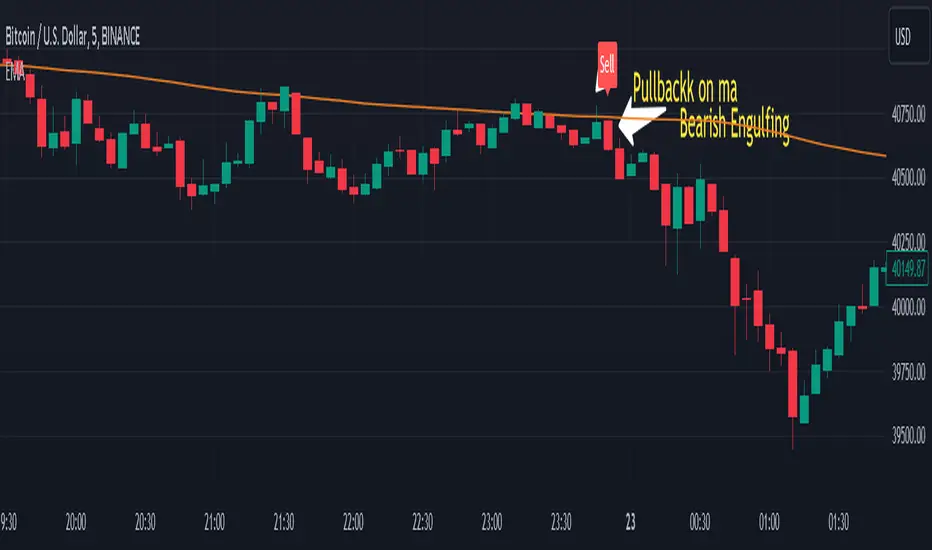
Smarter Pullback + Candlestick Pattern (Steven Hart)Built with love "Smarter Pullback + Candlestick Pattern"
This indiator will help you to find a Pullback + Candlestick Pattern, inspirated by Steven Hart
You can combine with your own strategy, or use this purely
DISCLAIMER :
Measure the risk first before use it in real market
Backtest The Strategy was very important, so you know the probability
Fundamentally Logical :
Pullback (Some Previous candle is Red for Bull Pullback vice versa)
the Entry candle must be a Candlestick Pattern
Features :
1. Engulfing
2. Hammer & Shooting Star
3. Doji
How to use it :
1. Adjust the Pullback Period
2. Check and Uncheck the Pattern you want to see
3. Adjust the style to your favourite
Regards,
Hanabil

Pullback SARPullback SAR - Parabolic SAR with Pullback Detection
Description: The "Pullback SAR" is an advanced indicator built on the classic Parabolic SAR but with additional functionality for detecting pullbacks. It helps identify moments when the price pulls back from the main trend, offering potential entry signals. Perfect for traders looking to enter the market after a correction.
Key Features:
SAR (Parabolic SAR): The Parabolic SAR indicator is used to determine potential trend reversal points. It marks levels where the price could reverse its direction.
Pullback Detection: The indicator catches periods when the price moves away from the main trend and then returns, which may suggest a re-entry opportunity.
Long and Short Signals: Once a pullback in the direction of the main trend is identified, the indicator generates signals that could be used to open positions.
Simple and Clear Construction: The indicator is based on the classic SAR, with added pullback detection logic to enhance the accuracy of the signals.
Parameters:
Start (SAR Step): Determines the initial step for the SAR calculation, which controls the rate of change in the indicator at the beginning.
Increment (SAR Increment): Defines the maximum step size for SAR, allowing traders to adjust the indicator’s sensitivity to market volatility.
Max Value (SAR Max): Sets the upper limit for the SAR value, controlling its volatility.
Usage:
Swing Trading: Ideal for swing strategies, aiming to capture larger price moves while maintaining a safe margin.
Scalping: Due to its precise pullback detection, it can also be used in scalping, especially when the price quickly returns to the main trend.
Risk Management: The combination of SAR and pullback detection allows traders to adjust their positions according to changing market conditions.
Special Notes:
Adjusting Parameters: Depending on the market and trading style, users can adjust the SAR parameters (Start, Increment, Max Value) to fit their needs.
Combination with Other Indicators: It's recommended to use the indicator alongside other technical analysis tools (e.g., EMA, RSI) to enhance the accuracy of the signals.
Link to the script: This open-source version of the indicator is available on TradingView, enabling full customization and adjustments to meet your personal trading strategy. Share your experiences and suggestions!

Moving Average Pullback Signals [UAlgo]The "Moving Average Pullback Signals " indicator is designed to identify potential trend continuation or reversal points based on moving average (MA) pullback patterns. This tool combines multiple types of moving averages, customized trend validation parameters, and candlestick wick patterns to provide reliable buy and sell signals. By leveraging several advanced MA methods (such as TEMA, DEMA, ZLSMA, and McGinley-D), this script can adapt to different market conditions, providing traders with flexibility and more precise trend-based entries and exits. The addition of a gradient color-coded moving average line and wick validation logic enables traders to visualize market sentiment and trend strength dynamically.
🔶 Key Features
Multiple Moving Average (MA) Calculation Methods: This indicator offers various MA calculation types, including SMA, EMA, DEMA, TEMA, ZLSMA, and McGinley-D, allowing traders to select the MA that best fits their strategy.
Trend Validation and Pattern Recognition: The indicator includes a customizable trend validation length, ensuring that the trend is consistent before buy/sell signals are generated. The "Trend Pattern Mode" setting provides flexibility between "No Trend in Progress," "Trend Continuation," and "Both," tailoring signals to the trader’s preferred style.
Wick Validation Logic: To enhance the accuracy of entries, this indicator identifies specific wick patterns for bullish or bearish pullbacks, which signal potential trend continuation or reversal. Wick length and validation factor are adjustable to suit various market conditions and timeframes.
Gradient Color-coded MA Line: This feature provides a quick visual cue for trend strength, with color changes reflecting relative highs and lows of the MA, enhancing market sentiment interpretation.
Alerts for Buy and Sell Signals: Alerts are triggered when either a bullish or bearish pullback is detected, allowing traders to receive instant notifications without continuously monitoring the chart.
Visual Labels for Reversal Points: The indicator plots labels ("R") at potential reversal points, with color-coded labels for bullish (green) and bearish (red) pullbacks, highlighting pullback opportunities that align with the trend or reversal potential.
🔶 Disclaimer
Use with Caution: This indicator is provided for educational and informational purposes only and should not be considered as financial advice. Users should exercise caution and perform their own analysis before making trading decisions based on the indicator's signals.
Not Financial Advice: The information provided by this indicator does not constitute financial advice, and the creator (UAlgo) shall not be held responsible for any trading losses incurred as a result of using this indicator.
Backtesting Recommended: Traders are encouraged to backtest the indicator thoroughly on historical data before using it in live trading to assess its performance and suitability for their trading strategies.
Risk Management: Trading involves inherent risks, and users should implement proper risk management strategies, including but not limited to stop-loss orders and position sizing, to mitigate potential losses.
No Guarantees: The accuracy and reliability of the indicator's signals cannot be guaranteed, as they are based on historical price data and past performance may not be indicative of future results.

Strong Pullback Indicator [Rami_LB]Strong Pullback Indicator
Description:
The Strong Pullback Indicator is designed to identify potential pullbacks or even trend reversals by utilizing a specific candlestick pattern in conjunction with the Relative Strength Index (RSI). It is advised to employ this indicator in chart intervals of 15 minutes or higher, as intervals below 15 minutes may generate excessive false signals.
Working Mechanism:
Upon detecting the designated candlestick pattern, the indicator examines whether any of the last five candles exhibit RSI values below 30 or above 70 across at least four distinct time intervals, depending on whether the pattern is bullish or bearish. The RSI calculations incorporate eight different intervals: 1 minute (1m), 5 minutes (5m), 15 minutes (15m), 30 minutes (30m), 1 hour (1h), 2 hours (2h), 4 hours (4h), and 1 day (1d). An arrow is rendered above or below the current candle only when these conditions are met.
Users have the option to adjust the number of overbought or oversold intervals, as well as the general settings for the RSI.
SL/TP Lines:
The indicator can also serve as a trade signal to initiate trades in the opposite direction. To evaluate the potential success of a trade in a backtesting scenario, SL (Stop Loss) and TP (Take Profit) lines can be displayed on the chart. The SL is calculated by taking the distance from the close of the current candle to the high/low of the previous candle and multiplying it by 2.
In the settings, you can alter the Risk Reward Ratio (RRR) of the trade. Given the pullback nature of this indicator, a RRR of 1:1 is deemed logical, thus set as the default value.
Bullish vs. Bearish Candle Counter:
An additional feature of this indicator is its ability to analyze the last 100 candles to ascertain the ratio of bullish to bearish candles. When a 60% threshold is reached, the chart background color alters accordingly. This feature was conceived after a thorough analysis of over 50,000 candles of a currency pair revealed nearly identical counts of bullish and bearish candles, suggesting a market tendency to maintain this balance.
Within the settings, you have the flexibility to modify the number of candles to be analyzed and the percentage threshold for each candle type.
Should you have any ideas on how to enhance the accuracy of this indicator, or suggestions for other indicators that could improve the signals, feel free to leave a comment.

Pullback Finder AutoPullback Finder Auto — Intraday Momentum Cooling Detector
Pullback Finder Auto is designed to find stocks that have made a strong intraday run from the open and are now cooling off while still positive — the classic pullback zone where continuation entries often form.
It automatically measures the percentage change from today’s open and highlights bars where:
the stock has already run at least a chosen amount (for example +10 % above its open), and
the current price is still up but within a defined pullback range (for example between +3 % and +8 % above the open).
When those two conditions are met, you’ll see green graphics on your chart:
Green triangle markers under the candle.
Optionally, small green PB labels such as “PB 5.2 %” showing the exact percentage from open when the setup occurs.
A green highlight in the sub‑window or line plot if you left the “Change from Open %” plot active.
These are your visual cues that a pullback has formed — a stock that previously ran and is now pulling back while holding strength.
How it works
The script continuously monitors:
• High % from Open = (high − open) / open × 100
• Current % from Open = (close − open) / open × 100
A “Pullback” condition triggers only if:
the high % is greater than or equal to your minimum run threshold, and
the current % sits between your minimum and maximum pullback percentages.
When both are true, the indicator plots the green triangle and optional label.
Default parameters
Min Run % = 10
Min Current % = 3
Max Current % = 8
Session Start = 09:30 – 16:00 US Eastern
All can be changed to fit different volatility levels.
Lower values catch smaller moves; higher values restrict signals to explosive runners.
Using it in real time
During live trading, Pullback Finder Auto updates with each candle.
When a bar first enters the target zone, a green triangle and PB label will appear immediately under that candle.
These are dynamic: if price moves out of the valid zone on the same bar, the marker may disappear.
You can create an alert on “Pullback Finder Auto – Pullback Candidate” to be notified whenever new triangles appear across your active symbols.
This works on any timeframe:
use shorter timeframes such as 1‑minute or 5‑minute charts for fast, intraday detection,
use longer timeframes for a broader view of the day’s market structure.
Using it on past data (scanning backwards)
When you scroll back through history, past green triangles remain visible at every bar where the condition was true at that time.
The PB labels next to those candles show exactly how far above the open the stock was trading during the historical setup.
Use this for visual back‑testing: study how price reacted after these pullback points, adjust the thresholds, and refine your criteria for different markets.
The grey or teal line under the chart (if enabled) shows the percent‑from‑open curve so you can see the full run‑and‑cool pattern leading into each triangle signal.
If you convert the indicator into a strategy, the same condition becomes historical entry points you can test with the Strategy Tester.
Summary
1. Pullback Finder Auto paints green triangles and PB labels whenever an intraday pullback fits your criteria.
2. It runs dynamically in real‑time and also preserves markers for historical review.
3. Adjust the thresholds to match volatility or timeframe.
4. Ideal for visual scanning, watchlist alerts, or integration into a lightweight screening strategy.

Adaptive Fibonacci Pullback System -FibonacciFluxAdaptive Fibonacci Pullback System (AFPS) - FibonacciFlux
This work is licensed under a Attribution-NonCommercial-ShareAlike 4.0 International (CC BY-NC-SA 4.0). Original concepts by FibonacciFlux.
Abstract
The Adaptive Fibonacci Pullback System (AFPS) presents a sophisticated, institutional-grade algorithmic strategy engineered for high-probability trend pullback entries. Developed by FibonacciFlux, AFPS uniquely integrates a proprietary Multi-Fibonacci Supertrend engine (0.618, 1.618, 2.618 ratios) for harmonic volatility assessment, an Adaptive Moving Average (AMA) Channel providing dynamic market context, and a synergistic Multi-Timeframe (MTF) filter suite (RSI, MACD, Volume). This strategy transcends simple indicator combinations through its strict, multi-stage confluence validation logic. Historical simulations suggest that specific MTF filter configurations can yield exceptional performance metrics, potentially achieving Profit Factors exceeding 2.6 , indicative of institutional-level potential, while maintaining controlled risk under realistic trading parameters (managed equity risk, commission, slippage).
4 hourly MTF filtering
1. Introduction: Elevating Pullback Trading with Adaptive Confluence
Traditional pullback strategies often struggle with noise, false signals, and adapting to changing market dynamics. AFPS addresses these challenges by introducing a novel framework grounded in Fibonacci principles and adaptive logic. Instead of relying on static levels or single confirmations, AFPS seeks high-probability pullback entries within established trends by validating signals through a rigorous confluence of:
Harmonic Volatility Context: Understanding the trend's stability and potential turning points using the unique Multi-Fibonacci Supertrend.
Adaptive Market Structure: Assessing the prevailing trend regime via the AMA Channel.
Multi-Dimensional Confirmation: Filtering signals with lower-timeframe Momentum (RSI), Trend Alignment (MACD), and Market Conviction (Volume) using the MTF suite.
The objective is to achieve superior signal quality and adaptability, moving beyond conventional pullback methodologies.
2. Core Methodology: Synergistic Integration
AFPS's effectiveness stems from the engineered synergy between its core components:
2.1. Multi-Fibonacci Supertrend Engine: Utilizes specific Fibonacci ratios (0.618, 1.618, 2.618) applied to ATR, creating a multi-layered volatility envelope potentially resonant with market harmonics. The averaged and EMA-smoothed result (`smoothed_supertrend`) provides a robust, dynamic trend baseline and context filter.
// Key Components: Multi-Fibonacci Supertrend & Smoothing
average_supertrend = (supertrend1 + supertrend2 + supertrend3) / 3
smoothed_supertrend = ta.ema(average_supertrend, st_smooth_length)
2.2. Adaptive Moving Average (AMA) Channel: Provides dynamic market context. The `ama_midline` serves as a key filter in the entry logic, confirming the broader trend bias relative to adaptive price action. Extended Fibonacci levels derived from the channel width offer potential dynamic S/R zones.
// Key Component: AMA Midline
ama_midline = (ama_high_band + ama_low_band) / 2
2.3. Multi-Timeframe (MTF) Filter Suite: An optional but powerful validation layer (RSI, MACD, Volume) assessed on a lower timeframe. Acts as a **validation cascade** – signals must pass all enabled filters simultaneously.
2.4. High-Confluence Entry Logic: The core innovation. A pullback entry requires a specific sequence and validation:
Price interaction with `average_supertrend` and recovery above/below `smoothed_supertrend`.
Price confirmation relative to the `ama_midline`.
Simultaneous validation by all enabled MTF filters.
// Simplified Long Entry Logic Example (incorporates key elements)
long_entry_condition = enable_long_positions and
(low < average_supertrend and close > smoothed_supertrend) and // Pullback & Recovery
(close > ama_midline and close > ama_midline) and // AMA Confirmation
(rsi_filter_long_ok and macd_filter_long_ok and volume_filter_ok) // MTF Validation
This strict, multi-stage confluence significantly elevates signal quality compared to simpler pullback approaches.
1hourly filtering
3. Realistic Implementation and Performance Potential
AFPS is designed for practical application, incorporating realistic defaults and highlighting performance potential with crucial context:
3.1. Realistic Default Strategy Settings:
The script includes responsible default parameters:
strategy('Adaptive Fibonacci Pullback System - FibonacciFlux', shorttitle = "AFPS", ...,
initial_capital = 10000, // Accessible capital
default_qty_type = strategy.percent_of_equity, // Equity-based risk
default_qty_value = 4, // Default 4% equity risk per initial trade
commission_type = strategy.commission.percent,
commission_value = 0.03, // Realistic commission
slippage = 2, // Realistic slippage
pyramiding = 2 // Limited pyramiding allowed
)
Note: The default 4% risk (`default_qty_value = 4`) requires careful user assessment and adjustment based on individual risk tolerance.
3.2. Historical Performance Insights & Institutional Potential:
Backtesting provides insights into historical behavior under specific conditions (always specify Asset/Timeframe/Dates when sharing results):
Default Performance Example: With defaults, historical tests might show characteristics like Overall PF ~1.38, Max DD ~1.16%, with potential Long/Short performance variance (e.g., Long PF 1.6+, Short PF < 1).
Optimized MTF Filter Performance: Crucially, historical simulations demonstrate that meticulous configuration of the MTF filters (particularly RSI and potentially others depending on market) can significantly enhance performance. Under specific, optimized MTF filter settings combined with appropriate risk management (e.g., 7.5% risk), historical tests have indicated the potential to achieve **Profit Factors exceeding 2.6**, alongside controlled drawdowns (e.g., ~1.32%). This level of performance, if consistently achievable (which requires ongoing adaptation), aligns with metrics often sought in institutional trading environments.
Disclaimer Reminder: These results are strictly historical simulations. Past performance does not guarantee future results. Achieving high performance requires careful parameter tuning, adaptation to changing markets, and robust risk management.
3.3. Emphasizing Risk Management:
Effective use of AFPS mandates active risk management. Utilize the built-in Stop Loss, Take Profit, and Trailing Stop features. The `pyramiding = 2` setting requires particularly diligent oversight. Do not rely solely on default settings.
4. Conclusion: Advancing Trend Pullback Strategies
The Adaptive Fibonacci Pullback System (AFPS) offers a sophisticated, theoretically grounded, and highly adaptable framework for identifying and executing high-probability trend pullback trades. Its unique blend of Fibonacci resonance, adaptive context, and multi-dimensional MTF filtering represents a significant advancement over conventional methods. While requiring thoughtful implementation and risk management, AFPS provides discerning traders with a powerful tool potentially capable of achieving institutional-level performance characteristics under optimized conditions.
Acknowledgments
Developed by FibonacciFlux. Inspired by principles of Fibonacci analysis, adaptive averaging, and multi-timeframe confirmation techniques explored within the trading community.
Disclaimer
Trading involves substantial risk. AFPS is an analytical tool, not a guarantee of profit. Past performance is not indicative of future results. Market conditions change. Users are solely responsible for their decisions and risk management. Thorough testing is essential. Deploy at your own considered risk.

Engulfing pullbackThis Indicator searching for pullback on input Moving Average with Engulfing candle
Rules for indicator :-
Buy Signal -
1) search for pullback on ma if price above ma and come back and touches ma
2)after pullback on ma searching for bullish engulfing pattern on next candle
3)if pullback on previous candle and bullish engulfing for buy signal form
Sell Signal -
1) search for pullback on ma if price below ma and come back touches ma
2)after pullback on ma searching for bearish engulfing pattern on next candle
3)if pullback on previous candle and bearish engulfing for buy signal form
Disclaimer -Traders can use this script as a starting point for further customization or as a reference for developing their own trading strategies. It's important to note that past performance is not indicative of future results, and thorough testing and validation are recommended before deploying any trading strategy.
Ma PullbackThis indicator is based on ema band....
condition for buy =>
1) price should crossover ema band
2) price pullback on ema band but price should not close below lower band
3)after pullback green candle should close above ema band
4)check candle size when its crossing ema band
5)check previous canlde 7 should not touching cloud so (we can reduce range signal)
condition for sell =>
1) price should crossunder ema band
2) price pullback on ema band but price should not close above upper band
3)after pullback red candle should crossunder ema band
4)check candle size when its crossing ema band
5)check previous canlde 7 should not touching cloud so (we can reduce range signal)
this indicator also for education purpuse how we can make pullback condition....

Coral Trend Pullback Strategy (TradeIQ)Description:
Strategy is taken from the TradeIQ YouTube video called "I Finally Found 80% Win Rate Trading Strategy For Crypto".
Check out the full video for further details/clarification on strategy entry/exit conditions.
The default settings are exactly as TradeIQ described in his video.
However I found some better results by some tweaking settings, increasing R:R ratio and by turning off confirmation indicators.
This would suggest that perhaps the current confirmation indicators are not the best options. I'm happy to try add some other optional confirmation indicators if they look to be more effective.
Recommended timeframe: 1H
Strategy incorporates the following features:
Risk management:
Configurable X% loss per stop loss
Configurable R:R ratio
Trade entry:
Based on strategy conditions below
Trade exit:
Based on strategy conditions below
Backtesting:
Configurable backtesting range by date
Trade drawings:
Each entry condition indicator can be turned on and off
TP/SL boxes drawn for all trades. Can be turned on and off
Trade exit information labels. Can be turned on and off
NOTE: Trade drawings will only be applicable when using overlay strategies
Alerting:
Alerts on LONG and SHORT trade entries
Debugging:
Includes section with useful debugging techniques
Strategy conditions
Trade entry:
LONG
C1: Coral Trend is bullish
C2: At least 1 candle where low is above Coral Trend since last cross above Coral Trend
C3: Pullback happens and price closes below Coral Trend
C4: Coral Trend colour remains bullish for duration of pullback
C5: After valid pullback, price then closes above Coral Trend
C6: Optional confirmation indicators (choose either C6.1 or C6.2 or NONE):
C6.1: ADX and DI (Single indicator)
C6.1.1: Green line is above red line
C6.1.2: Blue line > 20
C6.1.3: Blue trending up over last 1 candle
C6.2: Absolute Strengeh Histogram + HawkEye Volume Indicator (Two indicators combined)
C6.2.1: Absolute Strengeh Histogram colour is blue
C6.2.2: HawkEye Volume Indicator colour is green
SHORT
C1: Coral Trend is bearish
C2: At least 1 candle where high is below Coral Trend since last cross below Coral Trend
C3: Pullback happens and price closes above Coral Trend
C4: Coral Trend colour remains bearish for duration of pullback
C5: After valid pullback, price then closes below Coral Trend
C6: Optional confirmation indicators (choose either C6.1 or C6.2 or NONE):
C6.1: ADX and DI (Single indicator)
C6.1.1: Red line is above green line
C6.1.2: Blue line > 20
C6.1.3: Blue trending up over last 1 candle
C6.2: Absolute Strengeh Histogram + HawkEye Volume Indicator (Two indicators combined)
C6.2.1: Absolute Strengeh Histogram colour is red
C6.2.2: HawkEye Volume Indicator colour is red
NOTE: All the optional confirmation indicators cannot be overlayed with Coral Trend so feel free to add each separately to the chart for visual purposes
Trade exit:
Stop Loss: Calculated by recent swing low over previous X candles (configurable with "Local High/Low Lookback")
Take Profit: Calculated from R:R multiplier * Stop Loss size
Credits
Strategy origin: TradeIQ's YouTube video called "I Finally Found 80% Win Rate Trading Strategy For Crypto"
It combines the following indicators for trade entry conditions:
Coral Trend Indicator by @LazyBear (Main indicator)
Absolute Strength Histogram | jh by @jiehonglim (Optional confirmation indicator)
Indicator: HawkEye Volume Indicator by @LazyBear (Optional confirmation indicator)
ADX and DI by @BeikabuOyaji (Optional confirmation indicator)

Pullback Candles (Candlestick Analysis) Guaranteed Winners!!!!Pullback Candle will signal when price is at the end of a pullback and entering a balance phase in the market (works on all markets)
Also we can expect a Pullback Candle during flash crashes as the theory of this script is when there is a turning point in momentum - this candle will appear and we can look long from this signal.
This candle will only work in Swing Low areas and appear when below an moving average which can be changed in the settings.
This candle will work on all timeframes - HTF provided very good rexpectancy whereas the LTF has a slightly less expectancy.
This candle can be alerted to signal the Pullback Candle when the bar is confirmed and not during.
The way i trade this candle is
1) Candle signal must be in probably area to increase efficiency.
2) Enter on the second candle after candle IS CONFIRMED
3) Set stop loss below Pullback Candle or use ATR value
4) Trade with the trend ie only bullish price action
5) This candle can catch falling knifes - we had one on LUNA before the rally to $7.50
6) Trading with a confluence along with the Pullback is better than solely trading this candle
Please leave a comment.
If we get to 100 likes i will publish the script.
Have a good weekend :)
Pullback Master ProPullback Master Pro - Scalping & Swing Trading Indicator
Perfect for both scalping and swing trading:
For Scalpers (1-5 min charts):
Quick pullback signals with fast EMA response
Real-time RSI/volume confirmation for rapid entries
Clean signals for fast in/out decisions
For Swing Traders (1H-4H charts):
Multi-timeframe trend filtering for higher accuracy
Deep pullback detection for better risk/reward
Sustained momentum signals for longer holds
Core Features:
Pullback detection with customizable depth
Multi-timeframe trend alignment
RSI + Volume + EMA confluence
Adjustable signal display (opacity, position, size)
Always-visible 3×6 data table
Multiple themes and customization options
One indicator for all timeframes - works equally well for quick scalps and strategic swing trades by adjusting the settings.
