Search in scripts for "relative strength"


Relative Strength Index (Log/Divs/MTF/EMA)RSI calculated for log scale, with divergences labeled, as well as a 1 hour 55 EMA for signal.
Original log-space RSI by fskrypt.
Divergences taken from JustUncleL, originally from RicardoSantos.

Relative Strength Index + Moving Average + Colors
Standard RSI already stylized
Standard Overbought and Oversold line stylized + middle line
Moving Average, can set length and exponential or simple
MA can be colored based on direction
MA has crosses when yellow, likely soon before a reversal

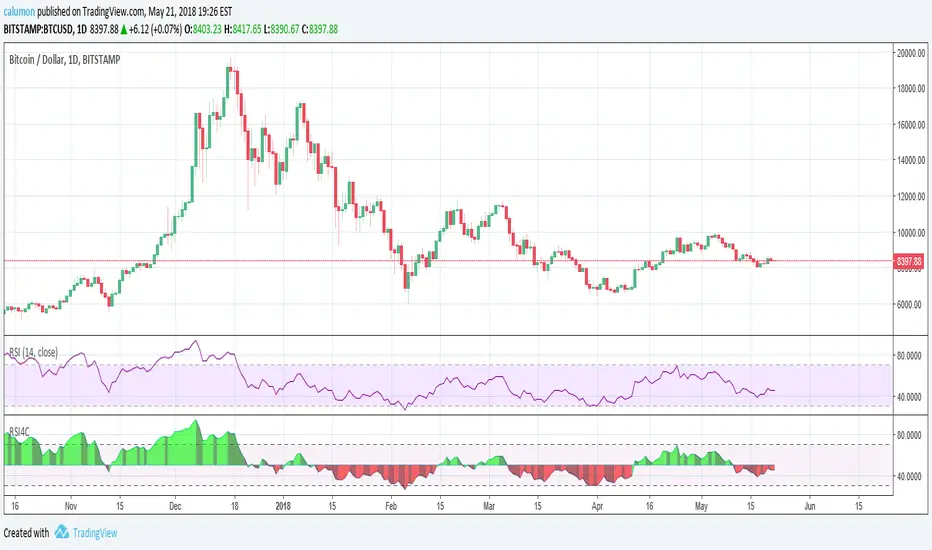
Relative Strength Index with 4 ColorsThe values used by this indicator are equal to RSI 14. Only changes are made to looks:
If RSI is above 50%, then we are seeing green. Else, we are seeing red.
Another point is that depending on whether the RSI increases or decreases, we get two different color tones.
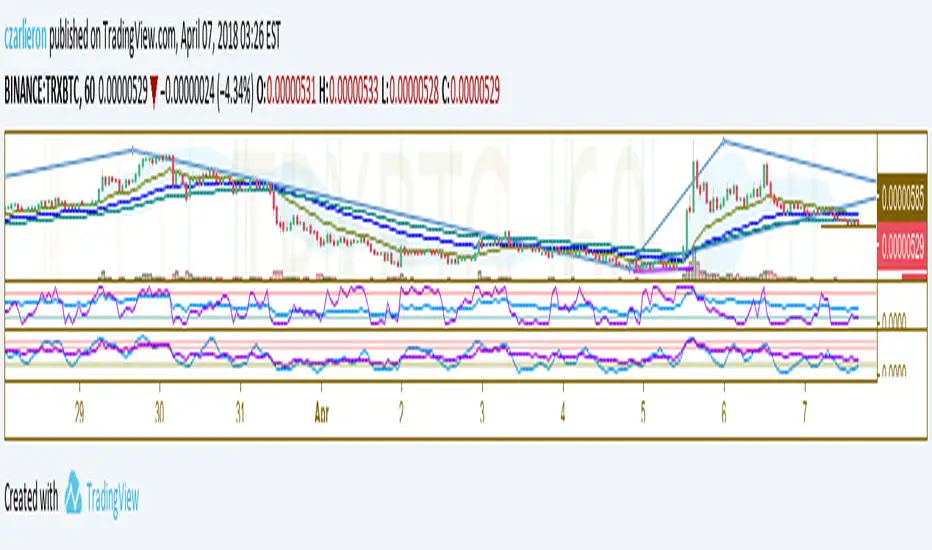
Relative Strength Index + MFI breachI allowed myself to take a piece of code of one of the indicators MFI present on Tradingview for the added to a RSI!
I made this srcipt to avoid cluttering the screen, so we can see the oversold / overbought of the MFI without having any additional indicator

Relative Strength Index with SMADetect reverse point, buy when SMA is comming up and RSI cross up SMA

Relative Strength Index (Color mod)Changed opacity of center band and added green to plot line above 70 and red to plot line below 30.


Relative Strength & sma delta2 RSI with different length at your choise, with 2 sma signal. 4 Plots show the difference between the 2 RSI and 2 Signals , the difference of the 2 RSI and the difference of the Delta of the 2 RSI. So you can have a close view toghether with a bird s eye view. The black line is the middle way.


Relative Strength Index x2Two RSI better then one. Also histogram shows difference of fast and slow RSI.

Enhanced Trading Indicators - RSI PanelYou want to know how to publish your provided Pine Script code in TradingView and what the script does.
What the Script Does
This is a comprehensive RSI (Relative Strength Index) indicator designed specifically for day trading. It goes beyond a simple RSI line by providing visual context, dynamic coloring, real-time status, and customizable alerts.
Key Features:
Enhanced Visualization:
Plots the RSI line in a dedicated panel.
Dynamic Coloring: The RSI line changes color based on its state (e.g., red for extreme overbought, lime for extreme oversold, blue for bullish, orange for bearish).
Plots Overbought (e.g., 65) and Oversold (e.g., 35) reference lines, Extreme levels, and the Midline (50).
Uses background coloring and fill to highlight Overbought/Oversold zones.
Real-Time Info Table:
Displays a table in the corner of the chart (top-right by default) showing the current RSI Value, its Status (e.g., EXTREME OB, OVERSOLD, BULLISH), Momentum Direction (rising/falling), and a Trading Bias (e.g., BUY ZONE, WATCH SELL).
Divergence Detection:
Includes an optional feature to detect simple bullish and bearish divergences (when price and RSI move in opposite directions) and plots them as signals.
Customizable Inputs:
Allows users to adjust the RSI Length, Overbought/Oversold levels, and Extreme Alert levels.
Alerts Integration:
Contains code to fire Pine Script alerts on extreme level crossovers and divergence signals, which users can then configure in TradingView's alert system.

RSI + MFI Momentum Mapper - CoffeeKillerRSI + MFI Momentum Mapper - CoffeeKiller Indicator Guide
Welcome traders! This guide will walk you through the RSI + MFI Momentum Mapper indicator, an innovative market analysis tool developed by CoffeeKiller that combines two powerful oscillators to create a comprehensive momentum visualization system.
🔔 **Warning: This Is Not a Standard RSI or MFI Indicator** 🔔 This indicator combines and normalizes RSI and MFI data to create a unified momentum representation with boundary detection and peak signaling features.
Core Concept: Combined Momentum Analysis
The foundation of this indicator lies in merging the strengths of two complementary oscillators - Relative Strength Index (RSI) and Money Flow Index (MFI) - to provide a more robust momentum signal that accounts for both price action and volume.
Directional Columns: Momentum Strength
- Positive Green Columns: Bullish momentum
- Negative Red Columns: Bearish momentum
- Color intensity varies based on momentum strength
- Special coloring for new high/low boundaries
Marker Lines: Dynamic Support/Resistance
- High Marker Line (Magenta): Tracks the highest point reached during a bullish phase
- Low Marker Line (Cyan): Tracks the lowest point reached during a bearish phase
- Creates visual boundaries showing momentum extremes
Peak Detection System:
- Triangular markers identify significant local maxima and minima
- Background highlighting shows important momentum peaks
- Helps identify potential reversal points and momentum exhaustion
Reference Lines:
- Zero Line (Gray): Divides bullish from bearish momentum
- High Line (+1): Upper threshold for extremely bullish conditions
- Low Line (-1): Lower threshold for extremely bearish conditions
Core Components
1. Oscillator Normalization
- RSI and MFI values centered around zero
- Values scaled to create consistent visualization
- Normalized range typically between -1 and +1
- Combination of indicators for signal reliability
2. Boundary Tracking System
- Automatic detection of highest values in bullish phases
- Automatic detection of lowest values in bearish phases
- Step-line visualization of boundaries
- Color-coded for easy identification
3. Peak Detection System
- Identification of local maxima and minima
- Background highlighting of significant peaks
- Triangle markers for peak visualization
- Zero-line cross detection for trend changes
4. Signal Smoothing
- Signal line calculation via SMA
- Helps filter noise and identify trends
- Provides confirmation of momentum direction
Main Features
Oscillator Settings
- Customizable RSI length for sensitivity control
- Customizable MFI length for sensitivity control
- Normalized display for consistent visualization
- Signal smoothing for clearer readings
Visual Elements
- Color-coded columns showing momentum direction and strength
- Dynamic marker lines for momentum boundaries
- Peak triangles for significant turning points
- Background highlighting for peak identification
- Reference lines for momentum threshold levels
Signal Generation
- Zero-line crosses for trend change signals
- Boundary breaks for momentum strength
- Peak formation for potential reversals
- Color changes for momentum direction and acceleration
Customization Options
- RSI and MFI length parameters
- Marker line visibility and colors
- Peak marker color selection
- Peak background display options
Trading Applications
1. Trend Identification
- Directional line crossing above zero: bullish trend beginning
- Directional line crossing below zero: bearish trend beginning
- Column color: indicates momentum direction
- Column height: indicates momentum strength
2. Reversal Detection
- Peak triangles after extended trend: potential exhaustion
- Background highlighting: significant reversal points
- Directional line approaching marker lines: potential trend change
- Color shifts from bright to muted: decreasing momentum
3. Momentum Analysis
- Breaking above previous high boundary: accelerating bullish momentum
- Breaking below previous low boundary: accelerating bearish momentum
- Special coloring (magenta/cyan): boundary breaks indicating strength
- Approaching +1/-1 lines: extreme momentum conditions
4. Market Structure Assessment
- Consecutive higher peaks: strengthening bullish structure
- Consecutive lower troughs: strengthening bearish structure
- Peak comparisons: relative strength of momentum phases
- Boundary line steps: market structure levels
Optimization Guide
1. Oscillator Settings
- RSI Length: Default 14 provides balanced signals
- Lower values (7-10): More responsive, potentially noisier
- Higher values (20-30): Smoother, fewer false signals
- MFI Length: Default 14 provides balanced signals
- Lower values: More responsive to volume changes
- Higher values: Less sensitive to short-term volume spikes
2. Visual Customization
- Marker Line Colors: Adjust for visibility on your chart
- Peak Marker Color: Default yellow provides good contrast
- Enable/disable background highlights based on preference
- Consider chart background when selecting colors
3. Signal Interpretation
- Stronger signals: When directional line approaches +1/-1
- Confirmation: When peaks form after extended momentum
- Early warnings: When color intensity changes before direction
- Trend strength: Distance between zero line and current reading
4. Reference Line Usage
- Zero line: Primary trend divider
- +1/-1 lines: Extreme momentum thresholds
- Marker lines: Dynamic support/resistance levels
- Distance from reference: Momentum strength measure
Best Practices
1. Signal Confirmation
- Wait for zero-line crosses to confirm trend changes
- Look for peak formations to identify potential reversals
- Check for boundary breaks to confirm strong momentum
- Use with price action for entry/exit precision
2. Timeframe Selection
- Lower timeframes: more signals, potential noise
- Higher timeframes: cleaner signals, less frequent
- Multiple timeframes: confirm signals across time horizons
- Match to your trading style and holding period
3. Market Context
- Strong bullish phase: positive columns breaking above marker line
- Strong bearish phase: negative columns breaking below marker line
- Columns approaching zero: potential trend change
- Columns approaching +1/-1: extreme conditions, potential reversal
4. Combining with Other Indicators
- Use with trend indicators for confirmation
- Pair with other oscillators for divergence detection
- Combine with volume analysis for validation
- Consider support/resistance levels with boundary lines
Advanced Trading Strategies
1. Boundary Break Strategy
- Enter long when directional line breaks above previous high marker line
- Enter short when directional line breaks below previous low marker line
- Use zero-line as initial stop-loss reference
- Take profits at formation of opposing peaks
2. Peak Trading Strategy
- Identify significant peaks with triangular markers
- Look for consecutive lower peaks in bullish phases for shorting opportunities
- Look for consecutive higher troughs in bearish phases for buying opportunities
- Use zero-line crosses as confirmation
3. Extreme Reading Strategy
- Look for directional line approaching +1/-1 lines
- Watch for color changes and peak formations
- Enter counter-trend positions after confirmed peaks
- Use tight stops due to extreme momentum conditions
4. Column Color Strategy
- Enter long when columns turn bright green (increasing momentum)
- Enter short when columns turn bright red (increasing momentum)
- Exit when color intensity fades (decreasing momentum)
- Use marker lines as dynamic support/resistance
Practical Analysis Examples
Bullish Market Scenario
- Directional line crosses above zero line
- Green columns grow in height and intensity
- High marker line forms steps upward
- Peak triangles appear at local maxima
- Background highlights appear at significant momentum peaks
Bearish Market Scenario
- Directional line crosses below zero line
- Red columns grow in depth and intensity
- Low marker line forms steps downward
- Peak triangles appear at local minima
- Background highlights appear at significant momentum troughs
Consolidation Scenario
- Directional line oscillates around zero line
- Column colors alternate frequently
- Marker lines remain relatively flat
- Few or no new peak highlights appear
- Directional values remain small
Understanding Market Dynamics Through RSI + MFI Momentum Mapper
At its core, this indicator provides a unique lens to visualize market momentum by combining two complementary oscillators:
1. Combined Strength: By averaging RSI (price-based) and MFI (volume-based), the indicator provides a more comprehensive view of market momentum that considers both price action and buying/selling pressure.
2. Normalized Scale: The indicator normalizes values around zero, making it easier to identify bullish vs bearish conditions and the relative strength of momentum in either direction.
3. Dynamic Boundaries: The marker lines create a visual representation of the "high water marks" of momentum in both directions, helping to identify when markets are making new momentum extremes.
4. Exhaustion Signals: The peak detection system highlights moments where momentum has reached a local maximum or minimum, often precursors to reversals or consolidations.
Remember:
- Combine signals from directional line, marker lines, and peak formations
- Use appropriate timeframe settings for your trading style
- Customize the indicator to match your visual preferences
- Consider market conditions and correlate with price action
This indicator works best when:
- Used as part of a comprehensive trading system
- Combined with proper risk management
- Applied with an understanding of current market conditions
- Signals are confirmed by price action and other indicators
DISCLAIMER: This indicator and its signals are intended solely for educational and informational purposes. They do not constitute financial advice. Trading involves significant risk of loss. Always conduct your own analysis and consult with financial professionals before making trading decisions.

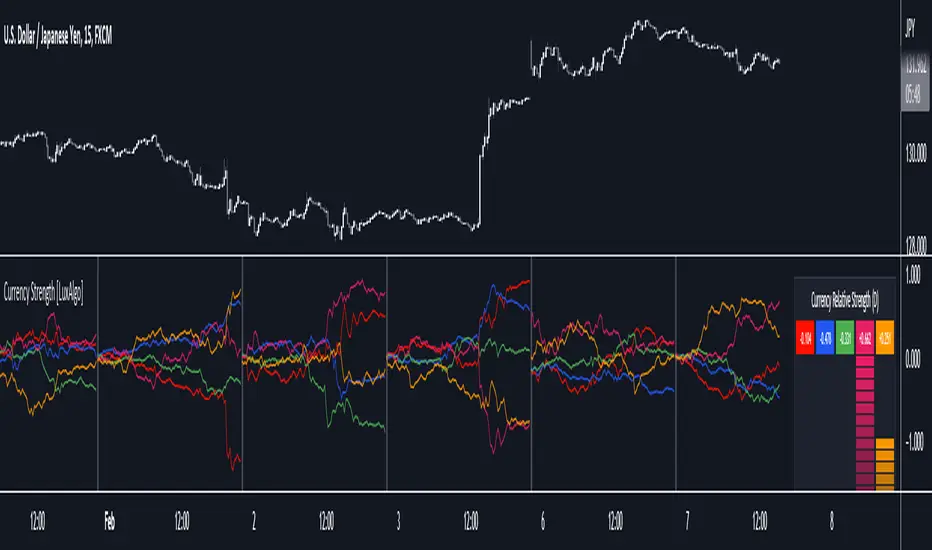
Currency Strength [LuxAlgo]The Currency Strength indicator displays the historical relative strength of 5 user selected currencies over a user selected period of time. Users can also display relative strength of currencies as a scatter plot, further informing on the evolution of currency strength.
🔶 SETTINGS
Display: Determines the type of data displayed by the indicator. By default, the trailing relative strength of currencies is displayed, with the other option displaying the scatter plot.
Timeframe: Timeframe period used to calculate currency relative strength.
🔹 Meter
Show Strength Meter: Displays the currency strength meter on the indicator panel.
Strength Meter Resolution: Resolution of the currency strength meter, higher resolutions allow to observe smaller difference in strength.
Location: Location of the currency strength meter on the indicator pane.
Size: Size of the currency strength meter.
🔹 Relative Strength Scatter Graph
Scatter Graph Resolution: Horizontal and vertical width of the scatter plot (in bars). Higher values allow a more precise position on the X axis.
🔶 USAGE
Measuring the relative strength of a currency allows users to assess the relative performance of a currency against a basket of other currencies.
The term "strength" can convey various interpretations depending on the indicator. Here "strength" is interpreted as an indicator of performance, with stronger currencies having greater performances over the selected period (positive changes of higher magnitude).
The Currency Strength indicator allows users to analyze the relative strength of currencies over a user selected period - the returned results will reset periodically and will accumulate afterward.
The above chart shows the hourly relative strength of various currencies on the 1min TF.
🔹 Scatter Graph
The scatter graph displays the relative strength of a currency over its value during the previous period. This not only allows users to see if a currency is strong... but also if it's getting stronger compared to the previous period.
In order to quickly interpret results, the graph is divided into four areas. A currency (displayed as a point) being in a specific area returns the following information:
Strong(Green): Currency has a positive relative strength (bullish) and is greater than its value over the previous period.
Improving (Yellow): Currency has a negative relative strength (bearish) and is greater than its value over the previous period.
Weakening (Aqua): Currency has a positive relative strength (bullish) and is lower than its value over the previous period.
Weak (Red): Currency has a negative relative strength (bearish) and is lower than its value over the previous period.
🔶 DETAILS
There is a wide variety of methods for the calculation of a currency's relative strength. The primary focus of the indicator is on the meter as well as the relative strength scatter graph. The currency strength calculation can be considered more basic.
Given two currencies, B (base) and Q (quote), the proposed indicator calculation process is as follows:
Exchange rate BQ(t) over time t is obtained, a rising value of BQ(t) means that a unit of B is now worth a higher amount of Q , highlighting strength of B over Q on that precise variation.
The individual relative strength over time IRS(t) is obtained as the percentage relatively close to the open difference of BQ(t) , that is:
IRS(t) = / open(t) * 100
Normalizing the close to open difference allows for the various currencies' relative strengths to approximately share the same scale.
The above operation is performed n times over a space of n currencies O( n ) . The obtained individual relative strengths for one specific currency are then added together, forming the final composite relative strength ( CRS ) of that currency:
CRS (t) = IRS (t) + IRS (t) + ... + IRS (t)
The cumulative sum of CRS(t) over the user selected period is then obtained.
Fuzzy SMA Trend Analyzer (experimental)[FibonacciFlux]Fuzzy SMA Trend Analyzer (Normalized): Advanced Market Trend Detection Using Fuzzy Logic Theory
Elevate your technical analysis with institutional-grade fuzzy logic implementation
Research Genesis & Conceptual Framework
This indicator represents the culmination of extensive research into applying fuzzy logic theory to financial markets. While traditional technical indicators often produce binary outcomes, market conditions exist on a continuous spectrum. The Fuzzy SMA Trend Analyzer addresses this limitation by implementing a sophisticated fuzzy logic system that captures the nuanced, multi-dimensional nature of market trends.
Core Fuzzy Logic Principles
At the heart of this indicator lies fuzzy logic theory - a mathematical framework designed to handle imprecision and uncertainty:
// Improved fuzzy_triangle function with guard clauses for NA and invalid parameters.
fuzzy_triangle(val, left, center, right) =>
if na(val) or na(left) or na(center) or na(right) or left > center or center > right // Guard checks
0.0
else if left == center and center == right // Crisp set (single point)
val == center ? 1.0 : 0.0
else if left == center // Left-shoulder shape (ramp down from 1 at center to 0 at right)
val >= right ? 0.0 : val <= center ? 1.0 : (right - val) / (right - center)
else if center == right // Right-shoulder shape (ramp up from 0 at left to 1 at center)
val <= left ? 0.0 : val >= center ? 1.0 : (val - left) / (center - left)
else // Standard triangle
math.max(0.0, math.min((val - left) / (center - left), (right - val) / (right - center)))
This implementation of triangular membership functions enables the indicator to transform crisp numerical values into degrees of membership in linguistic variables like "Large Positive" or "Small Negative," creating a more nuanced representation of market conditions.
Dynamic Percentile Normalization
A critical innovation in this indicator is the implementation of percentile-based normalization for SMA deviation:
// ----- Deviation Scale Estimation using Percentile -----
// Calculate the percentile rank of the *absolute* deviation over the lookback period.
// This gives an estimate of the 'typical maximum' deviation magnitude recently.
diff_abs_percentile = ta.percentile_linear_interpolation(math.abs(raw_diff), normLookback, percRank) + 1e-10
// ----- Normalize the Raw Deviation -----
// Divide the raw deviation by the estimated 'typical max' magnitude.
normalized_diff = raw_diff / diff_abs_percentile
// ----- Clamp the Normalized Deviation -----
normalized_diff_clamped = math.max(-3.0, math.min(3.0, normalized_diff))
This percentile normalization approach creates a self-adapting system that automatically calibrates to different assets and market regimes. Rather than using fixed thresholds, the indicator dynamically adjusts based on recent volatility patterns, significantly enhancing signal quality across diverse market environments.
Multi-Factor Fuzzy Rule System
The indicator implements a comprehensive fuzzy rule system that evaluates multiple technical factors:
SMA Deviation (Normalized): Measures price displacement from the Simple Moving Average
Rate of Change (ROC): Captures price momentum over a specified period
Relative Strength Index (RSI): Assesses overbought/oversold conditions
These factors are processed through a sophisticated fuzzy inference system with linguistic variables:
// ----- 3.1 Fuzzy Sets for Normalized Deviation -----
diffN_LP := fuzzy_triangle(normalized_diff_clamped, 0.7, 1.5, 3.0) // Large Positive (around/above percentile)
diffN_SP := fuzzy_triangle(normalized_diff_clamped, 0.1, 0.5, 0.9) // Small Positive
diffN_NZ := fuzzy_triangle(normalized_diff_clamped, -0.2, 0.0, 0.2) // Near Zero
diffN_SN := fuzzy_triangle(normalized_diff_clamped, -0.9, -0.5, -0.1) // Small Negative
diffN_LN := fuzzy_triangle(normalized_diff_clamped, -3.0, -1.5, -0.7) // Large Negative (around/below percentile)
// ----- 3.2 Fuzzy Sets for ROC -----
roc_HN := fuzzy_triangle(roc_val, -8.0, -5.0, -2.0)
roc_WN := fuzzy_triangle(roc_val, -3.0, -1.0, -0.1)
roc_NZ := fuzzy_triangle(roc_val, -0.3, 0.0, 0.3)
roc_WP := fuzzy_triangle(roc_val, 0.1, 1.0, 3.0)
roc_HP := fuzzy_triangle(roc_val, 2.0, 5.0, 8.0)
// ----- 3.3 Fuzzy Sets for RSI -----
rsi_L := fuzzy_triangle(rsi_val, 0.0, 25.0, 40.0)
rsi_M := fuzzy_triangle(rsi_val, 35.0, 50.0, 65.0)
rsi_H := fuzzy_triangle(rsi_val, 60.0, 75.0, 100.0)
Advanced Fuzzy Inference Rules
The indicator employs a comprehensive set of fuzzy rules that encode expert knowledge about market behavior:
// --- Fuzzy Rules using Normalized Deviation (diffN_*) ---
cond1 = math.min(diffN_LP, roc_HP, math.max(rsi_M, rsi_H)) // Strong Bullish: Large pos dev, strong pos roc, rsi ok
strength_SB := math.max(strength_SB, cond1)
cond2 = math.min(diffN_SP, roc_WP, rsi_M) // Weak Bullish: Small pos dev, weak pos roc, rsi mid
strength_WB := math.max(strength_WB, cond2)
cond3 = math.min(diffN_SP, roc_NZ, rsi_H) // Weakening Bullish: Small pos dev, flat roc, rsi high
strength_N := math.max(strength_N, cond3 * 0.6) // More neutral
strength_WB := math.max(strength_WB, cond3 * 0.2) // Less weak bullish
This rule system evaluates multiple conditions simultaneously, weighting them by their degree of membership to produce a comprehensive trend assessment. The rules are designed to identify various market conditions including strong trends, weakening trends, potential reversals, and neutral consolidations.
Defuzzification Process
The final step transforms the fuzzy result back into a crisp numerical value representing the overall trend strength:
// --- Step 6: Defuzzification ---
denominator = strength_SB + strength_WB + strength_N + strength_WBe + strength_SBe
if denominator > 1e-10 // Use small epsilon instead of != 0.0 for float comparison
fuzzyTrendScore := (strength_SB * STRONG_BULL +
strength_WB * WEAK_BULL +
strength_N * NEUTRAL +
strength_WBe * WEAK_BEAR +
strength_SBe * STRONG_BEAR) / denominator
The resulting FuzzyTrendScore ranges from -1 (strong bearish) to +1 (strong bullish), providing a smooth, continuous evaluation of market conditions that avoids the abrupt signal changes common in traditional indicators.
Advanced Visualization with Rainbow Gradient
The indicator incorporates sophisticated visualization using a rainbow gradient coloring system:
// Normalize score to for gradient function
normalizedScore = na(fuzzyTrendScore) ? 0.5 : math.max(0.0, math.min(1.0, (fuzzyTrendScore + 1) / 2))
// Get the color based on gradient setting and normalized score
final_color = get_gradient(normalizedScore, gradient_type)
This color-coding system provides intuitive visual feedback, with color intensity reflecting trend strength and direction. The gradient can be customized between Red-to-Green or Red-to-Blue configurations based on user preference.
Practical Applications
The Fuzzy SMA Trend Analyzer excels in several key applications:
Trend Identification: Precisely identifies market trend direction and strength with nuanced gradation
Market Regime Detection: Distinguishes between trending markets and consolidation phases
Divergence Analysis: Highlights potential reversals when price action and fuzzy trend score diverge
Filter for Trading Systems: Provides high-quality trend filtering for other trading strategies
Risk Management: Offers early warning of potential trend weakening or reversal
Parameter Customization
The indicator offers extensive customization options:
SMA Length: Adjusts the baseline moving average period
ROC Length: Controls momentum sensitivity
RSI Length: Configures overbought/oversold sensitivity
Normalization Lookback: Determines the adaptive calculation window for percentile normalization
Percentile Rank: Sets the statistical threshold for deviation normalization
Gradient Type: Selects the preferred color scheme for visualization
These parameters enable fine-tuning to specific market conditions, trading styles, and timeframes.
Acknowledgments
The rainbow gradient visualization component draws inspiration from LuxAlgo's "Rainbow Adaptive RSI" (used under CC BY-NC-SA 4.0 license). This implementation of fuzzy logic in technical analysis builds upon Fermi estimation principles to overcome the inherent limitations of crisp binary indicators.
This indicator is shared under Attribution-NonCommercial-ShareAlike 4.0 International (CC BY-NC-SA 4.0) license.
Remember that past performance does not guarantee future results. Always conduct thorough testing before implementing any technical indicator in live trading.
