CAPACE MARKETThis custom indicator combines the Moving Average Convergence Divergence (MACD) and the Relative Strength Index (RSI) into a single trading tool. It calculates the MACD and RSI values, then averages these two indicators to create a composite line. This average line is intended to capture the momentum and relative strength of the market simultaneously, potentially offering a more nuanced view of market conditions.
Key features of the indicator include:
Visualization of MACD and RSI Lines: It plots the MACD and RSI values as separate lines on the chart, allowing traders to see the behavior of each indicator clearly.
Average Line: A line representing the average of the MACD and RSI indicators is plotted, providing a synthesized view of both momentum and strength.
Entry Points Indication: The indicator uses red dots to mark the points where the average line crosses over or under the MACD or RSI lines. These intersections are meant to signal potential entry points for traders.
Market Condition Highlighting: The background color changes based on whether the average line is above or below zero. A green background suggests a positive market condition (bullish), while a red background indicates a negative market condition (bearish).
This tool aims to offer traders an integrated perspective by combining the insights of both MACD and RSI, potentially aiding in the identification of entry and exit points as well as the overall market sentiment.
Search in scripts for "relative strength"

[The_lurker] RSI-MFI-WPR Indicatoris an advanced trading indicator developed for the TradingView platform, which synergistically refers to the insights of three popular technical analysis tools: the Relative Strength Index (RSI), the Money Flow Index (MFI) and the Williams Indicator. Percentage range (WPR). This indicator is precisely designed to help traders identify potential buy and sell opportunities by accurately interpreting market momentum, volume, and price position relative to recent highs and lows.
The primary goal of the RSI-MFI-WPR Indicator is to provide a comprehensive tool that leverages the combined power of RSI, MFI and WPR to detect overbought and oversold conditions, indicating potential market reversal points. This multi-faceted approach aims to provide traders with a more robust framework for making informed decisions, and enhance their trading strategy through multi-indicator analysis.
Explanation of the indicator conditions
The essence of this indicator lies in its strategic conditions that indicate possible entry and exit points:
Oversold Condition (Condition): This is determined when the RSI and MFI are below 30, and the WPR drops below -91, indicating a strong oversold condition in the market. Such a scenario usually indicates a buying opportunity, assuming that the market may rebound from this oversold state.
Divergence Condition (Condition 1): Checks if the MFI exceeds 2.1 times the RSI. This unique case aims to highlight instances where there is a significant inflow of funds into an asset, which is not proportionately reflected in its RSI, which may indicate an upcoming price increase or highlight an unusual market situation for further From the analysis.
Overbought Warning (conditionExit): An exit signal is triggered when both the MFI and RSI exceed 85, and the WPR is above -15. This combination indicates an overbought condition in the market, indicating that the asset may be overvalued and that a price correction or reversal may be imminent, thus indicating a potential selling opportunity or a warning of initiating new positions.
Application and visualization
The RSI-MFI-WPR Indicator not only provides numerical insights but also displays these conditions on a TradingView chart. Through the use of color coding and plotting, it provides traders with an intuitive way to distinguish market conditions, enabling quick and effective decision-making. Incorporating alert conditions ensures that traders are immediately notified of important market events, in line with their strategic trading objectives.
Planning and alerts in “RSI-MFI-WPR Indicator”
Collected alert status
CombinedAlertCondition is a logical statement that combines all individual conditions (Condition, Condition1, Condition Exit, and The_lurkerMFI_oversold) into a single alert trigger. This condition becomes true and triggers an alert if any of the conditions specified for potential trading opportunities or warnings are met. It is designed to provide a comprehensive alert system that informs the trader of any important signal identified by the indicator, including entry and exit signals as well as oversold conditions.
Visual indicators
Background color for oversold condition: The script sets the background color to a specific shade of blue ( with 90% transparency) when the custom MFI indicates an oversold condition (The_lurkerMFI_oversold). This visual signal helps traders quickly recognize periods when the market may be undervalued and potentially poised for a rebound.
Drawing warning and exit signs:
Entry Signals: For Condition and Condition 1, which identify potential entry points, the indicator draws upward pointing triangles below the price bars. These triangles are colored in specific shades to differentiate signals from a fundamental oversold condition and a divergence condition, making it intuitive for traders to recognize the type of signal.
Exit Signals: For an exit condition, which indicates overbought conditions that may indicate an impending price correction, red downward-pointing triangles are drawn above the price bars. This serves as a clear visual warning to consider exiting positions or proceed with caution.
Configure the alarm
The script uses the conditional alert function to create an alert based on the AlertCondition combination. When this condition is met, any of the predefined signals are indicated
Conclusion
In short, the “RSI-MFI-WPR Indicator” stands out as a versatile and dynamic indicator that enriches a trader's toolkit by combining the analytical strengths of RSI, MFI and WPR. By setting clear conditions for entry and exit points from the market, it facilitates a proactive approach to trading, based on a detailed examination of market dynamics. This indicator demonstrates how mixing multiple technical tools can lead to more informed and accurate market analysis, with the aim of elevating the trading experience on Tradingview.
==================================================================================
هو مؤشر تداول متقدم تم تطويره لمنصة TradingView،
والذي يشير بشكل تآزري إلى رؤى ثلاث أدوات تحليل فني شائعة:
1- مؤشر القوة النسبية (RSI)،
2- مؤشر تدفق الأموال (MFI)،
3- مؤشر ويليامز. نطاق النسبة المئوية (WPR).
تم تصميم هذا المؤشر بدقة لمساعدة المتداولين على تحديد فرص الشراء والبيع المحتملة من خلال التفسير الدقيق لزخم السوق وحجمه وموقع السعر بالنسبة إلى الارتفاعات والانخفاضات الأخيرة.
الهدف الأساسي لمؤشر RSI-MFI-WPR هو توفير أداة شاملة تستفيد من القوة المشتركة لمؤشر RSI وMFI وWPR للكشف عن ظروف ذروة الشراء والمبالغة في البيع، مما يشير إلى نقاط انعكاس السوق المحتملة. ويهدف هذا النهج متعدد الأوجه إلى تزويد المتداولين بإطار أكثر قوة لاتخاذ قرارات مستنيرة، وتعزيز استراتيجية التداول الخاصة بهم من خلال تحليل متعدد المؤشرات.
شرح شروط المؤشر
يكمن جوهر هذا المؤشر في ظروفه الإستراتيجية التي تشير إلى نقاط الدخول والخروج المحتملة:
حالة ذروة البيع (الحالة): يتم تحديد ذلك عندما يكون مؤشر القوة النسبية RSI وMFI أقل من 30، وينخفض WPR إلى أقل من -92، مما يشير إلى حالة ذروة بيع قوية في السوق. يشير مثل هذا السيناريو عادةً إلى فرصة شراء، على افتراض أن السوق قد ينتعش من حالة ذروة البيع هذه.
شرط الاختلاف (الشرط 1): يتحقق مما إذا كانت السيولة تتجاوز 2.1 مرة مؤشر القوة النسبية. تهدف هذه الحالة الفريدة إلى تسليط الضوء على الحالات التي يوجد فيها تدفق كبير للأموال إلى أحد الأصول، وهو ما لا ينعكس بشكل متناسب في مؤشر القوة النسبية الخاص به، مما قد يشير إلى زيادة قادمة في الأسعار أو يسلط الضوء على وضع غير عادي في السوق لمزيد من التحليل.
تحذير ذروة الشراء (conditionExit): يتم إطلاق إشارة خروج عندما يتجاوز مؤشر MFI ومؤشر القوة النسبية 85، ويكون WPR أعلى من -15. يشير هذا المزيج إلى حالة ذروة الشراء في السوق، مما يشير إلى أن الأصل قد يكون مبالغًا في قيمته وأن تصحيح السعر أو انعكاسه قد يكون وشيكًا، مما يشير إلى فرصة بيع محتملة أو تحذير ببدء مراكز جديدة.
التطبيق والتصور
لا يوفر مؤشر RSI-MFI-WPR رؤى رقمية فحسب، بل يعرض أيضًا هذه الشروط على مخطط TradingView. من خلال استخدام الترميز اللوني والتخطيط، فإنه يوفر للمتداولين طريقة بديهية للتمييز بين ظروف السوق، مما يتيح اتخاذ قرارات سريعة وفعالة. يضمن دمج شروط التنبيه إخطار المتداولين على الفور بأحداث السوق المهمة، بما يتماشى مع أهدافهم التجارية الإستراتيجية.
التخطيط والتنبيهات في مؤشر RSI-MFI-WPR
حالة التنبيه التي تم جمعها ( CombinedAlertCondition ) عبارة منطقية تجمع كل الشروط الفردية
Condition، Condition1، Condition Exit، وThe_lurkerMFI_oversold في مشغل تنبيه واحد.
ليصبح هذا الشرط صحيحًا ويطلق تنبيهًا في حالة استيفاء أي من الشروط المحددة لفرص التداول المحتملة أو التحذيرات. وهو مصمم لتوفير نظام تنبيه شامل يُعلم المتداول بأي إشارة مهمة يحددها المؤشر، بما في ذلك إشارات الدخول والخروج بالإضافة إلى ظروف ذروة البيع.
المؤشرات البصرية
لون الخلفية لحالة ذروة البيع: يقوم البرنامج النصي بتعيين لون الخلفية إلى ظل معين من اللون الأزرق (بشفافية 90٪) عندما تشير مؤسسة التمويل الأصغر المخصصة إلى حالة ذروة البيع (The_lurkerMFI_oversold). تساعد هذه الإشارة المرئية المتداولين على التعرف بسرعة على الفترات التي قد تكون فيها السوق مقومة بأقل من قيمتها الحقيقية ومن المحتمل أن تكون مستعدة للانتعاش.
رسم علامات التحذير والخروج:
إشارات الدخول: بالنسبة للحالة والحالة 1، التي تحدد نقاط الدخول المحتملة، يرسم المؤشر مثلثات تشير إلى الأعلى أسفل أشرطة السعر. يتم تلوين هذه المثلثات بظلال محددة لتمييز الإشارات عن حالة ذروة البيع الأساسية وحالة التباعد، مما يجعل من السهل على المتداولين التعرف على نوع الإشارة.
إشارات الخروج: بالنسبة لحالة الخروج، التي تشير إلى ظروف ذروة الشراء التي قد تشير إلى تصحيح وشيك للسعر، يتم رسم مثلثات حمراء تشير إلى الأسفل فوق أشرطة السعر. يعد هذا بمثابة تحذير مرئي واضح للنظر في الخروج من المواقف أو المضي قدمًا بحذر.
تكوين المنبه
يستخدم البرنامج النصي وظيفة التنبيه الشرطي لإنشاء تنبيه بناءً على مجموعة AlertCondition. عند استيفاء هذا الشرط، تتم الإشارة إلى أي من الإشارات المحددة مسبقًا
خاتمة
باختصار، يبرز "مؤشر RSI-MFI-WPR" كمؤشر متعدد الاستخدامات وديناميكي يثري مجموعة أدوات المتداول من خلال الجمع بين نقاط القوة التحليلية لـ RSI وMFI وWPR. ومن خلال وضع شروط واضحة لنقاط الدخول والخروج من السوق، فإنه يسهل اتباع نهج استباقي للتداول، بناءً على فحص تفصيلي لديناميكيات السوق. يوضح هذا المؤشر كيف أن الجمع بين أدوات فنية متعددة يمكن أن يؤدي إلى تحليل سوق أكثر استنارة ودقة، بهدف رفع مستوى تجربة التداول على Tradingview.
==================================================================================
باختصار :
1- ظهور المثلث الاصفر يعني تواجد سيولة كبيره ( مفيد جدا لعملات البومب ) .
2- ظهور المثلث الأبيض يعني وصول الى مستويات تشبع البيع وهي فرصة ممتازه للشراء ( منطقة دخول ).
3- ظهور خط افقي يعني قرب عكس الاتجاه الى أعلى ( منطقة دخول ) .
4- ظهور مثلث أحمر يعني قرب عكس الاتجاه الى أسفل ( منطقة خروج ) .
5- التنبيه يعمل على جميع ما ذكر أعلاه في تنبيه واحد حتى تسهل المراقبة .
6- أفضل فواصل الاستخدام ( 4 ساعات ، 12 ساعه ، يوم ) .

RSI MFI WPR Combo [The_lurker]The "RSI MFI WPR Combo" is a sophisticated trading indicator developed for the TradingView platform, which synergistically combines the insights of three renowned technical analysis tools: the Relative Strength Index (RSI), the Money Flow Index (MFI), and the Williams Percent Range (WPR). This indicator is meticulously designed to assist traders in identifying potential buying and selling opportunities through the nuanced interpretation of market momentum, volume, and price position relative to recent highs and lows.
Purpose
The primary objective of the "RSI MFI WPR Combo" indicator is to offer a comprehensive tool that leverages the combined power of RSI, MFI, and WPR to detect overbought and oversold conditions, signaling potential reversal points in the market. This multifaceted approach aims to provide traders with a more robust framework for making informed decisions, enhancing their trading strategy with a multi-indicator analysis.
Indicator Conditions Explained
The core of this indicator lies in its strategic conditions that signal potential entry and exit points:
Oversold Condition (condition): This is identified when the MFI and RSI are both below 30, and the WPR falls below -91, suggesting a strong oversold market state. Such a scenario typically indicates a buying opportunity, assuming the market might rebound from this excessively sold condition.
Divergence Condition (condition1): It checks if the MFI exceeds 1.93 times the RSI. This unique condition aims to spotlight instances where there's a significant influx of money into an asset, which is not proportionately reflected in its RSI, potentially signaling an upcoming price increase or highlighting an unusual market situation for further analysis.
Overbought Warning (conditionExit): The exit signal is triggered when both the MFI and RSI exceed 85, and the WPR is above -15. This combination is indicative of an overbought market condition, suggesting the asset might be overvalued and a price correction or reversal could be imminent, hence signaling a potential selling opportunity or a caution against initiating new positions.
Application and Visualization
The "RSI MFI WPR Combo" not only provides numerical insights but also visualizes these conditions on the TradingView chart. By employing color-coding and plotting shapes, it offers traders an intuitive way to discern market states, enabling quick and effective decision-making. The integration of alert conditions ensures that traders are promptly notified of significant market events, aligning with their strategic trading objectives.
Plotting and Alerts in "RSI MFI WPR Combo"
Combined Alert Condition
The combinedAlertCondition is a logical statement that consolidates all individual conditions (condition, condition1, conditionExit, and The_lurkerMFI_oversold) into a single alert trigger. This condition becomes true and triggers an alert if any of the specified conditions for potential trading opportunities or warnings are met. It's designed to provide a comprehensive alert system that notifies the trader of any significant signal identified by the indicator, encompassing both entry and exit signals as well as oversold conditions.
Visual Indicators
Background Color for Oversold Condition: The script sets the background color to a specific shade of blue (#13c2e9 with 90% transparency) when the custom MFI indicates an oversold condition (The_lurkerMFI_oversold). This visual cue helps traders quickly identify periods when the market might be undervalued and potentially poised for a rebound.
Plotting Warning and Exit Signals:
Entry Signals: For the condition and condition1, which identify potential entry points, the indicator plots upward-pointing triangles below the price bars. These triangles are colored in specific shades to differentiate between the signals from the basic oversold condition and the divergence condition, making it visually intuitive for traders to recognize the signal type.
Exit Signals: For the conditionExit, signaling overbought conditions that might suggest an imminent price correction, downward-pointing red triangles are plotted above the price bars. This acts as a clear visual warning to consider exiting positions or to proceed with caution.
Alert Configuration
The script utilizes the alertcondition function to create an alert based on the combinedAlertCondition. When this condition is met, indicating any of the predefined signa
Conclusion
In summary, the "RSI MFI WPR Combo" stands out as a versatile and dynamic indicator that enriches a trader's toolkit by combining the analytical strengths of RSI, MFI, and WPR. By delineating clear conditions for market entry and exit points, it facilitates a proactive approach to trading, grounded in a detailed examination of market dynamics. This indicator exemplifies how blending multiple technical tools can lead to a more informed and nuanced market analysis, aiming to elevate the trading experience on the TradingView platform

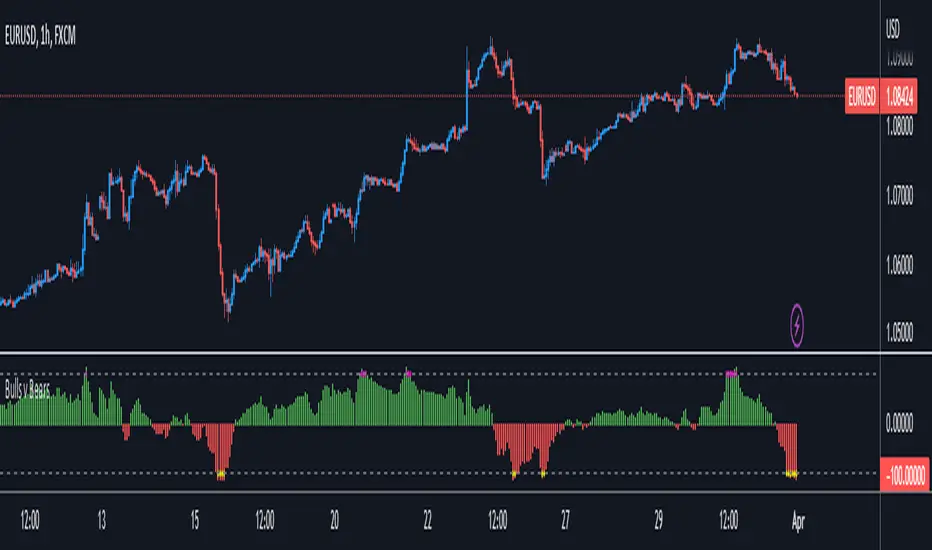
Bulls v BearsThis script helps you identify the relative strength of bulls and bears in the market. It calculates the difference between the high and the moving average for bulls, and the difference between the moving average and the low for bears. Then it normalizes the values between -100 and 100 using the highest and lowest values of the last "bars back" periods. This allows you to compare the current strength of bulls and bears relative to their historical strength.
The output of the script is a colored column chart that represents the difference between the normalized bulls and bears values. If the chart is mostly green, it means the bulls are currently stronger than the bears, and vice versa for a mostly red chart. Additionally, the script provides bullish and bearish signals based on when the normalized bulls cross above or below the user-defined "Line Height" value.
You can use this script to help you identify potential trend changes in the market, as well as to confirm existing trends.
Momentum Trend Fusion (MTF)The Momentum Trend Fusion (MTF) is a composite indicator that combines the Awesome Oscillator and the Relative Strength Index to provide a unique perspective on market momentum and trend strength. The MTF is calculated by first running the Relative Strength Index (RSI) on the Awesome Oscillator (AO) and then applying an Exponential Moving Average (EMA) on the RSI value. The MTF is designed to help traders detect market phases and confirm trend direction by analyzing the cross of the EMA and RSI, as well as divergences between the AO and price. The MTF can be customized by the user by providing the lengths of the RSI and EMA calculations, making it an ideal tool for traders with different time frames and risk tolerances.

Smooth Slow RSIThis is a smoothed rsi indicator. That means that the input for the rsi calculations is smoothed. This results in faster and smoother responses from the rsi! On top of that I have incorporated an advanced formula for rsi that will amplify weak signals. This means you can use longer times with accuracy. For instance if you are on the 3 minute and you want a 30 minute rsi you can just simply multiply your length by 10 and you will get real results. Normally if you do this you wont get the right output. I hope you find this release useful! Here's a recap on how rsi generally works incase this is your first time:
The relative strength index is a technical indicator used in the analysis of financial markets. It is intended to chart the current and historical strength or weakness of a stock or market based on the closing prices of a recent trading period. The indicator should not be confused with relative strength.

RSI (8 & 13) + Fibonacci LevelsIndicator Description: RSI (8 & 13) + Fibonacci Levels
This custom indicator is designed to provide a dual-speed RSI framework with embedded Fibonacci retracement levels for advanced momentum and reversal analysis. It combines the power of relative strength measurement with the natural harmony of Fibonacci ratios to give traders a structured approach to market timing and confluence trading.
The indicator plots two RSI lines on a dedicated sub-chart:
RSI Fast (8) → short-term momentum, highly sensitive to price action, helps identify quick shifts and micro-trends.
RSI Slow (13) → smoother and less volatile, acts as confirmation of broader trend direction and underlying strength.
By combining both RSI speeds, traders can spot alignment, divergences, and crossover signals between fast and slow momentum. When both lines move in sync, it reflects strong conviction; when they diverge, it signals potential exhaustion or trend shifts.
Overlaying Fibonacci retracement levels on RSI adds an extra dimension of precision. Instead of using arbitrary zones, the indicator relies on mathematically significant levels tied to natural market cycles:
23.6% → shallow pullbacks, early momentum pauses.
38.2% → minor retracements, often signaling trend continuation.
50% → balance point between strength and weakness.
61.8% → golden ratio, strong correction or reversal zone.
78.6% → deep retracement, last line before full reversal.
In addition, the script marks the classic RSI boundaries:
70 (Overbought) → potential profit-taking, stretched bullish conditions.
30 (Oversold) → potential accumulation, stretched bearish conditions.
Together, these zones help traders gauge not only when the RSI is “too high” or “too low,” but also where price momentum aligns with natural Fibonacci retracement zones. This approach transforms RSI from a simple oscillator into a multi-layered momentum map.
Practical Uses:
Trend Confirmation → When RSI(8) and RSI(13) are both above 50 and rising, bullish strength is confirmed.
Divergence Detection → If price makes higher highs but RSI(8) fails to confirm, it warns of weakening momentum.
Reversal Hunting → Look for RSI rejection candles at Fib levels (e.g., fast RSI hitting 61.8 and rolling over).
Entry/Exit Timing → Use fast RSI crossovers with slow RSI as tactical entries within the broader structure.
Confluence Trading → Strong signals occur when RSI rejection coincides with price structure (double tops/bottoms, Fibonacci levels on chart, Bollinger Band rejections).
This indicator is especially powerful when paired with Bollinger Bands or price action rejection patterns, creating a system where price extremes are validated against RSI Fib zones.
Ultimately, the RSI (8 & 13) + Fibonacci Levels indicator acts as a precision filter — helping traders separate noise from genuine turning points and reinforcing entries/exits with multiple layers of confluence.

Stock Scoring SystemThe EMA Scoring System is designed to help traders quickly assess market trend strength and decide portfolio allocation. It compares price vs. key EMAs (21, 50, 100) and also checks the relative strength between EMAs. Based on these conditions, it assigns a score (-6 to +6) and a corresponding allocation percentage.
+6 Score = 100% allocation (strong bullish trend)
-6 Score = 10% allocation (strong bearish trend)
Scores in between represent intermediate trend strength.
📌 Key Features
✅ Scoring Model: Evaluates price vs. EMA alignment and EMA cross relationships.
✅ Allocation % Display: Converts score into suggested portfolio allocation.
✅ Background Highlighting: Green shades for bullish conditions, red shades for bearish.
✅ Customizable Table Position: Choose between Top Right, Top Center, Bottom Right, or Bottom Center.
✅ Toggleable EMAs: Show/Hide 21 EMA, 50 EMA, and 100 EMA directly from indicator settings.
✅ Simple & Intuitive: One glance at the chart tells you trend strength and suggested allocation.
📈 How It Works
Score Calculation:
Price above an EMA = +1, below = -1
Faster EMA above slower EMA = +1, else -1
Maximum score = +6, minimum = -6
Allocation Mapping:
+6 → 100% allocation
+4 to +5 → 100% allocation
+2 to +3 → 75% allocation
0 to +1 → 50% allocation
-1 to -2 → 30% allocation
-3 to -4 → 20% allocation
-5 to -6 → 10% allocation
Visual Output:
Table shows SCORE + Allocation %
Background color shifts with score (green for bullish, red for bearish)
⚠️ Disclaimer
This indicator is for educational purposes only. It does not constitute financial advice. Always backtest and combine with your own analysis before making trading decisions.

Yelober_Momentum_BreadthMI# Yelober_Momentum_BreadthMI: Market Breadth Indicator Analysis
## Overview
The Yelober_Momentum_BreadthMI is a comprehensive market breadth indicator designed to monitor market internals across NYSE and NASDAQ exchanges. It tracks several key metrics including up/down volume ratios, TICK readings, and trend momentum to provide traders with real-time insights into market direction, strength, and potential turning points.
## Indicator Components
This indicator displays a table with data for:
- NYSE breadth metrics
- NASDAQ breadth metrics
- NYSE TICK data and trends
- NASDAQ TICK (TICKQ) data and trends
## Table Columns and Interpretation
### Column 1: Market
Identifies the data source:
- **NYSE**: New York Stock Exchange data
- **NASDAQ**: NASDAQ exchange data
- **Tick**: NYSE TICK index
- **TickQ**: NASDAQ TICK index
### Column 2: Ratio
Shows the current ratio values with different calculations depending on the row:
- **For NYSE/NASDAQ rows**: Displays the up/down volume ratio
- Positive values (green): More up volume than down volume
- Negative values (red): More down volume than up volume
- The magnitude indicates the strength of the imbalance
- **For Tick/TickQ rows**: Shows the ratio of positive to negative ticks plus the current TICK reading in parentheses
- Format: "Ratio (Current TICK value)"
- Positive values (green): More stocks ticking up than down
- Negative values (red): More stocks ticking down than up
### Column 3: Trend
Displays the directional trend with both a symbol and value:
- **For NYSE/NASDAQ rows**: Shows the VOLD (volume difference) slope
- "↗": Rising trend (positive slope)
- "↘": Falling trend (negative slope)
- "→": Neutral/flat trend (minimal slope)
- **For Tick/TickQ rows**: Shows the slope of the ratio history
- Color-coding: Green for positive momentum, Red for negative momentum, Gray for neutral
The trend column is particularly important as it shows the current momentum of the market. The indicator applies specific thresholds for color-coding:
- NYSE: Green when normalized value > 2, Red when < -2
- NASDAQ: Green when normalized value > 3.5, Red when < -3.5
- TICK/TICKQ: Green when slope > 0.01, Red when slope < -0.01
## How to Use This Indicator
### Basic Interpretation
1. **Market Direction**: When multiple rows show green ratios and upward trends, it suggests strong bullish market internals. Conversely, red ratios and downward trends indicate bearish internals.
2. **Market Breadth**: The magnitude of the ratios indicates how broad-based the market movement is. Higher absolute values suggest stronger market breadth.
3. **Momentum Shifts**: When trend arrows change direction or colors shift, it may signal a potential reversal or change in market momentum.
4. **Divergences**: Look for divergences between different markets (NYSE vs NASDAQ) or between ratios and trends, which can indicate potential market turning points.
### Advanced Usage
- **Volume Normalization**: The indicator includes options to normalize volume data (none, tens, thousands, millions, 10th millions) to handle different exchange scales.
- **Trend Averaging**: The slope calculation uses an averaging period (default: 5) to smooth out noise and identify more reliable trend signals.
## Examples for Interpretation
### Example 1: Strong Bullish Market
```
| Market | Ratio | Trend |
|--------|---------|-----------|
| NYSE | 1.75 | ↗ 2.85 |
| NASDAQ | 2.10 | ↗ 4.12 |
| Tick | 2.45 (485) | ↗ 0.05 |
| TickQ | 1.95 (320) | ↗ 0.03 |
```
**Interpretation**: All metrics are positive and trending upward (green), indicating a strong, broad-based rally. The high ratio values show significant bullish dominance. This suggests continuation of the upward move with good momentum.
### Example 2: Weakening Market
```
| Market | Ratio | Trend |
|--------|---------|-----------|
| NYSE | 0.45 | ↘ -1.50 |
| NASDAQ | 0.85 | → 0.30 |
| Tick | 0.95 (105) | ↘ -0.02 |
| TickQ | 1.20 (160) | → 0.00 |
```
**Interpretation**: The market is showing mixed signals with positive but low ratios, while NYSE and TICK trends are turning negative. NASDAQ shows neutral to slightly positive momentum. This divergence often occurs near market tops or during consolidation phases. Traders should be cautious and consider reducing position sizes.
### Example 3: Negative Market Turning Positive
```
| Market | Ratio | Trend |
|--------|---------|-----------|
| NYSE | -1.25 | ↗ 1.75 |
| NASDAQ | -0.95 | ↗ 2.80 |
| Tick | -1.35 (-250) | ↗ 0.04 |
| TickQ | -1.10 (-180) | ↗ 0.02 |
```
**Interpretation**: This is a potential bottoming pattern. Current ratios are still negative (red) showing overall negative breadth, but the trends are all positive (green arrows), indicating improving momentum. This divergence often occurs at market bottoms and could signal an upcoming reversal. Look for confirmation with price action before establishing long positions.
### Example 4: Mixed Market with Divergence
```
| Market | Ratio | Trend |
|--------|---------|-----------|
| NYSE | 1.45 | ↘ -2.25 |
| NASDAQ | -0.85 | ↘ -3.80 |
| Tick | 1.20 (230) | ↘ -0.03 |
| TickQ | -0.75 (-120) | ↘ -0.02 |
```
**Interpretation**: There's a significant divergence between NYSE (positive ratio) and NASDAQ (negative ratio), while all trends are negative. This suggests sector rotation or a market that's weakening but with certain segments still showing strength. Often seen during late-stage bull markets or in transitions between leadership groups. Consider reducing risk exposure and focusing on relative strength sectors.
## Practical Trading Applications
1. **Confirmation Tool**: Use this indicator to confirm price movements. Strong breadth readings in the direction of the price trend increase confidence in trade decisions.
2. **Early Warning System**: Watch for divergences between price and breadth metrics, which often precede market turns.
3. **Intraday Trading**: The real-time nature of TICK and volume data makes this indicator valuable for day traders to gauge intraday momentum shifts.
4. **Market Regime Identification**: Sustained readings can help identify whether the market is in a trend or chop regime, allowing for appropriate strategy selection.
This breadth indicator is most effective when used in conjunction with price action and other technical indicators rather than in isolation.

Toolbar-FrenToolbar-Fren is a comprehensive, data-rich toolbar designed to present a wide array of key metrics in a compact and intuitive format. The core philosophy of this indicator is to maximize the amount of relevant, actionable data available to the trader while occupying minimal chart space. It leverages a dynamic color-coded system to provide at-a-glance insights into market conditions, instantly highlighting positive/negative values, trend strength, and proximity to important technical levels.
Features and Data Displayed
The toolbar displays a vertical column of critical data points, primarily calculated on the Daily timeframe to give a broader market context. Each cell is color-coded for quick interpretation.
DAY:
The percentage change of the current price compared to the previous day's close. The cell is colored green for a positive change and red for a negative one.
LOD:
The current price's percentage distance from the Low of the Day.
HOD
The current price's percentage distance from the High of the Day.
MA Distances (9/21 or 10/20, 50, 200)
These cells show how far the current price is from key Daily moving averages (MAs).
The values are displayed either as a percentage distance or as a multiple of the Average Daily Range (ADR), which can be toggled in the settings.
The cells are colored green if the price is above the corresponding MA (bullish) and red if it is below (bearish).
ADR
Shows the 14-period Average Daily Range as a percentage of the current price. The cell background uses a smooth gradient from green (low volatility) to red (high volatility) to visualize the current daily range expansion.
ADR%/50: A unique metric showing the distance from the Daily 50 SMA, measured in multiples of the 14-period Average True Range (ATR). This helps quantify how extended the price is from its mean. The cell is color-coded from green (close to the mean) to red (highly extended).
RSI
The standard 14-period Relative Strength Index calculated on the Daily timeframe. The background color changes to indicate potentially overbought (orange/red) or oversold (green) conditions.
ADX
The 14-period Average Directional Index (ADX) from the Daily timeframe, which measures trend strength. The cell is colored to reflect the strength of the trend (e.g., green for a strong trend, red for a weak/non-trending market). An arrow (▲/▼) is also displayed to indicate if the ADX value is sloping up or down.
User Customization
The indicator offers several options for personalization to fit your trading style and visual preferences:
MA Type
Choose between using Exponential Moving Averages (EMA 9/21) or Simple Moving Averages (SMA 10/20) for the primary MA calculations.
MA Distance Display
Toggle the display of moving average distances between standard percentage values and multiples of the Average Daily Range (ADR).
Display Settings
Fully customize the on-chart appearance by selecting the table's position (e.g., Top Right, Bottom Left) and the text size. An option for a larger top margin is also available.
Colors
Personalize the core Green, Yellow, Orange, and Red colors used throughout the indicator to match your chart's theme.
Technical Parameters
Fine-tune the length settings for the ADX and DI calculations.

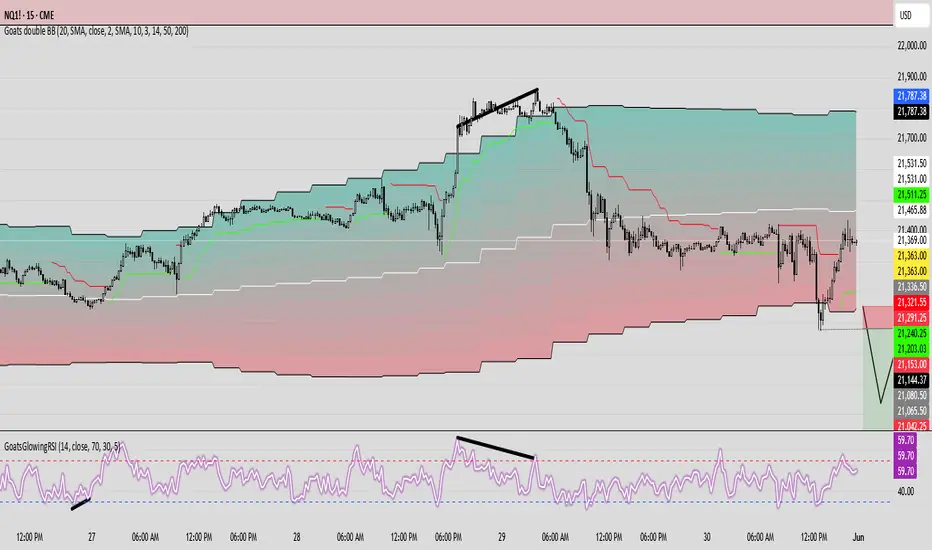
GoatsGlowingRSIGoatsGlowingRSI is a visually enhanced and feature-rich RSI (Relative Strength Index) indicator designed for deeper market insight and clearer signal visualization. It combines standard RSI analysis with gradient-colored backgrounds, glowing effects, and automated divergence detection to help traders spot potential reversals and momentum shifts more effectively.
Key Features:
✅ Multi-Timeframe RSI:
Calculate RSI from any timeframe using the custom input. Leave it blank to use the current chart's timeframe.
✅ Dynamic Gradient Background:
A smooth gradient fill is applied between RSI levels from the lower band (30) to the upper band (70). The gradient shifts from blue (oversold) to red (overbought), visually highlighting the RSI's position and strength.
✅ Glowing RSI Line:
A three-layered glow effect surrounds the main RSI line, creating a striking white core with a purple aura that enhances visibility against dark or light chart themes.
✅ Custom RSI Levels:
Dashed horizontal lines at RSI 70 (overbought), RSI 30 (oversold), and a dotted midline at 50 help you interpret trend momentum and strength.
✅ Automatic Divergence Detection:
Built-in logic identifies bullish and bearish divergences by comparing RSI and price pivot points:
🟢 Bullish Divergence: RSI makes a higher low while price makes a lower low.
🔴 Bearish Divergence: RSI makes a lower high while price makes a higher high.
Divergences are marked on the RSI line with colored lines and labels ("Bull"/"Bear").
✅ Alerts Ready:
Get notified in real-time with alert conditions for both bullish and bearish divergence setups.
Fibo Normalized RSI & RSI RibbonPlots both standard and Z-score normalized RSI ribbons using Fibonacci-based periods. Supports adjustable normalization, optional 0–100 scaling, and multi-line visualizations for momentum and deviation analysis.
This tool is designed for traders who want to go beyond standard RSI by adding:
Statistical normalization (Z-score)
Multi-period analysis (Fibonacci structure)
Advanced divergence and exhaustion detection
It gives you both classical momentum context and mathematically rigorous deviation insight, making it ideal for:
Swing traders
Quant-inclined discretionary traders
Multi-timeframe analysts
Trend Confirmation
When both RSI and normalized RSI across short and long periods are stacked in the same direction (e.g., above 50 or with high Z-scores), the trend is likely strong.
Disagreement between the two ribbons (e.g., RSI high but normalized RSI flat) may indicate late-stage trend or false strength.
Mean Reversion Trades
Look for normalized RSI values > +2 or < -2 (i.e., ~2 standard deviations).
Cross-check with standard RSI to see if the move aligns with a traditional overbought/oversold level.
Great for fade/reversal setups when Z-score RSI is extreme but classic RSI is just beginning to turn.
Divergence Detection
Compare the slope of RSI vs. normalized RSI over same period:
If RSI is rising but normalized RSI is falling → momentum is fading despite apparent strength.
Excellent for early warnings before reversals.
Multi-Timeframe Confluence
Use short-period ribbons (e.g., 3–13) for tactical entries/exits.
Use long-period ribbons (e.g., 55–233) for macro trend bias.
Alignment across both = high-confidence zone.

Adaptive Volume-Weighted RSI (AVW-RSI)Concept Summary
The AVW-RSI is a modified version of the Relative Strength Index (RSI), where each price change is weighted by the relative trading volume for that period. This means periods of high volume (typically driven by institutions or “big money”) have a greater influence on the RSI calculation than periods of low volume.
Why AVW-RSI Helps Traders
Avoids Weak Signals During Low Volume
Standard RSI may show overbought/oversold zones even during low-volume periods (e.g., during lunch hours or after news).
AVW-RSI gives less weight to these periods, avoiding misleading signals.
Amplifies Strong Momentum Moves
If RSI is rising during high volume, it's more likely driven by institutional buying—AVW-RSI reflects that stronger by weighting the RSI component.
Filters Out Retail Noise
By prioritizing high-volume candles, it naturally discounts fakeouts caused by thin markets or retail-heavy moves.
Highlights Institutional Entry/Exit
Useful for spotting hidden accumulation/distribution that classic RSI would miss.
How It Works (Calculation Logic)
Traditional RSI Formula Recap
RSI = 100 - (100 / (1 + RS))
RS = Average Gain / Average Loss (over N periods)
Modified Step – Apply Volume Weight
For each period
Gain_t = max(Close_t - Close_{t-1}, 0)
Loss_t = max(Close_{t-1} - Close_t, 0)
Weight_t = Volume_t / AvgVolume(N)
WeightedGain_t = Gain_t * Weight_t
WeightedLoss_t = Loss_t * Weight_t
Weighted RSI
AvgWeightedGain = SMA(WeightedGain, N)
AvgWeightedLoss = SMA(WeightedLoss, N)
RS = AvgWeightedGain / AvgWeightedLoss
AVW-RSI = 100 - (100 / (1 + RS))
Visual Features on Chart
Line Color Gradient
Color gets darker as volume weight increases, signaling stronger conviction.
Overbought/Oversold Zones
Traditional: 70/30
Suggested AVW-RSI zones: Use dynamic thresholds based on historical volatility (e.g., 80/20 for high-volume coins).
Volume Spike Flags
Mark RSI turning points that occurred during volume spikes with a special dot/symbol.
Trading Strategies with AVW-RSI
1. Weighted RSI Divergence
Regular RSI divergence becomes more powerful when volume is high.
AVW-RSI divergence with volume spike is a strong signal of reversal.
2. Trend Confirmation
RSI crossing above 50 during rising volume is a good entry signal.
RSI crossing below 50 with high volume is a strong exit or short trigger.
3. Breakout Validation
Price breaking resistance + AVW-RSI > 60 with volume = Confirmed breakout.
Price breaking but AVW-RSI < 50 or on low volume = Potential fakeout.
Example Use Case
Stock XYZ is approaching a resistance zone. A trader sees:
Standard RSI: 65 → suggests strength.
Volume is 3x the average.
AVW-RSI: 78 → signals strong momentum with institutional backing.
The trader enters confidently, knowing this isn't just low-volume hype.
Limitations / Tips
Works best on liquid assets (Forex majors, large-cap stocks, BTC/ETH).
Should be used alongside price action and volume analysis—not standalone.
Periods of extremely high volume (news events) might need smoothing to avoid spikes.

AlphaTrend++AlphaTrend++
Overview
The AlphaTrend++ is an advanced Pine Script indicator designed to help traders identify buy and sell opportunities in trending and volatile markets. Building on trend-following principles, it uses a modified Average True Range (ATR) calculation combined with volume or momentum data to plot a dynamic trend line. The indicator overlays on the price chart, displaying a colored trend line, a filled trend zone, buy/sell signals, and optional stop-loss tick labels, making it ideal for day trading or swing trading, particularly in markets like futures (e.g., MES).
What It Does
This indicator generates buy and sell signals based on the direction and momentum of a custom trend line, filtered by optional time restrictions and signal frequency logic. The trend line adapts to price action and volatility, with a filled zone highlighting trend strength. Buy/sell signals are plotted as labels, and stop-loss distances are displayed in ticks (customizable for instruments like MES). The indicator supports standard chart types for realistic signal generation.
How It Works
The indicator employs the following components:
Trend Line Calculation: A dynamic trend line is calculated using ATR adjusted by a user-defined multiplier, combined with either Money Flow Index (MFI) or Relative Strength Index (RSI) depending on volume availability. The line tracks price movements, adjusting upward or downward based on trend direction and volatility.
Trend Zone: The area between the current trend line and its value two bars prior is filled, colored green for bullish trends (upward movement) or red for bearish trends (downward movement), providing a visual cue of trend strength.
Signal Generation: Buy signals occur when the trend line crosses above its value two bars ago, and sell signals occur when it crosses below, with optional filtering to reduce signal noise (based on bar timing logic). Signals can be restricted to a 9:00–15:00 UTC trading window.
Stop-Loss Ticks: For each signal, the indicator calculates the distance to the trend line (acting as a stop-loss level) in ticks, using a user-defined tick size (default 0.25 for MES). These are displayed as labels below/above the signal.
Time Filter: An optional filter limits signals to 9:00–15:00 UTC, aligning with active trading sessions like the US market open.
The indicator ensures compatibility with standard chart types (e.g., candlestick or bar charts) to avoid unrealistic results associated with non-standard types like Heikin Ashi or Renko.
How to Use It
Add to Chart: Apply the indicator to a candlestick or bar chart on TradingView.
Configure Settings:
Multiplier: Adjust the ATR multiplier (default 1.0) to control trend line sensitivity. Higher values widen the stop-loss distance.
Common Period: Set the ATR and MFI/RSI period (default 14) for trend calculations.
No Volume Data: Enable if volume data is unavailable (e.g., for certain forex pairs), switching from MFI to RSI.
Tick Size: Set the tick size for stop-loss calculations (default 0.25 for MES futures).
Show Buy/Sell Signals: Toggle signal labels (default enabled).
Show Stop Loss Ticks: Toggle stop-loss tick labels (default enabled).
Use Time Filter: Restrict signals to 9:00–15:00 UTC (default disabled).
Use Filtered Signals: Enable to reduce signal frequency using bar timing logic (default enabled).
Interpret Signals:
Buy Signal: A blue “BUY” label below the bar indicates a potential long entry (trend line crossover, passing filters).
Sell Signal: A red “SELL” label above the bar indicates a potential short entry (trend line crossunder, passing filters).
Trend Zone: Green fill suggests bullish momentum; red fill suggests bearish momentum.
Stop-Loss Ticks: Gray labels show the stop-loss distance in ticks, helping with risk management.
Monitor Context: Use the trend line and filled zone to confirm the market’s direction before acting on signals.
Unique Features
Adaptive Trend Line: Combines ATR with MFI or RSI to create a responsive trend line that adjusts to volatility and market conditions.
Tick-Based Stop-Loss: Displays stop-loss distances in ticks, customizable for specific instruments, aiding precise risk management.
Signal Filtering: Optional bar timing logic reduces false signals, improving reliability in choppy markets.
Trend Zone Visualization: The filled zone between trend line values enhances trend clarity, making it easier to assess momentum.
Time-Restricted Trading: Optional 9:00–15:00 UTC filter aligns signals with high-liquidity sessions.
Notes
Use on standard candlestick or bar charts to ensure accurate signals.
Test the indicator on a demo account to optimize settings for your market and timeframe.
Combine with other analysis (e.g., support/resistance, volume spikes) for better decision-making.
The indicator is not a standalone system; use it as part of a broader trading strategy.
Limitations
Signals may lag in highly volatile or low-liquidity markets due to ATR-based calculations.
The 9:00–15:00 UTC time filter may not suit all markets; disable it for 24-hour assets like forex or crypto.
Stop-loss tick calculations assume consistent tick sizes; verify compatibility with your instrument.
This indicator is designed for traders seeking a robust, trend-following tool with customizable risk management and signal filtering, optimized for active trading sessions.

Machine Learning | Adaptive Trend Signals [Bitwardex]⚙️🧠Machine Learning | Adaptive Trend Signals
🔷Overview
Machine Learning | Adaptive Trend Signals is a Pine Script™ v6 indicator designed to visualize market trends and generate signals through a combination of volatility clustering, Gaussian smoothing, and adaptive trend calculations. Built as an overlay indicator, it integrates advanced techniques inspired by machine learning concepts, such as K-Means clustering, to adapt to changing market conditions. The script is highly customizable, includes a backtesting module, and supports alert conditions, making it suitable for traders exploring trend-based strategies and developers studying volatility-driven indicator design.
🔷Functionality
The indicator performs the following core functions:
• Volatility Clustering: Uses K-Means clustering to categorize market volatility into high, medium, and low states, adjusting trend sensitivity accordingly.
• Trend Calculation: Computes adaptive trend lines (SmartTrend) based on volatility-adjusted standard deviation, smoothed RSI, and ADX filters.
• Signal Generation: Identifies potential buy and sell points through trend line crossovers and directional confirmation.
• Backtesting Module: Tracks trade outcomes based on the SmartTrend3 value, displaying win rate and total trades.
• Visualization: Plots trend lines with gradient colors and optional signal markers (bullish 🐮 and bearish 🐻).
• Alerts: Provides configurable alerts for trend shifts and volatility state changes.
🔷Technical Methodology
Volatility Clustering with K-Means
The indicator employs a K-Means clustering algorithm to classify market volatility, measured via the Average True Range (ATR), into three distinct clusters:
• Data Collection: Gathers ATR values over a user-defined training period (default: 100 bars).
• Centroid Initialization: Sets initial centroids at the highest, lowest, and midpoint ATR values within the training period.
• Iterative Clustering: Assigns ATR data points to the nearest centroid, recalculates centroid means, and repeats until convergence.
• Dynamic Adjustment: Assigns a volatility state (high, medium, or low) based on the closest centroid, adjusting the trend factor (e.g., tighter for high volatility, wider for low volatility).
This approach allows the indicator to adapt its sensitivity to varying market conditions, providing a data-driven foundation for trend calculations.
🔷Gaussian Smoothing
To enhance signal clarity and reduce noise, the indicator applies Gaussian kernel smoothing to:
• RSI: Smooths the Relative Strength Index (calculated from OHLC4) to filter short-term fluctuations.
• SmartTrend: Smooths the primary trend line for a more stable output.
The Gaussian kernel uses a sigma value derived from the user-defined smoothing length, ensuring mathematically consistent noise reduction.
🔷SmartTrend Calculation
The pineSmartTrend function is the core of the indicator, producing three trend lines:
• SmartTrend: The primary trend line, calculated using a volatility-adjusted standard deviation, smoothed RSI, and ADX conditions.
• SmartTrend2: A secondary trend line with a wider factor (base factor * 1.382) for signal confirmation.
SmartTrend3: The average of SmartTrend and SmartTrend2, used for plotting and backtesting.
Key components of the calculation include:
• Dynamic Standard Deviation: Scales based on ATR relative to its 50-period smoothed average, with multipliers (1.0 to 1.4) applied according to volatility thresholds.
• RSI and ADX Filters: Requires RSI > 50 for bullish trends or < 50 for bearish trends, alongside ADX > 15 and rising to confirm trend strength.
Volatility-Adjusted Bands: Constructs upper and lower bands around price action, adjusted by the volatility cluster’s dynamic factor.
🔷Signal Generation
The generate_signals function generates signals as follows:
• Buy Signal: Triggered when SmartTrend crosses above SmartTrend2 and the price is above SmartTrend, with directional confirmation.
• Sell Signal: Triggered when SmartTrend crosses below SmartTrend2 and the price is below SmartTrend, with directional confirmation.
Directional Logic: Tracks trend direction to filter out conflicting signals, ensuring alignment with the broader market context.
Signals are visualized as small circles with bullish (🐮) or bearish (🐻) emojis, with an option to toggle visibility.
🔷Backtesting
The get_backtest function evaluates signal outcomes using the SmartTrend3 value (rather than closing prices) to align with the trend-based methodology.
It tracks:
• Total Trades: Counts completed long and short trades.
• Win Rate: Calculates the percentage of trades where SmartTrend3 moves favorably (higher for longs, lower for shorts).
Position Management: Closes opposite positions before opening new ones, simulating a single-position trading system.
Results are displayed in a table at the top-right of the chart, showing win rate and total trades. Note that backtest results reflect the indicator’s internal logic and should not be interpreted as predictive of real-world performance.
🔷Visualization and Alerts
• Trend Lines: SmartTrend3 is plotted with gradient colors reflecting trend direction and volatility cluster, accompanied by a secondary line for visual clarity.
• Signal Markers: Optional buy/sell signals are plotted as small circles with customizable colors.
• Alerts: Supports alerts for:
• Bullish and bearish trend shifts (confirmed on bar close).
Transitions to high, medium, or low volatility states.
🔷Input Parameters
• ATR Length (default: 14): Period for ATR calculation, used in volatility clustering.
• Period (default: 21): Common period for RSI, ADX, and standard deviation calculations.
• Base SmartTrend Factor (default: 2.0): Base multiplier for volatility-adjusted bands.
• SmartTrend Smoothing Length (default: 10): Length for Gaussian smoothing of the trend line.
• Show Buy/Sell Signals? (default: true): Enables/disables signal markers.
• Bullish/Bearish Color: Customizable colors for trend lines and signals.
🔷Usage Instructions
• Apply to Chart: Add the indicator to any TradingView chart.
• Configure Inputs: Adjust parameters to align with your trading style or market conditions (e.g., shorter ATR length for faster markets).
• Interpret Output:
• Trend Lines: Use SmartTrend3’s direction and color to gauge market bias.
• Signals: Monitor bullish (🐮) and bearish (🐻) markers for potential entry/exit points.
• Backtest Table: Review win rate and total trades to understand the indicator’s behavior in historical data.
• Set Alerts: Configure alerts for trend shifts or volatility changes to support manual or automated trading workflows.
• Combine with Analysis: Use the indicator alongside other tools or market context, as it is designed to complement, not replace, comprehensive analysis.
🔷Technical Notes
• Data Requirements: Requires at least 100 bars for accurate volatility clustering. Ensure sufficient historical data is loaded.
• Market Suitability: The indicator is designed for trend detection and may perform differently in ranging or volatile markets due to its reliance on RSI and ADX filters.
• Backtesting Scope: The backtest module uses SmartTrend3 values, which may differ from price-based outcomes. Results are for informational purposes only.
• Computational Intensity: The K-Means clustering and Gaussian smoothing may increase processing time on lower timeframes or with large datasets.
🔷For Developers
The script is modular, well-commented, encouraging reuse and modification with proper attribution.
Key functions include:
• gaussianSmooth: Applies Gaussian kernel smoothing to any data series.
• pineSmartTrend: Computes adaptive trend lines with volatility and momentum filters.
• getDynamicFactor: Adjusts trend sensitivity based on volatility clusters.
• get_backtest: Evaluates signal performance using SmartTrend3.
Developers can extend these functions for custom indicators or strategies, leveraging the volatility clustering and smoothing methodologies. The K-Means implementation is particularly useful for adaptive volatility analysis.
🔷Limitations
• The indicator is not predictive and should be used as part of a broader trading strategy.
• Performance varies by market, timeframe, and parameter settings, requiring user experimentation.
• Backtest results are based on historical data and internal logic, not real-world trading conditions.
• Volatility clustering assumes sufficient historical data; incomplete data may affect accuracy.
🔷Acknowledgments
Developed by Bitwardex, inspired by machine learning concepts and adaptive trading methodologies. Community feedback is welcome via TradingView’s platform.
🔷 Risk Disclaimer
Trading involves significant risks, and most traders may incur losses. Bitwardex AI Algo is provided for informational and educational purposes only and does not constitute financial advice or a recommendation to buy or sell any financial instrument . The signals, metrics, and features are tools for analysis and do not guarantee profits or specific outcomes. Past performance is not indicative of future results. Always conduct your own due diligence and consult a financial advisor before making trading decisions.

RSI HeartHere's an introduction you can use for your RSI Heart indicator:
---
### RSI Heart Indicator
The **RSI Heart Indicator** provides a visually engaging way to monitor and track the **Relative Strength Index (RSI)** across multiple timeframes (10m, 15m, 30m, and 1H). It not only shows the RSI value but also uses heart-shaped symbols to reflect the current market condition based on RSI levels, making it easier to understand the strength and momentum of a given asset at a glance.
### Key Features:
- **Multi-Timeframe Support**: The indicator pulls the RSI values from multiple timeframes (10 minutes, 15 minutes, 30 minutes, and 1 hour) so you can analyze market strength at different intervals in one view.
- **Heart Symbols**: RSI values are displayed alongside heart emojis (❤️, 💛, 💚) that provide a visual cue for the market condition:
- **❤️ (Overbought or Oversold)**: When RSI is below 27 or above 73.
- **💛 (Near Oversold/Overbought)**: When RSI is between 27-30 or 70-73.
- **💚 (Neutral)**: When RSI is between 30 and 70.
- **Customizable Visibility**: Toggle visibility for each timeframe's RSI using simple on/off settings, giving you control over which timeframes are displayed in your chart.
### How it Can Help:
- **Quick Market Sentiment Analysis**: The heart symbols and RSI values allow you to quickly assess whether an asset is in an overbought or oversold condition.
- **Multi-Timeframe RSI**: By viewing RSI across multiple timeframes, you can gain a more comprehensive understanding of market momentum and strength.
- **Personalized to Your Preferences**: Adjust the settings to only show the timeframes that matter most to you, creating a customized and clean chart view.
This indicator helps traders make more informed decisions by providing a clear, easy-to-read representation of market conditions across various timeframes, all within one indicator.
---
This introduction explains what the indicator does, its features, and how it can benefit traders in a concise and easy-to-understand way.

RSI Candles with EMA byAuncleJoeThe Relative Strength Index (RSI) is one of the most widely used momentum indicators in trading. It helps traders assess whether an asset is overbought or oversold by measuring the speed and magnitude of recent price changes. Traditionally, RSI is displayed as a single line oscillating between 0 and 100, but this representation can sometimes make it difficult to spot trends, reversals, and momentum shifts effectively.
To enhance RSI visualization and usability, the RSI Candles with EMA indicator transforms the RSI values into candlestick charts, providing a more intuitive and dynamic way to analyze momentum. Unlike the traditional RSI line, this approach allows traders to observe RSI trends just as they would analyze price charts, making it easier to detect changes in momentum and trend strength.
Each RSI candle represents a specific period’s momentum activity. Green candles indicate that the RSI closed higher than it opened, signaling bullish momentum, while red candles suggest that the RSI closed lower than it opened, indicating bearish sentiment. This candlestick-style visualization helps traders spot RSI trends, breakouts, and reversals more effectively than a simple line chart.
To further refine momentum analysis, this indicator also includes an Exponential Moving Average (EMA) of RSI. The EMA smooths RSI fluctuations and provides a clearer trend direction. When RSI candles remain above the EMA, it suggests strong buying momentum, whereas RSI candles falling below the EMA indicate increasing selling pressure. This combination of RSI candlesticks and an EMA line allows traders to better identify shifts in market sentiment and potential trend reversals.
Additionally, the indicator includes customizable overbought and oversold levels (defaulted at 70 and 30, respectively). These levels help traders recognize when an asset might be overextended in either direction, potentially signaling an upcoming reversal. When RSI candles approach or cross these thresholds, traders can anticipate possible changes in market direction.
This indicator is particularly useful for a wide range of traders. Scalpers and day traders can leverage it to quickly identify short-term momentum shifts, while swing traders can use it to detect potential reversals in multi-day trends. Trend-following traders can confirm bullish or bearish trends based on RSI’s position relative to its EMA, and mean reversion traders can use it to spot extreme conditions where price action might snap back.
By combining RSI candlesticks with an EMA filter, this indicator provides a more dynamic and visually intuitive approach to momentum trading. It offers clearer trend signals, better reversal detection, and enhanced decision-making, making it an essential tool for traders who rely on RSI-based strategies.

RSI & EMA IndicatorMulti-Timeframe EMA & RSI Analysis with Trend Merging Detection
Overview
This script provides traders with a multi-timeframe analysis tool that simplifies trend detection, momentum confirmation, and potential trend shifts. It integrates Exponential Moving Averages (EMAs) and the Relative Strength Index (RSI) across Daily, Weekly, and Monthly timeframes, helping traders assess both long-term and short-term market conditions at a glance.
This script is a simplification and modification of the EMA Cheatsheet by MarketMoves, reducing chart clutter while adding EMA merging detection to highlight potential trend reversals or breakouts.
Originality and Usefulness
Unlike traditional indicators, which focus on a single timeframe, this script combines multiple timeframes in a single view to offer a comprehensive market outlook.
What Makes This Indicator Unique?
This Indicator to Combine RSI and EMA Clouds for Multiple Timeframes
Multi-Timeframe Trend Analysis in One Visual Tool
EMA Merging Detection to Spot Trend Shifts Early
Momentum Validation Using RSI Across Daily, Weekly, and Monthly Timeframes
Reduces Chart Clutter While Providing Actionable Trade Signals
I couldn't find a TradingView indicator that displayed RSI and EMA clouds together across Daily, Weekly, and Monthly timeframes. This tool bridges that gap, allowing traders to see trend strength and momentum shifts across key timeframes without switching charts.
How the Script Works
1. Trend Direction via EMAs
The script tracks Short-term (5 & 12-period), Medium-term (34 & 50-period), and Long-term (72 & 89-period) EMAs across Daily, Weekly, and Monthly timeframes.
Bullish trend: When faster EMAs are above slower EMAs.
Bearish trend: When faster EMAs are below slower EMAs.
A visual table simplifies trend recognition with:
Green cells for bullish alignment.
Red cells for bearish alignment.
This color-coded system allows traders to quickly assess market momentum across different timeframes without excessive manual analysis.
2. Momentum Confirmation with RSI
The RSI(14) values for Daily, Weekly, and Monthly timeframes are displayed alongside the EMAs.
RSI above 70 suggests overbought conditions.
RSI below 30 suggests oversold conditions.
By combining RSI with EMA trends, traders can confirm whether momentum supports the trend direction or if the market is losing strength.
3. Trend Shift Detection (EMA Merging Mechanism)
A unique feature of this script is EMA merging detection, which occurs when:
The short, medium, and long-term EMAs come within 0.5% of the price.
This often signals trend reversals, breakouts, or consolidations.
When this condition is met, a warning signal appears, alerting traders to potential market shifts.
Who This Indicator Is For?
This script is designed for traders who want to track trends across multiple timeframes while keeping a clean and simplified chart.
Swing & Position Traders – Identify strong trends and potential momentum shifts for longer-term trades.
Trend Followers – Stay aligned with major market trends and avoid trading against momentum.
Day Traders – Use the Daily timeframe for entries while referencing higher timeframes for confirmation.
How to Use the Indicator
Add the indicator to any chart.
Check the trend table in the top-right corner:
Green cells indicate a bullish trend.
Red cells indicate a bearish trend.
Look at RSI values to confirm momentum:
RSI above 70 = Overbought.
RSI below 30 = Oversold.
Watch for the "Merge" alert to spot potential reversals or consolidations.
Combine signals from multiple timeframes for stronger trade decisions.
Why This Indicator is Unique on TradingView?
Before this script, no TradingView indicator displayed RSI and EMA clouds together across multiple timeframes (Daily, Weekly, Monthly).
This tool eliminates the need to:
Manually check multiple timeframes for trend alignment.
Add multiple EMA and RSI indicators to the same chart, creating clutter.
Constantly switch between different timeframes to confirm momentum and trend direction.
With this indicator, traders can see trend strength and momentum shifts instantly, improving their decision-making process.
Chart Guidelines
The script is designed for use on a clean chart to maximize clarity.
The trend alignment table is displayed in a non-intrusive manner so traders can focus on price action.
No additional indicators are required, but users may combine this script with volume-based indicators for further confirmation.
The script name and timeframe should always be visible on published charts to help traders understand the analysis.
Final Notes
This script is a simplification and modification of the EMA Cheatsheet by MarketMoves, improving trend detection, momentum confirmation, and EMA merging detection.
It is designed to help traders quickly identify trend direction, confirm momentum, and detect potential trend shifts, reducing the need for excessive manual analysis.
Disclaimer: This indicator is for educational purposes only and does not constitute financial advice. Trading involves risk; always use proper risk management when applying this tool in live markets.

MTF Signal XpertMTF Signal Xpert – Detailed Description
Overview:
MTF Signal Xpert is a proprietary, open‑source trading signal indicator that fuses multiple technical analysis methods into one cohesive strategy. Developed after rigorous backtesting and extensive research, this advanced tool is designed to deliver clear BUY and SELL signals by analyzing trend, momentum, and volatility across various timeframes. Its integrated approach not only enhances signal reliability but also incorporates dynamic risk management, helping traders protect their capital while navigating complex market conditions.
Detailed Explanation of How It Works:
Trend Detection via Moving Averages
Dual Moving Averages:
MTF Signal Xpert computes two moving averages—a fast MA and a slow MA—with the flexibility to choose from Simple (SMA), Exponential (EMA), or Hull (HMA) methods. This dual-MA system helps identify the prevailing market trend by contrasting short-term momentum with longer-term trends.
Crossover Logic:
A BUY signal is initiated when the fast MA crosses above the slow MA, coupled with the condition that the current price is above the lower Bollinger Band. This suggests that the market may be emerging from a lower price region. Conversely, a SELL signal is generated when the fast MA crosses below the slow MA and the price is below the upper Bollinger Band, indicating potential bearish pressure.
Recent Crossover Confirmation:
To ensure that signals reflect current market dynamics, the script tracks the number of bars since the moving average crossover event. Only crossovers that occur within a user-defined “candle confirmation” period are considered, which helps filter out outdated signals and improves overall signal accuracy.
Volatility and Price Extremes with Bollinger Bands
Calculation of Bands:
Bollinger Bands are calculated using a 20‑period simple moving average as the central basis, with the upper and lower bands derived from a standard deviation multiplier. This creates dynamic boundaries that adjust according to recent market volatility.
Signal Reinforcement:
For BUY signals, the condition that the price is above the lower Bollinger Band suggests an undervalued market condition, while for SELL signals, the price falling below the upper Bollinger Band reinforces the bearish bias. This volatility context adds depth to the moving average crossover signals.
Momentum Confirmation Using Multiple Oscillators
RSI (Relative Strength Index):
The RSI is computed over 14 periods to determine if the market is in an overbought or oversold state. Only readings within an optimal range (defined by user inputs) validate the signal, ensuring that entries are made during balanced conditions.
MACD (Moving Average Convergence Divergence):
The MACD line is compared with its signal line to assess momentum. A bullish scenario is confirmed when the MACD line is above the signal line, while a bearish scenario is indicated when it is below, thus adding another layer of confirmation.
Awesome Oscillator (AO):
The AO measures the difference between short-term and long-term simple moving averages of the median price. Positive AO values support BUY signals, while negative values back SELL signals, offering additional momentum insight.
ADX (Average Directional Index):
The ADX quantifies trend strength. MTF Signal Xpert only considers signals when the ADX value exceeds a specified threshold, ensuring that trades are taken in strongly trending markets.
Optional Stochastic Oscillator:
An optional stochastic oscillator filter can be enabled to further refine signals. It checks for overbought conditions (supporting SELL signals) or oversold conditions (supporting BUY signals), thus reducing ambiguity.
Multi-Timeframe Verification
Higher Timeframe Filter:
To align short-term signals with broader market trends, the script calculates an EMA on a higher timeframe as specified by the user. This multi-timeframe approach helps ensure that signals on the primary chart are consistent with the overall trend, thereby reducing false signals.
Dynamic Risk Management with ATR
ATR-Based Calculations:
The Average True Range (ATR) is used to measure current market volatility. This value is multiplied by a user-defined factor to dynamically determine stop loss (SL) and take profit (TP) levels, adapting to changing market conditions.
Visual SL/TP Markers:
The calculated SL and TP levels are plotted on the chart as distinct colored dots, enabling traders to quickly identify recommended exit points.
Optional Trailing Stop:
An optional trailing stop feature is available, which adjusts the stop loss as the trade moves favorably, helping to lock in profits while protecting against sudden reversals.
Risk/Reward Ratio Calculation:
MTF Signal Xpert computes a risk/reward ratio based on the dynamic SL and TP levels. This quantitative measure allows traders to assess whether the potential reward justifies the risk associated with a trade.
Condition Weighting and Signal Scoring
Binary Condition Checks:
Each technical condition—ranging from moving average crossovers, Bollinger Band positioning, and RSI range to MACD, AO, ADX, and volume filters—is assigned a binary score (1 if met, 0 if not).
Cumulative Scoring:
These individual scores are summed to generate cumulative bullish and bearish scores, quantifying the overall strength of the signal and providing traders with an objective measure of its viability.
Detailed Signal Explanation:
A comprehensive explanation string is generated, outlining which conditions contributed to the current BUY or SELL signal. This explanation is displayed on an on‑chart dashboard, offering transparency and clarity into the signal generation process.
On-Chart Visualizations and Debug Information
Chart Elements:
The indicator plots all key components—moving averages, Bollinger Bands, SL and TP markers—directly on the chart, providing a clear visual framework for understanding market conditions.
Combined Dashboard:
A dedicated dashboard displays key metrics such as RSI, ADX, and the bullish/bearish scores, alongside a detailed explanation of the current signal. This consolidated view allows traders to quickly grasp the underlying logic.
Debug Table (Optional):
For advanced users, an optional debug table is available. This table breaks down each individual condition, indicating which criteria were met or not met, thus aiding in further analysis and strategy refinement.
Mashup Justification and Originality
MTF Signal Xpert is more than just an aggregation of existing indicators—it is an original synthesis designed to address real-world trading complexities. Here’s how its components work together:
Integrated Trend, Volatility, and Momentum Analysis:
By combining moving averages, Bollinger Bands, and multiple oscillators (RSI, MACD, AO, ADX, and an optional stochastic), the indicator captures diverse market dynamics. Each component reinforces the others, reducing noise and filtering out false signals.
Multi-Timeframe Analysis:
The inclusion of a higher timeframe filter aligns short-term signals with longer-term trends, enhancing overall reliability and reducing the potential for contradictory signals.
Adaptive Risk Management:
Dynamic stop loss and take profit levels, determined using ATR, ensure that the risk management strategy adapts to current market conditions. The optional trailing stop further refines this approach, protecting profits as the market evolves.
Quantitative Signal Scoring:
The condition weighting system provides an objective measure of signal strength, giving traders clear insight into how each technical component contributes to the final decision.
How to Use MTF Signal Xpert:
Input Customization:
Adjust the moving average type and period settings, ATR multipliers, and oscillator thresholds to align with your trading style and the specific market conditions.
Enable or disable the optional stochastic oscillator and trailing stop based on your preference.
Interpreting the Signals:
When a BUY or SELL signal appears, refer to the on‑chart dashboard, which displays key metrics (e.g., RSI, ADX, bullish/bearish scores) along with a detailed breakdown of the conditions that triggered the signal.
Review the SL and TP markers on the chart to understand the associated risk/reward setup.
Risk Management:
Use the dynamically calculated stop loss and take profit levels as guidelines for setting your exit points.
Evaluate the provided risk/reward ratio to ensure that the potential reward justifies the risk before entering a trade.
Debugging and Verification:
Advanced users can enable the debug table to see a condition-by-condition breakdown of the signal generation process, helping refine the strategy and deepen understanding of market dynamics.
Disclaimer:
MTF Signal Xpert is intended for educational and analytical purposes only. Although it is based on robust technical analysis methods and has undergone extensive backtesting, past performance is not indicative of future results. Traders should employ proper risk management and adjust the settings to suit their financial circumstances and risk tolerance.
MTF Signal Xpert represents a comprehensive, original approach to trading signal generation. By blending trend detection, volatility assessment, momentum analysis, multi-timeframe alignment, and adaptive risk management into one integrated system, it provides traders with actionable signals and the transparency needed to understand the logic behind them.

Dynamic RSI Bollinger Bands with Waldo Cloud
TradingView Indicator Description: Dynamic RSI Bollinger Bands with Waldo Cloud
Title: Dynamic RSI Bollinger Bands with Waldo Cloud
Short Title: Dynamic RSI BB Waldo
Overview:
Introducing an experimental indicator, the Dynamic RSI Bollinger Bands with Waldo Cloud, designed for adventurous traders looking to explore new dimensions in technical analysis. This indicator overlays on your chart, providing a unique perspective by integrating the Relative Strength Index (RSI) with Bollinger Bands, creating a dynamic trading tool that adapts to market conditions through the lens of momentum and volatility.
What is it?
This innovative indicator combines the traditional Bollinger Bands with the RSI in a way that hasn't been commonly explored. Here's a breakdown:
RSI Integration: The RSI is calculated with customizable length settings, and its values are used not just for momentum analysis but as the basis for the Bollinger Bands. This means the position and width of the bands are directly influenced by the RSI, offering a visual representation of momentum within the context of price volatility.
Dynamic Bollinger Bands: Instead of using price directly, the Bollinger Bands are calculated using a scaled version of the RSI. This scaling is done to fit the RSI values into the price range, ensuring the bands are relevant to the actual price movement. The standard deviation for these bands is also scaled accordingly, providing a unique volatility measure that's momentum-driven.
Waldo Cloud: Named after a visual representation concept, the 'Waldo Cloud' refers to the colored area between the Bollinger Bands, which changes based on various conditions:
Purple when RSI is overbought.
Blue when RSI is oversold.
Green for bullish conditions, defined by the fast-moving average crossing above the slow one, RSI is bullish, and the price is above the slow MA.
Red for bearish conditions, when the fast MA crosses below the slow MA, the RSI is bearish, and the price is below the slow MA.
Gray for neutral market conditions.
Moving Averages: Two simple moving averages (Fast MA and Slow MA) are included, which can be toggled on or off, offering additional trend analysis through crossovers.
How to Use It:
Given its experimental nature, this indicator should be used with caution and in conjunction with other analysis methods:
Identifying Market Conditions: Use the color of the Waldo Cloud to gauge market sentiment. A green cloud might suggest a good time to consider long positions, while a red cloud could indicate potential shorting opportunities. Purple and blue clouds highlight extreme conditions that might precede reversals.
Volatility and Momentum: The dynamic nature of the Bollinger Bands based on RSI provides insight into how momentum is affecting price volatility. When the bands are wide, it might indicate high momentum and potential trend continuation or reversal, depending on the RSI's position relative to its overbought/oversold levels.
Trend Confirmation: The moving average crossovers can act as confirmation signals. For instance, a bullish crossover (fast MA over slow MA) within a green cloud might strengthen a buy signal, whereas a bearish crossover in a red cloud might reinforce a sell decision.
Customization: Adjust the RSI length, overbought/oversold levels, and moving average lengths to suit different trading styles or market conditions. Experiment with these settings to find what works best for your strategy.
Combining with Other Indicators: Since this is an experimental tool, it's advisable to use it alongside established indicators like traditional Bollinger Bands, MACD, or trend lines to validate signals.
Conclusion:
The Dynamic RSI Bollinger Bands with Waldo Cloud is an experimental venture into combining momentum with volatility visually and interactively. It's designed for traders who are open to exploring new methods of market analysis.
Remember, due to its experimental status, this indicator should be part of a broader trading strategy, and backtesting or paper trading is recommended before applying it in live trading scenarios. Keep an eye on how the market reacts to the signals provided by this indicator and always consider risk management practices.

RSI Crossover dipali parikhThis script generates buy and sell signals based on the crossover of the Relative Strength Index (RSI) and the RSI-based Exponential Moving Average (EMA). It also includes an additional condition for both buy and sell signals that the RSI-based EMA must be either above or below 50.
Key Features:
Buy Signal: Triggered when:
The RSI crosses above the RSI-based EMA.
The RSI-based EMA is above 50.
A green "BUY" label will appear below the bar when the buy condition is met.
Sell Signal: Triggered when:
The RSI crosses below the RSI-based EMA.
The RSI-based EMA is below 50.
A red "SELL" label will appear above the bar when the sell condition is met.
Customizable Inputs:
RSI Length: Adjust the period for calculating the RSI (default is 14).
RSI-based EMA Length: Adjust the period for calculating the RSI-based EMA (default is 9).
RSI Threshold: Adjust the threshold (default is 50) for when the RSI-based EMA must be above or below.
Visuals:
The RSI is plotted as a blue line.
The RSI-based EMA is plotted as an orange line.
Buy and sell signals are indicated by green "BUY" and red "SELL" labels.
Alerts:
Alerts can be set for both buy and sell conditions to notify you when either condition is met.
How to Use:
Use this script to identify potential buy and sell opportunities based on the behavior of the RSI relative to its EMA.
The buy condition indicates when the RSI is strengthening above its EMA, and the sell condition signals when the RSI is weakening below its EMA.
Strategy Use:
Ideal for traders looking to leverage RSI momentum for entering and exiting positions.
The RSI-based EMA filter helps smooth out price fluctuations, focusing on stronger signals.
This script is designed for both discretionary and algorithmic traders, offering a simple yet effective method for spotting trend reversals and continuation opportunities using RSI.

Composite Oscillation Indicator Based on MACD and OthersThis indicator combines various technical analysis tools to create a composite oscillator that aims to capture multiple aspects of market behavior. Here's a breakdown of its components:
* Individual RSIs (xxoo1-xxoo15): The code calculates the RSI (Relative Strength Index) of numerous indicators, including volume-based indicators (NVI, PVI, OBV, etc.), price-based indicators (CCI, CMO, etc.), and moving averages (WMA, ALMA, etc.). It also includes the RSI of the MACD histogram (xxoo14).
* Composite RSI (xxoojht): The individual RSIs are then averaged to create a composite RSI, aiming to provide a more comprehensive view of market momentum and potential turning points.
* MACD Line RSI (xxoo14): The RSI of the MACD histogram incorporates the momentum aspect of the MACD indicator into the composite measure.
* Double EMA (co, coo): The code employs two Exponential Moving Averages (EMAs) of the composite RSI, with different lengths (9 and 18 periods).
* Difference (jo): The difference between the two EMAs (co and coo) is calculated, aiming to capture the rate of change in the composite RSI.
* Smoothed Difference (xxp): The difference (jo) is further smoothed using another EMA (9 periods) to reduce noise and enhance the signal.
* RSI of Smoothed Difference (cco): Finally, the RSI is applied to the smoothed difference (xxp) to create the core output of the indicator.
Market Applications and Trading Strategies:
* Overbought/Oversold: The indicator's central line (plotted at 50) acts as a reference for overbought/oversold conditions. Values above 50 suggest potential overbought zones, while values below 50 indicate oversold zones.
* Crossovers and Divergences: Crossovers of the cco line above or below its previous bar's value can signal potential trend changes. Divergences between the cco line and price action can also provide insights into potential trend reversals.
* Emoji Markers: The code adds emoji markers ("" for bullish and "" for bearish) based on the crossover direction of the cco line. These can provide a quick visual indication of potential trend shifts.
* Colored Fill: The area between the composite RSI line (xxoojht) and the central line (50) is filled with color to visually represent the prevailing market sentiment (green for above 50, red for below 50).
Trading Strategies (Examples):
* Long Entry: Consider a long entry (buying) signal when the cco line crosses above its previous bar's value and the composite RSI (xxoojht) is below 50, suggesting a potential reversal from oversold conditions.
* Short Entry: Conversely, consider a short entry (selling) signal when the cco line crosses below its previous bar's value and the composite RSI (xxoojht) is above 50, suggesting a potential reversal from overbought conditions.
* Confirmation: Always combine the indicator's signals with other technical analysis tools and price action confirmation for better trade validation.
Additional Notes:
* The indicator offers a complex combination of multiple indicators. Consider testing and optimizing the parameters (EMAs, RSI periods) to suit your trading style and market conditions.
* Backtesting with historical data can help assess the indicator's effectiveness and identify potential strengths and weaknesses in different market environments.
* Remember that no single indicator is perfect, and the cco indicator should be used in conjunction with other forms of analysis to make informed trading decisions.
By understanding the logic behind this composite oscillator and its potential applications, you can incorporate it into your trading strategy to potentially identify trends, gauge market sentiment, and generate trading signals.
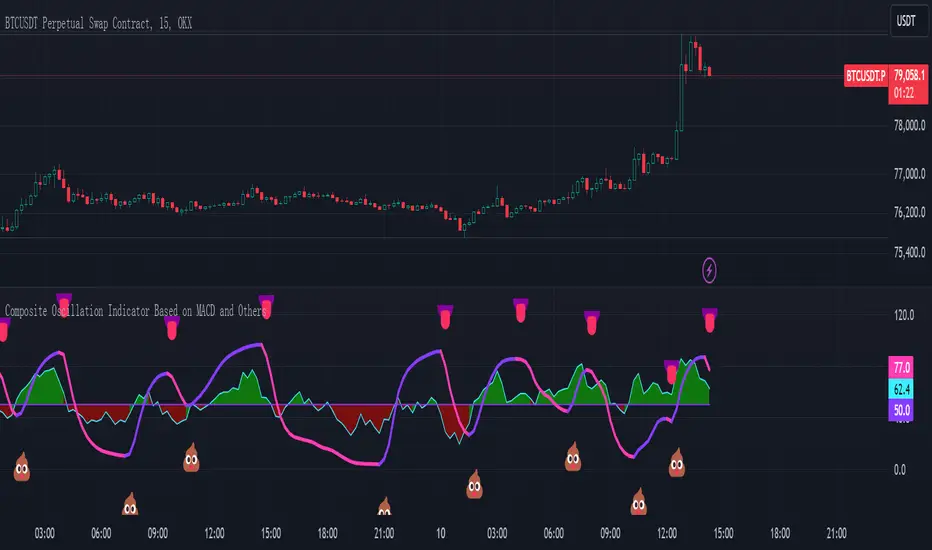
Dynamic Sentiment RSI [UAlgo]The Dynamic Sentiment RSI is a technical analysis tool that combines the classic RSI (Relative Strength Index) concept with dynamic sentiment analysis, offering traders enhanced insights into market conditions. Unlike the traditional RSI, this indicator integrates volume weighting, sentiment factors, and smoothing features to provide a more nuanced view of momentum and potential market reversals. It is designed to assist traders in detecting overbought/oversold conditions, momentum shifts, and to generate potential buy or sell signals using crossover and crossunder techniques. By dynamically adjusting based on sentiment and volume factors, this RSI offers better adaptability to varying market conditions, making it suitable for different trading styles and timeframes.
This tool is particularly helpful for traders who wish to explore not only price movement but also the underlying market sentiment, offering a more comprehensive approach to momentum analysis. The sentiment factor amplifies the RSI's sensitivity to price shifts, making it easier to detect early signals of market reversals or the continuation of a trend.
🔶 Key Features
Dynamic Sentiment Calculation: The indicator incorporates a "Sentiment Factor" that adjusts the RSI length dynamically based on a multiplier, helping traders better understand market sentiment at different time intervals.
Volume Weighting: When enabled, the RSI calculations are weighted by volume, allowing traders to give more importance to price movements with higher trading volume, which may provide more accurate signals.
Smoothing Feature: A customizable smoothing period is applied to the RSI to help filter out noise and make the signal smoother. This feature is particularly useful for traders who prefer to focus on long-term trends while minimizing false signals.
Step Size Customization: A "Step Size" input allows users to round the sentiment RSI to predefined intervals, making the results easier to interpret and act upon. This feature allows you to focus on significant sentiment changes and ignore minor fluctuations.
Crossover/Crossunder Alerts: The indicator includes crossover and crossunder signals on the zero-line, helping traders identify potential buy and sell opportunities as the smoothed RSI crosses these levels.
The indicator offers a clear visual display with multiple color-coded lines and areas:
Sentiment RSI: Plotted as an area chart, color-coded based on sentiment strength.
Raw RSI: A purple line representing the raw adjusted RSI.
Smoothed RSI: A dynamic line, color-coded aqua or orange based on its position relative to the zero line.
Buy/Sell Signals: Triangle shapes are plotted at crossovers and crossunders, providing clear entry and exit points.
🔶 Interpreting the Indicator
Sentiment RSI
-This line represents the sentiment-adjusted RSI, where the higher the value, the stronger the bullish sentiment, and the lower the value, the stronger the bearish sentiment. It is rounded to step intervals, making it easier to detect significant shifts in sentiment.
- A positive sentiment RSI (above 0) suggests bullish market conditions, while a negative sentiment RSI (below 0) suggests bearish conditions.
Smoothed RSI
The smoothed RSI helps reduce noise and shows the trend more clearly.
Crossovers of the zero line are significant:
- Crossover above zero: Indicates that bullish momentum is building, potentially signaling a buying opportunity.
- Crossunder below zero: Signals a shift towards bearish momentum, potentially indicating a sell signal.
Traders should look for these crossovers in conjunction with other signals for more accurate entry/exit points.
Raw RSI (Adjusted)
The raw adjusted RSI offers a less smoothed, more responsive version of the RSI. While it may be noisier, it provides early signals of market reversals and trends.
Crossover/Crossunder Signals
- When the smoothed RSI crosses above the zero line, a "Signal Up" triangle appears, indicating a potential buying opportunity.
- When the smoothed RSI crosses below the zero line, a "Signal Down" triangle appears, signaling a potential sell opportunity.
These signals help traders time their entries and exits by identifying momentum shifts.
Volume Weighting (Optional)
- If volume weighting is enabled, the RSI will give more weight to periods of higher trading volume, making the signals more reliable when the market is highly active.
Strong Up/Down Levels (40/-40)
- These dotted lines represent extreme sentiment levels. When the sentiment RSI reaches 40 or -40, the market may be nearing an overbought or oversold condition, respectively. This could be a signal for traders to prepare for potential reversals or shifts in momentum.
By combining the various components of this indicator, traders can gain a comprehensive view of market sentiment and price action, helping them make more informed trading decisions. The combination of sentiment factors, volume weighting, and smoothing makes this indicator highly flexible and suitable for a variety of trading strategies.
🔶 Disclaimer
Use with Caution: This indicator is provided for educational and informational purposes only and should not be considered as financial advice. Users should exercise caution and perform their own analysis before making trading decisions based on the indicator's signals.
Not Financial Advice: The information provided by this indicator does not constitute financial advice, and the creator (UAlgo) shall not be held responsible for any trading losses incurred as a result of using this indicator.
Backtesting Recommended: Traders are encouraged to backtest the indicator thoroughly on historical data before using it in live trading to assess its performance and suitability for their trading strategies.
Risk Management: Trading involves inherent risks, and users should implement proper risk management strategies, including but not limited to stop-loss orders and position sizing, to mitigate potential losses.
No Guarantees: The accuracy and reliability of the indicator's signals cannot be guaranteed, as they are based on historical price data and past performance may not be indicative of future results.
