Renz-GPT IndicatorThe Renz-GPT Indicator is a powerful, all-in-one trading tool designed to simplify decision-making and improve trade accuracy using a combination of trend, momentum, and volume analysis.
🔍 How It Works
Trend Detection:
Uses two EMAs (Exponential Moving Averages) to identify the current market trend.
A higher timeframe EMA acts as a trend filter to align trades with the larger market trend.
Momentum Confirmation:
RSI (Relative Strength Index) confirms the momentum strength.
Only takes trades when the momentum aligns with the trend.
Volume Confirmation:
Uses On-Balance Volume (OBV) to verify if volume supports the trend direction.
Signal Calculation:
Combines trend, momentum, and volume signals to create a high-probability trade setup.
Filters out weak signals to avoid false trades.
Entry, Stop Loss & Take Profit:
Displays clear LONG and SHORT markers on the chart.
Automatically calculates and displays Stop Loss and Take Profit levels based on ATR (Average True Range).
Alerts:
Sends real-time alerts when a valid buy or sell signal occurs.
Alerts include entry price, stop loss, and take profit levels.
Search in scripts for "relative strength"

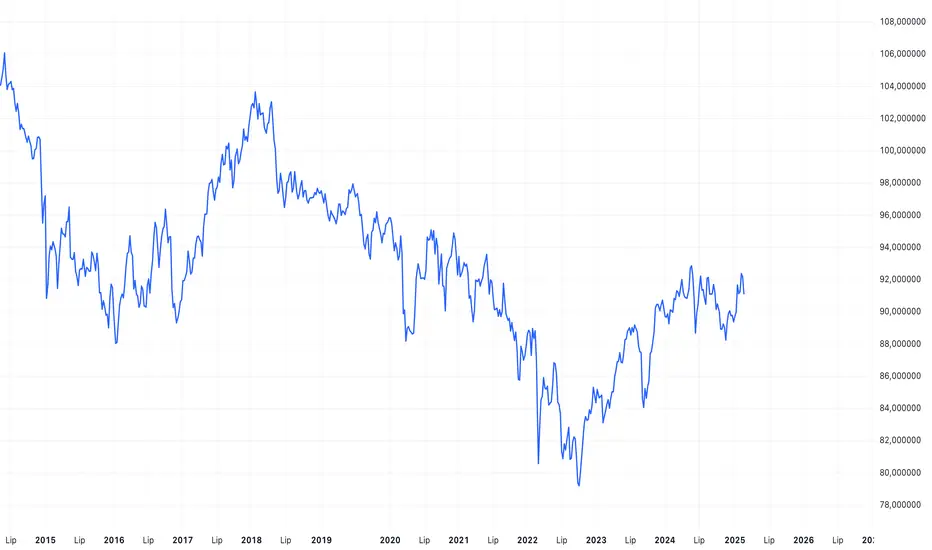
PLN IndexThe "PLN Index" is a custom indicator developed for TradingView using Pine Script (version 6). It tracks the relative strength of the Polish Zloty (PLN) against a basket of four major currencies: the U.S. Dollar (USD), Swiss Franc (CHF), Euro (EUR), and British Pound (GBP), with each currency contributing an equal weight of 25%. Modeled after the Polish Zloty Index (PLN_I) concept, this indicator offers traders a tool to monitor PLN’s performance across various forex market conditions.
How It Works
The indicator fetches closing prices for the currency pairs USDPLN, CHFPLN, EURPLN, and GBPPLN from TradingView’s data provider (FX_IDC). These pairs represent the amount of PLN needed to purchase one unit of each respective foreign currency. To measure PLN’s strength, the script inverts these rates (e.g., PLNUSD = 1/USDPLN) and calculates the geometric mean of the resulting values using the formula geom_mean = (PLNUSD * PLNCHF * PLNEUR * PLNGBP)^(0.25). The result is then normalized to a base value of 100 at the first bar with complete data, allowing users to observe relative changes in PLN’s value over time. A rising index indicates PLN appreciation, while a falling index suggests depreciation against the basket.
Key Features
Data Inputs: Retrieves closing prices for USDPLN, CHFPLN, EURPLN, and GBPPLN on the selected timeframe.
Calculation: Computes the geometric mean of the inverted exchange rates and normalizes it to 100 based on the first valid bar.
Visualization: Plots the index as a blue line with a linewidth of 2 on a separate chart pane (non-overlay).
Robust Normalization: Normalizes the index using the first bar where all data is available, improving reliability across different timeframes.
Usage
The PLN Index is useful for:
Evaluating the Polish Zloty’s strength or weakness relative to a balanced currency basket.
Identifying long-term trends or short-term shifts in PLN’s value for forex trading or economic analysis.
Supporting technical analysis when paired with additional indicators, such as moving averages or oscillators.
Limitations
Data Dependency: The indicator relies on the availability of historical data for all four currency pairs. Missing data (e.g., on higher timeframes like D1 or W1) may prevent accurate plotting.
Relative Normalization: Unlike the official PLN_I, which uses a fixed historical base date (e.g., January 2, 1984), this indicator normalizes to 100 at the first valid bar, making it a relative rather than absolute measure.
Potential Data Gaps: On higher timeframes, inconsistencies or limited historical data from the FX_IDC provider may result in incomplete index values.
Notes
This version of the PLN Index includes an improved normalization method that sets the base value (100) at the first bar with valid data, enhancing its adaptability compared to earlier iterations. It performs best on timeframes up to H4, where data availability is generally consistent. For higher timeframes, users should verify data completeness to ensure reliable results.
Broad Market MOEX non normalazeBroad Market MOEX - Relative Strength Indicator for MOEX Stocks
This indicator allows you to compare the price dynamics of major Moscow Exchange stocks relative to the selected asset during the trading session.
Features:
• Tracks 10 key MOEX stocks: Sberbank, Rosneft, Lukoil, Gazprom Neft, NOVATEK, Nornickel, Polyus, Tatneft, Surgutneftegas, Severstal
• Shows the percentage price change of each stock relative to the base price at the start of trading (default 9:00 MSK)
• Allows you to customize the base time for reference
• Clearly displays the strength and weakness of individual stocks relative to each other
• Helps identify leaders and laggards during the trading session
How to use:
1. Add the indicator to any MOEX stock chart
2. Adjust the base time if needed (default 9:00)
3. Monitor the relative dynamics of stocks
4. Use for:
- Finding strong/weak stocks
- Identifying sector rotation
- Intraday trading
- Correlation analysis
Color coding of lines helps easily identify each stock on the chart.
The indicator is useful for intraday traders and anyone monitoring the relative strength of stocks on the Moscow Exchange.

MATA GOLD RATIOMata Gold Instrument: User Guide
The Instrument to Gold Oscillator is a technical analysis tool that normalizes the ratio of an instrument's price (e.g., BTC/USD) to the price of gold (XAU/USD) into a 0-100 scale. This provides a clear and intuitive way to evaluate the relative performance of an instrument compared to gold over a specified period.
---
How It Works
1. Calculation of the Ratio:
The ratio is calculated as:
\text{Ratio} = \frac{\text{Instrument Price}}{\text{Gold Price}}
2. Normalization:
The ratio is normalized using the highest and lowest values over a user-defined period (length), typically 14 periods:
\text{Normalized Ratio} = \frac{\text{Ratio} - \text{Min(Ratio)}}{\text{Max(Ratio)} - \text{Min(Ratio)}} \times 100
3. Overbought/Oversold Levels:
Above 80: The instrument is relatively expensive compared to gold (overbought).
Below 20: The instrument is relatively cheap compared to gold (oversold).
---
How to Use the Oscillator
1. Identify Overbought and Oversold Levels:
If the oscillator rises above 80, the instrument may be overvalued relative to gold. This could signal a potential reversal or correction.
If the oscillator falls below 20, the instrument may be undervalued relative to gold. This could signal a buying opportunity.
2. Track Trends:
Rising oscillator values indicate the instrument is gaining value relative to gold.
Falling oscillator values indicate the instrument is losing value relative to gold.
3. Crossing the Midline (50):
When the oscillator crosses above 50, the instrument's value is gaining strength relative to gold.
When it crosses below 50, the instrument is weakening relative to gold.
4. Combine with Other Indicators:
Use this oscillator alongside other technical indicators (e.g., RSI, MACD, STOCH) for more robust decision-making.
Confirm signals from the oscillator with price action or volume analysis.
---
Example Scenarios
1. Trading Cryptocurrencies Against Gold:
If BTC/USD's oscillator value is above 80, Bitcoin may be overvalued relative to gold. Consider reducing exposure or looking for short opportunities.
If BTC/USD's oscillator value is below 20, Bitcoin may be undervalued relative to gold. This could be a good time to accumulate.
2. Commodities vs. Gold:
Analyze the relative strength of commodities (e.g., oil, silver) against gold using the oscillator to identify periods of overperformance or underperformance.
---
Advantages of the Oscillator
Relative Performance Insight: Tracks the performance of an instrument relative to gold, providing a macro perspective.
Clear Visual Representation: The 0-100 scale makes it easy to identify overbought/oversold conditions and trend shifts.
Customizable Periods: The user-defined length allows flexibility in analyzing short- or long-term trends.
---
Limitations
Dependence on Gold: As the oscillator is based on gold prices, any external shocks to gold (e.g., geopolitical events) can influence its signals.
No Absolute Buy/Sell Signals: The oscillator should not be used in isolation but as part of a broader analysis strategy.
---
By using the Instrument to Gold Oscillator effectively, traders and investors can gain valuable insights into the relative valuation and performance of assets compared to gold, enabling more informed trading and investment decisions.

[MAD] Weighted Trend Detector--> Purpose
The Weighted Trend Detector evaluates market direction by combining multiple technical indicators (RSI, MACD, Moving Averages, ADX, and Volume) across up to three different timeframes.
It calculates an overall trend score to help visualize whether conditions are bullish, bearish, or neutral.
--> Scaling & Weightings
Each component indicator contributes a score between -1.0 and +1.0. User-defined weights (e.g., 0.2 for RSI, 0.3 for MACD) determine how much each indicator influences the final score. An adaptive scaling mechanism ensures extreme values remain in view by dynamically setting the minimum and maximum of the score range over a specified lookback period.
--> Basic Parameters of Individual Indicators
RSI Period: Number of bars for the Relative Strength Index calculation; higher values smooth out noise but may lag.
MACD Fast/Slow/Signal: EMA-based periods to identify momentum shifts. A shorter “Fast” length reacts quickly, while a longer “Slow” length is smoother.
Moving Averages (Short & Long Lengths): Simple Moving Averages used to gauge shorter- vs. longer-term price direction.
ADX Length: Defines how many bars are considered when measuring trend strength. Higher values produce smoother ADX lines.
Volume MA Length: Period over which the average volume is calculated to compare against current volume.
--> Colors & How They Are Mixed
The background color scales from a negative color (for lower scores) to a positive color (for higher scores).
Near the highest or lowest parts of the score range, additional blending occurs if the slope (change in score) reverses:
Turning Down: Mixes with a user-chosen “warning” color if the score is high but moving lower.
Turning Up: Mixes with a user-chosen “recovery” color if the score is low but moving higher.
All colors (including line and label text) can be adjusted in the script’s inputs to suit personal preferences.colors are customizable via inputs.
Have fun :-)

RSI-Adjusted 9SMAThis indicator integrates the Relative Strength Index (RSI) and a Simple Moving Average (SMA) to create a more robust trading signal by blending momentum and trend analysis. Here's how they work together:
How the RSI and SMA Work in Harmony
RSI (Momentum Indicator):
The RSI measures the speed and change of price movements, oscillating between 0 and 100.
Typically, an RSI value above 50 suggests bullish momentum, while values below 50 indicate bearish momentum.
The script further refines this by applying a 9-period EMA to the RSI. This smoothing process filters out noise, providing a clearer picture of momentum shifts.
SMA (Trend Indicator):
The SMA calculates the average price over a specific period (9 in this case), helping to smooth out price fluctuations and identify the overall trend.
By observing the SMA, traders can determine whether the market is trending upward, downward, or moving sideways.
Combining the Two for Stronger Signals:
The RSI EMA acts as a momentum filter. When it is above 50, it indicates the presence of bullish momentum. Under such conditions, the SMA turning blue provides a stronger confirmation of an uptrend.
Conversely, when the RSI EMA is below 50, it signals weakening momentum. The SMA turning white underlines the caution, suggesting potential bearish conditions or a lack of trend strength.
This combination ensures that traders are not just relying on the SMA's trend-following behavior but also factoring in the market's underlying momentum for more reliable entries and exits.
Why This Approach is Robust
Avoid False Signals:
The SMA alone can generate false signals in choppy or range-bound markets. By incorporating the RSI EMA, the script reduces the likelihood of acting on weak or non-committal trends.
Timing Entries and Exits:
When both the SMA and RSI EMA align (e.g., blue SMA and RSI EMA > 50), it provides a stronger case for entering trades. Similarly, misalignment (e.g., white SMA and RSI EMA ≤ 50) warns against entering during uncertain conditions.
Adapting to Market Conditions:
This dual approach captures both short-term momentum shifts (RSI EMA) and longer-term trend direction (SMA), making it useful across different market phases.
Practical Application
Bullish Setup:
RSI EMA > 50 + Blue SMA → Enter or stay in long positions.
Bearish Setup:
RSI EMA ≤ 50 + White SMA → Exit long positions or consider short opportunities.
This combination of indicators offers traders a balanced strategy that considers both the direction of the trend and the underlying momentum, resulting in more confident and timely decision-making.

Cryptocurrency StrengthMulti-Currency Analysis: Monitor up to 19 different currencies simultaneously, including major pairs like USD, EUR, JPY, and GBP, as well as emerging market currencies such as CNY, INR, and BRL.
Customizable Display: Easily toggle the visibility of each currency and personalize their colors to suit your preferences, allowing for a tailored analysis experience.
Real-Time Strength Measurement: The indicator calculates and displays the relative strength of each currency in real-time, helping you identify potential trends and trading opportunities.
Clear Visual Representation: With color-coded lines and a dynamic legend, the indicator presents complex currency relationships in an easy-to-understand format.
Advantages
Comprehensive Market View: Gain insights into the broader forex market dynamics by analyzing multiple currencies at once.
Trend Identification: Quickly spot strong and weak currencies, aiding in the identification of potential trending pairs.
Divergence Detection: Use the indicator to identify divergences between currency strength and price action, potentially signaling reversals or continuation patterns.
Flexible Time Frames: Apply the indicator across various time frames to align with your trading strategy, from intraday to long-term analysis.
Enhanced Decision Making: Make more informed trading decisions by understanding the relative strength of currencies involved in your trades.
Unique Qualities
TSI-Based Calculations: Utilizes the True Strength Index for a more nuanced and responsive measure of currency strength compared to simple price-based indicators.
Adaptive Legend: The indicator features a dynamic legend that updates automatically based on the selected currencies, ensuring a clutter-free and relevant display.
Emerging Market Inclusion: Unlike many standard currency strength indicators, this tool includes a wide range of emerging market currencies, providing a truly global perspective.
Whether you're a seasoned forex trader or just starting out, this Currency Strength Indicator offers valuable insights that can complement your existing strategy and potentially improve your trading outcomes. Its combination of comprehensive analysis, customization options, and clear visualization makes it an essential tool for navigating the complex world of currency trading.

TrigWave Suite [InvestorUnknown]The TrigWave Suite combines Sine-weighted, Cosine-weighted, and Hyperbolic Tangent moving averages (HTMA) with a Directional Movement System (DMS) and a Relative Strength System (RSS).
Hyperbolic Tangent Moving Average (HTMA)
The HTMA smooths the price by applying a hyperbolic tangent transformation to the difference between the price and a simple moving average. It also adjusts this value by multiplying it by a standard deviation to create a more stable signal.
// Function to calculate Hyperbolic Tangent
tanh(x) =>
e_x = math.exp(x)
e_neg_x = math.exp(-x)
(e_x - e_neg_x) / (e_x + e_neg_x)
// Function to calculate Hyperbolic Tangent Moving Average
htma(src, len, mul) =>
tanh_src = tanh((src - ta.sma(src, len)) * mul) * ta.stdev(src, len) + ta.sma(src, len)
htma = ta.sma(tanh_src, len)
Sine-Weighted Moving Average (SWMA)
The SWMA applies sine-based weights to historical prices. This gives more weight to the central data points, making it responsive yet less prone to noise.
// Function to calculate the Sine-Weighted Moving Average
f_Sine_Weighted_MA(series float src, simple int length) =>
var float sine_weights = array.new_float(0)
array.clear(sine_weights) // Clear the array before recalculating weights
for i = 0 to length - 1
weight = math.sin((math.pi * (i + 1)) / length)
array.push(sine_weights, weight)
// Normalize the weights
sum_weights = array.sum(sine_weights)
for i = 0 to length - 1
norm_weight = array.get(sine_weights, i) / sum_weights
array.set(sine_weights, i, norm_weight)
// Calculate Sine-Weighted Moving Average
swma = 0.0
if bar_index >= length
for i = 0 to length - 1
swma := swma + array.get(sine_weights, i) * src
swma
Cosine-Weighted Moving Average (CWMA)
The CWMA uses cosine-based weights for data points, which produces a more stable trend-following behavior, especially in low-volatility markets.
f_Cosine_Weighted_MA(series float src, simple int length) =>
var float cosine_weights = array.new_float(0)
array.clear(cosine_weights) // Clear the array before recalculating weights
for i = 0 to length - 1
weight = math.cos((math.pi * (i + 1)) / length) + 1 // Shift by adding 1
array.push(cosine_weights, weight)
// Normalize the weights
sum_weights = array.sum(cosine_weights)
for i = 0 to length - 1
norm_weight = array.get(cosine_weights, i) / sum_weights
array.set(cosine_weights, i, norm_weight)
// Calculate Cosine-Weighted Moving Average
cwma = 0.0
if bar_index >= length
for i = 0 to length - 1
cwma := cwma + array.get(cosine_weights, i) * src
cwma
Directional Movement System (DMS)
DMS is used to identify trend direction and strength based on directional movement. It uses ADX to gauge trend strength and combines +DI and -DI for directional bias.
// Function to calculate Directional Movement System
f_DMS(simple int dmi_len, simple int adx_len) =>
up = ta.change(high)
down = -ta.change(low)
plusDM = na(up) ? na : (up > down and up > 0 ? up : 0)
minusDM = na(down) ? na : (down > up and down > 0 ? down : 0)
trur = ta.rma(ta.tr, dmi_len)
plus = fixnan(100 * ta.rma(plusDM, dmi_len) / trur)
minus = fixnan(100 * ta.rma(minusDM, dmi_len) / trur)
sum = plus + minus
adx = 100 * ta.rma(math.abs(plus - minus) / (sum == 0 ? 1 : sum), adx_len)
dms_up = plus > minus and adx > minus
dms_down = plus < minus and adx > plus
dms_neutral = not (dms_up or dms_down)
signal = dms_up ? 1 : dms_down ? -1 : 0
Relative Strength System (RSS)
RSS employs RSI and an adjustable moving average type (SMA, EMA, or HMA) to evaluate whether the market is in a bullish or bearish state.
// Function to calculate Relative Strength System
f_RSS(rsi_src, rsi_len, ma_type, ma_len) =>
rsi = ta.rsi(rsi_src, rsi_len)
ma = switch ma_type
"SMA" => ta.sma(rsi, ma_len)
"EMA" => ta.ema(rsi, ma_len)
"HMA" => ta.hma(rsi, ma_len)
signal = (rsi > ma and rsi > 50) ? 1 : (rsi < ma and rsi < 50) ? -1 : 0
ATR Adjustments
To minimize false signals, the HTMA, SWMA, and CWMA signals are adjusted with an Average True Range (ATR) filter:
// Calculate ATR adjusted components for HTMA, CWMA and SWMA
float atr = ta.atr(atr_len)
float htma_up = htma + (atr * atr_mult)
float htma_dn = htma - (atr * atr_mult)
float swma_up = swma + (atr * atr_mult)
float swma_dn = swma - (atr * atr_mult)
float cwma_up = cwma + (atr * atr_mult)
float cwma_dn = cwma - (atr * atr_mult)
This adjustment allows for better adaptation to varying market volatility, making the signal more reliable.
Signals and Trend Calculation
The indicator generates a Trend Signal by aggregating the output from each component. Each component provides a directional signal that is combined to form a unified trend reading. The trend value is then converted into a long (1), short (-1), or neutral (0) state.
Backtesting Mode and Performance Metrics
The Backtesting Mode includes a performance metrics table that compares the Buy and Hold strategy with the TrigWave Suite strategy. Key statistics like Sharpe Ratio, Sortino Ratio, and Omega Ratio are displayed to help users assess performance. Note that due to labels and plotchar use, automatic scaling may not function ideally in backtest mode.
Alerts and Visualization
Trend Direction Alerts: Set up alerts for long and short signals
Color Bars and Gradient Option: Bars are colored based on the trend direction, with an optional gradient for smoother visual feedback.
Important Notes
Customization: Default settings are experimental and not intended for trading/investing purposes. Users are encouraged to adjust and calibrate the settings to optimize results according to their trading style.
Backtest Results Disclaimer: Please note that backtest results are not indicative of future performance, and no strategy guarantees success.

Savitzky Golay Median Filtered RSI [BackQuant]Savitzky Golay Median Filtered RSI
Introducing BackQuant's Savitzky Golay Median Filtered RSI, a cutting-edge indicator that enhances the classic Relative Strength Index (RSI) by applying both a Savitzky-Golay filter and a median filter to provide smoother and more reliable signals. This advanced approach helps reduce noise and captures true momentum trends with greater precision. Let’s break down how the indicator works, the features it offers, and how it can improve your trading strategy.
Core Concept: Relative Strength Index (RSI)
The Relative Strength Index (RSI) is a widely used momentum oscillator that measures the speed and change of price movements. It oscillates between 0 and 100, with levels above 70 typically indicating overbought conditions and levels below 30 indicating oversold conditions. However, the standard RSI can sometimes generate noisy signals, especially in volatile markets, making it challenging to identify reliable entry and exit points.
To improve upon the traditional RSI, this indicator introduces two powerful filters: the Savitzky-Golay filter and a median filter.
Savitzky-Golay Filter: Smoothing with Precision
The Savitzky-Golay filter is a digital filtering technique used to smooth data while preserving important features, such as peaks and trends. Unlike simple moving averages that can distort important price data, the Savitzky-Golay filter uses polynomial regression to fit the data, providing a more accurate and less lagging result.
In this script, the Savitzky-Golay filter is applied to the RSI values to smooth out short-term fluctuations and provide a more reliable signal. By using a window size of 5 and a polynomial degree of 2, the filter effectively reduces noise without compromising the integrity of the underlying price movements.
Median Filter: Reducing Outliers
After applying the Savitzky-Golay filter, the median filter is applied to the smoothed RSI values. The median filter is particularly effective at removing short-lived outliers, further enhancing the accuracy of the RSI by reducing the impact of sudden and temporary price spikes or drops. This combination of filters creates an ultra-smooth RSI that is better suited for detecting true market trends.
Long and Short Signals
The Savitzky Golay Median Filtered RSI generates long and short signals based on user-defined threshold levels:
Long Signals: A long signal is triggered when the filtered RSI exceeds the Long Threshold (default set at 176). This indicates that momentum is shifting upward, and it may present a good buying opportunity.
Short Signals: A short signal is generated when the filtered RSI falls below the Short Threshold (default set at 162). This suggests that momentum is weakening, potentially signaling a selling opportunity or exit from a long position.
These threshold levels can be adjusted to suit different market conditions and timeframes, allowing traders to fine-tune the sensitivity of the indicator.
Customization and Visualization Options
The Savitzky Golay Median Filtered RSI comes with several customization options, enabling traders to tailor the indicator to their specific needs:
Calculation Source: Select the price source for the RSI calculation (default is OHLC4, but it can be changed to close, open, high, or low prices).
RSI Period: Adjust the lookback period for the RSI calculation (default is 14).
Median Filter Length: Control the length of the median filter applied to the smoothed RSI, affecting how much noise is removed from the signal.
Threshold Levels: Customize the long and short thresholds to define the sensitivity for generating buy and sell signals.
UI Settings: Choose whether to display the RSI and thresholds on the chart, color the bars according to trend direction, and adjust the line width and colors used for long and short signals.
Visual Feedback: Color-Coded Signals and Thresholds
To make the signals easier to interpret, the indicator offers visual feedback by coloring the price bars and the RSI plot according to the current market trend:
Green Bars indicate long signals when momentum is bullish.
Red Bars indicate short signals when momentum is bearish.
Gray Bars indicate neutral or undecided conditions when no clear signal is present.
In addition, the Long and Short Thresholds can be plotted directly on the chart to provide a clear reference for when signals are triggered, allowing traders to visually gauge the strength of the RSI relative to its thresholds.
Alerts for Automation
For traders who prefer automated notifications, the Savitzky Golay Median Filtered RSI includes built-in alert conditions for long and short signals. You can configure these alerts to notify you when a buy or sell condition is met, ensuring you never miss a trading opportunity.
Trading Applications
This indicator is versatile and can be used in a variety of trading strategies:
Trend Following: The combination of Savitzky-Golay and median filtering makes this RSI particularly useful for identifying strong trends without being misled by short-term noise. Traders can use the long and short signals to enter trades in the direction of the prevailing trend.
Reversal Trading: By adjusting the threshold levels, traders can use this indicator to spot potential reversals. When the RSI moves from overbought to oversold levels (or vice versa), it may signal a shift in market direction.
Swing Trading: The smoothed RSI provides a clear signal for short to medium-term price movements, making it an excellent tool for swing traders looking to capitalize on momentum shifts.
Risk Management: The filtered RSI can be used as part of a broader risk management strategy, helping traders avoid false signals and stay in trades only when the momentum is strong.
Final Thoughts
The Savitzky Golay Median Filtered RSI takes the classic RSI to the next level by applying advanced smoothing techniques that reduce noise and improve signal reliability. Whether you’re a trend follower, swing trader, or reversal trader, this indicator provides a more refined approach to momentum analysis, helping you make better-informed trading decisions.
As with all indicators, it is important to backtest thoroughly and incorporate sound risk management strategies when using the Savitzky Golay Median Filtered RSI in your trading system.
Thus following all of the key points here are some sample backtests on the 1D Chart
Disclaimer: Backtests are based off past results, and are not indicative of the future.
INDEX:BTCUSD
INDEX:ETHUSD
BINANCE:SOLUSD

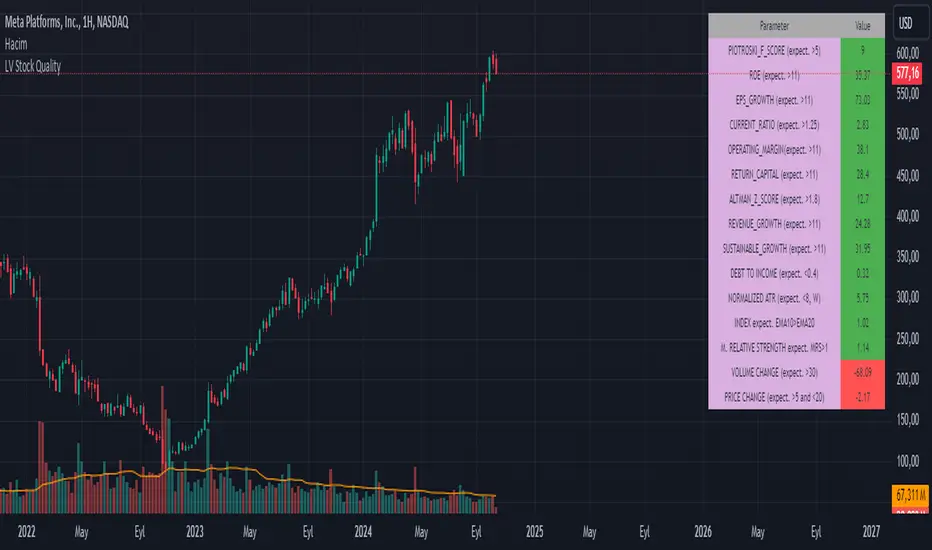
LV Stock QualityCritical financial and technical values are listed in the table.
PIOTROSKI_F_SCORE (expect. >5) -> The Piotroski score is a discrete score between zero and nine that reflects nine criteria used to determine the strength of a firm's financial position. The Piotroski score is used to determine the best value stocks, with nine being the best and zero being the worst. Having a score bigger than 5 is a good sign for the strength of a firm's financial position
ROE (expect. >11) --> Return on equity (ROE) is a measure of a company's financial performance. It is calculated by dividing net income by shareholders' equity. Because shareholders' equity is equal to a company’s assets minus its debt, ROE is a way of showing a company's return on net assets. A “good” ROE will depend on the company’s industry and competitors.
EPS_GROWTH (expect. >11) --> This indicator is calculated as the percentage change in Basic earnings per share for one year. This indicator reflects the growth rate of a company's basic profit per share outstanding for one year. It is calculated based using only common shares. An increase in EPS growth may signal that a company is becoming more profitable and efficient in its operations. A decline in EPS growth may signal that a company is spending more or losing business share. EPS growth should be viewed alongside other metrics like revenue and costs.
CURRENT_RATIO (expect. >1.25) --> The current ratio measures a company’s ability to pay current, or short-term, liabilities (debt and payables) with its current, or short-term, assets (cash, inventory, and receivables). Current ratios over 1.00 indicate that a company's current assets are greater than its current liabilities, meaning it could more easily pay of short-term debts.
OPERATING_MARGIN(expect. >11) --> The operating margin measures how much profit a company makes on a dollar of sales after paying for variable costs of production, such as wages and raw materials, but before paying interest or tax.
RETURN_CAPITAL (expect. >11) --> Return of capital (ROC) is a payment that an investor receives as a portion of their original investment and that is not considered income or capital gains from the investment.
ALTMAN_Z_SCORE (expect. >1.8) --> The Altman Z-score is the output of a credit-strength test that gauges a publicly traded manufacturing company's likelihood of bankruptcy. An Altman Z-score close to 0 suggests a company might be headed for bankruptcy, while a score closer to 3 suggests a company is in solid financial positioning.
REVENUE_GROWTH (expect. >11) --> Quarterly revenue growth is an increase in a company's sales in one quarter compared to sales of a different quarter. Comparing a company's financials from one period to another gives a clear picture of its revenue growth rate and can help investors identify the catalyst for such growth.
SUSTAINABLE_GROWTH (expect. >11) --> The sustainable growth rate (SGR) is the maximum rate of growth that a company or social enterprise can sustain without having to finance growth with additional equity or debt. In other words, it is the rate at which the company can grow while using its own internal revenue without borrowing from outside sources.
DEBT TO INCOME (expect. <0.4) --> A debt-to-income (DTI) ratio is a financial metric used by lenders to determine your borrowing risk. Your DTI ratio represents the total amount of debt you owe compared to the total amount of money you earn each month.
NORMALIZED ATR (expect. <8, W) --> The Normalized Average True Range (Normalized ATR) is an indicator used to measure market volatility by normalizing the average true range values. It does this by dividing the Average True Range (ATR) by the asset's closing price, converting it into a percentage. This normalization allows for the comparison of volatility levels across different securities or market conditions, regardless of the asset's price levels. The Normalized ATR helps traders to adjust their strategies based on relative volatility, rather than absolute price movements.
INDEX expect. EMA10>EMA20 --> it is expected to have EMA 10 > EMA 20 in weekly basis graph. It is known that having a strong trend in index will also increases chance of strong trend on stock levels. You need to select INDEX Market of stock via settings.
M. RELATIVE STRENGTH expect. MRS>1 --> Stan Weinstein uses the Mansfield RS indicator as another relative strength indicator. The indicator measures the variation in the 52-week ratio of stock and market.
VOLUME CHANGE (expect. >30) --> Having an increase on volume comparing to previous week can be a good sign if it occurs at the same time of breakout.
PRICE CHANGE (expect. >5 and <20) --> Having an increase on price comparing to previous week can be a good sign if it occurs at the same time of breakout.
It is better to look on weekly basis graphs.
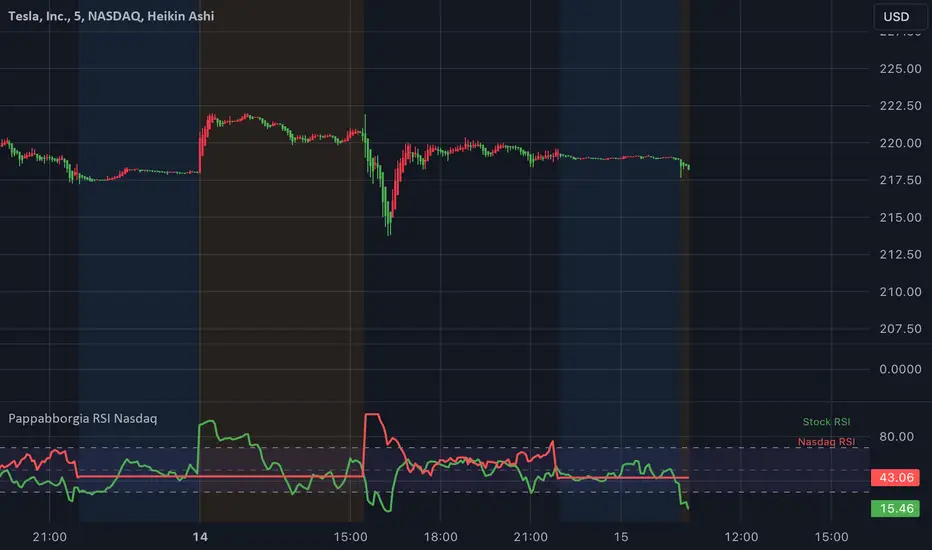
Pappabborgia Nasdaq RSI This script provides a custom Relative Strength Index (RSI) indicator that plots both the RSI of the selected stock and the Nasdaq (IXIC) on the same chart.
It offers a clear, side-by-side view to help traders better understand the stock's momentum relative to the overall market.
Key Features:
RSI Calculation for the Stock:
The script calculates the RSI for the chosen stock, with a default period of 14, adjustable to fit different timeframes.
The stock’s RSI is displayed in green 🟢, providing a direct view of its strength and momentum 📈.
RSI of the Nasdaq:
The script fetches the Nasdaq’s closing prices and calculates its RSI, which is shown in red for clear comparison 🔴.
Legend for Clarity:
A simple legend in the top-right corner identifies the green line as the stock’s RSI and the red line as the Nasdaq’s RSI, making it easy to interpret 📊.
Why Comparing the Stock's RSI to the Nasdaq Matters:
Broader Market Context:
Viewing both RSIs on the same chart helps you see whether the stock is moving in sync with the broader market or behaving independently. This provides valuable context for decision-making 📉.
Relative Strength Insights:
Comparing the stock’s RSI to the Nasdaq’s RSI highlights whether the stock is outperforming or underperforming the overall market, helping identify potential opportunities or risks 🟢🔴.
Improved Risk Management:
Monitoring overbought or oversold conditions in both the stock and Nasdaq RSIs can signal broader market trends and help avoid risky trades ⚠️.
Overall Benefit:
By tracking the RSI of both the stock and the Nasdaq, this script offers a powerful tool for understanding a stock's relative strength, providing essential context for smarter trading decisions 🎯.
MCDX+RSI+SMA[THANHCONG]### Detailed Analysis of the MCDX+RSI+SMA Indicator
The MCDX+RSI+SMA indicator is designed to help investors conduct a deeper analysis of market trends by combining multiple technical factors into a single chart. This integration of popular indicators such as RSI, SMA, and Stochastic RSI provides investors with a comprehensive view of market movements, particularly in distinguishing between "Banker" and "Hot Money"—representing large and small capital flows.
#### Key Components of the Indicator:
1. **RSI for Banker and Hot Money:**
- **RSI (Relative Strength Index)** is a momentum oscillator that measures the speed and change of price movements, indicating overbought or oversold conditions. In this indicator, there are two distinct RSI lines configured for Banker (large capital) and Hot Money (small capital).
- Investors can adjust parameters like the RSI calculation period, baseline levels, and sensitivity for each type of capital flow, providing flexibility to adapt to varying market conditions.
2. **Moving Average (MA) of RSI:**
- The indicator employs two common types of Moving Averages: **SMA (Simple Moving Average)** and **EMA (Exponential Moving Average)**. These help smooth the RSI signals for Banker, offering a clearer view of the long-term trend of large capital in the market.
- Investors can select the type and period of the MA, allowing them to optimize the indicator for their trading style.
3. **Stochastic RSI:**
- The **Stochastic RSI** is incorporated to monitor overbought and oversold conditions over a specified timeframe. Parameters related to %K and %D of the Stochastic can also be adjusted to refine the accuracy of market signal analysis.
- A notable feature is the normalization of %K and %D on a 0-20 scale, making these lines compatible with other RSI charts, thus providing consistency in evaluating market strength.
4. **Overbought and Oversold Levels:**
- The indicator includes reference lines for overbought and oversold levels, aiding investors in identifying potential reversal zones in the market. This helps to avoid buying at excessively high prices or selling at excessively low prices.
#### Benefits for Investors:
- **Comprehensive View:** The indicator combines insights from both large (Banker) and small (Hot Money) capital flows, enabling investors to analyze not just trends but also the participation of each type of capital in the market.
- **Enhanced Technical Analysis:** By integrating multiple technical indicators within a single chart, investors can track important factors such as market momentum, overbought/oversold conditions, and capital flow shifts without needing to switch between various charts.
- **Flexibility and Customization:** The indicator allows adjustment of key parameters like the RSI period, sensitivity, type of MA, and Stochastic RSI settings, enabling investors to tailor the indicator to their trading strategy and timeframe.
- **Higher Reliability:** The combination of indicators like RSI, Stochastic RSI, and MA helps investors confirm trading signals more confidently. For instance, when both RSI and Stochastic RSI indicate overbought conditions, the likelihood of a reversal may be higher, reducing risk for investors.
#### Unique Features of the Indicator:
The MCDX+RSI+SMA indicator is a unique tool that integrates various market analysis factors into a single framework. This not only provides investors with a complete view of capital flows but also aids in optimizing decision-making based on multiple market aspects. Furthermore, its customizable parameters make it suitable for various trading strategies, from short-term to long-term.
Swiss Knife [MERT]Introduction
The Swiss Knife indicator is a comprehensive trading tool designed to provide a multi-dimensional analysis of the market. By integrating a wide array of technical indicators across multiple timeframes, it offers traders a holistic view of market sentiment, momentum, and potential reversal points. This indicator is particularly useful for traders looking to combine trend analysis, momentum indicators, volume data, and price action into a single, easy-to-read format.
---
Key Features
Multi-Timeframe Analysis : Evaluates indicators on Daily , 4-Hour , 1-Hour , and 15-Minute timeframes.
Comprehensive Indicator Suite : Incorporates MACD , Awesome Oscillator (AO) , Parabolic SAR , SuperTrend , DPO , RSI , Stochastic Oscillator , Bollinger Bands , Ichimoku Cloud , Chande Momentum Oscillator (CMO) , Donchian Channels , ADX , volume-based momentum indicators, Fractals , and divergence detection.
Market Sentiment Scoring : Aggregates signals from multiple indicators to provide an overall sentiment score.
Visual Aids : Displays EMA lines, trendlines, divergence signals, and a sentiment table directly on the chart.
Super Trend Reversal Signals : Identifies potential market reversal points by assessing the momentum of automated trading bots.
---
Explanation of Each Indicator
Moving Average Convergence Divergence (MACD)
- Purpose : Measures the relationship between two moving averages of price.
- Interpretation : A positive histogram suggests bullish momentum; a negative histogram indicates bearish momentum.
Awesome Oscillator (AO)
- Purpose : Gauges market momentum by comparing recent market movements to historic ones.
- Interpretation : Above zero indicates bullish momentum; below zero indicates bearish momentum.
Parabolic SAR (SAR)
- Purpose : Identifies potential reversal points in price direction.
- Interpretation : Dots below price suggest an uptrend; dots above price suggest a downtrend.
SuperTrend
- Purpose : Determines the prevailing market trend.
- Interpretation : Provides buy or sell signals based on price movements relative to the SuperTrend line.
Detrended Price Oscillator (DPO)
- Purpose : Removes trend from price to identify cycles.
- Interpretation : Values above zero suggest price is above the moving average; values below zero indicate it is below.
Relative Strength Index (RSI)
- Purpose : Measures the speed and change of price movements.
- Interpretation : Values above 50 indicate bullish momentum; values below 50 indicate bearish momentum.
Stochastic Oscillator
- Purpose : Compares a particular closing price to a range of its prices over a certain period.
- Interpretation : Values above 50 indicate bullish conditions; values below 50 indicate bearish conditions.
Bollinger Bands (BB)
- Purpose : Measures market volatility and provides relative price levels.
- Interpretation : Price above the middle band suggests bullishness; below the middle band suggests bearishness.
Ichimoku Cloud
- Purpose : Provides support and resistance levels, trend direction, and momentum.
- Interpretation : Bullish signals when price is above the cloud; bearish signals when price is below the cloud.
Chande Momentum Oscillator (CMO)
- Purpose : Measures momentum on both up and down days.
- Interpretation : Values above 50 indicate strong upward momentum; values below -50 indicate strong downward momentum.
Donchian Channels
- Purpose : Identifies volatility and potential breakouts.
- Interpretation : Price above the upper band suggests bullish breakout; below the lower band suggests bearish breakout.
Average Directional Index (ADX)
- Purpose : Measures the strength of a trend.
- Interpretation : DI+ above DI- indicates bullish trend; DI- above DI+ indicates bearish trend.
Volume Momentum Indicators (VolMom, CumVolMom, POCMom)
- Purpose : Analyze volume to assess buying and selling pressure.
- Interpretation : Positive values suggest bullish volume momentum; negative values indicate bearish volume momentum.
Fractals
- Purpose : Identify potential reversal points in the market.
- Interpretation : Up fractals may indicate a future downtrend; down fractals may indicate a future uptrend.
Divergence Detection
- Purpose : Identifies divergences between price and various indicators (RSI, MACD, Stochastic, OBV, MFI, A/D Line).
- Interpretation : Bullish divergences suggest potential upward reversal; bearish divergences suggest potential downward reversal.
- Note : This functionality utilizes the library from Divergence Indicator .
---
Coloring Scheme
Background Color
- Purpose : Reflects the overall market sentiment by combining sentiment scores from all indicators across different timeframes.
- Interpretation :
- Green Shades : Indicate bullish market sentiment.
- Red Shades : Indicate bearish market sentiment.
- Intensity : The strength of the color corresponds to the strength of the sentiment score.
Sentiment Table
- Purpose : Displays the status of each indicator across different timeframes.
- Interpretation :
- Green Cell : The indicator suggests a bullish signal.
- Red Cell : The indicator suggests a bearish signal.
- Percentage Score : Indicates the overall bullish or bearish sentiment on that timeframe.
Exponential Moving Averages (EMAs)
- Purpose : Provide dynamic support and resistance levels.
- Colors :
- EMA 10 : Lime
- EMA 20 : Yellow
- EMA 50 : Orange
- EMA 100 : Red
- EMA 200 : Purple
Trendlines
- Purpose : Visual representation of support and resistance levels based on pivot points.
- Interpretation :
- Upward Trendlines : Colored green , indicating support levels.
- Downward Trendlines : Colored red , indicating resistance levels.
- Note : Trendlines are drawn using the library from Simple Trendlines .
---
Utility of Market Sentiment
The indicator aggregates signals from multiple technical indicators across various timeframes to compute an overall market sentiment score . This comprehensive approach helps traders understand the prevailing market conditions by:
Confirming Trends : Multiple indicators pointing in the same direction can confirm the strength of a trend.
Identifying Reversals : Divergences and fractals can signal potential turning points.
Timeframe Alignment : Aligning signals across different timeframes can enhance the probability of successful trades.
---
Divergences
Divergence occurs when the price of an asset moves in the opposite direction of a technical indicator, suggesting a potential reversal.
- Bullish Divergence : Price makes a lower low, but the indicator makes a higher low.
- Bearish Divergence : Price makes a higher high, but the indicator makes a lower high.
The indicator detects divergences for:
RSI
MACD
Stochastic Oscillator
On-Balance Volume (OBV)
Money Flow Index (MFI)
Accumulation/Distribution Line (A/D Line)
By identifying these divergences, traders can spot early signs of trend reversals and adjust their strategies accordingly.
---
Trendlines
Trendlines are essential tools for identifying support and resistance levels. The indicator automatically draws trendlines based on pivot points:
- Upward Trendlines (Support) : Connect higher lows, indicating an uptrend.
- Downward Trendlines (Resistance) : Connect lower highs, indicating a downtrend.
These trendlines help traders visualize the trend direction and potential breakout or reversal points.
---
Super Trend Reversals (ST Reversal)
The core idea behind the Super Trend Reversals indicator is to assess the momentum of automated trading bots (often referred to as 'Supertrend bots') that enter the market during critical turning points. Specifically, the indicator is tuned to identify when the market is nearing bottoms or peaks, just before it shifts direction based on the triggered Supertrend signals. This approach helps traders:
Engage Early : Enter the market as reversal momentum builds up.
Optimize Entries and Exits : Enter under favorable conditions and exit before momentum wanes.
By capturing these reversal points, traders can enhance their trading performance.
---
Conclusion
The Swiss Knife indicator serves as a versatile tool that combines multiple technical analysis methods into a single, comprehensive indicator. By assessing various aspects of the market—including trend direction, momentum, volume, and price action—it provides traders with valuable insights to make informed trading decisions.
---
Citations
- Divergence Detection Library : Divergence Indicator by DevLucem
- Trendline Drawing Library : Simple Trendlines by HoanGhetti
---
Note : This indicator is intended for informational purposes and should be used in conjunction with other analysis techniques. Always perform due diligence before making trading decisions.
---

Multi-Length RSI **Multi-Length RSI Indicator**
This script creates a custom Relative Strength Index (RSI) indicator with the ability to plot three different RSI lengths on the same chart, allowing traders to analyze momentum across various timeframes simultaneously. The script also includes features to enhance visual clarity and usability.
**Key Features:**
1. **Customizable RSI Lengths:**
- The script allows you to input and customize three different RSI lengths (7, 14, and 28 by default) via user inputs. This flexibility enables you to track short-term, medium-term, and long-term momentum in the market.
2. **Dynamic Colour Coding:**
- The RSI lines are color-coded based on their current value:
- **Above 70 (Overbought)**: The line turns red.
- **Below 30 (Oversold)**: The line turns green.
- **Between 30 and 70**: The line retains its user-defined colour (blue, yellow, orange by default).
- This dynamic colouring helps to quickly identify overbought and oversold conditions.
3. **Adjustable Line Widths and Colours:**
- Users can customize the colour and thickness of each RSI line, allowing for a personalized visual experience that fits different trading strategies.
4. **Overbought, Oversold, and Midline Levels:**
- The script includes static horizontal lines at the 70 (Overbought) and 30 (Oversold) levels, with a red and green colour, respectively.
- A midline at the 50 level is also included in gray and dashed, helping to visualize the neutral zone.
5. **Dynamic RSI Value Labels:**
- The current values of each RSI line are displayed directly on the chart as labels at the most recent bar, with colours matching their corresponding lines. This feature provides an immediate reference to the exact RSI values without the need to hover or look at the data window.
6. **Alerts for Crosses:**
- The script includes built-in alert conditions for when any of the RSI values cross above the overbought level (70) or below the oversold level (30). These alerts can be configured to notify you in real-time when significant momentum shifts occur.
**How to Use:**
1. **Customization**:
- Input your preferred RSI lengths, colours, and line widths through the script’s settings menu.
2. **Visual Analysis**:
- The indicator plots all three RSI values on a separate pane below the price chart. Use the color-coded lines and levels to quickly identify overbought, oversold, and neutral conditions across multiple timeframes.
3. **Set Alerts**:
- You can configure alerts based on the built-in alert conditions to get notified when the RSI crosses critical levels.
**Ideal For:**
- **Traders looking to analyze momentum across multiple timeframes**: The ability to view short-term, medium-term, and long-term RSIs simultaneously offers a comprehensive view of market strength.
- **Those who prefer visual clarity**: The dynamic colouring, clear labels, and customizable settings make it easy to interpret RSI data at a glance.
- **Traders who rely on alerts**: The built-in alert system allows for proactive trading based on significant RSI level crossings.
---
This script is a powerful tool for any trader looking to leverage RSI analysis across multiple timeframes, offering both customization and clarity in a single indicator.
Median RSI**Description:**
The "Median RSI with Buy/Sell Signals and Bar Color" indicator on TradingView calculates the median Relative Strength Index (RSI) alongside buy and sell signals and customizable bar colors. RSI is a momentum oscillator that measures the speed and change of price movements. This indicator provides traders with insights into the relative strength of a security by comparing its recent gains to its recent losses.
**How it Works:**
1. **RSI Calculation:** The script computes the RSI using a specified length parameter. This RSI value indicates whether a security is overbought or oversold, helping traders identify potential reversal points.
2. **Median RSI Calculation:** It calculates the highest and lowest RSI values over a certain period and finds the median value. This median RSI acts as a benchmark, guiding traders in assessing the relative strength of a security compared to its recent performance.
3. **Bar Color Customization:** The script allows users to customize the bar color based on the relationship between the RSI and the median RSI. Bars are colored differently to visually represent whether the RSI is above, below, or equal to the median RSI. Additionally, the script highlights bars when they cross the median RSI, providing visual cues for potential shifts in market momentum.
**Benefits:**
- **RSI Insights:** Provides insights into the relative strength of a security by comparing its recent gains to its recent losses.
- **Buy/Sell Signals:** Generates buy and sell signals based on the RSI crossing above or below the median RSI, aiding traders in timing their trades.
- **Customizable Bar Colors:** Allows traders to customize bar colors based on the relationship between the RSI and the median RSI, facilitating quick visual analysis.
- **Visual Representation:** Visualizes the RSI median RSI, and bar color on the price chart for easy interpretation.
**Ideal Usage:**
- **Trend Confirmation:** Traders can use the indicator to confirm the direction of the trend before entering trades.
- **Reversal Signals:** Changes in RSI direction, indicated by crosses above or below the median RSI, can signal potential reversals in market momentum.
- **Combination with Other Indicators:** It can be used in conjunction with other technical indicators to enhance trading strategies, providing additional confirmation signals.
**Warnings:**
- **False Signals:** Like any technical indicator, false signals may occur, especially during periods of low volume or choppy market conditions. Additional analysis and risk management techniques should be used to avoid potential losses.
- **Parameter Sensitivity:** Traders should test different parameter settings and consider market conditions when using the indicator, as adjustments may affect its sensitivity to price movements.
By providing insights into RSI dynamics, and offering customizable bar colors, the "Median RSI with Buy/Sell Signals and Bar Color" indicator equips traders with valuable tools for technical analysis and decision-making in the financial markets.

RMI Trend SniperThe "RMI Trend Sniper" is a powerful trend-following indicator designed to help traders identify potential buy and sell signals in the market.
It combines elements of the Relative Strength Index (RSI) and the Money Flow Index (MFI) to provide a comprehensive view of market momentum and strength.
🔷 Key Features:
🔹 Customizable Settings : Tailor the indicator to your trading preferences with customizable input parameters, including RSI and MFI lengths, threshold levels, and visual settings.
🔹 Momentum Signals : The indicator generates clear bullish and bearish momentum signals, allowing you to spot potential trend reversals or continuations.
🔹 The positive condition considers the previous RMI value, current RMI value, and positive change in the 5-period exponential moving average (EMA) of the closing price.
🔹 The negative condition looks at the current RMI value and negative change in the 5-period EMA.
🔹 Visual Bands : Visualize market volatility with dynamically plotted bands around the Range Weighted Moving Average (RWMA), providing insights into potential price fluctuations.
🔹 Candlestick Coloring : Easily identify bullish and bearish conditions with color-coded candlesticks, helping you make informed trading decisions.
The "RMI Trend Sniper" is a versatile tool suitable for traders of all experience levels. Whether you are a novice or an experienced trader, this indicator can help you enhance your technical analysis and improve your trading strategies.

Trend_Trader_WMA (Momentum)<---> Caution! This is first test version of indicator. I am ready to get more ideas+feedback to develop it more. <--->
The "Momentum_Trader_WMA" indicator is a versatile technical analysis tool designed to help traders identify potential trend changes and momentum shifts in the market. It combines multiple indicators and moving averages to provide a comprehensive view of price action and momentum.
Key Features:
Weighted Moving Averages (WMAs): The indicator calculates two different WMAs with user-defined lengths, providing a smoothed representation of price data.
Average True Range (ATR) Bands: ATR is used to calculate dynamic bands around the WMA Average. These bands can help traders gauge market volatility and potential breakout points. The color of the ATR bands can be seen as an early signal of trends or the continuation of current trends.
Commodity Channel Index (CCI): CCI is a momentum oscillator that measures the relative strength of price changes. The indicator calculates CCI values based on a user-defined period.
Exponential Moving Average (EMA) of CCI: An EMA of CCI is plotted to help identify trends and momentum shifts.
Color-Coded Bands: The ATR bands change colors based on CCI conditions, providing visual cues for potential trading opportunities. When ATR bands transition from narrow (indicating low volatility) to wide (indicating increased volatility), it can be seen as an early signal of a potential trend change or the continuation of the current trend.
Buy and Sell Signals: The indicator generates buy and sell signals based on crossovers of WMAs and CCI thresholds, making it easier for traders to identify entry and exit points.
Customizable Moving Averages: Traders can enable or disable different moving averages (e.g., SMA, EMA, WMA, RMA, VWMA, HMA) with various periods and colors to adapt the indicator to their trading preferences.
CCI Dot Alerts: Dots are displayed at the bottom of the chart based on CCI values, helping traders spot extreme CCI conditions.
How to Use:
Trend Identification: The WMAs and ATR bands can help identify the current trend direction and its strength. When the WMAs are in an uptrend (green) and the ATR bands widen, it may indicate a strong bullish trend. Conversely, when the WMAs are in a downtrend (red) and the ATR bands narrow, it may suggest a weakening bearish trend.
Momentum Confirmation: The CCI and its EMA provide insights into market momentum. Look for CCI crossovers above 100 for potential bullish momentum and below -100 for potential bearish momentum.
Buy and Sell Signals: Pay attention to the buy and sell signals generated by the indicator. Buy when the WMAs cross over and CCI crosses above 100. Sell when the WMAs cross under and CCI crosses below -100.
ATR Bands as Early Signals: The color changes in the ATR bands can be seen as early signals of trends or the continuation of current trends. Wide ATR bands may indicate increased volatility and potential trend changes, while narrow ATR bands suggest reduced volatility and potential trend continuation.
Moving Averages: Customize the indicator by enabling or disabling specific moving averages according to your preferred trading strategy.
CCI Dots: Use the CCI dots to identify extreme CCI conditions, which may indicate overbought or oversold market conditions.
PS:
Recommended to use Indicator with price action conecpts(eg. support and resistance) as they play important role in any market.
Buy and sell signals are not really accurate. I would personally look for trend shift in WMA middle line and confirmation from CCI dots at bottom. For example. If middle line turns green and within recent 3-4 candles (or next 3-4 candles) dots tunrns green also, that means momentum has been rised in the direction of bulls.
pls, take s/r concepts first when working. I am thinking to add more precise buy sell signal method to make it easier to trade.
Good luck with your trades :)

Zaree - FX Index RSI IndicatorDescription:
The "Zaree - FX Index RSI Indicator" (FIRI) is a technical analysis tool designed to provide insights into the relative strength of two selected currency indices using the Relative Strength Index (RSI). It allows traders to compare the RSI values of a primary currency index and a secondary currency index, helping them identify potential overbought and oversold conditions in the currency market.
Details of the Indicator:
The indicator calculates the RSI for both the primary and secondary currency indices based on the user's selections.
Traders can choose from a variety of currency indices to use as the primary and secondary indices for comparison.
The indicator offers settings for customizing the calculation of the RSI, including selecting the type of moving average (SMA, EMA, WMA, SMMA) and adjusting the length of the RSI and moving average.
Upper and lower RSI bands are displayed on the chart to highlight potential overbought and oversold conditions.
The RSI values and their corresponding moving average values are plotted on the chart, allowing traders to visually analyze the relative strength of the indices.
How to Use the Indicator:
Select the primary and secondary currency indices you want to compare from the provided dropdown menus. These indices will serve as the basis for RSI calculation.
Choose the type of moving average (SMA, EMA, WMA, SMMA) to use for RSI calculation and set the desired length for the moving average.
Decide whether you want to visualize the RSI and moving average values for the primary and secondary indices on the chart.
Observe the RSI values and moving averages plotted on the chart. The indicator's upper and lower bands can help you identify potential overbought (above the upper band) and oversold (below the lower band) conditions.
Pay attention to the intersections between the RSI values and the moving average lines. These intersections can provide insights into potential trend changes or reversals in the currency market.
Example of Usage:
Let's say you're a swing trader focusing on currency pairs involving the US Dollar (USD) and Euro (EUR). You want to compare the relative strength of the USD Index (USDINX) and the EUR Index (EURINX) to identify potential trading opportunities. Here's how you can use the FIRI indicator:
Select "USDINX" as the primary index and "EURINX" as the secondary index.
Choose "SMA" as the moving average type and set the RSI length to 14.
Enable the visualization of RSI values for both the primary and secondary indices.
Observe the chart to identify instances where the RSI values of the indices cross above the upper band (potential overbought) or below the lower band (potential oversold).
Look for intersections between the RSI values and the moving average lines. A bullish signal may occur when the RSI crosses above the moving average, indicating potential upward momentum, while a bearish signal may occur when the RSI crosses below the moving average, indicating potential downward momentum.
Remember that the FIRI indicator is a tool to assist you in your analysis. It's important to consider other technical and fundamental factors before making trading decisions.
Feel free to adjust the settings of the indicator based on your trading preferences and strategy. Keep in mind that no indicator is foolproof, and it's recommended to use the FIRI indicator in conjunction with other analysis techniques for a comprehensive trading approach.

Multi-Timeframe Trend Detector [Alifer]Here is an easy-to-use and customizable multi-timeframe visual trend indicator.
The indicator combines Exponential Moving Averages (EMA), Moving Average Convergence Divergence (MACD), and Relative Strength Index (RSI) to determine the trend direction on various timeframes: 15 minutes (15M), 30 minutes (30M), 1 hour (1H), 4 hours (4H), 1 day (1D), and 1 week (1W).
EMA Trend : The script calculates two EMAs for each timeframe: a fast EMA and a slow EMA. If the fast EMA is greater than the slow EMA, the trend is considered Bullish; if the fast EMA is less than the slow EMA, the trend is considered Bearish.
MACD Trend : The script calculates the MACD line and the signal line for each timeframe. If the MACD line is above the signal line, the trend is considered Bullish; if the MACD line is below the signal line, the trend is considered Bearish.
RSI Trend : The script calculates the RSI for each timeframe. If the RSI value is above a specified Bullish level, the trend is considered Bullish; if the RSI value is below a specified Bearish level, the trend is considered Bearish. If the RSI value is between the Bullish and Bearish levels, the trend is Neutral, and no arrow is displayed.
Dashboard Display :
The indicator prints arrows on the dashboard to represent Bullish (▲ Green) or Bearish (▼ Red) trends for each timeframe.
You can easily adapt the Dashboard colors (Inputs > Theme) for visibility depending on whether you're using a Light or Dark theme for TradingView.
Usage :
You can adjust the indicator's settings such as theme (Dark or Light), EMA periods, MACD parameters, RSI period, and Bullish/Bearish levels to adapt it to your specific trading strategies and preferences.
Disclaimer :
This indicator is designed to quickly help you identify the trend direction on multiple timeframes and potentially make more informed trading decisions.
You should consider it as an extra tool to complement your strategy, but you should not solely rely on it for making trading decisions.
Always perform your own analysis and risk management before executing trades.
The indicator will only show a Dashboard. The EMAs, RSI and MACD you see on the chart image have been added just to demonstrate how the script works.
DETAILED SCRIPT EXPLANATION
INPUTS:
theme : Allows selecting the color theme (options: "Dark" or "Light").
emaFastPeriod : The period for the fast EMA.
emaSlowPeriod : The period for the slow EMA.
macdFastLength : The fast length for MACD calculation.
macdSlowLength : The slow length for MACD calculation.
macdSignalLength : The signal length for MACD calculation.
rsiPeriod : The period for RSI calculation.
rsiBullishLevel : The level used to determine Bullish RSI condition, when RSI is above this value. It should always be higher than rsiBearishLevel.
rsiBearishLevel : The level used to determine Bearish RSI condition, when RSI is below this value. It should always be lower than rsiBullishLevel.
CALCULATIONS:
The script calculates EMAs on multiple timeframes (15-minute, 30-minute, 1-hour, 4-hour, daily, and weekly) using the request.security() function.
Similarly, the script calculates MACD values ( macdLine , signalLine ) on the same multiple timeframes using the request.security() function along with the ta.macd() function.
RSI values are also calculated for each timeframe using the request.security() function along with the ta.rsi() function.
The script then determines the EMA trends for each timeframe by comparing the fast and slow EMAs using simple boolean expressions.
Similarly, it determines the MACD trends for each timeframe by comparing the MACD line with the signal line.
Lastly, it determines the RSI trends for each timeframe by comparing the RSI values with the Bullish and Bearish RSI levels.
PLOTTING AND DASHBOARD:
Color codes are defined based on the EMA, MACD, and RSI trends for each timeframe. Green for Bullish, Red for Bearish.
A dashboard is created using the table.new() function, displaying the trend information for each timeframe with arrows representing Bullish or Bearish conditions.
The dashboard will appear in the top-right corner of the chart, showing the Bullish and Bearish trends for each timeframe (15M, 30M, 1H, 4H, 1D, and 1W) based on EMA, MACD, and RSI analysis. Green arrows represent Bullish trends, red arrows represent Bearish trends, and no arrows indicate Neutral conditions.
INFO ON USED INDICATORS:
1 — EXPONENTIAL MOVING AVERAGE (EMA)
The Exponential Moving Average (EMA) is a type of moving average (MA) that places a greater weight and significance on the most recent data points.
The EMA is calculated by taking the average of the true range over a specified period. The true range is the greatest of the following:
The difference between the current high and the current low.
The difference between the previous close and the current high.
The difference between the previous close and the current low.
The EMA can be used by traders to produce buy and sell signals based on crossovers and divergences from the historical average. Traders often use several different EMA lengths, such as 10-day, 50-day, and 200-day moving averages.
The formula for calculating EMA is as follows:
Compute the Simple Moving Average (SMA).
Calculate the multiplier for weighting the EMA.
Calculate the current EMA using the following formula:
EMA = Closing price x multiplier + EMA (previous day) x (1-multiplier)
2 — MOVING AVERAGE CONVERGENCE DIVERGENCE (MACD)
The Moving Average Convergence Divergence (MACD) is a popular trend-following momentum indicator used in technical analysis. It helps traders identify changes in the strength, direction, momentum, and duration of a trend in a financial instrument's price.
The MACD is calculated by subtracting a longer-term Exponential Moving Average (EMA) from a shorter-term EMA. The most commonly used time periods for the MACD are 26 periods for the longer EMA and 12 periods for the shorter EMA. The difference between the two EMAs creates the main MACD line.
Additionally, a Signal Line (usually a 9-period EMA) is computed, representing a smoothed version of the MACD line. Traders watch for crossovers between the MACD line and the Signal Line, which can generate buy and sell signals. When the MACD line crosses above the Signal Line, it generates a bullish signal, indicating a potential uptrend. Conversely, when the MACD line crosses below the Signal Line, it generates a bearish signal, indicating a potential downtrend.
In addition to the MACD line and Signal Line crossovers, traders often look for divergences between the MACD and the price chart. Divergence occurs when the MACD is moving in the opposite direction of the price, which can suggest a potential trend reversal.
3 — RELATIVE STRENGHT INDEX (RSI):
The Relative Strength Index (RSI) is another popular momentum oscillator used by traders to assess the overbought or oversold conditions of a financial instrument. The RSI ranges from 0 to 100 and measures the speed and change of price movements.
The RSI is calculated based on the average gain and average loss over a specified period, commonly 14 periods. The formula involves several steps:
Calculate the average gain over the specified period.
Calculate the average loss over the specified period.
Calculate the relative strength (RS) by dividing the average gain by the average loss.
Calculate the RSI using the following formula: RSI = 100 - (100 / (1 + RS))
The RSI oscillates between 0 and 100, where readings above 70 are considered overbought, suggesting that the price may have risen too far and could be due for a correction. Readings below 30 are considered oversold, suggesting that the price may have dropped too much and could be due for a rebound.
Traders often use the RSI to identify potential trend reversals. For example, when the RSI crosses above 30 from below, it may indicate the start of an uptrend, and when it crosses below 70 from above, it may indicate the start of a downtrend. Additionally, traders may look for bullish or bearish divergences between the RSI and the price chart, similar to the MACD analysis, to spot potential trend changes.

Variety Step RSI w/ Dynamic Zones [Loxx]Variety Step RSI w/ Dynamic Zones is a stepped RSI calculation with Discontinued Signal Lines. This indicator includes 7 types of RSI to choose from. The addition of the Discontinued Signal Lines allows this indicator to better identify momentum shifts in price so traders have better defined long/short signals.
Enhanced Moving Average Calculation with Stepped Moving Average and the Advantages over Regular RSI
Technical analysis plays a crucial role in understanding and predicting market trends. One popular indicator used by traders and analysts is the Relative Strength Index (RSI). However, an enhanced approach called Stepped Moving Average, in combination with the Slow RSI function, offers several advantages over regular RSI calculations.
█ Stepped Moving Average and Moving Averages:
The Stepped Moving Average function serves as a crucial component in the calculation of moving averages. Moving averages smooth out price data over a specific period to identify trends and potential trading signals. By employing the Stepped Moving Average function, traders can enhance the accuracy of moving averages and make more informed decisions.
Stepped Moving Average takes two parameters:
The current RSI value and a size parameter. It computes the next step in the moving average calculation by determining the upper and lower bounds of the moving average range. It accomplishes this by adjusting the values of smax and smin based on the given RSI and size.
Furthermore, Stepped Moving Average introduces the concept of a trend variable. By comparing the previous trend value with the current RSI and the previous upper and lower bounds, it updates the trend accordingly. This feature enables traders to identify potential shifts in market sentiment and make timely adjustments to their trading strategies.
█ Advantages over Regular RSI:
Enhanced Range Boundaries:
The inclusion of size parameters in Stepped Moving Average allows for more precise determination of the upper and lower bounds of the moving average range. This feature provides traders with a clearer understanding of the potential price levels that can influence market behavior. Consequently, it aids in setting more effective entry and exit points for trades.
Improved Trend Identification:
The trend variable in Stepped Moving Average helps traders identify changes in market trends more accurately. By considering the previous trend value and comparing it to the current RSI and previous bounds, Stepped Moving Average captures trend reversals with greater precision. This capability empowers traders to respond swiftly to market shifts and potentially capture more profitable trading opportunities.
Smoother Moving Averages:
Stepped Moving Average's ability to adjust the moving average range bounds based on trend changes and size parameters results in smoother moving averages. Regular RSI calculations may produce jagged or erratic results due to abrupt market movements. Stepped Moving Average mitigates this issue by dynamically adapting the range boundaries, thereby providing traders with more reliable and consistent moving average signals.
Complementary Functionality with Slow RSI:
Stepped Moving Average and Slow RSI function in harmony to provide a comprehensive trading analysis toolkit. While Stepped Moving Average refines the moving average calculation process, Slow RSI offers a more accurate representation of market strength. The combination of these two functions facilitates a deeper understanding of market dynamics and assists traders in making better-informed decisions.
What is a Discontinued Signal Line (DSL)?
Many indicators employ signal lines to more easily identify trends or desired states of the indicator. The concept of a signal line is straightforward: by comparing a value to its smoothed, slightly lagging state, one can determine the current momentum or state.
The Discontinued Signal Line builds on this fundamental idea by extending it: rather than having a single signal line, multiple lines are used based on the indicator's current value.
The "signal" line is calculated as follows:
When a specific level is crossed in the desired direction, the EMA of that value is calculated for the intended signal line.
When that level is crossed in the opposite direction, the previous "signal" line value is "inherited," becoming a sort of level.
This approach combines signal lines and levels, aiming to integrate the advantages of both methods.
In essence, DSL enhances the signal line concept by inheriting the previous signal line's value and converting it into a level.
Extras
-Alerts
-Signals
Related indicators:
Step RSI

Step RSI [Loxx]Enhanced Moving Average Calculation with Stepped Moving Average and the Advantages over Regular RSI
Technical analysis plays a crucial role in understanding and predicting market trends. One popular indicator used by traders and analysts is the Relative Strength Index (RSI). However, an enhanced approach called Stepped Moving Average, in combination with the Slow RSI function, offers several advantages over regular RSI calculations.
Stepped Moving Average and Moving Averages:
The Stepped Moving Average function serves as a crucial component in the calculation of moving averages. Moving averages smooth out price data over a specific period to identify trends and potential trading signals. By employing the Stepped Moving Average function, traders can enhance the accuracy of moving averages and make more informed decisions.
Stepped Moving Average takes two parameters: the current RSI value and a size parameter. It computes the next step in the moving average calculation by determining the upper and lower bounds of the moving average range. It accomplishes this by adjusting the values of smax and smin based on the given RSI and size.
Furthermore, Stepped Moving Average introduces the concept of a trend variable. By comparing the previous trend value with the current RSI and the previous upper and lower bounds, it updates the trend accordingly. This feature enables traders to identify potential shifts in market sentiment and make timely adjustments to their trading strategies.
Advantages over Regular RSI:
Enhanced Range Boundaries:
The inclusion of size parameters in Stepped Moving Average allows for more precise determination of the upper and lower bounds of the moving average range. This feature provides traders with a clearer understanding of the potential price levels that can influence market behavior. Consequently, it aids in setting more effective entry and exit points for trades.
Improved Trend Identification:
The trend variable in Stepped Moving Average helps traders identify changes in market trends more accurately. By considering the previous trend value and comparing it to the current RSI and previous bounds, Stepped Moving Average captures trend reversals with greater precision. This capability empowers traders to respond swiftly to market shifts and potentially capture more profitable trading opportunities.
Smoother Moving Averages:
Stepped Moving Average's ability to adjust the moving average range bounds based on trend changes and size parameters results in smoother moving averages. Regular RSI calculations may produce jagged or erratic results due to abrupt market movements. Stepped Moving Average mitigates this issue by dynamically adapting the range boundaries, thereby providing traders with more reliable and consistent moving average signals.
Complementary Functionality with Slow RSI:
Stepped Moving Average and Slow RSI function in harmony to provide a comprehensive trading analysis toolkit. While Stepped Moving Average refines the moving average calculation process, Slow RSI offers a more accurate representation of market strength. The combination of these two functions facilitates a deeper understanding of market dynamics and assists traders in making better-informed decisions.
Extras
-Alerts
-Signals

Cobra's CryptoMarket VisualizerCobra's Crypto Market Screener is designed to provide a comprehensive overview of the top 40 marketcap cryptocurrencies in a table\heatmap format. This indicator incorporates essential metrics such as Beta, Alpha, Sharpe Ratio, Sortino Ratio, Omega Ratio, Z-Score, and Average Daily Range (ADR). The table utilizes cell coloring resembling a heatmap, allowing for quick visual analysis and comparison of multiple cryptocurrencies.
The indicator also includes a shortened explanation tooltip of each metric when hovering over it's respected cell. I shall elaborate on each here for anyone interested.
Metric Descriptions:
1. Beta: measures the sensitivity of an asset's returns to the overall market returns. It indicates how much the asset's price is likely to move in relation to a benchmark index. A beta of 1 suggests the asset moves in line with the market, while a beta greater than 1 implies the asset is more volatile, and a beta less than 1 suggests lower volatility.
2. Alpha: is a measure of the excess return generated by an investment compared to its expected return, given its risk (as indicated by its beta). It assesses the performance of an investment after adjusting for market risk. Positive alpha indicates outperformance, while negative alpha suggests underperformance.
3. Sharpe Ratio: measures the risk-adjusted return of an investment or portfolio. It evaluates the excess return earned per unit of risk taken. A higher Sharpe ratio indicates better risk-adjusted performance, as it reflects a higher return for each unit of volatility or risk.
4. Sortino Ratio: is a risk-adjusted measure similar to the Sharpe ratio but focuses only on downside risk. It considers the excess return per unit of downside volatility. The Sortino ratio emphasizes the risk associated with below-target returns and is particularly useful for assessing investments with asymmetric risk profiles.
5. Omega Ratio: measures the ratio of the cumulative average positive returns to the cumulative average negative returns. It assesses the reward-to-risk ratio by considering both upside and downside performance. A higher Omega ratio indicates a higher reward relative to the risk taken.
6. Z-Score: is a statistical measure that represents the number of standard deviations a data point is from the mean of a dataset. In finance, the Z-score is commonly used to assess the financial health or risk of a company. It quantifies the distance of a company's financial ratios from the average and provides insight into its relative position.
7. Average Daily Range: ADR represents the average range of price movement of an asset during a trading day. It measures the average difference between the high and low prices over a specific period. Traders use ADR to gauge the potential price range within which an asset might fluctuate during a typical trading session.
Utility:
Comprehensive Overview: The indicator allows for monitoring up to 40 cryptocurrencies simultaneously, providing a consolidated view of essential metrics in a single table.
Efficient Comparison: The heatmap-like coloring of the cells enables easy visual comparison of different cryptocurrencies, helping identify relative strengths and weaknesses.
Risk Assessment: Metrics such as Beta, Alpha, Sharpe Ratio, Sortino Ratio, and Omega Ratio offer insights into the risk associated with each cryptocurrency, aiding risk assessment and portfolio management decisions.
Performance Evaluation: The Alpha, Sharpe Ratio, and Sortino Ratio provide measures of a cryptocurrency's performance adjusted for risk. This helps assess investment performance over time and across different assets.
Market Analysis: By considering the Z-Score and Average Daily Range (ADR), traders can evaluate the financial health and potential price volatility of cryptocurrencies, aiding in trade selection and risk management.
Features:
Reference period optimization, alpha and ADR in particular
Source calculation
Table sizing and positioning options to fit the user's screen size.
Tooltips
Important Notes -
1. The Sharpe, Sortino and Omega ratios cell coloring threshold might be subjective, I did the best I can to gauge the median value of each to provide more accurate coloring sentiment, it may change in the future.
The median values are : Sharpe -1, Sortino - 1.5, Omega - 20.
2. Limitations - Some cryptos have a Z-Score value of NaN due to their short lifetime, I tried to overcome this issue as with the rest of the metrics as best I can. Moreover, it limits the time horizon for replay mode to somewhere around Q3 of 2021 and that's with using the split option of the top half, to remain with the older cryptos.
3. For the beginner Pine enthusiasts, I recommend scimming through the script as it serves as a prime example of using key features, to name a few : Arrays, User Defined Functions, User Defined Types, For loops, Switches and Tables.
4. Beta and Alpha's benchmark instrument is BTC, due to cryptos volatility I saw no reason to use SPY or any other asset for that matter.

Exhaustion Improved Scalping Consolidation and Squeeze IndicatorThis custom indicator, called " Exhaustion & Improved Scalping Consolidation and Squeeze Indicator," is designed to help traders identify potential trading opportunities in the context of price consolidations, squeezes, and momentum exhaustion. It is an overlay indicator that combines several popular technical analysis tools, including the Relative Strength Index (RSI), Moving Average Convergence Divergence (MACD), Bollinger Bands, Keltner Channels, and Rate of Change (ROC). By analyzing these metrics, the indicator aims to provide visual cues on price charts to support better decision-making in the markets.
Use Case for Trading:
Consolidation Detection: The indicator identifies periods of price consolidation, which typically occur when a market is experiencing low volatility and trading in a narrow range. During these periods, the RSI value is between 45 and 55, the MACD histogram is close to zero, and the ROC value is low. The indicator highlights these consolidation periods by coloring the price bars yellow. Traders can use this information to anticipate potential breakouts and prepare for a possible trend initiation.
Squeeze Detection: The indicator detects squeezes by comparing the Bollinger Bands and Keltner Channels. A squeeze occurs when the Bollinger Bands are within the Keltner Channels, indicating that price volatility is decreasing. The indicator colors the price bars orange during a squeeze, which can be a signal for traders to watch for an upcoming increase in volatility and potential trend expansion.
Momentum Exhaustion Detection: The indicator identifies exhaustion in momentum by analyzing the RSI and MACD histogram. When the RSI is above 70, indicating overbought conditions, and the MACD histogram is decreasing, it may signal that the current upward momentum is losing strength. The indicator colors the price bars white in these situations. Traders can use this information to potentially exit long positions or prepare for a trend reversal.
