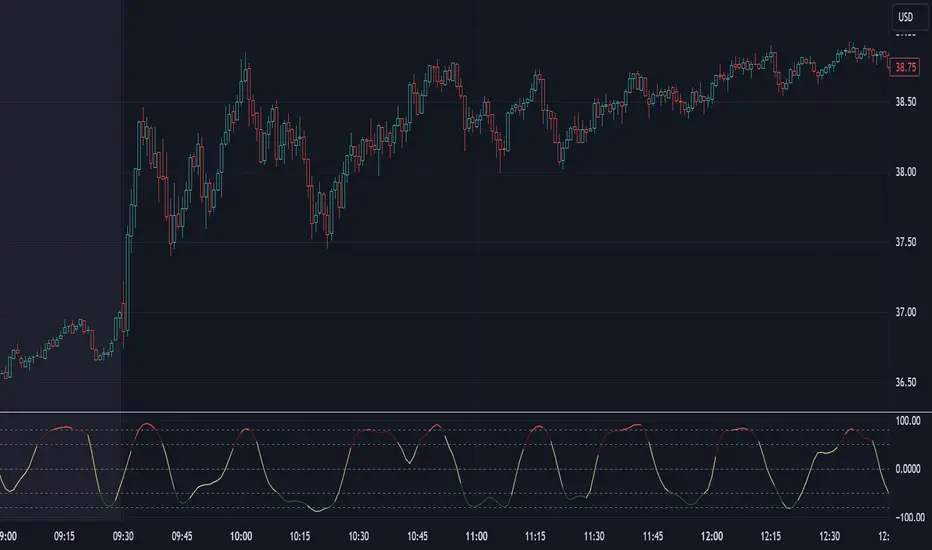
Alex JMA RSX Clone with Price & Divergence [LazyBear]Indicator Description:
RSX Indicator (RSXC_LB): This script is based on a clone of the JMA RSX (Relative Strength Index clone by LazyBear). It is a momentum-based indicator that helps identify overbought and oversold levels, as well as potential trend reversals.
Functional Changes:
Convergence is now marked with a white line on the RSX plot.
Bullish Divergence is marked with a green line, indicating potential upward movement.
Bearish Divergence is marked with a red line, indicating potential downward movement.
The default state is marked with a blue line.
Strong Divergences (both bullish and bearish) are highlighted with triangle markers on the chart.
Updated Features:
The script now visualizes convergence and divergence more clearly using distinct colors:
White: Convergence (indicates potential trend strength).
Green: Bullish divergence (possible price increase).
Red: Bearish divergence (possible price decrease).
Blue: Neutral/default state.
Triangle markers indicate strong divergences, making it easier for the user to spot critical moments.
This visual enhancement aims to provide clearer and more intuitive signals for traders using the RSX indicator, helping them identify trend changes and reversals more effectively.
Search in scripts for "relative strength"

ATT Model with Buy/Sell SignalsIndicator Summary
This indicator is based on the ATT (Arithmetic Time Theory) model, using specific turning points derived from the ATT sequence (3, 11, 17, 29, 41, 47, 53, 59) to identify potential market reversals. It also integrates the RSI (Relative Strength Index) to confirm overbought and oversold conditions, triggering buy and sell signals when conditions align with the ATT sequence and RSI level.
Turning Points: Detected based on the ATT sequence applied to bar count. This suggests high-probability areas where the market could turn.
RSI Filter: Adds strength to the signals by ensuring buy signals occur when RSI is oversold (<30) and sell signals when RSI is overbought (>70).
Max Signals Per Session: Limits signals to two per session to reduce over-trading.
Entry Criteria
Buy Signal: Enter a buy trade if:
The indicator displays a green "BUY" marker.
RSI is below the oversold level (default <30), suggesting a potential upward reversal.
Sell Signal: Enter a sell trade if:
The indicator displays a red "SELL" marker.
RSI is above the overbought level (default >70), indicating a potential downward reversal.
Exit Criteria
Take Profit (TP):
Define TP as a fixed percentage or point value based on the asset's volatility. For example, set TP at 1.5-2x the risk, or a predefined point target (like 50-100 points).
Alternatively, exit the position when price approaches a key support/resistance level or the next significant swing high/low.
Stop Loss (SL):
Place the SL below the recent low (for buys) or above the recent high (for sells).
Set a fixed SL in points or percentage based on the asset’s average movement range, like an ATR-based stop, or limit it to a specific risk amount per trade (1-2% of account).
Trailing into Profit
Use a trailing strategy to lock in profits and let winning trades run further. Two main options:
ATR Trailing Stop:
Set the trailing stop based on the ATR (Average True Range), adjusting every time a new candle closes. This can help in volatile markets by keeping the stop at a consistent distance based on recent price movement.
Break-Even and Partial Profits:
When the price moves in your favor by a set amount (e.g., 1:1 risk/reward), move SL to the entry (break-even).
Take partial profit at intermediate levels (e.g., 50% at 1:1 RR) and trail the remainder.
Risk Management for Prop Firm Evaluation
Prop firms often have strict rules on daily loss limits, max drawdowns, and minimum profit targets. Here’s how to align your strategy with these:
Limit Risk per Trade:
Keep risk per trade to a conservative level (e.g., 1% or lower of your account balance). This allows for more room in case of a drawdown and aligns with most prop firm requirements.
Daily Loss Limits:
Set a daily stop-loss that ensures you don’t exceed the firm’s rules. For example, if the daily limit is 5%, stop trading once you reach a 3-4% drawdown.
Avoid Over-Trading:
Stick to the max signals per session rule (one or two trades). Taking only high-probability setups reduces emotional and reactive trades, preserving capital.
Stick to a Profit Target:
Aim to meet the evaluation’s profit goal efficiently but avoid risky or oversized trades to reach it faster.
Avoid Major Economic Events:
News events can disrupt technical setups. Avoid trading around significant releases (like FOMC or NFP) to reduce the chance of sudden losses due to high volatility.
Summary
Using this strategy with discipline, a structured entry/exit approach, and tight risk management can maximize your chances of passing a prop firm evaluation. The ATT model’s turning points, combined with the RSI, provide an edge by highlighting reversal zones, while limiting trades to 1-2 per session helps maintain controlled risk.

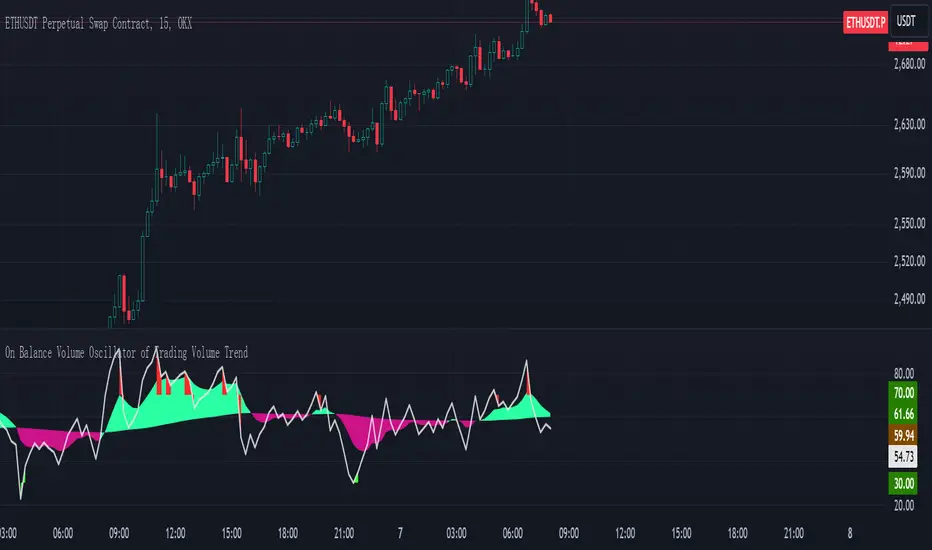
On Balance Volume Oscillator of Trading Volume TrendOn Balance Volume Oscillator of Trading Volume Trend
Introduction
This indicator, the "On Balance Volume Oscillator of Trading Volume Trend," is a technical analysis tool designed to provide insights into market momentum and potential trend reversals by combining the On Balance Volume (OBV) and Relative Strength Index (RSI) indicators.
Calculation and Methodology
* OBV Calculation: The indicator first calculates the On Balance Volume, which is a cumulative total of the volume of up days minus the volume of down days. This provides a running tally of buying and selling pressure.
* RSI of OBV: The RSI is then applied to the OBV values to smooth the data and identify overbought or oversold conditions.
* Exponential Moving Averages (EMAs): Two EMAs are calculated on the RSI of OBV. A shorter-term EMA (9-period in this case) and a longer-term EMA (100-period) are used to generate signals.
Interpretation and Usage
* EMA Crossovers: When the shorter-term EMA crosses above the longer-term EMA, it suggests increasing bullish momentum. Conversely, a downward crossover indicates weakening bullish momentum or increasing bearish pressure.
* RSI Divergences: Divergences between the price and the indicator can signal potential trend reversals. For example, if the price is making new highs but the indicator is failing to do so, it could be a bearish divergence.
* Overbought/Oversold Conditions: When the RSI of OBV is above 70, it suggests the market may be overbought and a potential correction could be imminent. Conversely, when it is below 30, it suggests the market may be oversold.
Visual Representation
The indicator is plotted on a chart with multiple lines and filled areas:
* Two EMAs: The shorter-term EMA and longer-term EMA are plotted to show the trend of the OBV.
* Filled Areas: The area between the two EMAs is filled with a color to indicate the strength of the trend. The color changes based on whether the shorter-term EMA is above or below the longer-term EMA.
* RSI Bands: Horizontal lines at 30 and 70 mark the overbought and oversold levels for the RSI of OBV.
Summary
The On Balance Volume Oscillator of Trading Volume Trend provides a comprehensive view of market momentum and can be a valuable tool for traders. By combining the OBV and RSI, this indicator helps identify potential trend reversals, overbought and oversold conditions, and the strength of the current trend.
Note: This indicator should be used in conjunction with other technical analysis tools and fundamental analysis to make informed trading decisions.
VolWRSI### Description of the `VolWRSI` Script
The `VolWRSI` script is a TradingView Pine Script indicator designed to provide a volume-weighted Relative Strength Index (RSI) combined with abnormal activity detection in both volume and price. This multi-faceted approach aims to enhance trading decisions by identifying potential market conditions influenced by both price movements and trading volume.
#### Key Features
1. **Volume-Weighted RSI Calculation**:
- The core of the script calculates a volume-weighted RSI, which gives more significance to price movements associated with higher volume. This helps traders understand the strength of price movements more accurately.
2. **Abnormal Activity Detection**:
- The script includes calculations for abnormal volume and price changes using standard deviation (SD) multiples. This feature alerts traders to potential unusual activity, which could indicate upcoming volatility or market manipulation.
3. **Market Structure Filtering**:
- The script assesses market structure by identifying pivot highs and lows, allowing for better contextual analysis of price movements. This includes identifying bearish and bullish divergences, which can signal potential reversals.
4. **Color-Coded Signals**:
- The indicator visually represents market conditions using different bar colors for various scenarios, such as bearish divergence, likely price manipulation, and high-risk moves on low volume. This allows traders to quickly assess market conditions at a glance.
5. **Conditional Signal Line**:
- The signal line is displayed only when institutional activity conditions are met, remaining hidden otherwise. This adds an extra layer of filtering to prevent unnecessary signals, focusing only on significant market moves.
6. **Overbought and Oversold Levels**:
- The script defines overbought and oversold thresholds, enhancing the trader's ability to spot potential reversal points. Color gradients help visually distinguish between these critical levels.
7. **Alerts**:
- The script includes customizable alert conditions for various market signals, including abnormal volume spikes and RSI crossings over specific thresholds. This keeps traders informed in real-time, enhancing their ability to act promptly.
#### Benefits of Using the `VolWRSI` Script
- **Enhanced Decision-Making**: By integrating volume into the RSI calculation, the script helps traders make more informed decisions based on the strength of price movements rather than price alone.
- **Early Detection of Market Manipulation**: The abnormal activity detection can help traders identify potentially manipulative market behavior, allowing them to act or adjust their strategies accordingly.
- **Visual Clarity**: The use of color-coding and graphical elements (such as shapes and fills) provides clear visual cues about market conditions, which can be especially beneficial for traders who rely on quick visual assessments.
- **Risk Management**: The identification of high-risk low-volume moves helps traders manage their exposure better, potentially avoiding trades that may lead to unfavorable outcomes.
- **Reduced Noise with Institutional Activity Filtering**: The conditional signal line only plots when institutional activity conditions are detected, providing higher confidence in signals by excluding lower-conviction setups.
- **Customization**: With adjustable parameters for length, thresholds, and colors, traders can tailor the script to their specific trading styles and preferences.
Overall, the `VolWRSI` script combines technical analysis tools in a coherent framework, aiming to provide traders with deeper insights into market dynamics and higher-quality trade signals, potentially leading to more profitable trading decisions.

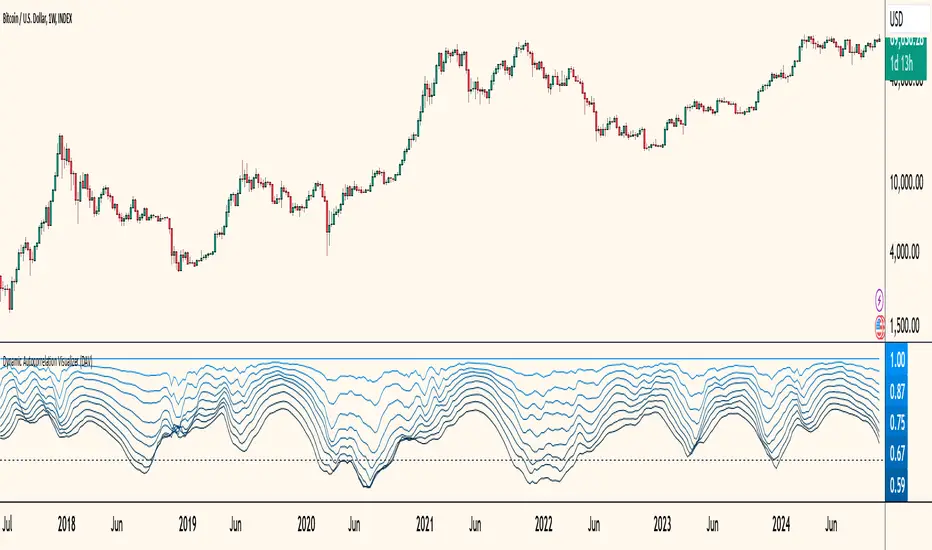
Dynamic Autocorrelation Visualizer (YavuzAkbay)The Dynamic Autocorrelation Visualizer (DAV) is a specialized indicator that analyzes and displays the autocorrelation of closing prices over multiple time lags. The autocorrelation function is a well-established economic calculation that measures how past price movements correlate with current prices at various intervals. This indicator implements this function to provide traders with insights into how these correlations evolve over time, enabling them to identify shifts in market behavior and trends.
Key Features and Functionality
1. Input Parameters:
Max Lag: This parameter determines the maximum number of lags for which the autocorrelation will be calculated. By default, it is set to 10, allowing traders to observe the correlation from the most recent price up to 10 periods back.
Calculation Period: The period over which the autocorrelation is calculated, set by default to 50. This setting allows users to adapt the analysis to different time frames depending on their trading strategies.
2. Autocorrelation Calculation:
The DAV calculates the average closing price over the specified period using the Simple Moving Average (SMA). This average serves as a reference point for measuring deviations in price behavior.
It then computes the denominator for the autocorrelation formula, which is the sum of the squared differences between each closing price and the average price. This normalization ensures that the autocorrelation values are meaningful and statistically valid.
For each specified lag (from 0 to max_lag - 1), the indicator calculates the numerator by summing the product of deviations from the mean for both the current and lagged prices. The autocorrelation value for each lag is then derived by dividing the numerator by the denominator, producing a set of autocorrelation values that reflect the strength and direction of price relationships over time.
3. Visualization:
The results for each lag's autocorrelation are plotted as individual lines on the chart, each differentiated by color to represent different lag periods.
A zero line is drawn as a reference, helping traders easily identify when autocorrelation values cross from positive to negative or vice versa.
The color gradient from the brightest blue (for lag 1) to darker shades indicates the relative strength of the autocorrelation for each lag, providing an immediate visual cue for analysis.
Indicator is Useful for
Seeing how correlation patterns evolve
Identifying periods where the market changes its behavior
Spotting when certain lag patterns become more or less significant
How to Use the DAV Indicator
Before using the indicator, it should be backtested on the chart and the mechanics should be learned. In general, if all lags of the indicator are above 0, it means that the trend is continuing. When the lags start to fall below 0 one by one, it means a trend reversal or instability. The indicator is in a sense a 90 degree freeze trace of the Autocorrelation indicator that I have also integrated into Tradingview (available in my profile), so it may be more understandable if used in conjunction with this indicator.
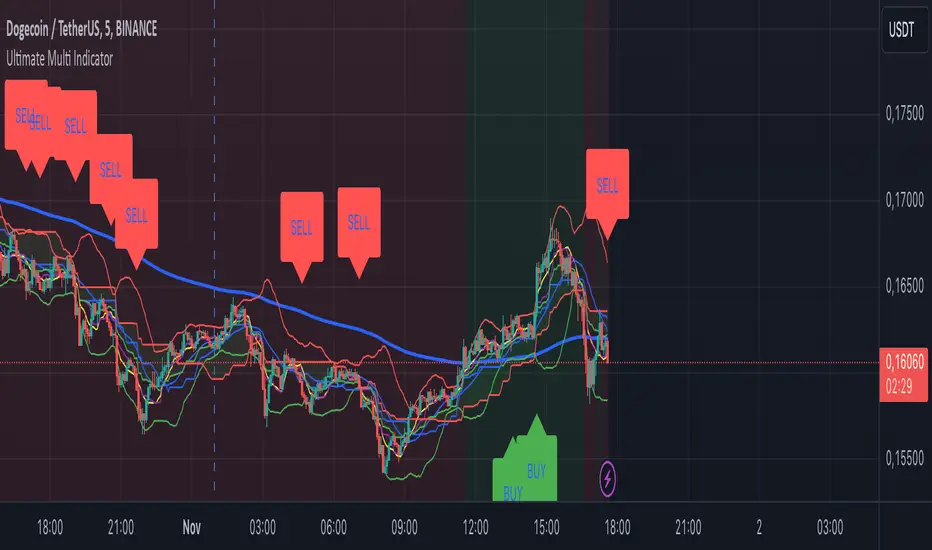
Ultimate Multi Indicator - by SachaThe Ultimate Multi Indicator: The Ultimate Guide To Profit
This custom indicator, the Ultimate Multi Indicator , integrates multiple trading indicators to have powerful buy and sell signals. I combined MACD, EMA, RSI, Bollinger Bands, Volume Profile, and Ichimoku Cloud indicators to help traders analyze both short-term and long-term price movements.
Key Components and How to Use Them
- MACD (Moving Average Convergence Divergence):
- Use for trend direction and potentiality of reversals.
- The blue line (MACD Line) crossing above the orange line (Signal Line) indicates a bullish reversal; the opposite signals a bearish reversal.
- Watch for crossovers to confirm the direction of smaller price movements.
- 200 EMA (Long) (Exponential Moving Average):
- Use to indicate a long-term trend direction.
- If the price is above the 200 EMA, the market is in an uptrend; below it suggests a downtrend.
- The chart’s background color shifts subtly green (uptrend) or red (downtrend) depending on the EMA's relative position.
- RSI (Relative Strength Index):
- Tracks momentum and overbought/oversold levels.
- RSI over 70 signifies overbought conditions; under 30 indicates oversold.
- Look for RSI turning points around these levels to identify potential reversals.
- Bollinger Bands :
- The price touching or crossing the upper Bollinger Band may mean overbought conditions are filled, while a touch at the lower band indicates oversold.
- Bollinger Band interactions often align with key reversal points, especially when combined with other signals.
- Volume Profile :
- A yellow VP line on the chart represents significant trading volume occurred.
- This line can be used as both a support and resistance level, and especially during consolidations or trend changes.
- Ichimoku Cloud :
- Identifies support/resistance levels and trend direction.
- Green and red cloud regions visually show if the price is above (bullish) or below (bearish) key levels.
- Price above the cloud (green) confirms a bullish market, while below (red) signals bearish.
Signal Conditions and Visualization
- Buy Signals :
- This is triggered right away when MACD crosses up, RSI is oversold, or price touches the lower Bollinger Band, provided price is above both the Ichimoku Cloud and the 200 EMA.
- A green “BUY” label appears below the bar, suggesting a potential entry.
- Sell Signals :
- This signal is generated when MACD crosses down, RSI is overbought, or price touches the upper Bollinger Band, and price is below the Ichimoku Cloud and the 200 EMA.
- A red “SELL” label is shown above the bar, indicating a potential exit.
Tips & Tricks
- Confirm Signals : Use multiple signals to confirm entries and exits. For example, if both the MACD and RSI align with the Ichimoku Cloud direction, the trade setup is stronger.
- Trend Directions : Only take buy signals if the price is above the 200 EMA, and sell signals if it is below, aligning trades with the overall trend.
- Adjust for Volatility : In high-volatility markets, especially in the crypto markets, pay close attention to the Bollinger Bands for breakout potential.
- Ichimoku as a Trend Guide : Use the Ichimoku Cloud as a guide for long-term support and resistance levels, especially for swing trades.
This multi-layered indicator gives a balanced blend of short-term signals and long-term trend insights, making it a versatile tool for day trading, swing trading, or even longer-term analysis.
Remember that indicators that will make you rich instantly don't exist. To expect minimum profit from them, you shouldn't trade all you have at the same time but only trade with the money you can afford to lose.
After that being said, I wish you traders luck with the Ultimate Multi Indicator!
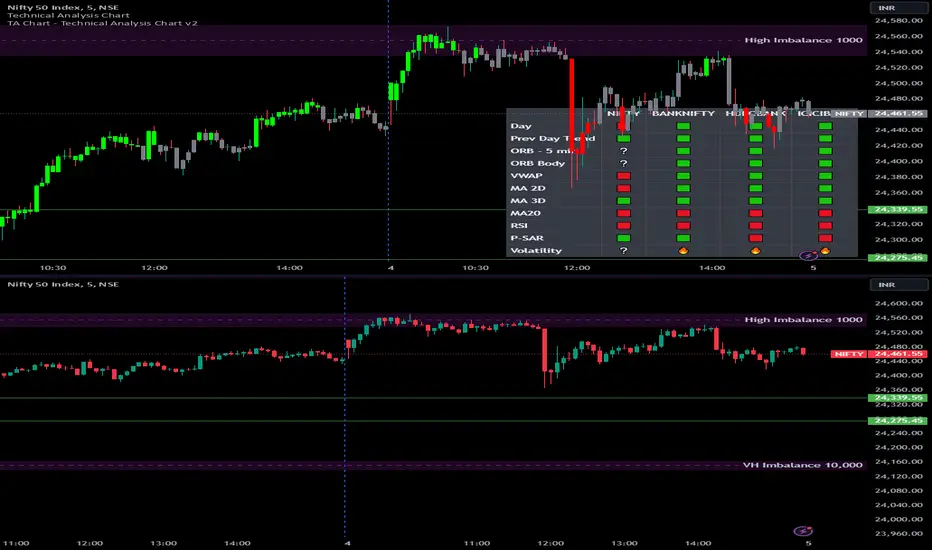
Options Series - Technical Analysis Chart➤ Simple Technical Chart Only:
➤ With MA-20 Overlay and Volatility background bars:
➤ With RSI Candles:
⭐ Overview and How It Works:
This script provides a multi-asset analysis tool to assess various market conditions across four symbols simultaneously. It combines several indicators such as daily price change, Moving Averages (MA), Bollinger Bands (BB), Parabolic SAR, RSI, and VWAP to generate buy/sell signals and trend indicators. Its strength lies in the layered use of indicators to enhance signal reliability, making it valuable for traders needing cross-validation in decision-making.
⭐ Key Features and Functionality:
The script evaluates each symbol's price against various indicators and conditions:
Daily Price Conditions: It checks if each symbol’s close price is above or below the previous day’s open, close, and intra-day ranges, forming a foundational bullish/bearish condition.
Range Breakout 1st 5min Candle (ORB): Opening Range Breakout levels are calculated and compared with current close prices, detecting breakout/breakdown conditions.
ORB Body: This basically calculates the previous day Daily candle body size, if todays Daily candle body size is greater than previous day, then we can say that we are having good momentum else its likely to be in-sidebar trading.
Moving Averages (MA): It leverages EMA-20, 2-day, and 3-day exponential moving averages to gauge short to medium-term trends.
RSI and VWAP: Relative Strength Index (RSI) determines overbought or oversold conditions, while VWAP compares prices to volume-weighted levels.
Bollinger Bands and Trend Analysis: Detects volatility and potential breakout conditions.
Concept of ORB Body:
Current_PrevDay_Body = (math.max(var_Current_PrevD_Open, var_Current_PrevD_Close) - math.min(var_Current_PrevD_Open, var_Current_PrevD_Close))
Current_Upper_ORB = var_Current_D_Open + Current_PrevDay_Body
Current_Lower_ORB = var_Current_D_Open - Current_PrevDay_Body
Current_TodayDay_Body = math.max(var_Current_D_Open, var_Current_Close) - math.min(var_Current_D_Open, var_Current_Close)
Current_ORBBody = Current_TodayDay_Body > Current_PrevDay_Body
Current_Upper_ORB_bull = (var_Current_Close > Current_Upper_ORB)
Current_Lower_ORB_bear = (var_Current_Close < Current_Lower_ORB)
🎨 Visualizations and User Experience:
The script can dynamically display colored backgrounds indicating trends when conditions are met. For example, the bgcolor function changes the background when certain trend-based criteria are satisfied, offering visual cues to users. Additionally, the checkbox input toggles trend bar visualizations, enhancing user experience by providing a quick visual reference without needing to interpret individual data points manually.
RSI-Based Candle Coloring:
➤ The script customizes candle colors based on RSI thresholds, specifically defining upper (60) and lower (40) RSI levels. When the RSI value exceeds the upper threshold, candles are colored as bullish (green), and if it falls below the lower threshold, candles are colored as bearish (red). Neutral RSI values result in a default color (gray).
➤ This setup offers a visually intuitive way to identify potential trend directions based on RSI levels, making it ideal for traders looking to gauge momentum visually.
⭐ Settings and Customization:
With multiple user-configurable inputs, the script allows for tailored analysis. Customizable parameters, such as enabling/disabling trend bars and setting various look-back periods for indicators like Bollinger Bands and Moving Averages, make it adaptable to various trading styles and preferences. It also allows users to modify visual elements like colors and styles, improving flexibility.
⭐ Uniqueness of the Concept:
The unique aspect of this script is its multi-symbol approach combined with complex conditions. By comparing not only one but four symbols simultaneously, it provides a broader market view and allows traders to correlate signals across different assets, offering a potential edge for diversified or comparative strategies. Additionally, the incorporation of ORB and multi-timeframe MAs gives it a robustness often lacking in simpler single-symbol scripts.
🚀 Conclusion:
This script is a powerful multi-indicator tool suited for traders looking for a comparative, multi-symbol analysis. With features like ORB, Bollinger Band-based trend detection, and MA cross-verification, it can assist traders in identifying and validating trend signals across assets. The user-friendly visualizations and customizable settings further enhance its usability, making it versatile for various trading strategies and preferences.
RSI - EMA - WMA ( Phat-Truong )Indicator: RSI ( EMA - WMA )
This indicator, named "RSI ( EMA - WMA )", is a versatile tool designed to provide insights into market momentum and trend strength by combining multiple technical indicators.
The Relative Strength Index (RSI) is a popular momentum oscillator used to measure the speed and change of price movements. In this indicator, RSI is plotted alongside its Exponential Moving Average (EMA) and Weighted Moving Average (WMA). EMA and WMA are smoothing techniques applied to RSI to help identify trends more clearly.
Key features of this indicator include:
RSI: The main RSI line is plotted on the chart, offering insights into overbought and oversold conditions.
EMA of RSI: The Exponential Moving Average of RSI smooths out short-term fluctuations, aiding in trend identification.
WMA of RSI: The Weighted Moving Average of RSI gives more weight to recent data points, providing a faster response to price changes.
Additionally, this indicator marks specific RSI levels considered as bullish and bearish trends, helping traders identify potential entry or exit points based on market sentiment.
By combining these technical indicators, traders can gain a comprehensive understanding of market dynamics, helping them make more informed trading decisions.

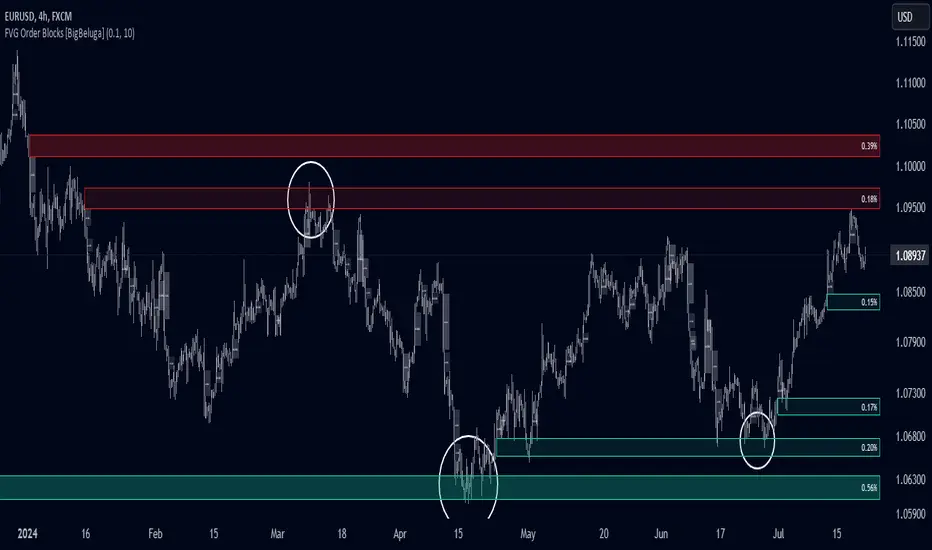
FVG Order Blocks [BigBeluga]This indicator is an advanced tool designed to detect and visualize market FVGs with order blocks, where the price action has created gaps due to strong buying or selling pressure. These FVG often act as critical support and resistance levels, giving traders strategic points for potential entries and exits. The indicator not only identifies these imbalances but also displays their relative strength by size %, helping traders prioritize order blocks that are more likely to hold or break.
The indicator works on various pairs and stocks, it also works on charts that do not provide volume data
Forex (JPY/USD):
Stocks (NVDA):
🔵 KEY FEATURES & USAGE
● FVGs Detection and Visualization:
The indicator detects bullish and bearish FVGs. Bullish FVG occur when there is significant buying, and order block is plotted below the FVG zone:
Conversely, bearish FVG are plotted with an order block above the zone, indicating potential resistance.
Traders can use these order blocks to anticipate price reactions when the market revisits these areas, making them ideal for setting up trades.
● FVG Filtering:
The indicator includes a FVG % filter that allows traders to only display strong order blocks. This ensures that only significant FVG order blocks are shown, reducing noise and focusing on the most impactful areas.
● Highlighting Broken Levels:
When an imbalance level is broken—either breached by price action or no longer relevant—the indicator can either delete the level or mark it with a gray color areas. This provides a clear visual cue that the level has been compromised, allowing traders to adjust their strategies accordingly.
● Order Blocks Signals:
When price retest the blocks, indicator display potential sell or buy signals. Which can be an opportunity for trades
🔵 CUSTOMIZATION
● FVG Filter:
Adjust the strength filter to control which FVGs are displayed based on their percentage size. This filter helps in focusing only on significant blocks that are likely to impact price action.
● Order Blocks Amount Displayed:
Set the maximum number of Order Blocks to be displayed on the chart. This customization helps keep the chart clean and ensures that only the most important blocks are in view.
● Broken Order Blocks Display:
Choose whether to display order blocks that have been broken by the price. This feature helps in maintaining a focus on blocks that are still valid while filtering out those that are no longer relevant.
● Color Customization:
You can customize the colors for bullish and bearish Order Blocks to match your chart's overall color scheme. Additionally, strength bars can be color-coded based on their percentage to quickly identify high-priority order blocks.
Traders who are confident in the settings of the indicator can confidently use it on various types of markets
MomentumSignal Kit RSI-MACD-ADX-CCI-CMF-TSI-EStoch// ----------------------------------------
// Description:
// ----------------------------------------
// MomentumKit RSI/MACD-ADX-CCI-CMF-TSI-EStoch Suite is a comprehensive momentum indicator suite designed to provide robust buy and sell signals through the consensus of multiple normalized momentum indicators. This suite integrates the following indicators:
// - **Relative Strength Index (RSI)**
// - **Stochastic RSI**
// - **Moving Average Convergence Divergence (MACD)** with enhanced logic
// - **True Strength Index (TSI)**
// - **Commodity Channel Index (CCI)**
// - **Chaikin Money Flow (CMF)**
// - **Average Directional Index (ADX)**
// - **Ehlers' Stochastic**
//
// **Key Features:**
// 1. **Normalization:** Each indicator is normalized to a consistent scale, facilitating easier comparison and interpretation across different momentum metrics. This uniform scaling allows traders to seamlessly analyze multiple indicators simultaneously without the confusion of differing value ranges.
//
// 2. **Consensus-Based Signals:** By combining multiple indicators, MomentumKit generates buy and sell signals based on the agreement among various momentum measurements. This multi-indicator consensus approach enhances signal reliability and reduces the likelihood of false positives.
//
// 3. **Overlap Analysis:** The normalization process aids in identifying overlapping signals, where multiple indicators point towards a potential change in price or momentum. Such overlaps are strong indicators of significant market movements, providing traders with timely and actionable insights.
//
// 4. **Enhanced Logic for MACD:** The MACD component within MomentumKit utilizes enhanced logic to improve its responsiveness and accuracy in detecting trend changes.
//
// 5. **Debugging Features:** MomentumKit includes advanced debugging tools that display individual buy and sell signals generated by each indicator. These features are intended for users with technical and programming skills, allowing them to:
// - **Visualize Signal Generation:** See real-time buy and sell signals for each integrated indicator directly on the chart.
// - **Adjust Signal Thresholds:** Modify the criteria for what constitutes a buy or sell signal for each indicator, enabling tailored analysis based on specific trading strategies.
// - **Filter and Manipulate Signals:** Enable or disable specific indicators' contributions to the overall buy and sell signals, providing flexibility in signal generation.
// - **Monitor Indicator Behavior:** Utilize debug plots and labels to understand how each indicator reacts to market movements, aiding in strategy optimization.
//
// **Work in Progress:**
// MomentumKit is continuously evolving, with ongoing enhancements to its algorithms and user interface. Current debugging features are designed to offer deep insights for technically adept users, allowing for extensive customization and fine-tuning. Future updates aim to introduce more user-friendly interfaces and automated optimization tools to cater to a broader audience.
//
// **Usage Instructions:**
// - **Visibility Controls:** Users can toggle the visibility of individual indicators to focus on specific momentum metrics as needed.
// - **Parameter Adjustments:** Each indicator comes with customizable parameters, allowing traders to fine-tune the suite according to their trading strategies and market conditions.
// - **Debugging Features:** Enable the debugging mode to visualize individual indicator signals and adjust their contribution to the overall buy/sell signals. This requires a basic understanding of the underlying indicators and their operational thresholds.
//
// **Benefits:**
// - **Simplified Analysis:** Normalization simplifies the process of analyzing multiple indicators, making it easier to identify consistent signals across different momentum measurements.
// - **Improved Decision-Making:** Consensus-based signals backed by multiple normalized indicators provide a higher level of confidence in trading decisions.
// - **Versatility:** Suitable for various trading styles and market conditions, MomentumKit offers a versatile toolset for both novice and experienced traders.
//
// **Technical Requirements:**
// - **Programming Knowledge:** To fully leverage the debugging and signal manipulation features, users should possess a foundational understanding of Pine Script and the mechanics of momentum indicators.
// - **Customization Skills:** Ability to adjust indicator parameters and debug filters to align with specific trading strategies.
//
// **Disclaimer:**
// This indicator suite is intended for educational and analytical purposes only and does not constitute financial advice. Trading involves significant risk, and past performance is not indicative of future results. Always conduct your own analysis or consult a qualified financial advisor before making trading decisions.

Volumatic Variable Index Dynamic Average [BigBeluga]The Volumatic VIDYA (Variable Index Dynamic Average) indicator is a trend-following tool that calculates and visualizes both the current trend and the corresponding buy and sell pressure within each trend phase. Using the Variable Index Dynamic Average as the core smoothing technique, this indicator also plots volume levels of lows and highs based on market structure pivot points, providing traders with key insights into price and volume dynamics.
Additionally, it generates delta volume values to help traders evaluate buy-sell pressure balance during each trend, making it a powerful tool for understanding market sentiment shifts.
BTC:
TSLA:
🔵 IDEA
The Volumatic VIDYA indicator's core idea is to provide a dynamic, adaptive smoothing tool that identifies trends while simultaneously calculating the volume pressure behind them. The VIDYA line, based on the Variable Index Dynamic Average, adjusts according to the strength of the price movements, offering a more adaptive response to the market compared to standard moving averages.
By calculating and displaying the buy and sell volume pressure throughout each trend, the indicator provides traders with key insights into market participation. The horizontal lines drawn from the highs and lows of market structure pivots give additional clarity on support and resistance levels, backed by average volume at these points. This dual analysis of trend and volume allows traders to evaluate the strength and potential of market movements more effectively.
🔵 KEY FEATURES & USAGE
VIDYA Calculation:
The Variable Index Dynamic Average (VIDYA) is a special type of moving average that adjusts dynamically to the market’s volatility and momentum. Unlike traditional moving averages that use fixed periods, VIDYA adjusts its smoothing factor based on the relative strength of the price movements, using the Chande Momentum Oscillator (CMO) to capture the magnitude of price changes. When momentum is strong, VIDYA adapts and smooths out price movements quicker, making it more responsive to rapid price changes. This makes VIDYA more adaptable to volatile markets compared to traditional moving averages such as the Simple Moving Average (SMA) or the Exponential Moving Average (EMA), which are less flexible.
// VIDYA (Variable Index Dynamic Average) function
vidya_calc(src, vidya_length, vidya_momentum) =>
float momentum = ta.change(src)
float sum_pos_momentum = math.sum((momentum >= 0) ? momentum : 0.0, vidya_momentum)
float sum_neg_momentum = math.sum((momentum >= 0) ? 0.0 : -momentum, vidya_momentum)
float abs_cmo = math.abs(100 * (sum_pos_momentum - sum_neg_momentum) / (sum_pos_momentum + sum_neg_momentum))
float alpha = 2 / (vidya_length + 1)
var float vidya_value = 0.0
vidya_value := alpha * abs_cmo / 100 * src + (1 - alpha * abs_cmo / 100) * nz(vidya_value )
ta.sma(vidya_value, 15)
When momentum is strong, VIDYA adapts and smooths out price movements quicker, making it more responsive to rapid price changes. This makes VIDYA more adaptable to volatile markets compared to traditional moving averages
Triangle Trend Shift Signals:
The indicator marks trend shifts with up and down triangles, signaling a potential change in direction. These signals appear when the price crosses above a VIDYA during an uptrend or crosses below during a downtrend.
Volume Pressure Calculation:
The Volumatic VIDYA tracks the buy and sell pressure during each trend, calculating the cumulative volume for up and down bars. Positive delta volume occurs during uptrends due to higher buy pressure, while negative delta volume reflects higher sell pressure during downtrends. The delta is displayed in real-time on the chart, offering a quick view of volume imbalances.
Market Structure Pivot Lines with Volume Labels:
The indicator draws horizontal lines based on market structure pivots, which are calculated using the highs and lows of price action. These lines are extended on the chart until price crosses them. The indicator also plots the average volume over a 6-bar range to provide a clearer understanding of volume dynamics at critical points.
🔵 CUSTOMIZATION
VIDYA Length & Momentum: Control the sensitivity of the VIDYA line by adjusting the length and momentum settings, allowing traders to customize the smoothing effect to match their trading style.
Volume Pivot Detection: Set the number of bars to consider for identifying pivots, which influences the calculation of the average volume at key levels.
Band Distance: Adjust the band distance multiplier for controlling how far the upper and lower bands extend from the VIDYA line, based on the ATR (Average True Range).

Fourier For Loop [BackQuant]Fourier For Loop
PLEASE Read the following, as understanding an indicator's functionality is essential before integrating it into a trading strategy. Knowing the core logic behind each tool allows for a sound and strategic approach to trading.
Introducing BackQuant's Fourier For Loop (FFL) — a cutting-edge trading indicator that combines Fourier transforms with a for-loop scoring mechanism. This innovative approach leverages mathematical precision to extract trends and reversals in the market, helping traders make informed decisions. Let's break down the components, rationale, and potential use-cases of this indicator.
Understanding Fourier Transform in Trading
The Fourier Transform decomposes price movements into their frequency components, allowing for a detailed analysis of cyclical behavior in the market. By transforming the price data from the time domain into the frequency domain, this indicator identifies underlying patterns that traditional methods may overlook.
In this script, Fourier transforms are applied to the specified calculation source (defaulted to HLC3). The transformation yields magnitude values that can be used to score market movements over a defined range. This scoring process helps uncover long and short signals based on relative strength and trend direction.
Why Use Fourier Transforms?
Fourier Transforms excel in identifying recurring cycles and smoothing noisy data, making them ideal for fast-paced markets where price movements may be erratic. They also provide a unique perspective on market volatility, offering traders additional insights beyond standard indicators.
Calculation Logic: For-Loop Scoring Mechanism
The For Loop Scoring mechanism compares the magnitude of each transformed point in the series, summing the results to generate a score. This score forms the backbone of the signal generation system.
Long Signals: Generated when the score surpasses the defined long threshold (default set at 40). This indicates a strong bullish trend, signaling potential upward momentum.
Short Signals: Triggered when the score crosses under the short threshold (default set at -10). This suggests a bearish trend or potential downside risk.'
Thresholds & Customization
The indicator offers customizable settings to fit various trading styles:
Calculation Periods: Control how many periods the Fourier transform covers.
Long/Short Thresholds: Adjust the sensitivity of the signals to match different timeframes or risk preferences.
Visualization Options: Traders can visualize the thresholds, change the color of bars based on trend direction, and even color the background for enhanced clarity.
Trading Applications
This Fourier For Loop indicator is designed to be versatile across various market conditions and timeframes. Some of its key use-cases include:
Cycle Detection: Fourier transforms help identify recurring patterns or cycles, giving traders a head-start on market direction.
Trend Following: The for-loop scoring system helps confirm the strength of trends, allowing traders to enter positions with greater confidence.
Risk Management: With clearly defined long and short signals, traders can manage their positions effectively, minimizing exposure to false signals.
Final Note
Incorporating this indicator into your trading strategy adds a layer of mathematical precision to traditional technical analysis. Be sure to adjust the calculation start/end points and thresholds to match your specific trading style, and remember that no indicator guarantees success. Always backtest thoroughly and integrate the Fourier For Loop into a balanced trading system.
Thus following all of the key points here are some sample backtests on the 1D Chart
Disclaimer: Backtests are based off past results, and are not indicative of the future .
INDEX:BTCUSD
INDEX:ETHUSD
BINANCE:SOLUSD

Prometheus Auto Optimizing SaberThis indicator is a tool that uses prior ranges to determine the directional trend of the market. The process is along the lines of a volatility estimate to determine relative strength.
Calculation:
Square rooting the highest high and lowest low, helps it be easier to work with if there are extreme values. Then we normalize it by subtracting it by the range of the current bar. Next, we get bands for the value. The highest high plus that value, v, and the lowest low minus v.
Next we get that average, then smooth it so we can view it nicely.
Now for the Auto Optimizing part in the title. Instead of trying different lookback values for different tickers and timeframes. Prometheus uses a Sum of Squared Errors, SSE, calculation to determine which price would most closely represent the current price. This gives us a dynamic value to use as the lookback. There is no guarantee this is the best value to use for a given point in time.
hh = ta.highest(high, N_opt)
ll = ta.lowest(low, N_opt)
v = math.sqrt(hh - ll) / (high - low)
vu = hh + v
vd = ll - v
vma = ta.sma((vu + vd) / 2, N_opt)
The user is able to use a custom lookback value if they please.
Chart examples.
Here on the NASDAQ:QQQ daily chart we see the Saber colored in blue when it is a bullish scenario, characterized by close being above the Saber , and when it is below it is red, for bearish.
This Saber is quite resistant to large moves, until the range widens quickly. This example shows that.
We see on the NYSE:PLTR daily chart, the earnings candle in the white box shows that. The Saber is resistant to change until things get fast. After the trend switches bullish from the earnings candle, it stays bullish regardless of the last drawdown.
Intra Day example:
The range here is quite wide and the moves are well spread apart from wide trends, slow moves, and pops. The Saber acts in a way to provide an aid identifying the direction of the moves.
We encourage traders to not follow indicators blindly, none are 100% accurate. SSE does not guarantee that the values generated will be the best for a given moment in time. Please comment on any desired updates, all criticism is welcome!

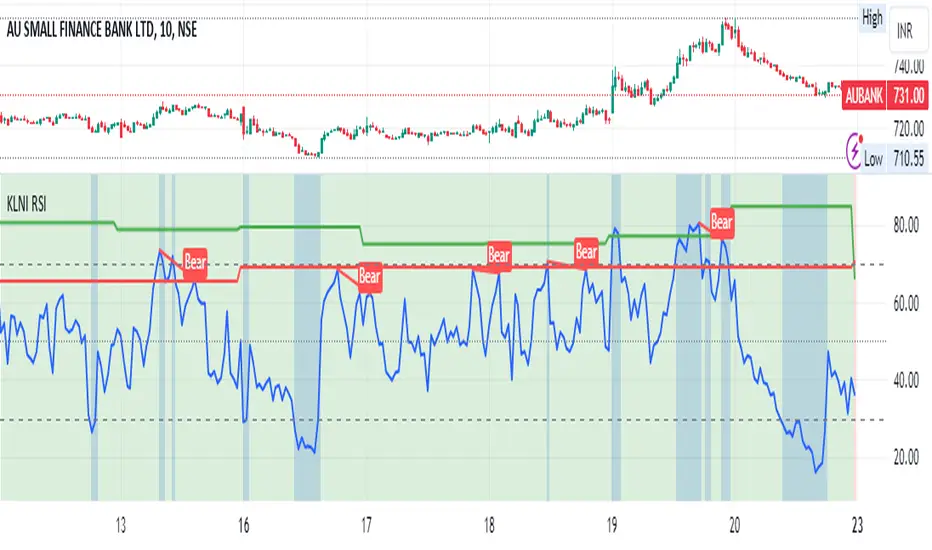
KLNI RSI MTFDescription of the RSI Multi-Timeframe Indicator
The RSI Multi-Timeframe Indicator allows you to track and compare the Relative Strength Index (RSI) across three different timeframes on the same chart. This is particularly useful for traders who want to gauge the momentum of an asset over multiple time periods simultaneously, helping to make more informed trading decisions.
Key Features
Multi-Timeframe RSI:
You can select up to three timeframes to plot RSI on the same chart.
Available timeframe options include:
Current: Displays RSI for the current chart timeframe.
60 minutes (1 hour)
Daily
Weekly
Monthly
Custom RSI Settings:
Adjust the RSI length and source (e.g., close price) through user inputs, allowing you to tailor the indicator to your strategy.
Divergence Detection (Optional):
The indicator can optionally detect and display bullish and bearish divergences between price and RSI for the first selected timeframe.
Bullish divergence is shown when price makes a lower low, but RSI makes a higher low.
Bearish divergence is shown when price makes a higher high, but RSI makes a lower high.
Visual Aids:
Overbought and oversold RSI levels are highlighted with background colors for clarity.
Horizontal lines at 70 (overbought), 50 (neutral), and 30 (oversold) help quickly identify RSI conditions.
How to Use This Indicator
Inputs & Settings
Timeframe Settings:
First Timeframe: Choose the primary timeframe (e.g., 60 minutes, Daily, Weekly).
Second Timeframe: Select the second timeframe to plot on the chart.
Third Timeframe: Select the third timeframe for additional RSI analysis.
RSI Settings:
RSI Length: Set the period for RSI calculation (default: 14).
Source: Select the price data for RSI calculation (default: close price).
Show Divergence: Enable or disable the detection of divergence between price and RSI.
Plotting on Chart
The indicator will display three distinct RSI plots for the selected timeframes:
RSI TF1 (blue line) for the first timeframe.
RSI TF2 (green line) for the second timeframe.
RSI TF3 (red line) for the third timeframe.
Each RSI line corresponds to its chosen timeframe, allowing you to see how RSI behaves across different time periods.
Reading the RSI Values
Overbought: When RSI is above 70, the asset is considered overbought, potentially signaling a sell or short entry.
Oversold: When RSI is below 30, the asset is considered oversold, possibly indicating a buying opportunity.
Neutral: RSI around 50 is neutral and may suggest a lack of clear momentum.
Divergence Detection
If enabled, the indicator will highlight points of divergence:
Bullish Divergence: A green label will appear below the chart where price is making lower lows, but RSI is making higher lows, suggesting potential bullish momentum.
Bearish Divergence: A red label will appear when price is making higher highs, but RSI is making lower highs, indicating potential bearish pressure.
Practical Applications
Momentum Confirmation: Use this indicator to confirm the strength of a trend by comparing RSI across multiple timeframes. For example, if RSI is above 50 on all three timeframes, it may confirm strong upward momentum.
Overbought/Oversold Signals: When RSI is overbought on multiple timeframes, it could signal an impending reversal or correction. Conversely, oversold conditions across timeframes might indicate a buy opportunity.
Divergence Detection: Spot divergence between price and RSI to identify potential trend reversals early. Divergence can provide early signals of changing market momentum.
Summary
This indicator is a powerful tool for multi-timeframe RSI analysis, helping traders understand momentum shifts across different timeframes. It offers customizability, divergence detection, and visual aids to streamline your technical analysis and decision-making process.
Super Trend ReversalsMain Concept
The core idea behind the Super Trend Reversals indicator is to assess the momentum of automated trading bots (often referred to as 'Supertrend bots') that enter the market during critical turning points. Specifically, the indicator is tuned to identify when the market is nearing bottoms or peaks, but just before it shifts direction based on the triggered Supertrend signals. This approach helps traders engage with the market right as the reversal momentum builds up, allowing for entry just as conditions become favorable and exit before momentum wanes.
How It Works
The Super Trend Reversals uses multiple Supertrend calculations, each with different period and multiplier settings, to form a comprehensive view of the trend. The total trend score from these calculations is then analyzed using the Relative Strength Index (RSI) and Exponential Moving Averages (EMA) to gauge the strength and sustainability of the trend.
A key feature of this indicator is the isCurrentRangeSmaller() function, which evaluates if the current price range is lower than the average over the recent period. This function is critical as it helps determine the stability of the market environment, reducing the likelihood of entering or exiting trades based on erratic price movements that could lead to false signals.

Composite Momentum█ Introduction
The Composite Momentum Indicator is a tool we came across that we found to be useful at detecting implied tops and bottoms within quick market cycles. Its approach to analyzing momentum through a combination of moving averages and summation techniques makes it a useful addition to the range of available indicators on TradingView.
█ How It Works
This indicator operates by calculating the difference between two moving averages—one fast and one slow, which can be customized by the user. The difference between these two averages is then expressed as a percentage of the fast moving average, forming the core momentum value which is then smoothed with an Exponential Moving Average is applied. The smoothed momentum is then compared across periods to identify directional changes in direction
Furthermore, the script calculates the absolute differences between consecutive momentum values. These differences are used to determine periods of momentum acceleration or deceleration, aiming to establish potential reversals.
In addition to tracking momentum changes, the indicator sums positive and negative momentum changes separately over a user-defined period. This summation is intended to provide a clearer picture of the prevailing market bias—whether it’s leaning towards strength or weakness.
Finally, the summed-up values are normalized to a percentage scale. This normalization helps in identifying potential tops and bottoms by comparing the relative strength of the momentum within a given cycle.
█ Usage
This indicator is primarily useful for traders who focus on detecting quick cycle tops and bottoms. It provides a view of momentum shifts that can signal these extremes, though it’s important to use it in conjunction with other tools and market analysis techniques. Given its ability to highlight potential reversals, it may be of interest to those who seek to understand short-term market dynamics.
█ Disclaimer
This script was discovered without any information about its author or original intent but was nonetheless ported from its original format that is available publicly. It’s provided here for educational purposes and should not be considered a guaranteed method for market analysis. Users are encouraged to test and understand the indicator thoroughly before applying it in real trading scenarios.