Supply & Demand (MTF) | Flux Charts💎 GENERAL OVERVIEW
Introducing our new Supply and Demand (MTF) Indicator! This new indicator renders Supply and Demand zones based on momentum candles. It can detect Supply and Demand zones across up to 3 diferent timeframes. It's capable of combining zones, retest & break labels and it's customizable with invalidation and style settings.
Features of the new Supply and Demand (MTF) Indicator:
Renders Supply and Demand Zones Across 3 Timeframes
Combination Of Overlapping Zones
Retest & Break Labels
Retest & Break Alerts
Enable / Disable Historic Zones
Visual Customizability
📌 HOW DOES IT WORK ?
Supply and Demand is a key concept in trading. It helps traders see the zones that market-makers buy & sell the asset in large amounts. It's detected by finding momentum candles (candles that have large bodies) in a row.
Momentum candles are defined to have a larger body than the average candle in the chart, and at least 4 of them in a row is required to draw a supply or demand zone. The zone is drawn from the high wick to low wick of two candles before the first momentum candle in the row.
Check this example :
These zones are usually where market makers trade the asset in larger amounts. Thus, they act as support & resistance zones by their nature. A retest of these zones can make the price bounce to the opposite direction, while a breakout usually means strong price action momentum is incoming in that direction. Supply zones indicate bearish momentum while demand zones indicate bullish momentum.
Check this example :
Here a Supply Zone (Bearish) forms. Then price comes back up to test the zone, and it fails to break. After the failed attemp, a stong bearish momentum takes the price back to a lower level. Then another test of the zone occurs and successfully breaks the zone this time. This breakout starts a bullish momentum that takes the price to a higher level.
🚩UNIQUENESS
This indicator provides Supply and Demand zones in your chart with pure simplicity. It supports up to 3 different timeframes as we believe supporting your trades with higher timeframes can improve your trading experience. It also gets rid of complexity by combining overlapping zones into a single zone, even if they are from different timeframes! You can also set-up alerts to get notified when a supply or demand zone is being retested, or is broken. Overall, this indicator is the ultimate kit for supply and demand zones.
⚙️SETTINGS
1. General Configuration
Max Distance To Last Bar -> The maximum distance that the indicator will render supply and demand zones from. Higher settings mean rendering older supply and demand zones.
Zone Invalidation -> Select between Wick & Close price for Supply and Demand Zone Invalidation.
Retests & Breaks -> Enable retest & break labels in your chart.
Show Historic Zones -> This will show historic supply & demand zones which are invalidated if enabled. You can disable this to only see active supply and demand zones for a simpler chart.
2. Timeframes
You can set up to 3 different timeframes and enable / disable them using the checkboxes in this section.
Search in scripts for "retest"

Breaker Blocks Screener | Flux Charts💎 GENERAL OVERVIEW
Introducing our new Breaker Blocks Screener! This screener can provide information about the latest breaker blocks in up to 5 tickers. You can also customize the algorithm that finds the breaker blocks and the styling of the screener.
Features of the new Breaker Blocks Screener :
Find Latest Breaker Blocks Accross 5 Tickers
Latest Status, Restests & Volume
Customizable Algoritm / Styling
📌 HOW DOES IT WORK ?
Breaker blocks form when an order block fails, or "breaks". It is often associated with market going in the opposite direction of the broken order block, and they can be spotted by following order blocks and finding the point they get broken, ie. price goes below a bullish order block.
The volume of a breaker block is simply the total volume of the bar that the original order block is broken. Often the higher the breaking bar's volume, the stronger the breaker block is.
This screener then finds breaker blocks accross 5 different tickers, and shows the latest information about them.
Status ->
Far -> The current price is far away from the breaker block.
Approaching ⬆️/⬇️ -> The current price is approaching the breaker block, and the direction it's approaching from.
Inside -> The price is currently inside the breaker block.
Retests -> Retest means the price to invalidate the breaker block, but failed to do so. Here you can see how many times the price retested the breaker block.
For the volume, check the top of the "How Does It Work" section.
🚩UNIQUENESS
This screener can detect latest breaker blocks and give information about them for up to 5 tickers. This saves the user time by showing them all in a dashboard at the same time. The screener shows the number of the retests of the breaker block as an unique trait. Another unique ability of the screener is that it shows the latest valid breaker block's volume in the dashboard.
⚙️SETTINGS
1. Tickers
You can set up to 5 tickers for the screener to scan breaker blocks here. You can also enable / disable them and set their individual timeframes.
2. General Configuration
Zone Invalidations -> Select between Wick & Close price for Order & Breaker Block Invalidation.
Swing Length -> Swing length is used when finding order block formations. Smaller values will result in finding smaller order blocks.

Order Blocks Screener | Flux Charts💎 GENERAL OVERVIEW
Introducing our new Order Blocks Screener! This screener can provide information about the latest order blocks in up to 5 tickers. You can also customize the algorithm that finds the order blocks and the styling of the screener.
Features of the new Order Blocks Screener :
Find Latest Order Blocks Accross 5 Tickers
Latest Status, Restests, Bullish & Bearish Volume
Customizable Algoritm / Styling
📌 HOW DOES IT WORK ?
Order blocks occur when there is a high amount of market orders exist on a price range. It is possible to find order blocks using specific formations on the chart.
The high & low volume of order blocks should be taken into consideration while determining their strengths. The determination of the high & low volume of order blocks are similar to FVGs, in a bullish order block, the high volume is the last 2 bars' total volume, while the low volume is the oldest bar's volume. In a bearish order block scenerio, the low volume becomes the last 2 bars' total volume.
This screener then finds order blocks accross 5 different tickers, and shows the latest information about them.
Status ->
Far -> The current price is far away from the order block.
Approaching ⬆️/⬇️ -> The current price is approaching the order block, and the direction it's approaching from.
Inside -> The price is currently inside the order block.
Retests -> Retest means the price to invalidate the order block, but failed to do so. Here you can see how many times the price retested the order block.
For the bullish / bearish volume, check the "How Does It Work" section.
🚩UNIQUENESS
This screener can detect latest order blocks and give information about them for up to 5 tickers. This saves the user time by showing them all in a dashboard at the same time. The screener shows the number of the retests of the order block as an unique trait. Another unique ability of the screener is that it shows the latest valid order block's bullish and bearish volume in the dashboard.
⚙️SETTINGS
1. Tickers
You can set up to 5 tickers for the screener to scan order blocks here. You can also enable / disable them and set their individual timeframes.
2. General Configuration
Zone Invalidation -> Select between Wick & Close price for Order Block Invalidation.
Swing Length -> Swing length is used when finding order block formations. Smaller values will result in finding smaller order blocks.

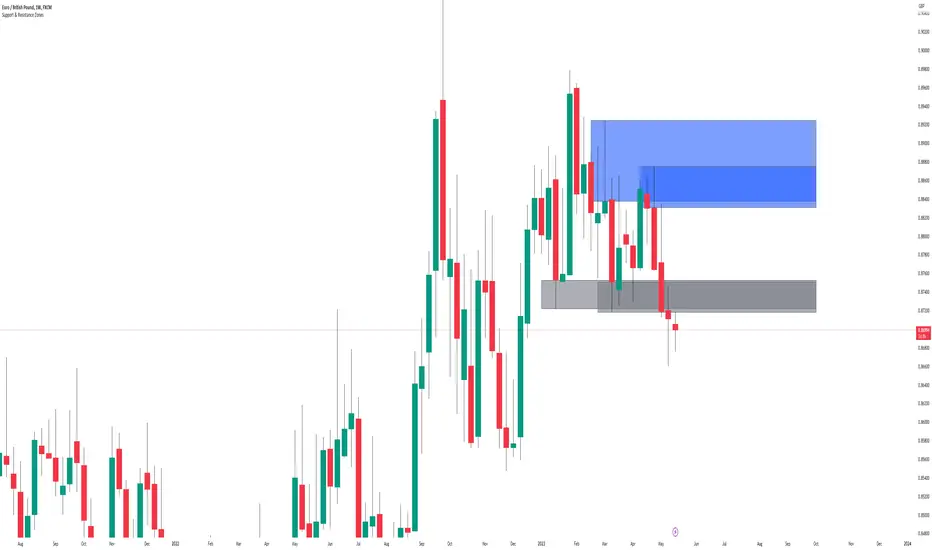
Support & Resistance ZonesTitle: A Comprehensive Guide to the Support & Resistance Zones Indicator
Introduction
In the world of technical analysis, the Support & Resistance Zones indicator plays a crucial role in identifying potential trading opportunities. These zones are essential for traders looking to capitalize on bounces or break and retests. In this article, we will delve into the specifics of the Support & Resistance Zones indicator, outlining how it works, how it finds and marks zones, and the various options available for traders.
What the indicator is about
The Support & Resistance Zones indicator, developed by @HarryCTC, is a powerful tool for detecting areas of potential price reversal or consolidation in a financial market. These zones are significant as they can act as a guide for traders to make informed decisions on entering or exiting positions. Specifically, the indicator helps identify:
1. Support Zones: Areas where the price has a tendency to bounce back up after falling, indicating a potential buying opportunity.
2. Resistance Zones: Areas where the price has a tendency to reverse after rising, indicating a potential selling opportunity.
How the indicator finds its zones
The Support & Resistance Zones indicator utilizes pivot points to identify potential support and resistance levels. By analyzing the fractal structure of the price chart, the indicator identifies key turning points, known as bull and bear fractals. The bull fractal is a high pivot point, while the bear fractal is a low pivot point.
The fractal structure is determined by the 'Switch Zone Period' input, which can be adjusted to suit the trader's preferences. A higher value will result in fewer zones being identified, while a lower value will result in more zones.
How it marks zones and why it marks zones
The indicator marks the support and resistance zones by creating rectangular boxes around the identified fractal points. The zones are extended horizontally from the fractal point, allowing traders to visualize the potential areas of price reversal.
The zones are marked for the following reasons:
1. To provide a clear visual representation of potential support and resistance levels.
2. To help traders identify potential entry and exit points based on the price's reaction to these zones.
3. To serve as a reference for stop-loss and take-profit levels when planning trades.
The indicator's for traders trading bounces or break and retests
Traders who focus on trading bounces or break and retests can benefit immensely from the Support & Resistance Zones indicator. By providing a visual representation of key support and resistance levels, the indicator enables traders to:
1. Identify potential buying opportunities at support zones where the price is likely to bounce back up.
2. Identify potential selling opportunities at resistance zones where the price is likely to reverse after rising.
3. Make informed decisions on stop-loss and take-profit levels based on the price's proximity to support and resistance zones.
4. Monitor the market for potential breakouts or breakdowns when the price breaches these zones.
Indicator options
The Support & Resistance Zones indicator offers several customizable options to suit the trader's preferences. These options include:
1. Switch Zone Period: Adjusts the number of periods used to calculate the fractal structure, influencing the number of identified zones.
2. No. of Displayed Zones: Determines the maximum number of zones displayed on the chart, ranging from 1 to 8.
3. Zone Extension: Adjusts the horizontal extension of the support and resistance zones.
4. Resistance Zone Color: Customizes the color of the resistance zone boxes.
5. Support Zone Color: Customizes the color of the support zone boxes.
6. Zone Border Color: Customizes the color of the zone box borders.
Conclusion
The Support & Resistance Zones indicator is a valuable tool for traders looking to identify potential trading opportunities based on the price's interaction with support and resistance levels. By providing a clear visual representation of these zones, the
indicator allows traders to make informed decisions on entry and exit points, stop-loss, and take-profit levels. With customizable options, the indicator can be tailored to suit individual trading preferences and strategies.
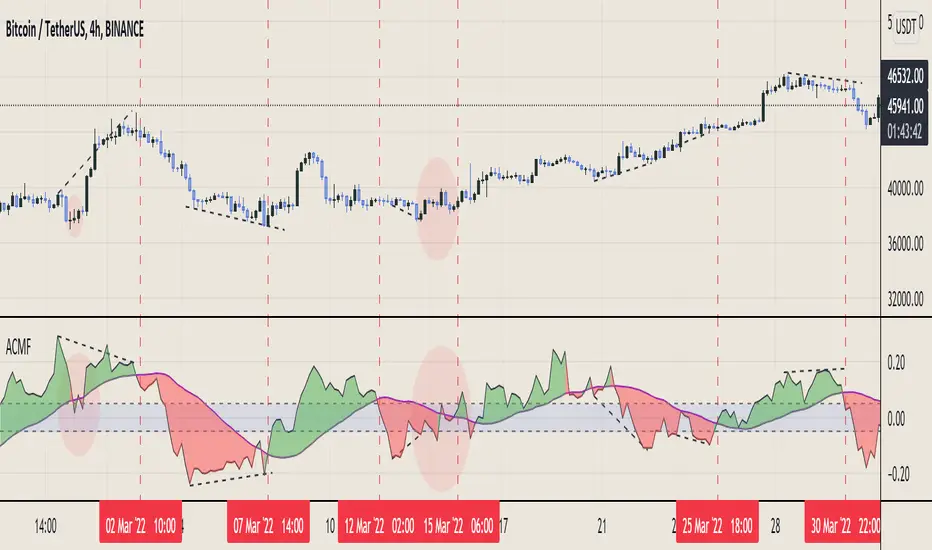
Aggregated Chaikin Money Flow - InFinitoModified Version of In-Built Chaikin Money Flow Indicator. Aggregated Volume is used for it's calculation + a couple of other features.
Aggregation code originally from Crypt0rus
***The indicator can be used for any coin/symbol to aggregate volume , but it has to be set up manually***
***The indicator can be used with specific symbol data only by disabling the aggregation option, which allows for it to be used on any symbol***
- Calculated based on Aggregated Volume instead of by symbol volume. Using aggregated data makes it more accurate and allows to compare volume flow between different kinds of markets (Spot, Futures , Perpetuals, Futures+Perpetuals and All Volume ).
- As well, in order to make the data as accurate as possible, the data from each exchange aggregated is normalized to report always in terms of 1 BTC. In case this indicator is used for another symbol, the calculations can be adjusted manually to make it always report data in terms of 1 contract/coin.
- Added Moving Average ( SMA , EMA , WMA , RMA, VWMA) that can be plotted to the CMF
- Changed 0 line to a small range which tends to be more relevant than the 0 line. This range can be manually modified
Things to look for:
- Divergences: Can be a very good reversal signal
- MA crossovers: Can be a very good confluent Buy/Sell signal
- Center range retests: CMF is normally defined as bullish above 0 and bearish below 0. In this case it is above or below the middle range. Even if the start of the move was missed. The retest of the middle range can give very good entries.
- Confluence of the latter
Triple ThreatThis indicator provides buy and sell signals for Bitcoin based on confluence from well-known momentum, volatility, and trend indicators. It has successfully captured the major directional trends on Bitcoin's daily chart since 2018, and the settings are currently optimized for this chart in particular. This indicator implements RSI to gauge momentum, BBWP to gauge volatility, and an EMA to gauge trend. Maximum confluence signals are represented by horizontal bars in the indicator's pane, where the tallest green bar is a confirmed buy signal, and the tallest red bar is a confirmed sell signal. The shortest bar represents a momentum-only signal, and the second-shortest bar represents a volatility signal in confluence with the previously given momentum signal.
To track momentum, the RSI is plotted to the indicator plane against a moving average of the RSI. A momentum signal is generated when the RSI crosses over its moving average, retests/approaches the moving average, and then continues in the crossover direction (i.e., it fails to cross the moving average to the opposite side, creating a successful retest). The settings that affect this trigger are the "Crossover Threshold," which specifies how much the RSI should exceed the moving average to be considered a crossover, and the "Retest threshold," which specifies how closely the RSI should approach the moving average to be considered a retest. A momentum signal is ALSO generated if the RSI or its moving average exceed their counterpart by a certain threshold. For example, if the threshold was set at 10, a BUY signal would be generated when the RSI exceeds the moving average by 10, or a SELL signal would be generated when the moving average exceeds the RSI by 10. This threshold can be set using the "Instant Signal Threshold" setting. Either type of momentum signal will be plotted on the pane as the shortest horizontal bar, with its color indicating the signal's direction.
Volatility is primarily measured using the Bollinger Band Width Percentile (BBWP) indicator, which was created by The_Caretaker. BBWP plots the volatility of the asset's price, given by Bollinger Band width, relative to past volatility by assigning the volatility readings into percentiles. The indicator also includes a moving average of the BBWP itself, where a crossover to the upside represents expanding volatility and a crossover to the downside represents contracting volatility. This indicator is used to confirm a signal given by the momentum indicators - a momentum signal that is given during a period of expanding volatility has a greater likelihood of success. Therefore, when the BBWP crosses above its moving average by a given threshold, a previously triggered momentum signal is considered to be "confirmed." The threshold for this crossover can be set using the "BBWP Confirmation Threshold" setting. However, it is also relevant that periods of extreme volatility often accompany an extremity in price action (a "top" or "bottom"), in which case the BBWP is likely to contract after price reaches such an extremity. This phenomenon is captured by also using "extreme reads" on the momentum indicator to signal that there has already been enough volatility to confirm a momentum signal. If the RSI gives an "extreme read" before triggering a signal, the momentum signal is also considered to be confirmed. For example, if the RSI is above 80, breaks below 80, and then gives a SELL signal, this sell signal is considered to be confirmed without requiring the BBWP to crossover its moving average to the upside. The threshold that would confirm a SELL signal can be set with the "Overbought" setting, and the threshold that would confirm a BUY signal can be set with the "Oversold" setting. Whenever a volatility signal confirms a momentum signal, a medium-sized horizontal bar will be plotted on the pane in the same directional color as the momentum signal. Note that a momentum signal may trigger at the exact same time as the volatility signal which confirms it; in this case, only the medium-sized bar will be visible on the pane, but its direction can still be identified by its color.
Lastly, to reduce the likelihood of "false signals," a trend indicator is used to confirm the direction of the signal. This is typically an exponential moving average. If a confirmed volatility SELL signal is given, and the closing price is below the moving average, then the SELL signal is also confirmed by the trend. Likewise, if a confirmed volatility BUY signal is given, and the closing price is above the moving average, then the BUY signal is confirmed by the trend. The type and length of the moving average used to verify the trend can be set using the "Moving Average Type" and "Moving Average Length" settings found below the momentum/volatility settings. A trend signal is plotted on the pane as a tall horizontal bar, and is more deeply colored than the momentum and volatility signals.
For maximum confluence, it is recommended that the trend signal, given by the tallest bar, is the one that forms the basis of trades executed while using the Triple Threat indicator. It is possible to enter more aggressive trades with better entries by using only the volatility signal, given by the medium-sized bar, however this entails greater risk and should only be done in confluence with an additional trading strategy of your own discretion. Backtesting has shown that using the volatility signal alone underperforms using the volatility signal in confluence with the trend signal.
Please also be advised that the default setting are optimized for Bitcoin's daily chart only. The indicator is still applicable to other timeframes and asset classes, but the settings may need to be modified. I have a list of settings for other Bitcoin timeframes, and I would be happy to share them upon request.
I hope you can find this indicator to be of some use to your trading strategies. I'd be happy to hear any feedback from the community, so please don't hesitate to reach out. Stay safe, and happy trading.

Swing Trade System# Swing Trade Strategy - Complete Guide
## Overview
This is a comprehensive swing trading indicator for TradingView that identifies high-probability trend continuation setups using multi-timeframe analysis, pullback patterns, and momentum confirmation. The strategy combines technical indicators with risk management tools to help traders capture swing moves with defined risk-reward parameters.
## What It Does
The indicator identifies two types of signals:
1. **Base Signals** (small markers) - Initial setup detection with basic criteria met
2. **High Confidence (HC) Signals** (large markers) - Fully confirmed setups with all filters passed, including optional higher timeframe confirmation
Once a HC signal triggers, the indicator automatically plots:
- Dynamic stop loss levels (trailing, break-even, or static)
- Partial take profit (TP1) at 1R
- Final take profit (TP2) at your chosen risk-reward multiple
- Real-time R-multiple tracking
- Confluence dashboard showing all conditions
## How It Works
### Core Signal Logic
The strategy identifies pullback-to-trend entries using this sequence:
**For LONG signals:**
1. **Trend Filter**: Fast EMA (20) above Slow EMA (50) = uptrend confirmed
2. **Pullback**: Previous candle closed between the two EMAs (pulled back but didn't break structure)
3. **RSI Swing Zone**: RSI between 40-60 (not overbought/oversold, just resting)
4. **Reclaim**: Current candle crosses back above Fast EMA (momentum returning)
5. **Volume Spike** (optional): Current volume > 1.5x the 20-period average
6. **HTF Confirmation** (optional): Daily timeframe shows: price > 50 EMA, RSI > 50, and rising momentum
**For SHORT signals:**
The same logic applies in reverse (downtrend, pullback above fast EMA, reclaim below, etc.)
### Risk Management Features
**Stop Loss Placement:**
- Initial stop: Swing low/high over the last 10 bars
- Can upgrade to ATR trailing stop (2x ATR below/above price)
- Can move to break-even after reaching 1R profit
**Take Profit Levels:**
- TP1: 1R (optional partial exit point)
- TP2: 2R default (adjustable to your preference)
**Position Monitoring:**
- Live R-multiple display shows current profit/loss in risk units
- Dynamic stop updates visually on chart
- Color-coded confidence score (0-100%) based on confluence of factors
## Best Way to Use These Signals
### 1. **Wait for High Confidence Signals Only**
- Don't trade every base signal (small markers)
- Only take trades when you see the large "HC L" or "HC S" markers
- These have passed all your filters including higher timeframe alignment
### 2. **Ideal Entry Timing**
**On the Signal Candle:**
- Enter at market close when HC signal fires
- This ensures all conditions were met by candle close
- Your stop and targets are calculated from this close price
**On the Next Candle (more conservative):**
- Wait for the candle after the signal
- Enter if price continues in the signal direction
- Helps avoid false breakouts but may miss some moves
### 3. **Position Sizing**
Use the automatic risk calculation:
- Your risk = Entry price - Stop loss
- Position size = (Account Risk %) ÷ (Entry - Stop)
- Example: Risk $100 on account, Entry $50, Stop $48 = $100 ÷ $2 = 50 shares
### 4. **Trade Management**
**Scaling Out:**
- Exit 50% position at TP1 (1R) to lock profits
- Move stop to break-even on remaining position
- Let rest run to TP2 (2R) or trail with ATR stop
**Manual Override:**
- If price action deteriorates (breaks below both EMAs, RSI divergence), consider early exit
- The dynamic stop is a guide, not gospel—trust price action
## Breakout vs. Retest Strategy
### Understanding Breakout Types
**1. First Touch Breakout (Aggressive)**
- HC signal fires on first touch of fast EMA after pullback
- Higher win rate if volume is strong
- Best in strongly trending markets
- Risk: Could be a false breakout if momentum weak
**2. Retest Entry (Conservative)**
- Wait for price to pull back *again* after initial HC signal
- Enter when price retests the fast EMA a second time
- Look for: lower volume on retest, RSI still in swing zone, fast EMA still above slow EMA
- Lower risk but may miss some fast moves
### Which Breakouts to Take
**Take the FIRST breakout (signal candle) when:**
- ✅ Higher timeframe is strongly aligned (HTF confirmation on)
- ✅ Volume spike is present (>1.5x average)
- ✅ Confidence score ≥70%
- ✅ Trend is fresh (EMAs recently crossed, not extended)
- ✅ Price closed strongly above/below fast EMA (not barely crossed)
- ✅ No major resistance/support nearby
**Wait for a RETEST when:**
- ⚠️ No volume confirmation on first signal
- ⚠️ Confidence score 40-69% (moderate)
- ⚠️ Price barely crossed the fast EMA (weak momentum)
- ⚠️ Trend is extended (price far from slow EMA)
- ⚠️ Major resistance/support level just ahead
- ⚠️ Late in the trading day/week (could see pullback)
### How to Trade Retests
**Setup:**
1. HC signal fires but you decide to wait
2. Price pulls back toward fast EMA over next 1-3 candles
3. Watch for second bounce at the fast EMA
**Confirmation for Retest Entry:**
- Price holds above fast EMA (for longs) without closing below it
- Volume decreases on the pullback (profit-taking, not reversal)
- RSI stays above 50 for longs (or below 50 for shorts)
- Bullish candlestick pattern forms (hammer, engulfing, etc.)
- Slow EMA is still providing support/resistance
**Retest Entry Trigger:**
- Enter when price crosses back in signal direction with momentum
- Or enter with a limit order at the fast EMA
- Use same stop loss as original signal (swing low/high)
- Targets remain the same (measured from your new entry)
## Dashboard Reference
The top confluence table shows real-time status:
- **Trend**: Current trend direction based on EMAs
- **HTF**: Higher timeframe alignment (if enabled)
- **RSI Zone**: Whether RSI is in the 40-60 swing zone
- **Volume**: Volume spike present or not
- **Signal**: Current signal status (HC LONG/SHORT or None)
- **R Risk**: Current profit/loss in R-multiples
- **Stop**: Current stop loss price
- **TP1/TP2**: Status of take profit levels
- **Conf %**: Overall confidence score (70%+ = high probability)
## Alert Setup
The indicator includes 8 alert types:
1. **HC LONG/SHORT ENTRY** - Main trade signals
2. **LONG/SHORT TP1 Reached** - Partial profit alerts
3. **LONG/SHORT Final TP Reached** - Full target hit
4. **LONG/SHORT Stop Hit** - Exit alerts
Set up alerts in TradingView:
- Click "Create Alert" on the indicator
- Choose the specific alert condition
- Set to "Once Per Bar Close" to avoid false alerts
- Configure notification method (app, email, webhook, etc.)
## Recommended Settings
**For Stock Swing Trading (4H-Daily):**
- Fast EMA: 20 | Slow EMA: 50
- Swing Lookback: 10
- RSI Zone: 40-60
- HTF: Daily (if trading 4H charts)
- Risk-Reward: 2R minimum
**For Crypto (faster moves):**
- Fast EMA: 12 | Slow EMA: 26
- Swing Lookback: 7
- RSI Zone: 35-65
- Volume Spike: ON
- Risk-Reward: 1.5-2R
**For Conservative Trading:**
- Enable HTF Confirmation
- Enable Volume Spike requirement
- Use Break-even stop (move after 1R)
- Only trade when Confidence ≥70%
- Wait for retests on marginal setups
## Risk Warning
This indicator is a tool, not a guarantee. Always:
- Use proper position sizing (risk 1-2% per trade)
- Respect the stop losses
- Consider market context (news, earnings, major levels)
- Backtest on your instruments before live trading
- Never override risk management for FOMO
The best signals combine technical confluence with good market conditions and disciplined execution.

Mickey's Breaker Engine⚡ Breaker Engine | Auto Retest + Smart R:R Targets
A precision-grade breaker-block detection system built for traders who live and breathe clean structure.
This indicator automatically detects Breaker Candles, confirms them, marks their zones, and executes intelligent retest-based entry logic — complete with Stop-Loss and Risk-to-Reward (R:R) tracking up to 3R (or any custom ratio).
🧠 Core Concept
A Breaker Block is a structural shift where price violates liquidity from a failed order block and flips the zone’s polarity — turning a former supply into demand (or vice-versa).
This script identifies those setups automatically, confirms them only after a valid structure break, and waits for a clean retest to trigger a trade signal.
🚀 Key Features
⚙️ Smart Zone Detection
Detects both Bullish Breakers and Bearish Breakers.
Zones are drawn precisely using the breaker’s middle candle body (or full wick range if enabled).
Fully configurable transparency, width, and extension for better visual context.
🎯 Auto Retest Entry Logic
Entry triggers only on a clean retest, not on immediate breakout.
Includes logical filters to ensure retests are structurally valid and not overlapping candles.
Works in any timeframe or market — crypto, forex, indices, or commodities.
💡 Dynamic Risk–Reward Tracking
Automatically plots 1R, 2R, 3R, ...R targets based on your defined stop range.
Risk is calculated from entry to zone boundary or ATR offset.
Each target label appears precisely when hit.
Targets automatically stop updating once Stop-Loss is triggered.
🧱 Visual Clarity
BUY 🟢 / SELL 🔴 bubbles at entries.
SL ❌ marker when stop is hit.
🎯 1R / 2R / 3R labels dynamically plotted when each reward level is reached.
Non-overlapping placement using ATR-based spacing.
⚡ Real-Time Alerts - Instant alerts for:
✅ “Breaker BUY” – Clean retest confirmed (Long setup)
✅ “Breaker SELL” – Clean retest confirmed (Short setup)
❌ “Breaker BUY SL” – Stop hit for Long
❌ “Breaker SELL SL” – Stop hit for Short
🧩 Customization Panel
| Setting | Description |
| :-------------------------- | :------------------------------------------------------------------------------ |
| **ATR Length** | Controls volatility-based offset sizing. |
| **Entry / SL Offset × ATR** | Adjusts label spacing and dynamic positioning. |
| **Risk-Reward Ratio** | Define default R:R (e.g. 1:3). |
| **Multiple Retests** | Enable if you want the same breaker zone to allow multiple retests/entries. |
| **Banner Design** | Control opacity, extension, and wick usage for the breaker block visualization. |
| **Color Controls** | Choose your BUY/SELL/SL bubble colors to match your chart theme. |
⚙️ Underlying Logic (At a Glance)
Pattern Detection:
Identifies a 5-bar sequence that forms a valid Breaker Candle (the middle bar flips structure).
Confirmation:
Requires a follow-through candle to validate a real liquidity break.
Zone Registration:
Stores the breaker zone’s body range in arrays for tracking.
Clean Retest Entry:
Waits for price to retest the zone from the opposite side and close cleanly inside.
Stop Loss / Target Projection:
Defines stop loss just beyond the zone and plots up to 3 × reward targets dynamically.
Monitoring & Alerts:
Tracks each setup independently until either an R-target or SL is reached.
💬 Recommended Usage
Works best with market-structure traders, smart-money concepts, or liquidity-based systems.
Combine it with an external displacement confirmation or BOS/CHOCH tool for best precision.
Ideal for backtesting breaker-based R:R consistency or forward-testing retest entries.
Compatible with any asset / timeframe.
🧭 Disclaimer
This script is for educational and analytical purposes only.
It is not financial advice and should not be used to make trading decisions without independent confirmation or risk management.
Always test on demo data before deploying live.

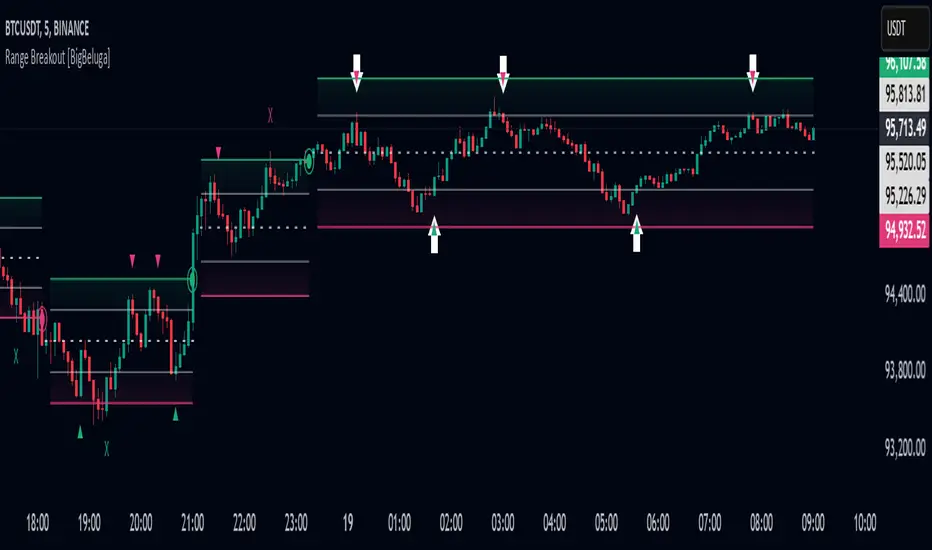
Range Breakout [BigBeluga]Range Breakout is a dynamic channel-based indicator designed to identify breakout opportunities and price reactions within defined ranges. It automatically creates upper and lower bands with a midline, helping traders spot breakout zones, retests, and potential fakeouts.
🔵 Key Features:
Dynamic Channel Formation:
Automatically plots upper and lower channel bands with a midline based on ATR calculations.
Channels adjust upon breakout events or after a predefined number of bars to reflect new price ranges.
Breakout Detection:
Green circles appear when price breaks above the upper channel edge.
Red circles appear when price breaks below the lower channel edge.
A new channel is formed after each breakout, allowing traders to monitor evolving price ranges.
Retest Signals:
Upward-pointing green triangles signal a retest of the lower band, indicating potential support.
Downward-pointing red triangles indicate a retest of the upper band, suggesting possible resistance.
Filter Signals by Trends (New Feature):
Optional toggle to filter ▲ and ▼ signals based on channel breakout conditions.
When enabled:
In a bullish channel (confirmed by a green circle breakout), only ▲ signals are displayed.
In a bearish channel (confirmed by a red circle breakout), only ▼ signals are displayed.
Helps traders align retest signals with the prevailing trend for higher-quality trade setups.
Fakeout Identification:
'X' symbols appear when price breaks the upper or lower edge of the channel and quickly returns back inside.
Helps traders identify and avoid false breakouts.
🔵 Usage:
Breakout Trading: Use the green and red circle signals to identify potential breakout trades.
Retest Confirmation: Look for triangle markers to confirm retests of key levels, aiding in entry or exit decisions.
Fakeout Alerts: Utilize the 'X' signals to spot and avoid potential trap moves.
Dynamic Range Monitoring: Stay aware of changing market conditions with automatically updating channels.
Range Breakout is an essential tool for traders seeking to capitalize on range breakouts, retests, and fakeout scenarios. Its dynamic channels and clear visual signals provide a comprehensive view of market structure and potential trade setups.
Trend Levels [ChartPrime]The Trend Levels indicator is designed to identify key trend levels (High, Mid, and Low) during market trends, based on real-time calculations of highest, lowest, and mid-level values over a customizable length. Additionally, the indicator calculates trend strength by measuring the ratio of candles closing above or below the midline, providing a clear view of the ongoing trend dynamics and strength.
⯁ KEY FEATURES AND HOW TO USE
⯌ Trend Shift Signals :
Trend shifts, based on highest and lowest values during input length. When high is == to highest it will change trend to up when low == lowest value it will be shift to down trend.
// Calculate highest and lowest over the specified length
h = ta.highest(length)
l = ta.lowest(length)
// Determine trend direction: if the current high is the highest value, set trend to true
if h == high
trend := true
// If the current low is the lowest value, set trend to false
if l == low
trend := false
Whenever the trend changes direction (from uptrend to downtrend or vice versa), the indicator provides visual cues in the form of arrows. This gives traders clear signals to identify potential trend reversals, enabling them to adjust their strategies accordingly.
⯌ Trend Level Calculation :
As soon as a trend is detected (uptrend or downtrend), the indicator starts calculating the highest, lowest, and mid-level values over the defined period. These levels are plotted on the chart as color-coded lines for easy visualization, allowing traders to quickly spot the key levels within a trend.
⯌ Midline Retests :
Throughout the trend, the mid-level line is often retested, acting as a potential zone for pullbacks or rejections. Traders can use these retests as opportunities for entering positions or confirming trend continuation. The chart shows how price frequently interacts with the midline, helping to identify important reaction levels.
⯌ Trend Strength Calculation :
The indicator measures the trend strength by calculating the delta between the number of candles closing above and below the midline. This percentage-based delta is displayed in real-time, providing a clear indication of whether the trend is gaining or losing momentum.
⯁ USER INPUTS
Length : Specifies the lookback period for calculating the highest and lowest values, which determines the key trend levels.
Candle Counting : Measures the number of candles closing above and below the midline to calculate the trend strength delta.
⯁ CONCLUSION
The Trend Levels indicator provides traders with a powerful tool for visualizing trend dynamics, key levels of support and resistance, and real-time trend strength. By identifying midline retests, tracking candle counts, and providing trend shift signals, this indicator can help traders make well-informed decisions during market trends.

Preday Price ChannelPreday Price Channel Indicator
This indicator is designed to help traders easily observe and capitalize on key price levels and their implications on market trends. It displays the previous day's high and low prices, as well as lines representing Fibonacci ratios between these prices. When a high or low is double-broken (retested and broken again), the indicator confirms a trend change and fills the channel with orange or navy color to visually indicate this shift.
Before a large directionality appears in the market, a breakout of the previous day's high or low must occur in that direction. As long as the previous day's low is maintained, an uptrend persists, and as long as the previous day's high is maintained, a downtrend persists.
In the crypto market, the significance of the previous day's high or low is often underemphasized and less known. This simple indicator was created to help traders observe the powerful influence of the previous day's high and low, and to potentially use it to their advantage in trading.
Wishing you successful trading with this tool.
Options
Day Open: Check this box to display the current day's opening price on the chart. The opening price of the day often remains intact and is one of the simplest and most powerful indicators of whether the day's trend is upward or downward.
Preday Open: Check this box to display the previous day's opening price on the chart. The previous day's opening price often exhibits a strong tendency for retests.
Preday High and Low: Check this box to display the previous day's high and low prices on the chart. These levels are critical for determining potential breakout points.
FIB On: Check this box to display the Fibonacci ratios between the previous day's high and low prices. This feature helps identify potential support and resistance levels within this range.
Day Mid On: Check this box to display the midpoint of the preday's price range on the chart. This serves as a reference point for trend changes.
Day Trend Color On: Check this box to enable color-coding for uptrends and downtrends based on the previous day's high and low prices.
When the previous day's high is breached, the trend value is set to 2, and an orange shaded area is filled in.
When the previous day's low is breached, the trend value is set to -2, and a navy shaded area is filled in.
When a high or low is double-broken (retested and broken again), the indicator confirms the trend change, filling the channel with orange for an uptrend and navy for a downtrend to make it easy for users to recognize the trend change.
These trend values and colors remain as long as the midpoint of the previous day's price range is not violated, indicating the trend is still valid.
If, during a downtrend (trend value of -2), the low price crosses above the previous day's midpoint, the trend value changes to 1, indicating a potential issue in the downtrend, and a light orange color is displayed.
Conversely, if, during an uptrend (trend value of 2), the high price crosses below the previous day's midpoint, the trend value changes to -1, signaling a potential issue in the uptrend, and a light navy color is displayed.
This comprehensive set of features allows traders to make informed decisions by clearly observing key price levels and their implications on market trends.

Quasimodo (QML) Pattern [Kodexius]Quasimodo (QML) Pattern is a market structure indicator that automatically detects Bullish and Bearish Quasimodo formations using confirmed swing pivots, then visualizes the full structure directly on the chart. The script focuses on the classic liquidity-grab narrative of the QML: a sweep beyond a prior swing (the Head) followed by a decisive market structure break (MSB), leaving behind a clearly defined reaction zone between the Left Shoulder and the Head.
Detection is built on pivot highs and lows, so patterns are evaluated only after swing points are validated. Once a valid 4 pivot sequence is identified, the indicator draws the pattern legs, highlights the internal triangle area to emphasize the grab, marks the MSB leg, and projects a QML zone that can be used as a potential area of interest for retests.
This tool is designed for traders who work with structure, liquidity concepts, and reversal/continuation triggers, and who want a clean, repeatable QML visualization without manually marking swings.
🔹 Features
🔸 Confirmed Pivot Based Structure Mapping
The script uses classic built-in pivot logic to detect swing highs and swing lows.
🔸 Automatic Bullish and Bearish QML Detection
The indicator evaluates the most recent 4 pivots and checks for a valid alternating sequence (High-Low-High-Low or Low-High-Low-High). When the sequence matches QML requirements, the script classifies the setup as bullish or bearish:
Bullish logic (structure reversal up):
- Left Shoulder is a pivot Low
- Head is a lower Low than the Left Shoulder (liquidity sweep)
- MSB pivot exceeds the Reaction pivot
Bearish logic (structure reversal down):
- Left Shoulder is a pivot High
- Head is a higher High than the Left Shoulder (liquidity sweep)
- MSB pivot breaks below the Reaction pivot
🔸 Full Pattern Visualization (Legs + Highlighted Core)
When a pattern triggers, the script draws:
Three main legs: Left Shoulder to Reaction, Reaction to Head, Head to MSB
A shaded triangular highlight over the internal structure to make the liquidity-grab shape easy to spot at a glance
🔸 QML Zone Projection
A QML Zone box is drawn using the price range defined between the Left Shoulder and the Head, then extended to the right to remain visible as price develops. This zone is intended to act as a practical reference area for potential retests and reaction planning after MSB confirmation.
🔸 MSB Emphasis
A dotted MSB line is drawn between the Reaction point and the MSB point to visually emphasize the confirmation leg that completes the pattern logic.
🔸 Clean Point Tagging and Directional Labeling
Key points are labeled directly on the chart:
- “LS” at the Left Shoulder
- “Head” at the sweep pivot
- “MSB” at the break pivot
A directional label (“Bullish QML” or “Bearish QML”) is also printed to quickly identify the detected bias.
🔸 Configurable Visual Style
All main visual components are user configurable:
- Bullish and bearish colors
- Line width
- Label size
🔸 Efficient Update Logic
Pattern checks are only performed when a new pivot is confirmed, avoiding unnecessary repeated calculations on every bar. The most recent pattern’s projected elements (zone and label positioning) are updated as new bars print to keep the latest setup readable.
🔹 Calculations
This section summarizes the core logic used for detection and plotting.
1. Pivot Detection (Swing Highs and Lows)
The script relies on confirmed pivots using the user inputs:
Left Bars: how many bars must exist to the left of the pivot
Right Bars: how many bars must exist to the right to confirm it
float ph = ta.pivothigh(leftLen, rightLen)
float pl = ta.pivotlow(leftLen, rightLen)
When a pivot is confirmed, its true bar index is the pivot bar, not the current bar, so the script stores:
bar_index
2. Pivot Storage and History Window
Each pivot is stored as a structured object containing:
- price
- index
- isHigh (true for pivot high, false for pivot low)
A rolling history is maintained (up to 50 pivots) to keep processing stable and memory usage controlled.
3. Sequence Validation (Alternation Check)
The pattern evaluation always uses the latest 4 pivots:
p0: Left Shoulder candidate
p1: Reaction candidate
p2: Head candidate
p3: MSB candidate
Before checking bullish/bearish rules, the script enforces alternating pivot types:
bool correctSequence =
(p0.isHigh != p1.isHigh) and
(p1.isHigh != p2.isHigh) and
(p2.isHigh != p3.isHigh)
This prevents invalid structures like consecutive highs or consecutive lows from being interpreted as QML.
4. Bullish QML Conditions
A bullish QML is evaluated when the Left Shoulder is a Low:
Head must be lower than Left Shoulder (sweep)
MSB must be higher than Reaction (break)
if not p0.isHigh
if p2.price < p0.price and p3.price > p1.price
// Bullish QML confirmed
Interpretation:
p2 < p0 represents the liquidity grab below the prior swing low
p3 > p1 represents the market structure break above the reaction high
5. Bearish QML Conditions
A bearish QML is evaluated when the Left Shoulder is a High:
Head must be higher than Left Shoulder (sweep)
MSB must be lower than Reaction (break)
if p0.isHigh
if p2.price > p0.price and p3.price < p1.price
// Bearish QML confirmed
Interpretation:
p2 > p0 represents the liquidity grab above the prior swing high
p3 < p1 represents the market structure break below the reaction low
6. Drawing Logic (Structure, Highlight, Zone, Labels)
When confirmed, the script draws:
Three connecting legs (LS to Reaction, Reaction to Head, Head to MSB)
A shaded triangle using a transparent “ghost” line to enable filling
A dotted MSB emphasis line between Reaction and MSB
A QML Zone box spanning the LS to Head price range and projecting to the right
Point labels: LS, Head, MSB
A direction label: “Bullish QML” or “Bearish QML”
7. Latest Pattern Extension
To keep the newest setup readable, the script updates the most recently detected pattern by extending its projected elements as new bars print:
QML zone right edge is pushed forward
The main label x position is pushed forward
This keeps the last identified QML zone visible as price evolves, without having to redraw historical patterns on every bar.

Accumulation And Distribution Zones (Zeiierman)█ Overview
Accumulation And Distribution Zones (Zeiierman) is a structural zone indicator that highlights where the market has recently been absorbing sell pressure (Accumulation) or releasing buy pressure (Distribution).
The indicator tracks a refined sequence of swing highs and lows and measures how these swings tighten, expand, or step directionally. When they form staircase-style structures such as higher lows with compressing highs for Accumulation or lower highs with compressing lows for Distribution, the script marks these areas as shifts in market control.
Once the full pattern completes, the indicator converts it into an Accumulation or Distribution zone. Each zone is based on a confirmed structural sequence rather than a single point, making it more reliable and reflective of actual market behavior.
The indicator can also display a mini-volume profile within each zone and extend POC levels forward, showing where trading activity clustered most. Combined, these features reveal areas where price has recently shown acceptance, absorption, or rejection, helping you understand whether current price action is reacting to, breaking from, or retesting these important structural regions.
█ How It Works
⚪ Swing Structure
The indicator builds its foundation by detecting swing highs and lows using a configurable Swing Detection Window. Each confirmed swing is stored with its price, time, bar index, and direction. If two consecutive swings share the same direction, only the more extreme one is kept. This produces a clean structural sequence that removes noise and keeps only meaningful turning points.
⚪ Accumulation vs Distribution Pattern Logic
Using the refined swing sequence, the script looks for staircase-style formations that signal shifts in control:
Accumulation (bottoming): higher lows combined with compressing highs.
Distribution (topping): lower highs combined with compressing lows.
Two detection modes are available:
Quick for compact 4-swing formations
Slow for broader 6-swing structures
When a full structural pattern completes, the indicator marks the zone and resets the swing buffer for the next formation.
⚪ Volume Profile Construction
The price range between the zone’s upper and lower boundary is divided into several Rows. For every bar within the zone’s swing range, the bar’s volume is added to the appropriate price row.
Volume is classified as:
Bullish volume when close > open
Bearish volume when close < open
Each row is drawn as two horizontal segments (bull and bear), colored with smooth gradients based on your bull/bear color settings. This creates a compact profile that reveals where trading activity is concentrated inside the zone and whether buyers or sellers dominate those price levels.
█ How to Use
The indicator is designed to provide context and confluence, not raw buy/sell signals.
⚪ Spot Fresh Accumulation & Distribution
Use newly printed zones as a map of where the market has recently:
Absorbed selling and formed a floor (Accumulation below price).
Absorbed buying and formed a cap (Distribution above price).
In a trending environment, fresh accumulation zones below price are often areas to watch for pullbacks, while distribution zones above price can act as sell zones or targets.
⚪ Volume Profile
Longer horizontal bars show where the market traded the most volume inside the zone.
Bull-leaning rows inside an accumulation zone often signal strong buying interest during the formation.
Bear-leaning rows inside a distribution zone highlight concentrated selling pressure.
By combining this volume distribution with the zone label and the broader trend context, you can judge whether the structure is more likely to hold, break, or retest as the price approaches it again.
⚪ POC (Point of Control) Trading
Extended POC zones (Regular or Faded) can be treated as dynamic support/resistance rails:
When price revisits a prior accumulation POC and rejects it from above, the level may act as support. When price retests a distribution POC from below and fails to break through, it can act as resistance.
⚪ Combine with Your Own Strategy
The script does not decide direction for you. You get the most value by combining it with:
Your own trend filters (moving averages, higher timeframe structure, volatility measures).
Your preferred entry models (reversal candles, momentum breaks, liquidity grabs, etc.).
Higher-timeframe mapping.
Think of this tool as a map of where the market did meaningful business. You decide how to trade around those areas.
█ Settings
Acc/Dist Ranges – Master switch for drawing all Accumulation and Distribution zones. Turn this off to temporarily hide boxes while leaving supporting logic active.
Pattern – Shows or hides the swing-based pattern outline that formed each zone. Good for structural debugging and education.
Pattern Sensitivity
Quick – more responsive, detects smaller compact structures.
Slow – stricter, focuses on wider and more established zones.
Swing Detection Window – Pivot width used to confirm swing highs and lows. Larger values filter noise and produce bigger zones; smaller values pick up more minor structures.
Volume Profile – Enables the embedded volume profile inside each zone.
Rows – Number of price slices used to aggregate volume in the zone. Higher values give more detail but increase visual density.
Switch Order – Flips the horizontal order of bull vs bear volume segments within each row.
Extend Zones – Behaviour of POC and zone extension:
None – No forward extension.
Faded Zones – Store and draw up to four past POC zones as faded horizontal levels.
Regular Zones – Extend POC boxes forward until price breaks out.
-----------------
Disclaimer
The content provided in my scripts, indicators, ideas, algorithms, and systems is for educational and informational purposes only. It does not constitute financial advice, investment recommendations, or a solicitation to buy or sell any financial instruments. I will not accept liability for any loss or damage, including without limitation any loss of profit, which may arise directly or indirectly from the use of or reliance on such information.
All investments involve risk, and the past performance of a security, industry, sector, market, financial product, trading strategy, backtest, or individual's trading does not guarantee future results or returns. Investors are fully responsible for any investment decisions they make. Such decisions should be based solely on an evaluation of their financial circumstances, investment objectives, risk tolerance, and liquidity needs.

VolumeAnlaysis### Volume Analysis (VA) Indicator
**Overview**
The Volume Analysis (VA) indicator is a dynamic overlay tool designed for traders seeking to identify high-volume breakouts, retests, and multi-timeframe volume-driven price cycles. By combining volume spikes with price action and support/resistance boxes, it highlights potential trend continuations, reversals, and cycle shifts. Ideal for intraday and swing trading on stocks, forex, or crypto, it uses a Fibonacci-inspired 1.618 multiplier to detect significant volume surges, then maps them to visual boxes and key levels for actionable insights.
This indicator draws from volume profile concepts but focuses on **breakout confirmation** and **cycle momentum**, helping you spot when "smart money" volume aligns with price extremes. It's particularly useful in volatile markets where volume precedes price moves.
**How It Works**
1. **Volume Break Detection**:
- Identifies a "Volume Break" when the current bar's volume exceeds 1.618x the highest volume from the prior 5 bars. This signals unusual activity, often preceding breakouts.
- A "Volume Retest" triggers exactly 3 bars after a break if volume has been falling steadily over those 3 bars—indicating a pullback for re-accumulation/distribution.
2. **Visual Annotations**:
- **Labels**: Green/red/yellow labels mark Volume Breaks and Retests, positioned above/below the bar based on candle direction for clarity.
- **Demand/Supply Boxes**:
- Blue semi-transparent boxes form around Retest bars, extending rightward to act as dynamic support/resistance.
- Green (bullish) or red (bearish) boxes draw from Volume Breaks, based on the original candle's open/close, highlighting potential zones for continuation.
- Limited to 5 boxes max to avoid chart clutter; older boxes fade as new ones form.
3. **Box Interaction Signals**:
- When price enters a box:
- **Reversal Hints**: Maroon (bearish rejection) or lime (bullish rejection) labels on closes against the trend with opening price momentum.
- **Breakout Arrows**: Up/down arrows on crossovers/crossunders of box tops/bottoms from Retest boxes.
- Scans all active boxes for interactions, prioritizing recent volume events.
4. **Multi-Timeframe Volume Cycles**:
- Aggregates the "Volume Break Max" level (a proxy for key price extremes tied to volume spikes) across timeframes: 1min, 5min, 10min, 30min, and 65min (using `request.security`).
- Computes **MaxVolBreak** (highest extreme) and **MinVolBreak** (lowest extreme) for trend-following levels.
- Tracks **Percent Volume Greater/Less Than Close**: Sums volumes from TFs where price is below/above these levels, creating a momentum ratio.
- **CrossClose**: Plots the prior close where this ratio crosses (gray line), signaling cycle shifts—bullish below MinVolBreak, bearish above MaxVolBreak.
- **Fills**: Red fill above CrossClose/MaxVolBreak (bearish cycle); green below CrossClose/MinVolBreak (bullish cycle).
5. **Plots**:
- Black lines for MaxVolBreak (⏫) and MinVolBreak (⏬).
- Gray 🔄 for CrossClose.
- Colors dynamically adjust (green/red) based on close relative to levels.
**Key Features**
- **Trend vs. Reversal Modes**: Toggle alerts for trend-following breaks (crosses of Max/MinVolBreak) or reversal signals (crosses of CrossClose).
- **Multi-TF Fusion**: Optionally include the chart's native timeframe in Max/Min calculations for finer tuning.
- **Box Management**: Auto-prunes to 5 boxes; focuses on retest/break alignments for "inside bar" logic.
- **Momentum Filters**: Uses rising/falling opens and crossovers for label precision, reducing noise.
- **Customizable**: Simple inputs for alert visibility and timeframe inclusion.
**Settings**
| Input | Default | Description |
|-------|---------|-------------|
| Show Volume Reversal Breaks | False | Enables alerts/labels for CrossClose crosses (cycle reversals). |
| Show Trend Following Breaks | True | Enables alerts for Max/MinVolBreak crosses (trend signals). |
| Use Current Time | False | Includes chart's native TF in multi-TF Max/Min calculations. |
**Alerts**
- **Reversal Alerts** (if enabled): "Volume Reverse Bullish/Bearish Break of " on close crosses of CrossClose.
- **Trend Alerts** (if enabled): "Trend Volume Bullish/Bearish Signal" on close crosses of Max/MinVolBreak; plus notes if prior low/high aligns with levels.
- All alerts include ticker and level value for easy scanning. Use `alert.freq_once_per_bar` to avoid spam.
**Trading Ideas**
- **Bullish Entry**: Green box formation + price holding MinVolBreak + upward arrow on retest box. Target next resistance.
- **Bearish Entry**: Red box + close above MaxVolBreak + red fill activation. Stop below recent low.
- **Cycle Trading**: Watch CrossClose crosses for regime shifts—fade extremes in overextended cycles.
- **Best Timeframes**: 5-30min for intraday; combine with daily for swings. Works best on liquid assets with reliable volume data.
**Limitations & Notes**
- Relies on accurate volume data (e.g., stocks/forex); less effective on low-volume or synthetic instruments.
- Boxes extend rightward but don't auto-delete—monitor for clutter on long histories (max_bars_back=500).
- Some logic (e.g., exact 3-bar retest) is rigid; backtest for your market.
- Open-source under MPL 2.0—fork and tweak as needed!
For questions or enhancements, drop a comment below. Happy trading! 🚀

RSI Breakout Zones█ OVERVIEW
“RSI Breakout Zones” is a technical analysis tool that identifies significant zones on the chart based on the Relative Strength Index (RSI). The indicator maps overbought (OB) and oversold (OS) zones using boxes, then extends them until the next zone of the same type is detected, highlighting breakout points to aid in trade entry decisions. These zones often serve as areas of consolidation, support, or resistance.
█ CONCEPTS
The indicator identifies overbought (above 70) and oversold (below 30) zones, drawing boxes that extend until the next zone of the same type (OB for OB, OS for OS) is detected. Breakout signals are generated when the price crosses the zone boundaries, indicating potential shifts in market momentum.
Why are RSI zones important? These zones represent areas of extreme market sentiment, often leading to corrections or reversals. Overbought zones suggest potential selling pressure, while oversold zones indicate buying opportunities. After a breakout, a zone may switch roles, e.g., from support to resistance or vice versa, making it a key element in price action analysis. Larger zones, formed during high volatility, may attract price for retests due to stronger imbalances in buyer/seller dynamics. Consolidation often occurs within these zones as the market seeks equilibrium before further moves. However, in strong trends, zones may be decisively broken without immediate pullbacks, and their significance depends on their position relative to key support and resistance levels.
█ FEATURES
- RSI Zone Detection: Calculates RSI with a customizable length (default 14) and identifies overbought/oversold zones based on user-defined levels (default 70/30), drawing boxes that dynamically adjust to price action within the zone.
- Customizable Boxes: Zones extend until the next zone of the same type is detected. The indicator draws zones with adjustable colors for overbought (red) and oversold (green) areas, with options for box and zone transparency.
- Breakout Signals: Generates upward (green triangle) and downward (red triangle) breakout signals when the price crosses the top or bottom of a zone. Signals appear below or above the bar, indicating potential trade entry points.
- Midline: Automatically draws a dashed line at the midpoint of each zone, helping traders assess price behavior within the zone and potential halfway retests.
- Box Management: Option to remove outdated boxes.
- Alerts: Built-in support for alerts on breakout signals, enabling traders to receive notifications for key zone crossings.
█ HOW TO USE
Add to Chart: Apply the indicator to your TradingView chart via the Pine Editor or Indicators menu.
Configure Settings:
- RSI Settings: Adjust RSI Length (default 14), Overbought Level (default 70), and Oversold Level (default 30) to tailor zone detection sensitivity—higher lengths smooth signals for longer-term analysis.
- Box Settings: Configure colors and transparency for overbought (red) and oversold (green) zones, including box transparency (default 90) and zone transparency (default 90).
- Signal Settings: Customize breakout signal colors (green for upward, red for downward) and enable/disable keeping boxes after RSI normalization.
Interpreting Signals:
- Upward Breakout Signal: A green triangle below the bar indicates a breakout, suggesting potential bullish momentum and trend continuation or reversal.
- Downward Breakout Signal: A red triangle above the bar indicates a breakout, suggesting potential bearish momentum.
- RSI Zones: If the price re-enters a zone after a breakout, it may signal a false breakout or consolidation; persistent zones can act as future support/resistance levels. Consolidation often occurs within these zones as the market seeks equilibrium.
- Use signals alongside other technical analysis tools for confirmation, such as moving averages (to confirm trend direction), Fibonacci levels (to identify key price zones), or volume indicators (to validate breakout strength). Analyze RSI zones on higher timeframes for stronger signals due to broader market context.
█ APPLICATIONS
- Momentum Trading: Use RSI zones as overbought/oversold filters. In an uptrend, look for buying opportunities on upward breakouts, and in a downtrend, on downward breakouts. Combining with MACD crossovers, Fibonacci levels, or pivot points enhances zone significance.
- Inter-Zone Trading: Utilize breakouts from one RSI zone and hold the position until reaching the next zone, which may act as a target level or reversal point.
█ NOTES
- Test the indicator across different timeframes and markets (stocks, forex, crypto) to optimize RSI length and levels for your trading style.
- For best results, use in trending markets where RSI extremes are more predictive; in ranging markets, additional filters are recommended to reduce false signals.
- Always combine with risk management; RSI zones alone do not guarantee reversals, and false breakouts may occur in low-liquidity environments.

NSF/NBF Boxes📘 NSF / NBF Extended Boxes (Wyckoff–VSA Smart Zones)
This indicator automatically detects No Supply (NSF) and No Buying / No Demand (NBF) bars using Wyckoff–VSA principles and marks them with extended boxes and a dashed 50% midline.
🟢 NSF (No Supply) — Bullish accumulation signal
🔴 NBF (No Demand) — Bearish distribution signal
Each box extends forward in time to highlight key supply/demand zones, while the dashed midline represents the equilibrium level within that bar.
When price later retests this 50% level, the script triggers a visual marker and an alert condition, helping you spot potential reversals or continuation confirmations.
🧠 Core Features
Automatic detection of No Supply / No Demand bars
Extended boxes with adjustable length and auto-extension
Midline (50%) retest alerts for precise trade timing
Optional EMA trend filter, volume check, and close bias
Works even on symbols without volume data (crypto, indices, FX)
“Test Mode” included for easy visualization and debugging
⚙️ Usage Tips
Use on 5m–4h charts for crypto or stocks to spot professional activity.
Combine with Wyckoff, VSA, or Smart Money Concepts to confirm accumulation/distribution phases.
Look for NSF retests near support in a downtrend → possible long entry.
Look for NBF retests near resistance in an uptrend → possible short entry.
🧩 Parameters
Ignore Volume: disables volume filters for markets with missing data
Use EMA Trend Filter: only confirm signals in direction of trend
Auto-extend Boxes: keeps zones projecting into future bars
Retest Alerts: triggers when price touches midline after formation
💡 Author’s Note
This tool visualizes the often-hidden behavior of smart money absorption and weak demand exhaustion.
Use it as part of a complete trading plan — not as a standalone buy/sell signal

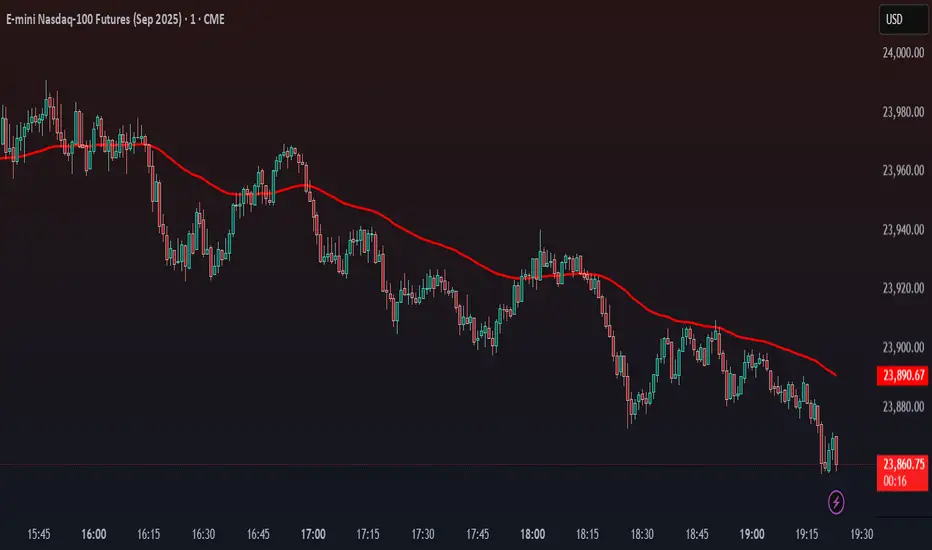
Stalonte EMA - Stable Long-Term EMA with AlertsStalonte EMA - The Adaptive & Stable EMA - Almost Eternal
Here's why you will love "Stalonte":
The Stalonte (Stable Long-Term EMA) is a highly versatile trend-following tool. Unlike standard EMAs with fixed periods, it uses a configurable smoothing constant (alpha), allowing traders to dial in the exact level of responsiveness and stability they need. Finding the "sweet spot" (e.g., alpha ~0.03) creates a uniquely effective moving average: it is smooth enough to filter out noise and identify safe, high-probability trends, yet responsive enough to provide actionable signals without extreme lag. It includes alerts for crossovers and retests.
Pros and Cons of the Stalonte EMA
Pros:
Unparalleled Adaptability: This is its greatest strength. The alpha input lets you seamlessly transform the indicator from an ultra-slow "trend-revealer" (low alpha) into a highly effective and "safe" trend-following tool (medium alpha, e.g., 0.03), all the way to a more reactive one.
Optimized for Safety & Signal Quality: As you astutely pointed out, with the proper setting (like 0.03), it finds the perfect balance. It provides a smoother path than a standard 20-50 period EMA, which reduces whipsaws and false breakouts, leading to safer, higher-confidence signals.
Superior Trend Visualization: It gives a cleaner and more intuitive representation of the market's direction than many conventional moving averages, making it easier to "see" the trend and stick with it.
Objective Dynamic Support/Resistance: The line created with a medium alpha setting acts as a powerful dynamic support in uptrends and resistance in downtrends, offering excellent areas for entries on retests with integrated alerts.
Cons:
Requires Calibration: The only "con" is that its performance is not plug-and-play; it requires the user to find their optimal alpha value for their specific trading style and the instrument they are trading. This demands a period of testing and customization, which a standard 50-period EMA does not.
Conceptual Hurdle: For traders only familiar with period-based EMAs, the concept of a "smoothing constant" can be initially confusing compared to simply setting a "length."
In summary:
The Stalonte EMA is not a laggy relic. It is a highly sophisticated and adaptable tool. Its design allows for precise tuning, enabling a trader to discover a setting that offers a superior blend of stability and responsiveness—a "sweet spot" that provides safer and often more effective signals than many traditional moving averages. Thank you for pushing for a more accurate and fair assessment.
Use Case Example:
You can combine it with classical EMAs to find the perfect entry.
Wick Pressure Zones [BigBeluga]
The Wick Pressure Zones indicator highlights areas where extreme wick activity occurred, signaling strong buy or sell pressure. By measuring unusually long upper or lower wicks and mapping them into gradient volume zones , the tool helps traders identify levels where liquidity was absorbed, leaving behind footprints of supply and demand imbalances. These zones often act as support, resistance, or liquidity sweep magnets .
🔵 CONCEPTS
Extreme Wicks : Large upper or lower shadows indicate aggressive rejection — upper wicks suggest selling pressure, lower wicks suggest buying pressure.
Volumatic Gradient Zones : From each detected wick, the indicator projects a layered gradient zone, proportional to the wick’s size, showing where most pressure occurred.
Liquidity Footprints : These zones mark levels where significant buy/sell volume was executed, often becoming reaction points on future retests.
Automatic Expiration : Zones persist until price decisively trades through them, after which they are cleared to keep the chart clean.
🔵 FEATURES
Automatic Wick Detection : Identifies extreme upper and lower wick events using percentile filtering and Realative Strength Index.
Gradient Zone Visualization : Builds a 10-layer zone from the wick top/bottom, shading intensity according to pressure strength.
Volume Labels : Each zone is annotated with the bar’s volume at the origin point for added context.
Dynamic Zone Extension : Zones extend to the right as long as they remain relevant; once price closes through them, they are removed.
Support & Resistance Mapping : Upper wick zones (red) behave like supply/resistance, lower wick zones (green) like demand/support.
Clutter Control : Limits the number of active zones (default 10) to keep charts responsive.
Background Highlighting : Optional background shading when new wick zones appear (red for sell, green for buy).
🔵 HOW TO USE
Look for Upper Wick Zones (red) : Indicate strong selling pressure; watch for resistance, reversals, or liquidity sweeps above.
Look for Lower Wick Zones (green) : Indicate strong buying pressure; watch for support or liquidity sweeps below.
Trade Retests : When price returns to a zone, expect a reaction (bounce or rejection) due to leftover liquidity.
Combine with Context : Align wick pressure zones with HTF support/resistance, order blocks, or volume profile for stronger signals.
Use Volume Labels : High-volume wicks indicate more significant liquidity events, making the zone more likely to act as a strong reaction point.
🔵 CONCLUSION
The Wick Pressure Zones is a powerful way to visualize hidden liquidity and aggressive rejections. By mapping extreme wick events into dynamic, volume-annotated zones, it shows traders where the market absorbed heavy buy/sell pressure. These levels frequently act as magnets or turning points, making them valuable for timing entries, stop placement, or fade strategies.

Liquidity Swing Points [BackQuant]Liquidity Swing Points
This tool marks recent swing highs and swing lows and turns them into persistent horizontal “liquidity” levels. These are places where resting orders often accumulate, such as stop losses above prior highs and below prior lows. The script detects confirmed pivots, records their prices, draws lines and labels, and manages their lifecycle on the chart so you can monitor potential sweep or breakout zones without manual redrawing.
What it plots
LQ-H at confirmed swing highs
LQ-L at confirmed swing lows
Horizontal levels that can optionally extend into the future
Timed removal of old levels to keep the chart clean
Each level stores its price, the bar where it was created, its type (high or low), plus a label and a line reference for efficient updates.
How it works
Pivot detection
A swing high is confirmed when the highest high has swing_length bars on both sides that are lower.
A swing low is confirmed when the lowest low has swing_length bars on both sides that are higher.
Pivots are only marked after they are confirmed, so they do not repaint.
Level creation
When a pivot confirms, the script records the price and the creation bar (offset by the right lookback).
A new line is plotted at that price, labeled LQ-H or LQ-L.
Rendering and extension
Levels can be drawn to the most recent bar only or extended to the right for forward reference.
Label size and line color/transparency are configurable.
Lifecycle management
On each confirmed bar, the script checks level age.
Levels older than a chosen bar count are removed automatically to reduce clutter.
How it can be used
Liquidity sweeps: Watch for price to probe beyond a level then close back inside. That behavior often signals a potential fade back into the prior range.
Breakout validation: If price pushes through a level and holds on closes, traders may treat that as continuation. Retests of the level from the other side can serve as structure checks.
Context for entries and exits: Use nearby LQ-H or LQ-L as reference for stop placement or partial-take zones, especially when other tools agree.
Multi-timeframe mapping: Plot swing points on higher timeframes, then drill down to time entries on lower timeframes as price interacts with those levels.
Why liquidity levels matter
Prior swing points are focal areas where many strategies set stops or pending orders. Price often revisits these zones, either to “sweep” resting liquidity before reversing, or to absorb it and trend. Marking these areas objectively helps frame scenarios like failed breaks, successful breakouts, and retests, and it reduces the subjectivity of eyeballing structure.
Settings to know
Swing Detection Length (swing_length), Controls sensitivity. Lower values find more local swings. Higher values find more significant ones.
Bars until removal (removeafter), Deletes levels after a fixed number of bars to prevent buildup.
Extend Levels Right (extend_levels), Keeps levels projected into the future for easier planning.
Label Size (label_size), Choose tiny to large for chart readability.
One color input controls both high and low levels with transparency for context.
Strengths
Objective marking of recent structure without hand drawing
No repaint after confirmation since pivots are locked once the right lookback completes
Lightweight and fast with simple lifecycle management
Clear visuals that integrate well with any price-action workflow
Practical tips
For scalping: use smaller swing_length to capture more granular liquidity. Keep removeafter short to avoid clutter.
For swing trading: increase swing_length so only more meaningful levels remain. Consider extending levels to the right for planning.
Combine with time-of-day filters, ATR for stop sizing, or a separate trend filter to bias trades taken at the levels.
Keep screenshots focused: one image showing a sweep and reversal, another showing a clean breakout and retest.
Limitations and notes
Levels appear after confirmation, so they are delayed by swing_length bars. This is by design to avoid repainting.
On very noisy or illiquid symbols, you may see many nearby levels. Increasing swing_length and shortening removeafter helps.
The script does not assess volume or session context. Consider pairing with volume or session tools if that is part of your process.

Apex Edge - London Open Session# Apex Edge - London Open Session Trading System
## Overview
The London Open Session indicator captures institutional price action during the first hour of the London forex session (8:00-9:00 AM GMT) and identifies high-probability breakout and retest opportunities. This system tracks the session's high/low range and generates precise entry signals when price breaks or retests these key institutional levels.
## Core Strategy
**Session Tracking**: Automatically identifies and marks the London Open session boundaries, creating a trading zone from the first hour's price range.
**Dual Entry Logic**:
- **Breakout Entries**: Triggers when price closes beyond the session high/low and continues in that direction
- **Retest Entries**: Activates when price returns to test the broken level as new support/resistance
**Performance Analytics**: Built-in win rate tracking displays real-time performance statistics over user-defined lookback periods, enabling data-driven optimization for each currency pair.
## Key Features
### Automated Zone Detection
- Precise London session timing with timezone offset controls
- Visual session boundaries with customizable colours
- Automatic high/low range calculation and display
### Smart Entry System
- Breakout confirmation requiring candle close beyond zone
- Retest detection with configurable pip distance tolerance
- Separate risk/reward ratios for breakout vs retest entries
- Visual entry arrows with clear trade direction labels
### Performance HUD
- Real-time win rate calculation over customizable periods (7-365 days)
- Total trades tracking with win/loss breakdown
- Average risk-reward ratio display
- Color-coded performance metrics (green >70%, yellow >50%, red <50%)
### PineConnector Integration
- Direct MT4/MT5 execution via PineConnector alerts
- Proper forex pip calculations for all currency pairs
- Customizable risk percentage per trade
- Symbol override capability for broker compatibility
- Automatic SL/TP level calculation in pips
## Critical Usage Requirements
### Pair-Specific Optimization
Each currency pair requires individual optimization due to varying volatility characteristics, institutional participation levels, and typical price ranges during London hours. The performance HUD is essential for identifying optimal settings before live trading.
**Recommended Testing Process**:
1. Apply indicator to desired currency pair and timeframe
2. Experiment with session timing - while 8:00-9:00 AM GMT is standard, some pairs may show improved performance with alternative hourly windows (e.g., 7:00-8:00 AM or 9:00-10:00 AM)
3. Adjust Stop Loss distances, Risk/Reward ratios, and Retest distances
4. Monitor win rate over 30+ day periods using the performance HUD
5. Only proceed with live alerts once consistent 60%+ win rates are achieved
6. Create separate optimized chart setups for each profitable pair/timeframe combination
### Timeframe Specifications
This indicator is specifically designed and tested for:
- **1-minute charts**: Optimal for capturing immediate institutional reactions
- **5-minute charts**: Balanced approach between noise reduction and opportunity frequency
Higher timeframes generally produce inferior results due to increased noise and reduced institutional edge during the London session window.
## Settings Configuration
### Session Timing
- **London Open/Close Hours**: Adjust for your chart's timezone
- **Rectangle End Time**: Set to 4:30 PM to stop signals before NY session close
- **Timezone Offset**: Ensure accurate London session capture
### Entry Parameters
- **Retest Distance**: 3-8 pips depending on pair volatility
- **Stop Loss Pips**: Separate settings for breakouts (10-15 pips) and retests (8-12 pips)
- **Risk/Reward Ratios**: Independent ratios for different entry types
### PineConnector Setup
- **License ID**: Your PineConnector license key
- **Symbol Override**: MT4/MT5 symbol names if different from TradingView
- **Risk Percentage**: Position size as percentage of account balance
- **Prefix/Comment**: Organize trades in terminal
## Manual Trading Limitations
Without PineConnector automation, traders face significant practical challenges:
**Settings Management**: Each currency pair requires different optimized parameters. Switching between charts means manually adjusting multiple settings each time, creating potential for errors and missed opportunities.
**Timing Sensitivity**: London Open signals can occur rapidly during high-volatility periods. Manual execution may result in slippage or missed entries.
**Multi-Pair Monitoring**: Tracking 4-11 currency pairs simultaneously while manually adjusting settings for each switch becomes impractical for most traders.
**Parameter Consistency**: Risk of using suboptimal settings when quickly switching between pairs, potentially compromising the careful optimization work.
## Recommended Workflow
1. **Historical Testing**: Use win rate HUD to identify profitable pairs and optimal parameters
2. **Demo Automation**: Test PineConnector alerts on demo accounts with optimized settings
3. **Live Implementation**: Deploy alerts only on proven profitable pair/timeframe combinations
4. **Ongoing Monitoring**: Regular review of performance metrics to maintain edge
## Risk Disclaimer
This indicator provides analysis tools and automation capabilities but does not guarantee profitable trading outcomes. Past performance does not predict future results. Users should thoroughly backtest and demo trade before risking live capital. The London session strategy works best during specific market conditions and may underperform during low volatility or unusual market environments.
## Support Requirements
Successful implementation requires:
- Basic understanding of London session market dynamics
- PineConnector subscription for automation features
- Patience for proper optimization process
- Realistic expectations about win rates and drawdown periods
This system is designed for serious traders willing to invest time in proper optimization and risk management rather than plug-and-play solutions.

Dynamic Swing Anchored VWAP (Zeiierman)█ Overview
Dynamic Swing Anchored VWAP (Zeiierman) is a price–volume tool that anchors VWAP at fresh swing highs/lows and then adapts its responsiveness as conditions change. Instead of one static VWAP that drifts away over time, this indicator re-anchors at meaningful structure points (swings). It computes a decayed, volume-weighted average that can speed up in volatile markets and slow down during quiet periods.
Blending swing structure with an adaptive VWAP engine creates a fair-value path that stays aligned with current price behavior, making retests, pullbacks, and mean reversion opportunities easier to spot and trade.
█ How It Works
⚪ Swing Anchor Engine
The script scans for swing highs/lows using your Swing Period.
When market direction flips (new pivot confirmed), the indicator anchors a new VWAP at that pivot and starts tracking from there.
⚪ Adaptive VWAP Core
From each anchor , VWAP is computed using a decay model (recent price×volume matters more; older data matters less).
Adaptive Price Tracking lets you set the base responsiveness in “bars.” Lower = more reactive, higher = smoother.
Volatility Adjustment (ATR vs Avg ATR) can automatically speed up the VWAP during spikes and slow it during compression, so the line stays relevant to live conditions.
█ Why This Adaptive Approach Beats a Simple VWAP
Standard VWAP is cumulative from the anchor point. As time passes and volume accumulates, it often drifts far from current price, especially in prolonged trends or multi-session moves. That drift makes retests rare and unreliable.
Dynamic Swing Anchored VWAP solves this in two ways:
⚪ Event-Driven Anchoring (Swings):
By restarting at fresh swing highs/lows, the VWAP reference reflects today’s structure. You get frequent, meaningful retests because the anchor stays near the action.
⚪ Adaptive Responsiveness (Volatility-Aware):
Markets don’t move at one speed. When volatility expands, a fixed VWAP lags; when volatility contracts, it can overreact to noise. Here, the “tracking speed” can auto-adjust using ATR vs its average.
High Volatility → faster tracking: VWAP hugs price more tightly, preserving retest relevance.
Low Volatility → smoother tracking: VWAP filters chop and stays stable.
Result: A VWAP that follows price more accurately, creating plenty of credible retest opportunities and more trustworthy mean-reversion/continuation reads than a simple, ever-growing VWAP.
█ How to Use
⚪ S wing-Aware Fair Value
Use the VWAP as a dynamic fair-value guide that restarts at key structural pivots. Pullbacks to the VWAP after impulsive moves often provide retest entries.
⚪ Trend Trading
In trends, the adaptive VWAP will ride closer to price, offering continuation pullbacks.
█ Settings
Swing Period: Number of bars to confirm swing highs/lows. Larger = bigger, cleaner pivots (slower); smaller = more frequent pivots (noisier).
Adaptive Price Tracking: Sets the base reaction speed (in bars). Lower = faster, tighter to price; higher = smoother, slower.
Adapt APT by ATR ratio: When ON, the tracking speed auto-adjusts with market volatility (ATR vs its own average). High vol → faster; low vol → calmer.
Volatility Bias: Controls how strongly volatility affects the speed. >1 = stronger effect; <1 = lighter touch.
-----------------
Disclaimer
The content provided in my scripts, indicators, ideas, algorithms, and systems is for educational and informational purposes only. It does not constitute financial advice, investment recommendations, or a solicitation to buy or sell any financial instruments. I will not accept liability for any loss or damage, including without limitation any loss of profit, which may arise directly or indirectly from the use of or reliance on such information.
All investments involve risk, and the past performance of a security, industry, sector, market, financial product, trading strategy, backtest, or individual's trading does not guarantee future results or returns. Investors are fully responsible for any investment decisions they make. Such decisions should be based solely on an evaluation of their financial circumstances, investment objectives, risk tolerance, and liquidity needs.

Logistic Regression ICT FVG🚀 OVERVIEW
Welcome to the Logistic Regression Fair Value Gap (FVG) System — a next-gen trading tool that blends precision gap detection with machine learning intelligence.
Unlike traditional FVG indicators, this one evolves with each bar of price action, scoring and filtering gaps based on real market behavior.
🔧 CORE FEATURES
✨ Smart Gap Detection
Automatically identifies bullish and bearish Fair Value Gaps using volatility-aware candle logic.
📊 Probability-Based Filtering
Uses logistic regression to assign each gap a confidence score (0 to 1), showing only high-probability setups.
🔁 Real-Time Retest Tracking
Continuously watches how price interacts with each gap to determine if it deserves respect.
📈 Multi-Factor Assessment
Evaluates RSI, MACD, and body size at gap formation to build a full context snapshot.
🧠 Self-Learning Engine
The logistic regression model updates on each bar using gradient descent, refining its predictions over time.
📢 Built-In Alerts
Get instant alerts when a gap forms, gets retested, or breaks.
🎨 Custom Display Options
Control the color of bullish/bearish zones, and toggle on/off probability labels for cleaner charts.
🚩 WHAT MAKES IT DIFFERENT
This isn’t just another box-drawing indicator.
While others mark every imbalance, this system thinks before it draws — using statistical modeling to filter out noise and prioritize high-impact zones.
By learning from how price behaves around gaps (not just how they form), it helps you trade only what matters — not what clutters.
⚙️ HOW IT WORKS
1️⃣ Detection
FVGs are identified using ATR-based thresholds and sharp wick imbalances.
2️⃣ Behavior Monitoring
Every gap is tracked — and if respected enough times, it becomes part of the elite training set.
3️⃣ Context Capture
Each new FVG logs RSI, MACD, and body size to provide a feature-rich context for prediction.
4️⃣ Prediction (Logistic Regression)
The model predicts how likely the gap is to be respected and assigns it a probability score.
5️⃣ Classification & Alerts
Gaps above the threshold are plotted with score labels, and alerts trigger for entry/respect/break.
⚙️ CONFIGURATION PANEL
🔧 System Inputs
• Max Retests – How many times a gap must be respected to train the model
• Prediction Threshold – Minimum score to show a gap on the chart
• Learning Rate – Controls how fast the model adapts (default: 0.009)
• Max FVG Lifetime – Expiration duration for unused gaps
• Show Historic Gaps – Show/hide expired or invalidated gaps
🎨 Visual Options
• Bullish/Bearish Colors – Set gap colors to fit your chart style
• Confidence Labels – Show probability scores next to FVGs
• Alert Toggles – Enable alerts for:
– New FVG detected
– FVG respected (entry)
– FVG invalidated (break)
💡 WHY LOGISTIC REGRESSION?
Traditional FVG tools rely on candle shapes.
This system relies on probability — by training on RSI, MACD, and price behavior, it predicts whether a gap will act as a true liquidity zone.
Logistic regression lets the system continuously adapt using new data, making it more accurate the longer it runs.
That means smarter signals, fewer false positives, and a clearer view of where real opportunities lie.

Order Blocks📈 Order Blocks Only (With Mitigation Alerts)
This indicator identifies bullish and bearish order blocks on your chart and alerts you when they are formed or mitigated . Order blocks are key institutional price levels where strong buying or selling has previously occurred, often leading to significant future price reactions.
🔍 How It Works:
-Bullish Order Block: Formed when price closes above the high of a recent bearish candle. This suggests buyers have taken control.
-Bearish Order Block: Formed when price closes below the low of a recent bullish candle. This signals seller dominance.
-Once an order block is formed, a box is drawn on the chart to highlight the zone.
-These boxes last for a user-defined number of bars (default is 20) and can be automatically removed when price mitigates (retests and closes beyond) the zone.
🛠 User Settings:
-Show Bullish Order Blocks – Toggle green zones on/off.
-Show Bearish Order Blocks – Toggle red zones on/off.
-Order Block Duration – How many bars the boxes should remain on the chart.
-Delete Mitigated Boxes – If enabled, mitigated zones are automatically removed.
-Custom Colors – Personalize the fill and border colors of bullish and bearish blocks.
🔔 Alerts:
This tool supports four built-in alert types:
-Bullish Order Block Formed
-Bearish Order Block Formed
-Bullish Order Block Mitigated
-Bearish Order Block Mitigated
Set these alerts to stay on top of key price reactions.
✅ How to Use It:
1. Apply the indicator to any chart and timeframe.
2. Watch for new order blocks to form after strong price breaks.
3. Use these zones as potential entry points, stop placement areas, or take profit zones.
4. Enable alerts to catch key institutional levels as they form or are retested.
