Ichimoku Fractal Flow### Ichimoku Fractal Flow (IFF)
By Gurjit Singh
Ichimoku Fractal Flow (IFF) distills the Ichimoku system into a single oscillator by merging fractal echoes of price and cloud dynamics into one flow signal. Instead of static Ichimoku lines, it measures the "flow" between Conversion/Base, Span A/B, price echoes, and cloud echoes. The result is a multidimensional oscillator that reveals hidden rhythm, momentum shifts, and trend bias.
#### 📌 Key Features
1. Fourfold Fusion – The oscillator blends:
* Phase: Tenkan vs. Kijun spread (short vs. medium trend).
* Kumo Phase: Span A vs. Span B spread (cloud thickness).
* Echo: Price vs lagged reflection.
* Cloud Echo: Price vs. projected cloud center.
2. Oscillator Output – A unified flow line oscillating around zero.
3. Dual Calculation Modes – Oscillator can be built using:
* High-Low Midpoint (classic Ichimoku-style averaging).
* Wilder’s RMA (smoother, less noisy averaging averaging).
4. Optional Smoothing – EMA or Wilder’s RMA creates a trend line, enabling MACD-style crossovers.
5. Dynamic Coloring – Bullish/Bearish color shifts for quick bias recognition.
6. Fill Styling – Highlighted regions between oscillator & smoothing line.
7. Zero Line Reference – Acts as a structural pivot (bull vs. bear).
#### 🔑 How to Use
1. Add to Chart: Works across all assets and timeframes.
2. Flow Bias (Zero Line):
* Above 0 → Bullish flow 🐂
* Below 0 → Bearish flow 🐻
3. With Signal Line:
* Oscillator above smoothing line → Possible upward trend shift.
* Oscillator below smoothing line → Possible downward trend shift.
4. Strength:
* Wide separation from smoothing = strong trend.
* Flat, tight clustering = indecision/range.
5. Contextual Edge: Combine signals with Ichimoku Cloud analysis for stronger confluence.
#### ⚙️ Inputs & Options
* Conversion Line (Tenkan, default 9)
* Base Line (Kijun, default 26)
* Leading Span B (default 52)
* Lag/Lead Shift (default 26)
* Oscillator Mode: High-Low Midpoint vs Wilder’s RMA
* Use Smoothing (toggle on/off)
* Signal Smoothing: Wilder/EMA option
* Smoothing Length (default 9)
* Bullish/Bearish Colors + Transparency
#### 💡 Tips
* Wilder’s RMA (both oscillator & smoothing) is gentler, reducing whipsaws in sideways markets.
* High-Low Mid captures pure Ichimoku-style ranges, good for structure-based traders.
* EMA reacts faster than RMA; use if you want early momentum signals.
* Zero-line flips act like momentum pivots—watch them near cloud boundaries.
* Signal line crossovers behave like MACD-style triggers.
* Strongest signals appear when oscillator, signal line, and Ichimoku Cloud all align.
👉 In short: Ichimoku Fractal Flow compresses multi-layered Ichimoku system into a single fractal oscillator that detects flow, pivotal shifts, and momentum with clarity—bridging price, cloud, and echoes into one signal. Where the cloud shows structure, IFF reveals the underlying flow. Together, they offer a fractal lens into market rhythm.
Search in scripts for "rma"
supertrendLibrary "supertrend"
supertrend : Library dedicated to different variations of supertrend
supertrend_atr(length, multiplier, atrMaType, source, highSource, lowSource, waitForClose, delayed)
supertrend_atr: Simple supertrend based on atr but also takes into consideration of custom MA Type, sources
Parameters:
length (simple int) : : ATR Length
multiplier (simple float) : : ATR Multiplier
atrMaType (simple string) : : Moving Average type for ATR calculation. This can be sma, ema, hma, rma, wma, vwma, swma
source (float) : : Default is close. Can Chose custom source
highSource (float) : : Default is high. Can also use close price for both high and low source
lowSource (float) : : Default is low. Can also use close price for both high and low source
waitForClose (simple bool) : : Considers source for direction change crossover if checked. Else, uses highSource and lowSource.
delayed (simple bool) : : if set to true lags supertrend atr stop based on target levels.
Returns: dir : Supertrend direction
supertrend : BuyStop if direction is 1 else SellStop
supertrend_bands(bandType, maType, length, multiplier, source, highSource, lowSource, waitForClose, useTrueRange, useAlternateSource, alternateSource, sticky)
supertrend_bands: Simple supertrend based on atr but also takes into consideration of custom MA Type, sources
Parameters:
bandType (simple string) : : Type of band used - can be bb, kc or dc
maType (simple string) : : Moving Average type for Bands. This can be sma, ema, hma, rma, wma, vwma, swma
length (simple int) : : Band Length
multiplier (float) : : Std deviation or ATR multiplier for Bollinger Bands and Keltner Channel
source (float) : : Default is close. Can Chose custom source
highSource (float) : : Default is high. Can also use close price for both high and low source
lowSource (float) : : Default is low. Can also use close price for both high and low source
waitForClose (simple bool) : : Considers source for direction change crossover if checked. Else, uses highSource and lowSource.
useTrueRange (simple bool) : : Used for Keltner channel. If set to false, then high-low is used as range instead of true range
useAlternateSource (simple bool) : - Custom source is used for Donchian Chanbel only if useAlternateSource is set to true
alternateSource (float) : - Custom source for Donchian channel
sticky (simple bool) : : if set to true borders change only when price is beyond borders.
Returns: dir : Supertrend direction
supertrend : BuyStop if direction is 1 else SellStop
supertrend_zigzag(length, history, useAlternativeSource, alternativeSource, source, highSource, lowSource, waitForClose, atrlength, multiplier, atrMaType)
supertrend_zigzag: Zigzag pivot based supertrend
Parameters:
length (simple int) : : Zigzag Length
history (simple int) : : number of historical pivots to consider
useAlternativeSource (simple bool)
alternativeSource (float)
source (float) : : Default is close. Can Chose custom source
highSource (float) : : Default is high. Can also use close price for both high and low source
lowSource (float) : : Default is low. Can also use close price for both high and low source
waitForClose (simple bool) : : Considers source for direction change crossover if checked. Else, uses highSource and lowSource.
atrlength (simple int) : : ATR Length
multiplier (simple float) : : ATR Multiplier
atrMaType (simple string) : : Moving Average type for ATR calculation. This can be sma, ema, hma, rma, wma, vwma, swma
Returns: dir : Supertrend direction
supertrend : BuyStop if direction is 1 else SellStop
zupertrend(length, history, useAlternativeSource, alternativeSource, source, highSource, lowSource, waitForClose, atrlength, multiplier, atrMaType)
zupertrend: Zigzag pivot based supertrend
Parameters:
length (simple int) : : Zigzag Length
history (simple int) : : number of historical pivots to consider
useAlternativeSource (simple bool)
alternativeSource (float)
source (float) : : Default is close. Can Chose custom source
highSource (float) : : Default is high. Can also use close price for both high and low source
lowSource (float) : : Default is low. Can also use close price for both high and low source
waitForClose (simple bool) : : Considers source for direction change crossover if checked. Else, uses highSource and lowSource.
atrlength (simple int) : : ATR Length
multiplier (simple float) : : ATR Multiplier
atrMaType (simple string) : : Moving Average type for ATR calculation. This can be sma, ema, hma, rma, wma, vwma, swma
Returns: dir : Supertrend direction
supertrend : BuyStop if direction is 1 else SellStop
zsupertrend(zigzagpivots, history, source, highSource, lowSource, waitForClose, atrMaType, atrlength, multiplier)
zsupertrend: Same as zigzag supertrend. But, works on already calculated array rather than Calculating fresh zigzag
Parameters:
zigzagpivots (array) : : Precalculated zigzag pivots
history (simple int) : : number of historical pivots to consider
source (float) : : Default is close. Can Chose custom source
highSource (float) : : Default is high. Can also use close price for both high and low source
lowSource (float) : : Default is low. Can also use close price for both high and low source
waitForClose (simple bool) : : Considers source for direction change crossover if checked. Else, uses highSource and lowSource.
atrMaType (simple string) : : Moving Average type for ATR calculation. This can be sma, ema, hma, rma, wma, vwma, swma
atrlength (simple int) : : ATR Length
multiplier (simple float) : : ATR Multiplier
Returns: dir : Supertrend direction
supertrend : BuyStop if direction is 1 else SellStop

arrayutilsLibrary "_arrayutils"
Library contains utility functions using arrays.
delete(arr, index)
remove an item from array at specific index. Also deletes the item
Parameters:
arr : - array from which the item needs to be deleted
index : - index of item to be deleted
Returns: void
pop(arr)
remove the last item from array. Also deletes the item
Parameters:
arr : - array from which the last item needs to be removed and deleted
Returns: void
shift(arr)
remove an item from array at index 0. Also deletes the item
Parameters:
arr : - array from which the first item needs to be removed and deleted
Returns: void
unshift(arr, val, maxItems)
add an item to the beginning of an array with max items cap
Parameters:
arr : - array to which the item needs to be added at the beginning
val : - value of item which needs to be added
maxItems : - max items array can hold. After that, items are removed from the other end
Returns: resulting array
clear(arr)
remove and delete all items in an array
Parameters:
arr : - array which needs to be cleared
Returns: void
push(arr, val, maxItems)
add an item to the end of an array with max items cap
Parameters:
arr : - array to which the item needs to be added at the beginning
val : - value of item which needs to be added
maxItems : - max items array can hold. After that, items are removed from the starting index
Returns: resulting array
check_overflow(pivots, barArray, dir)
finds difference between two timestamps
Parameters:
pivots : pivots array
barArray : pivot bar array
dir : direction for which overflow need to be checked
Returns: bool overflow
get_trend_series(pivots, length, highLow, trend)
finds series of pivots in particular trend
Parameters:
pivots : pivots array
length : length for which trend series need to be checked
highLow : filter pivot high or low
trend : Uptrend or Downtrend
Returns: int trendIndexes
get_trend_series(pivots, firstIndex, lastIndex)
finds series of pivots in particular trend
Parameters:
pivots : pivots array
firstIndex : First index of the series
lastIndex : Last index of the series
Returns: int trendIndexes
sma(source)
calculates sma for elements in array
Parameters:
source : source array
Returns: float sma
ema(source, length)
calculates ema for elements in array
Parameters:
source : source array
length : ema length
Returns: float ema
rma(source, length)
calculates rma for elements in array
Parameters:
source : source array
length : rma length
Returns: float rma
wma(source, length)
calculates wma for elements in array
Parameters:
source : source array
length : wma length
Returns: float wma
hma(source, length)
calculates hma for elements in array
Parameters:
source : source array
length : hma length
Returns: float hma
ma(source, matype, length)
wrapper for all moving averages based on array
Parameters:
source : source array
matype : moving average type. Valud values are: sma, ema, rma, wma and hma
length : moving average length length
Returns: float moving average
getFibSeries(numberOfFibs, start)
gets fib series in array
Parameters:
numberOfFibs : number of fibs
start : starting number
Returns: float fibArray

Luminous Market Flux [Pineify]Luminous Market Flux - Dynamic Volatility Channel with Breakout Detection
The Luminous Market Flux indicator is a sophisticated volatility-based trading tool that combines dynamic channel analysis with breakout detection and squeeze identification. This indicator helps traders visualize market conditions by creating an adaptive envelope around price action, highlighting periods of compression (low volatility) and expansion (high volatility) while generating actionable buy and sell signals at key breakout moments.
Key Features
Dynamic volatility channel that adapts to changing market conditions using ATR-based calculations
Visual squeeze detection system that warns traders when volatility is contracting
Automatic breakout signal generation for both bullish and bearish scenarios
Luminous gradient fill that provides instant visual feedback on price position within the channel
Bar coloring feature that highlights strong volatility breakouts
Built-in alert conditions for automated trading notifications
How It Works
The indicator operates on three core calculation layers:
1. Baseline Calculation (Central Tendency)
The foundation uses a Running Moving Average (RMA) of the closing price over the specified Flux Length period. RMA was specifically chosen over SMA or EMA because it provides smoother trend detection similar to how RSI and ATR calculations work, reducing noise while maintaining responsiveness to genuine price movements.
2. Volatility Measurement
The channel width is determined by the Average True Range (ATR) multiplied by the Flux Expansion Factor. ATR captures the true volatility of the market by accounting for gaps and limit moves, making the channel responsive to actual market conditions rather than just closing price variations.
3. Squeeze Detection Logic
The indicator compares the current channel width against a 100-period simple moving average of historical channel widths. When the current range falls below 80% of this average, a squeeze condition is identified, signaling that volatility is compressing and a significant move may be imminent.
Trading Ideas and Insights
Breakout Trading: Enter long positions when price breaks above the upper flux channel with a BUY signal, and short positions when price breaks below the lower channel with a SELL signal. These breakouts indicate strong momentum in the direction of the move.
Squeeze Anticipation: When squeeze circles appear at the top of the chart, prepare for a potential explosive move. Squeezes often precede significant breakouts as the market coils before releasing energy in one direction.
Trend Confirmation: Use the bar coloring feature to confirm trend strength. Colored bars indicate that price is trading outside the volatility envelope, suggesting strong directional momentum.
Mean Reversion: When price is within the channel (no bar coloring), the gradient fill helps identify whether price is closer to the upper or lower boundary, potentially useful for mean-reversion strategies.
How Multiple Indicators Work Together
This indicator integrates several technical concepts into a cohesive system:
The RMA baseline provides the trend anchor, while the ATR-based envelope adapts to volatility conditions. These two components work together to create a channel that expands during volatile periods and contracts during quiet markets. The squeeze detection layer adds a third dimension by comparing current volatility to historical norms, alerting traders when the market is unusually quiet.
The visual elements reinforce this analysis: the gradient fill shows price position within the channel at a glance, bar coloring confirms breakout strength, and shape markers provide discrete entry signals. This multi-layered approach ensures traders receive consistent information across different visualization methods.
Unique Aspects
The "Luminous" visual design uses color gradients that dynamically shift based on price position, creating an intuitive heat-map effect within the channel
Unlike traditional Bollinger Bands that use standard deviation, this indicator uses ATR for volatility measurement, making it more responsive to actual price range movements
The squeeze detection compares current volatility to a longer-term average (100 periods), providing context-aware compression signals rather than arbitrary thresholds
Signal generation uses proper state tracking to ensure breakout signals only fire on the initial breakout, not on every bar during an extended move
How to Use
Add the indicator to your chart. It will overlay directly on price with the volatility channel visible.
Watch for BUY labels appearing below bars when price breaks above the upper channel - these indicate bullish breakout opportunities.
Watch for SELL labels appearing above bars when price breaks below the lower channel - these indicate bearish breakout opportunities.
Monitor for small circles at the top of the chart indicating squeeze conditions - prepare for potential breakouts when these appear.
Use the colored bars as confirmation of breakout strength - green bars confirm bullish momentum, red bars confirm bearish momentum.
Set up alerts using the built-in alert conditions to receive notifications for buy signals, sell signals, and squeeze warnings.
Customization
Flux Length (default: 20): Controls the lookback period for both the baseline and ATR calculations. Lower values create more responsive but noisier channels; higher values create smoother but slower-reacting channels.
Flux Expansion Factor (default: 2.0): Multiplier for the ATR value that determines channel width. Higher values create wider channels with fewer signals; lower values create tighter channels with more frequent signals.
Smooth Signal : Toggle for signal smoothing preference.
Bullish Energy : Customize the color for bullish breakouts and upper channel highlights.
Bearish Energy : Customize the color for bearish breakouts and lower channel highlights.
Compression/Neutral : Customize the color for squeeze indicators and neutral channel states.
Conclusion
The Luminous Market Flux indicator provides traders with a comprehensive volatility analysis tool that combines channel-based trend detection, squeeze identification, and breakout signaling into a single, visually intuitive package. By using ATR-based volatility measurement and RMA smoothing, the indicator adapts to changing market conditions while filtering out noise. Whether you are a breakout trader looking for momentum entries or a swing trader waiting for volatility expansion after compression periods, this indicator offers the visual clarity and signal precision needed to make informed trading decisions.

moving_averages# MovingAverages Library - PineScript v6
A comprehensive PineScript v6 library containing **50+ Moving Average calculations** for TradingView.
---
## 📦 Installation
```pinescript
import TheTradingSpiderMan/moving_averages/1 as MA
```
---
## 📊 All Available Moving Averages (50+)
### Basic Moving Averages
| Function | Selector Key | Description |
| -------- | ------------ | ------------------------------------------ |
| `sma()` | `SMA` | Simple Moving Average - arithmetic mean |
| `ema()` | `EMA` | Exponential Moving Average |
| `wma()` | `WMA` | Weighted Moving Average |
| `vwma()` | `VWMA` | Volume Weighted Moving Average |
| `rma()` | `RMA` | Relative/Smoothed Moving Average |
| `smma()` | `SMMA` | Smoothed Moving Average (alias for RMA) |
| `swma()` | - | Symmetrically Weighted MA (4-period fixed) |
### Hull Family
| Function | Selector Key | Description |
| -------- | ------------ | ------------------------------- |
| `hma()` | `HMA` | Hull Moving Average |
| `ehma()` | `EHMA` | Exponential Hull Moving Average |
### Double/Triple Smoothed
| Function | Selector Key | Description |
| -------------- | ------------ | --------------------------------- |
| `dema()` | `DEMA` | Double Exponential Moving Average |
| `tema()` | `TEMA` | Triple Exponential Moving Average |
| `tma()` | `TMA` | Triangular Moving Average |
| `t3()` | `T3` | Tillson T3 Moving Average |
| `twma()` | `TWMA` | Triple Weighted Moving Average |
| `swwma()` | `SWWMA` | Smoothed Weighted Moving Average |
| `trixSmooth()` | `TRIXSMOOTH` | Triple EMA Smoothed |
### Zero/Low Lag
| Function | Selector Key | Description |
| --------- | ------------ | ----------------------------------- |
| `zlema()` | `ZLEMA` | Zero Lag Exponential MA |
| `lsma()` | `LSMA` | Least Squares Moving Average |
| `epma()` | `EPMA` | Endpoint Moving Average |
| `ilrs()` | `ILRS` | Integral of Linear Regression Slope |
### Adaptive Moving Averages
| Function | Selector Key | Description |
| ---------- | ------------ | ------------------------------- |
| `kama()` | `KAMA` | Kaufman Adaptive Moving Average |
| `frama()` | `FRAMA` | Fractal Adaptive Moving Average |
| `vidya()` | `VIDYA` | Variable Index Dynamic Average |
| `vma()` | `VMA` | Variable Moving Average |
| `vama()` | `VAMA` | Volume Adjusted Moving Average |
| `rvma()` | `RVMA` | Rolling VMA |
| `apexMA()` | `APEXMA` | Apex Moving Average |
### Ehlers Filters
| Function | Selector Key | Description |
| ----------------- | --------------- | --------------------------------- |
| `superSmoother()` | `SUPERSMOOTHER` | Ehlers Super Smoother |
| `butterworth2()` | `BUTTERWORTH2` | 2-Pole Butterworth Filter |
| `butterworth3()` | `BUTTERWORTH3` | 3-Pole Butterworth Filter |
| `instantTrend()` | `INSTANTTREND` | Ehlers Instantaneous Trendline |
| `edsma()` | `EDSMA` | Deviation Scaled Moving Average |
| `mama()` | `MAMA` | Mesa Adaptive Moving Average |
| `fama()` | `FAMAVAL` | Following Adaptive Moving Average |
### Laguerre Family
| Function | Selector Key | Description |
| -------------------- | ------------------ | ------------------------ |
| `laguerreFilter()` | `LAGUERRE` | Laguerre Filter |
| `adaptiveLaguerre()` | `ADAPTIVELAGUERRE` | Adaptive Laguerre Filter |
### Special Weighted
| Function | Selector Key | Description |
| ---------- | ------------ | -------------------------------- |
| `alma()` | `ALMA` | Arnaud Legoux Moving Average |
| `sinwma()` | `SINWMA` | Sine Weighted Moving Average |
| `gwma()` | `GWMA` | Gaussian Weighted Moving Average |
| `nma()` | `NMA` | Natural Moving Average |
### Jurik/McGinley/Coral
| Function | Selector Key | Description |
| ------------ | ------------ | --------------------- |
| `jma()` | `JMA` | Jurik Moving Average |
| `mcginley()` | `MCGINLEY` | McGinley Dynamic |
| `coral()` | `CORAL` | Coral Trend Indicator |
### Mean Types
| Function | Selector Key | Description |
| -------------- | ------------ | ------------------------- |
| `medianMA()` | `MEDIANMA` | Median Moving Average |
| `gma()` | `GMA` | Geometric Moving Average |
| `harmonicMA()` | `HARMONICMA` | Harmonic Moving Average |
| `trimmedMA()` | `TRIMMEDMA` | Trimmed Moving Average |
| `cma()` | `CMA` | Cumulative Moving Average |
### Volume-Based
| Function | Selector Key | Description |
| --------- | ------------ | -------------------------- |
| `evwma()` | `EVWMA` | Elastic Volume Weighted MA |
### Other Specialized
| Function | Selector Key | Description |
| ----------------- | --------------- | --------------------------- |
| `hwma()` | `HWMA` | Holt-Winters Moving Average |
| `gdema()` | `GDEMA` | Generalized DEMA |
| `rema()` | `REMA` | Regularized EMA |
| `modularFilter()` | `MODULARFILTER` | Modular Filter |
| `rmt()` | `RMT` | Recursive Moving Trendline |
| `qrma()` | `QRMA` | Quadratic Regression MA |
| `wilderSmooth()` | `WILDERSMOOTH` | Welles Wilder Smoothing |
| `leoMA()` | `LEOMA` | Leo Moving Average |
| `ahrensMA()` | `AHRENSMA` | Ahrens Moving Average |
| `runningMA()` | `RUNNINGMA` | Running Moving Average |
| `ppoMA()` | `PPOMA` | PPO-based Moving Average |
| `fisherMA()` | `FISHERMA` | Fisher Transform MA |
---
## 🎯 Helper Functions
| Function | Description |
| ---------------- | ------------------------------------------------------------- |
| `wcp()` | Weighted Close Price: (H+L+2\*C)/4 |
| `typicalPrice()` | Typical Price: (H+L+C)/3 |
| `medianPrice()` | Median Price: (H+L)/2 |
| `selector()` | **Master selector** - choose any MA by string name |
| `getAllTypes()` | Returns all supported MA type names as comma-separated string |
---
## 🔧 Usage Examples
### Basic Usage
```pinescript
//@version=6
indicator("MA Example")
import quantablex/moving_averages/1 as MA
// Simple calls
plot(MA.sma(close, 20), "SMA 20", color.blue)
plot(MA.ema(close, 20), "EMA 20", color.red)
plot(MA.hma(close, 20), "HMA 20", color.green)
```
### Using the Selector Function (50+ MA Types)
```pinescript
//@version=6
indicator("MA Selector")
import quantablex/moving_averages/1 as MA
// Full list of all supported types:
// SMA,EMA,WMA,VWMA,RMA,SMMA,HMA,EHMA,DEMA,TEMA,TMA,T3,TWMA,SWWMA,TRIXSMOOTH,
// ZLEMA,LSMA,EPMA,ILRS,KAMA,FRAMA,VIDYA,VMA,VAMA,RVMA,APEXMA,SUPERSMOOTHER,
// BUTTERWORTH2,BUTTERWORTH3,INSTANTTREND,EDSMA,LAGUERRE,ADAPTIVELAGUERRE,
// ALMA,SINWMA,GWMA,NMA,JMA,MCGINLEY,CORAL,MEDIANMA,GMA,HARMONICMA,TRIMMEDMA,
// EVWMA,HWMA,GDEMA,REMA,MODULARFILTER,RMT,QRMA,WILDERSMOOTH,LEOMA,AHRENSMA,
// RUNNINGMA,PPOMA,MAMA,FAMAVAL,FISHERMA,CMA
maType = input.string("EMA", "MA Type", options= )
length = input.int(20, "Length")
plot(MA.selector(close, length, maType), "Selected MA", color.orange)
```
### Advanced Moving Averages
```pinescript
//@version=6
indicator("Advanced MAs")
import quantablex/moving_averages/1 as MA
// ALMA with custom offset and sigma
plot(MA.alma(close, 20, 0.85, 6), "ALMA", color.purple)
// KAMA with custom fast/slow periods
plot(MA.kama(close, 10, 2, 30), "KAMA", color.teal)
// T3 with custom volume factor
plot(MA.t3(close, 20, 0.7), "T3", color.yellow)
// Laguerre Filter with custom gamma
plot(MA.laguerreFilter(close, 0.8), "Laguerre", color.lime)
```
---
## 📈 MA Selection Guide
| Use Case | Recommended MAs |
| ---------------------- | ------------------------------------------- |
| **Trend Following** | EMA, DEMA, TEMA, HMA, CORAL |
| **Low Lag Required** | ZLEMA, HMA, EHMA, JMA, LSMA |
| **Volatile Markets** | KAMA, VIDYA, FRAMA, VMA, ADAPTIVELAGUERRE |
| **Smooth Signals** | T3, LAGUERRE, SUPERSMOOTHER, BUTTERWORTH2/3 |
| **Support/Resistance** | SMA, WMA, TMA, MEDIANMA |
| **Scalping** | MCGINLEY, ZLEMA, HMA, INSTANTTREND |
| **Noise Reduction** | MAMA, EDSMA, GWMA, TRIMMEDMA |
| **Volume-Based** | VWMA, EVWMA, VAMA |
---
## ⚙️ Parameters Reference
### Common Parameters
- `src` - Source series (close, open, hl2, hlc3, etc.)
- `len` - Period length (integer)
### Special Parameters
- `alma()`: `offset` (0-1), `sigma` (curve shape)
- `kama()`: `fastLen`, `slowLen`
- `t3()`: `vFactor` (volume factor)
- `jma()`: `phase` (-100 to 100)
- `laguerreFilter()`: `gamma` (0-1 damping)
- `rema()`: `lambda` (regularization)
- `modularFilter()`: `beta` (sensitivity)
- `gdema()`: `mult` (multiplier, 2 = standard DEMA)
- `trimmedMA()`: `trimPct` (0-0.5, percentage to trim)
- `mama()/fama()`: `fastLimit`, `slowLimit`
- `adaptiveLaguerre()`: Uses `len` for adaptation period
---
## 📝 Notes
- All 50+ functions are exported for use in any PineScript v6 indicator/strategy
- The `selector()` function supports **all MA types** via string key
- Use `getAllTypes()` to get a comma-separated list of all supported MA names
- Some MAs (CMA, INSTANTTREND, LAGUERRE, MAMA) don't use `len` parameter
- Use `nz()` wrapper if handling potential NA values in your calculations
---
**Author:** thetradingspiderman
**Version:** 1.0
**PineScript Version:** 6
**Total MA Types:** 50+

Scout Regiment - OBV# Scout Regiment - OBV Indicator
## English Documentation
### Overview
Scout Regiment - OBV (On-Balance Volume) is an advanced momentum indicator that combines volume and price movement to identify the strength of buying and selling pressure. This indicator features an oscillator-based approach with divergence detection to help traders spot potential trend reversals and confirm price movements.
### What is OBV?
On-Balance Volume (OBV) is a cumulative volume indicator that adds volume on up days and subtracts volume on down days:
- **Rising OBV**: Accumulation (buying pressure)
- **Falling OBV**: Distribution (selling pressure)
- **OBV Oscillator**: The difference between OBV and its smoothed moving average, making divergences easier to spot
### Key Features
#### 1. **OBV Oscillator Display**
Instead of displaying raw OBV values, this indicator shows the oscillator (difference between OBV and its smoothed line):
**Benefits:**
- Easier to identify divergences
- Clearer trend changes
- More sensitive to momentum shifts
- Zero line as reference point
**Visual Elements:**
- **Step Line**: Main OBV oscillator line
- Green: Positive oscillator (accumulation)
- Red: Negative oscillator (distribution)
- **Histogram**: Visual representation of oscillator strength
- Green bars: Above zero line
- Red bars: Below zero line
- **Zero Line**: White dotted horizontal line as reference
#### 2. **Smoothing Options**
Choose from multiple moving average types to smooth the OBV:
- **None**: Raw OBV (most sensitive)
- **SMA**: Simple Moving Average (equal weight)
- **EMA**: Exponential Moving Average (recent price emphasis) - Default
- **SMMA (RMA)**: Smoothed Moving Average (very smooth)
- **WMA**: Weighted Moving Average (linear weight)
- **VWMA**: Volume Weighted Moving Average (volume emphasis)
**Default Settings:**
- Type: EMA
- Length: 21 periods
- Best for: Most market conditions
#### 3. **Multi-Timeframe Analysis**
- Calculate OBV on any timeframe
- View higher timeframe momentum on lower timeframe charts
- Align trades with larger timeframe volume trends
- Empty field = Current chart timeframe
#### 4. **Visual Enhancements**
**Background Color**
- Light green: Positive oscillator (bullish volume pressure)
- Light red: Negative oscillator (bearish volume pressure)
- Optional display for cleaner charts
**Crossover Labels**
- "突破" (Breakout): When oscillator crosses above zero
- "跌破" (Breakdown): When oscillator crosses below zero
- Indicates potential trend changes
- Can be toggled on/off
#### 5. **Comprehensive Divergence Detection**
The indicator automatically detects four types of divergences:
**Regular Bullish Divergence (Yellow)**
- **Price**: Makes lower lows
- **OBV**: Makes higher lows
- **Signal**: Potential upward reversal
- **Label**: "看涨" (Bullish)
- **Use**: Enter long positions
**Regular Bearish Divergence (Blue)**
- **Price**: Makes higher highs
- **OBV**: Makes lower highs
- **Signal**: Potential downward reversal
- **Label**: "看跌" (Bearish)
- **Use**: Enter short positions or exit longs
**Hidden Bullish Divergence (Light Yellow)**
- **Price**: Makes higher lows
- **OBV**: Makes lower lows
- **Signal**: Trend continuation (uptrend)
- **Label**: "隐藏看涨" (Hidden Bullish)
- **Use**: Add to long positions
**Hidden Bearish Divergence (Light Blue)**
- **Price**: Makes lower highs
- **OBV**: Makes higher highs
- **Signal**: Trend continuation (downtrend)
- **Label**: "隐藏看跌" (Hidden Bearish)
- **Use**: Add to short positions
#### 6. **Customizable Divergence Detection**
**Pivot Lookback Settings:**
- **Left Lookback**: Bars to the left of pivot (default: 5)
- **Right Lookback**: Bars to the right of pivot (default: 5)
- Determines how "extreme" a point must be to qualify as a pivot
**Range Settings:**
- **Maximum Range**: Maximum bars between pivots (default: 60)
- **Minimum Range**: Minimum bars between pivots (default: 5)
- Filters out too-close or too-distant divergences
**Display Options:**
- Toggle regular divergences on/off
- Toggle hidden divergences on/off
- Toggle divergence labels on/off
- Show only the divergences you need
### Configuration Settings
#### Smoothing Settings
- **Smoothing Type**: Choose MA type (None/SMA/EMA/SMMA/WMA/VWMA)
- **Smoothing Length**: Number of periods for smoothing (default: 21)
#### Calculation Settings
- **Timeframe**: Select calculation timeframe (empty = current chart)
#### Display Settings
- **Show OBV Line**: Toggle step line display
- **Show OBV Histogram**: Toggle histogram display
- **Show Background Color**: Toggle background coloring
- **Show Crossover Labels**: Toggle breakout/breakdown labels
#### Divergence Settings
- **Pivot Right Lookback**: Right bars for pivot detection (default: 5)
- **Pivot Left Lookback**: Left bars for pivot detection (default: 5)
- **Range Maximum**: Max bars between divergences (default: 60)
- **Range Minimum**: Min bars between divergences (default: 5)
- **Show Regular Divergences**: Enable/disable regular divergences
- **Show Regular Labels**: Enable/disable regular divergence labels
- **Show Hidden Divergences**: Enable/disable hidden divergences
- **Show Hidden Labels**: Enable/disable hidden divergence labels
### How to Use
#### For Trend Confirmation
1. **Identify Trend with Price**
- Uptrend: Higher highs and higher lows
- Downtrend: Lower highs and lower lows
2. **Confirm with OBV Oscillator**
- Strong uptrend: OBV oscillator staying positive
- Strong downtrend: OBV oscillator staying negative
- Weak trend: OBV oscillator frequently crossing zero
3. **Volume Confirmation**
- Trend with increasing OBV = Strong trend
- Trend with decreasing OBV = Weak trend (watch for reversal)
#### For Divergence Trading
1. **Enable Divergence Detection**
- Start with regular divergences only
- Add hidden divergences for trend continuation
2. **Wait for Divergence Signal**
- Yellow label = Potential bullish reversal
- Blue label = Potential bearish reversal
3. **Confirm with Price Action**
- Wait for support/resistance break
- Look for candlestick confirmation
- Check higher timeframe alignment
4. **Enter Trade**
- Enter after confirmation
- Set stop loss beyond recent swing
- Target based on previous swing or support/resistance
#### For Breakout Trading
1. **Enable Crossover Labels**
- Identify when oscillator crosses zero line
2. **Confirm Volume Strength**
- Strong breakouts have large oscillator moves
- Weak breakouts barely cross zero
3. **Trade Direction**
- "突破" label = Enter long
- "跌破" label = Enter short
4. **Manage Position**
- Exit when oscillator crosses back
- Use price structure for stops
#### For Multi-Timeframe Analysis
1. **Set Higher Timeframe**
- Example: On 15min chart, set timeframe to 1H or 4H
2. **Identify Higher Timeframe Trend**
- Positive oscillator = Uptrend bias
- Negative oscillator = Downtrend bias
3. **Trade with the Trend**
- Only take long signals in uptrend
- Only take short signals in downtrend
4. **Time Entries**
- Use current timeframe for precise entry
- Confirm with higher timeframe direction
### Trading Strategies
#### Strategy 1: Regular Divergence Reversal
**Setup:**
1. Price in strong trend (up or down)
2. Regular divergence appears
3. Price reaches support/resistance level
**Entry:**
- Bullish: After "看涨" label, when price breaks above recent high
- Bearish: After "看跌" label, when price breaks below recent low
**Stop Loss:**
- Bullish: Below divergence low
- Bearish: Above divergence high
**Exit:**
- Take profit at next major support/resistance
- Or when opposite divergence appears
**Best For:** Swing trading, reversal trading
#### Strategy 2: Hidden Divergence Continuation
**Setup:**
1. Clear trend established
2. Price pulls back (retracement)
3. Hidden divergence appears
**Entry:**
- Bullish: After "隐藏看涨" label, when price resumes uptrend
- Bearish: After "隐藏看跌" label, when price resumes downtrend
**Stop Loss:**
- Behind the pullback swing point
**Exit:**
- Trail stop as trend continues
- Exit on regular divergence (reversal signal)
**Best For:** Trend following, adding to positions
#### Strategy 3: Zero Line Crossover
**Setup:**
1. Enable crossover labels
2. Oscillator crosses zero line
3. Confirm with price structure break
**Entry:**
- "突破" label = Buy signal
- "跌破" label = Sell signal
**Stop Loss:**
- Below/above recent swing
**Exit:**
- When oscillator crosses back over zero
- Or at predetermined target
**Best For:** Momentum trading, quick trades
#### Strategy 4: Multi-Timeframe Confluence
**Setup:**
1. Set indicator to higher timeframe (e.g., 4H on 1H chart)
2. Wait for higher TF oscillator to be positive (uptrend) or negative (downtrend)
3. Look for entries on current timeframe aligned with higher TF
**Entry:**
- Long: When both timeframes show positive oscillator or bullish divergence
- Short: When both timeframes show negative oscillator or bearish divergence
**Stop Loss:**
- Based on current timeframe structure
**Exit:**
- When higher timeframe oscillator turns negative (for longs) or positive (for shorts)
**Best For:** Swing trading, high-probability setups
### Best Practices
#### Volume Analysis
1. **Strong Moves Need Volume**
- Price increase + Rising OBV = Healthy uptrend
- Price increase + Falling OBV = Weak uptrend (warning)
2. **Watch for Confirmation**
- New highs with new OBV highs = Confirmed
- New highs without new OBV highs = Potential divergence
3. **Consider Context**
- Low volume periods (Asian session, holidays) = Less reliable
- High volume periods (News, London/NY overlap) = More reliable
#### Divergence Trading Tips
1. **Not All Divergences Work**
- Wait for price confirmation
- Stronger in oversold/overbought areas
- Better at support/resistance levels
2. **Multiple Divergences**
- Multiple divergences on same trend = Stronger signal
- Quick divergence failures = Ignore and wait for next
3. **Timeframe Matters**
- Higher timeframe divergences = More reliable
- Lower timeframe divergences = More frequent, less reliable
#### Smoothing Selection
1. **No Smoothing (None)**
- Most sensitive, more signals
- More noise, more false signals
- Best for: Scalping, very active trading
2. **EMA (Default)**
- Balanced approach
- Good for most strategies
- Best for: Swing trading, day trading
3. **SMMA (RMA)**
- Very smooth, fewer signals
- Less responsive to sudden changes
- Best for: Position trading, longer timeframes
### Indicator Combinations
**With Moving Averages:**
- Use EMAs for trend direction
- OBV for volume confirmation
- Enter when both align
**With RSI:**
- RSI for overbought/oversold
- OBV for volume confirmation
- Divergences on both = Stronger signal
**With Price Action:**
- Support/resistance for levels
- OBV for strength confirmation
- Breakouts with positive OBV = More likely to succeed
**With Bias Indicator:**
- Bias for price deviation
- OBV for volume confirmation
- Both showing divergence = High probability reversal
### Common Patterns
1. **Accumulation**: OBV rising while price consolidates (breakout likely)
2. **Distribution**: OBV falling while price consolidates (breakdown likely)
3. **Confirmation**: OBV and price both making new highs/lows (trend strong)
4. **Divergence**: OBV and price moving opposite directions (reversal warning)
5. **False Breakout**: Price breaks but OBV doesn't confirm (likely to fail)
### Performance Tips
- Disable unused display features for faster loading
- Start with regular divergences only, add hidden later
- Use histogram for quick visual reference
- Enable crossover labels for clear entry signals
- Test different smoothing lengths for your market
### Alert Conditions
The indicator includes alerts for:
- Regular bullish divergence detected
- Regular bearish divergence detected
- Hidden bullish divergence detected
- Hidden bearish divergence detected
**How to Set Alerts:**
1. Click on the indicator name
2. Select "Add Alert"
3. Choose condition
4. Configure notification method
---
## 中文说明文档
### 概述
Scout Regiment - OBV(能量潮)是一个高级动量指标,结合成交量和价格变动来识别买卖压力的强度。该指标采用振荡器方法并具有背离检测功能,帮助交易者发现潜在的趋势反转并确认价格走势。
### 什么是OBV?
能量潮(OBV)是一个累积成交量指标,在上涨日累加成交量,在下跌日减去成交量:
- **上升的OBV**:积累(买入压力)
- **下降的OBV**:派发(卖出压力)
- **OBV振荡器**:OBV与其平滑移动平均线之间的差值,使背离更容易识别
### 核心功能
#### 1. **OBV振荡器显示**
该指标不显示原始OBV值,而是显示振荡器(OBV与其平滑线之间的差值):
**优势:**
- 更容易识别背离
- 趋势变化更清晰
- 对动量变化更敏感
- 零线作为参考点
**视觉元素:**
- **阶梯线**:主OBV振荡器线
- 绿色:正振荡器(积累)
- 红色:负振荡器(派发)
- **柱状图**:振荡器强度的可视化表示
- 绿色柱:零线以上
- 红色柱:零线以下
- **零线**:白色虚线作为参考
#### 2. **平滑选项**
选择多种移动平均类型来平滑OBV:
- **None**:原始OBV(最敏感)
- **SMA**:简单移动平均(等权重)
- **EMA**:指数移动平均(强调近期价格)- 默认
- **SMMA (RMA)**:平滑移动平均(非常平滑)
- **WMA**:加权移动平均(线性权重)
- **VWMA**:成交量加权移动平均(强调成交量)
**默认设置:**
- 类型:EMA
- 长度:21周期
- 适合:大多数市场状况
#### 3. **多时间框架分析**
- 在任何时间框架上计算OBV
- 在低时间框架图表上查看高时间框架动量
- 使交易与更大时间框架的成交量趋势保持一致
- 空字段 = 当前图表时间框架
#### 4. **视觉增强**
**背景颜色**
- 浅绿色:正振荡器(看涨成交量压力)
- 浅红色:负振荡器(看跌成交量压力)
- 可选显示,图表更清爽
**穿越标签**
- "突破":振荡器向上穿越零线
- "跌破":振荡器向下穿越零线
- 指示潜在趋势变化
- 可开关
#### 5. **全面的背离检测**
指标自动检测四种类型的背离:
**常规看涨背离(黄色)**
- **价格**:创新低
- **OBV**:创更高的低点
- **信号**:潜在向上反转
- **标签**:"看涨"
- **用途**:进入多头仓位
**常规看跌背离(蓝色)**
- **价格**:创新高
- **OBV**:创更低的高点
- **信号**:潜在向下反转
- **标签**:"看跌"
- **用途**:进入空头仓位或退出多头
**隐藏看涨背离(浅黄色)**
- **价格**:创更高的低点
- **OBV**:创更低的低点
- **信号**:趋势延续(上升趋势)
- **标签**:"隐藏看涨"
- **用途**:加仓多头
**隐藏看跌背离(浅蓝色)**
- **价格**:创更低的高点
- **OBV**:创更高的高点
- **信号**:趋势延续(下降趋势)
- **标签**:"隐藏看跌"
- **用途**:加仓空头
#### 6. **可自定义的背离检测**
**枢轴回溯设置:**
- **左侧回溯**:枢轴点左侧K线数(默认:5)
- **右侧回溯**:枢轴点右侧K线数(默认:5)
- 决定一个点要多"极端"才能成为枢轴点
**范围设置:**
- **最大范围**:枢轴点之间最大K线数(默认:60)
- **最小范围**:枢轴点之间最小K线数(默认:5)
- 过滤太近或太远的背离
**显示选项:**
- 开关常规背离
- 开关隐藏背离
- 开关背离标签
- 只显示需要的背离
### 配置设置
#### 平滑设置
- **平滑类型**:选择MA类型(None/SMA/EMA/SMMA/WMA/VWMA)
- **平滑长度**:平滑周期数(默认:21)
#### 计算设置
- **时间周期**:选择计算时间框架(空 = 当前图表)
#### 显示设置
- **显示OBV点线**:切换阶梯线显示
- **显示OBV柱状图**:切换柱状图显示
- **显示背景颜色**:切换背景着色
- **显示突破标签**:切换突破/跌破标签
#### 背离设置
- **枢轴右侧回溯**:枢轴检测右侧K线数(默认:5)
- **枢轴左侧回溯**:枢轴检测左侧K线数(默认:5)
- **回看范围最大值**:背离之间最大K线数(默认:60)
- **回看范围最小值**:背离之间最小K线数(默认:5)
- **显示常规背离**:启用/禁用常规背离
- **显示常规背离标签**:启用/禁用常规背离标签
- **显示隐藏背离**:启用/禁用隐藏背离
- **显示隐藏背离标签**:启用/禁用隐藏背离标签
### 使用方法
#### 趋势确认
1. **用价格识别趋势**
- 上升趋势:更高的高点和更高的低点
- 下降趋势:更低的高点和更低的低点
2. **用OBV振荡器确认**
- 强劲上升趋势:OBV振荡器保持正值
- 强劲下降趋势:OBV振荡器保持负值
- 弱势趋势:OBV振荡器频繁穿越零线
3. **成交量确认**
- 趋势伴随上升的OBV = 强趋势
- 趋势伴随下降的OBV = 弱趋势(注意反转)
#### 背离交易
1. **启用背离检测**
- 先从常规背离开始
- 添加隐藏背离用于趋势延续
2. **等待背离信号**
- 黄色标签 = 潜在看涨反转
- 蓝色标签 = 潜在看跌反转
3. **用价格行为确认**
- 等待支撑/阻力突破
- 寻找K线确认
- 检查更高时间框架对齐
4. **进入交易**
- 确认后进入
- 在近期波动之外设置止损
- 基于前一波动或支撑/阻力设定目标
#### 突破交易
1. **启用穿越标签**
- 识别振荡器何时穿越零线
2. **确认成交量强度**
- 强突破有大振荡器移动
- 弱突破勉强穿越零线
3. **交易方向**
- "突破"标签 = 进入多头
- "跌破"标签 = 进入空头
4. **管理仓位**
- 振荡器反向穿越时退出
- 使用价格结构设置止损
#### 多时间框架分析
1. **设置更高时间框架**
- 例如:在15分钟图上,设置时间框架为1H或4H
2. **识别更高时间框架趋势**
- 正振荡器 = 上升趋势偏向
- 负振荡器 = 下降趋势偏向
3. **顺趋势交易**
- 仅在上升趋势中接受多头信号
- 仅在下降趋势中接受空头信号
4. **把握入场时机**
- 使用当前时间框架进行精确进入
- 用更高时间框架方向确认
### 交易策略
#### 策略1:常规背离反转
**设置:**
1. 价格处于强趋势(上涨或下跌)
2. 出现常规背离
3. 价格到达支撑/阻力水平
**入场:**
- 看涨:在"看涨"标签后,价格突破近期高点时
- 看跌:在"看跌"标签后,价格跌破近期低点时
**止损:**
- 看涨:背离低点之下
- 看跌:背离高点之上
**退出:**
- 在下一个主要支撑/阻力获利
- 或出现相反背离时
**适合:**波段交易、反转交易
#### 策略2:隐藏背离延续
**设置:**
1. 建立明确趋势
2. 价格回调(回撤)
3. 出现隐藏背离
**入场:**
- 看涨:在"隐藏看涨"标签后,价格恢复上升趋势时
- 看跌:在"隐藏看跌"标签后,价格恢复下降趋势时
**止损:**
- 在回调波动点之后
**退出:**
- 随着趋势延续移动止损
- 出现常规背离(反转信号)时退出
**适合:**趋势跟随、加仓
#### 策略3:零线穿越
**设置:**
1. 启用穿越标签
2. 振荡器穿越零线
3. 用价格结构突破确认
**入场:**
- "突破"标签 = 买入信号
- "跌破"标签 = 卖出信号
**止损:**
- 近期波动之下/之上
**退出:**
- 振荡器反向穿越零线时
- 或在预定目标
**适合:**动量交易、快速交易
#### 策略4:多时间框架汇合
**设置:**
1. 设置指标到更高时间框架(例如,在1H图上设置4H)
2. 等待更高TF振荡器为正(上升趋势)或负(下降趋势)
3. 在当前时间框架上寻找与更高TF一致的入场机会
**入场:**
- 多头:两个时间框架都显示正振荡器或看涨背离时
- 空头:两个时间框架都显示负振荡器或看跌背离时
**止损:**
- 基于当前时间框架结构
**退出:**
- 更高时间框架振荡器变为负(多头)或正(空头)时
**适合:**波段交易、高概率设置
### 最佳实践
#### 成交量分析
1. **强势波动需要成交量**
- 价格上涨 + 上升的OBV = 健康上升趋势
- 价格上涨 + 下降的OBV = 弱上升趋势(警告)
2. **注意确认**
- 新高伴随新OBV高点 = 已确认
- 新高没有新OBV高点 = 潜在背离
3. **考虑背景**
- 低成交量期(亚洲时段、假期)= 可靠性较低
- 高成交量期(新闻、伦敦/纽约重叠)= 更可靠
#### 背离交易技巧
1. **不是所有背离都有效**
- 等待价格确认
- 在超卖/超买区域更强
- 在支撑/阻力水平更好
2. **多重背离**
- 同一趋势上多个背离 = 更强信号
- 背离快速失败 = 忽略并等待下一个
3. **时间框架重要**
- 更高时间框架背离 = 更可靠
- 更低时间框架背离 = 更频繁,可靠性较低
#### 平滑选择
1. **无平滑(None)**
- 最敏感,更多信号
- 更多噪音,更多假信号
- 适合:剥头皮、非常活跃的交易
2. **EMA(默认)**
- 平衡方法
- 适合大多数策略
- 适合:波段交易、日内交易
3. **SMMA (RMA)**
- 非常平滑,更少信号
- 对突然变化响应较慢
- 适合:仓位交易、更长时间框架
### 指标组合
**与移动平均线配合:**
- 使用EMA确定趋势方向
- OBV确认成交量
- 两者一致时进入
**与RSI配合:**
- RSI用于超买超卖
- OBV用于成交量确认
- 两者都背离 = 更强信号
**与价格行为配合:**
- 支撑/阻力确定水平
- OBV确认强度
- 正OBV的突破 = 更可能成功
**与Bias指标配合:**
- Bias用于价格偏离
- OBV用于成交量确认
- 两者都显示背离 = 高概率反转
### 常见形态
1. **积累**:OBV上升而价格盘整(突破可能)
2. **派发**:OBV下降而价格盘整(跌破可能)
3. **确认**:OBV和价格都创新高/新低(趋势强劲)
4. **背离**:OBV和价格反向移动(反转警告)
5. **假突破**:价格突破但OBV不确认(可能失败)
### 性能提示
- 禁用未使用的显示功能以加快加载
- 先从常规背离开始,稍后添加隐藏背离
- 使用柱状图快速视觉参考
- 启用穿越标签以获得清晰的入场信号
- 为您的市场测试不同的平滑长度
### 警报条件
指标包含以下警报:
- 检测到常规看涨背离
- 检测到常规看跌背离
- 检测到隐藏看涨背离
- 检测到隐藏看跌背离
**如何设置警报:**
1. 点击指标名称
2. 选择"添加警报"
3. 选择条件
4. 配置通知方法
---
## Technical Support
For questions or issues, please refer to the TradingView community or contact the indicator creator.
## 技术支持
如有问题,请参考TradingView社区或联系指标创建者。

RastaRasta — Educational Strategy (Pine v5)
Momentum · Smoothing · Trend Study
Overview
The Rasta Strategy is a visual and educational framework designed to help traders study momentum transitions using the interaction between a fast-reacting EMA line and a slower smoothed reference line.
It is not a signal generator or profit system; it’s a learning tool for understanding how smoothing, crossovers, and filters interact under different market conditions.
The script displays:
A primary EMA line (the fast reactive wave).
A Smoothed line (using your chosen smoothing method).
Optional fog zones between them for quick visual context.
Optional DNA rungs connecting both lines to illustrate volatility compression and expansion.
Optional EMA 8 / EMA 21 trend filter to observe higher-time-frame alignment.
Core Idea
The Rasta model focuses on wave interaction. When the fast EMA crosses above the smoothed line, it reflects a shift in short-term momentum relative to background trend pressure. Cross-unders suggest weakening or reversal.
Rather than treating this as a trading “signal,” use it to observe structure, study trend alignment, and test how smoothing type affects reaction speed.
Smoothing Types Explained
The script lets you experiment with multiple smoothing techniques:
Type Description Use Case
SMA (Simple Moving Average) Arithmetic mean of the last n values. Smooth and steady, but slower. Trend-following studies; filters noise on higher time frames.
EMA (Exponential Moving Average) Weights recent data more. Responds faster to new price action. Momentum or reactive strategies; quick shifts and reversals.
RMA (Relative Moving Average) Used internally by RSI; smooths exponentially but slower than EMA. Momentum confirmation; balanced response.
WMA (Weighted Moving Average) Linear weights emphasizing the most recent data strongly. Intraday scalping; crisp but potentially noisy.
None Disables smoothing; uses the EMA line alone. Raw comparison baseline.
Each smoothing method changes how early or late the strategy reacts:
Faster smoothing (EMA/WMA) = more responsive, good for scalping.
Slower smoothing (SMA/RMA) = more stable, good for trend following.
Modes of Study
🔹 Scalper Mode
Use short EMA lengths (e.g., 3–5) and fast smoothing (EMA or WMA).
Focus on 1 min – 15 min charts.
Watch how quick crossovers appear near local tops/bottoms.
Fog and rung compression reveal volatility contraction before bursts.
Goal: study short-term rhythm and liquidity pulses.
🔹 Momentum Mode
Use moderate EMA (5–9) and RMA smoothing.
Ideal for 1 H–4 H charts.
Observe how the fog color aligns with trend shifts.
EMA 8 / 21 filter can act as macro bias; “Enter” labels will appear only in its direction when enabled.
Goal: study sustained motion between pullbacks and acceleration waves.
🔹 Trend-Follower Mode
Use longer EMA (13–21) with SMA smoothing.
Great for daily/weekly charts.
Focus on periods where fog stays unbroken for long stretches — these illustrate clear trend dominance.
Watch rung spacing: tight clusters often precede consolidations; wide rungs signal expanding volatility.
Goal: visualize slow-motion trend transitions and filter whipsaw conditions.
Components
EMA Line (Red): Fast-reacting short-term direction.
Smoothed Line (Yellow): Reference trend baseline.
Fog Zone: Green when EMA > Smoothed (up-momentum), red when below.
DNA Rungs: Thin connectors showing volatility structure.
EMA 8 / 21 Filter (optional):
When enabled, the strategy will only allow Enter events if EMA 8 > EMA 21.
Use this to study higher-trend gating effects.
Educational Applications
Momentum Visualization: Observe how the fast EMA “breathes” around the smoothed baseline.
Trend Transitions: Compare different smoothing types to see how early or late reversals are detected.
Noise Filtering: Experiment with fog opacity and smoothing lengths to understand trade-off between responsiveness and stability.
Risk Concept Simulation: Includes a simple fixed stop-loss parameter (default 13%) for educational demonstrations of position management in the Strategy Tester.
How to Use
Add to Chart → “Strategy.”
Works on any timeframe and instrument.
Adjust Parameters:
Length: base EMA speed.
Smoothing Type: choose SMA, EMA, RMA, or WMA.
Smoothing Length: controls delay and smoothness.
EMA 8 / 21 Filter: toggles trend gating.
Fog & Rungs: visual study options only.
Study Behavior:
Use Strategy Tester → List of Trades for entry/exit context.
Observe how different smoothing types affect early vs. late “Enter” points.
Compare trend periods vs. ranging periods to evaluate efficiency.
Combine with External Tools:
Overlay RSI, MACD, or Volume for deeper correlation analysis.
Use replay mode to visualize crossovers in live sequence.
Interpreting the Labels
Enter: Marks where fast EMA crosses above the smoothed line (or when filter flips positive).
Exit: Marks where fast EMA crosses back below.
These are purely analytical markers — they do not represent trade advice.
Educational Value
The Rasta framework helps learners explore:
Reaction time differences between moving-average algorithms.
Impact of smoothing on signal clarity.
Interaction of local and global trends.
Visualization of volatility contraction (tight DNA rungs) and expansion (wide fog zones).
It’s a sandbox for studying price structure, not a promise of profit.
Disclaimer
This script is provided for educational and research purposes only.
It does not constitute financial advice, trading signals, or performance guarantees. Past market behavior does not predict future outcomes.
Users are encouraged to experiment responsibly, record observations, and develop their own understanding of price behavior.
Author: Michael Culpepper (mikeyc747)
License: Educational / Open for study and modification with credit.
Philosophy:
“Learning the rhythm of the market is more valuable than chasing its profits.” — Rasta

BioSwarm Imprinter™BioSwarm Imprinter™ — Agent-Based Consensus for Traders
What it is
BioSwarm Imprinter™ is a non-repainting, agent-based sentiment oscillator. It fuses many short-to-medium lookback “opinions” into one 0–100 consensus line that is easy to read at a glance (50 = neutral, >55 bullish bias, <45 bearish bias). The engine borrows from swarm intelligence: many simple voters (agents) adapt their influence over time based on how well they’ve been predicting price, so the crowd gets smarter as conditions change.
Use it to:
• Detect emerging trends sooner without overreacting to noise.
• Filter mean-reversion vs continuation opportunities.
• Gate entries with a confidence score that reflects both strength and persistence of the move.
• Combine with your execution tools (VWAP/ORB/levels) as a state filter rather than a trade signal by itself.
⸻
Why it’s different
• Swarm learning: Each agent improves or decays its “fitness” depending on whether its vote matched the next bar’s direction. High-fitness agents matter more; weak agents fade.
• Multi-horizon by design: The crowd is composed of fixed, simple lookbacks spread from lenMin to lenMax. You get a blended, robust view instead of a single fragile parameter.
• Two complementary lenses: Each agent evaluates RSI-style balance (via Wilder’s RMA) and momentum (EMA deviation). You decide the weight of each.
• No repaint, no MTF pitfalls: Everything runs on the chart’s timeframe with bar-close confirmation; no request.security() or forward references.
• Actionable UI: A clean consensus line, optional regime background, confidence heat, and triangle markers when thresholds are crossed.
⸻
What you see on the chart
• Consensus line (0–100): Smoothed to your preference; color/area makes bull/bear zones obvious.
• Regime coloring (optional): Light green in bull zone, light red in bear zone; neutral otherwise.
• Confidence heat: A small gauge/number (0–100) that combines distance from neutral and recent persistence.
• Markers (optional): Triangles when consensus crosses up through your bull threshold (e.g., 55) or down through your bear threshold (e.g., 45).
• Info panel (optional): Consensus value, regime, confidence, number of agents, and basic diagnostics.
⸻
How it works (under the hood)
1. Horizon bins: The range is divided into numBins. Each bin has a fixed, simple integer length (crucial for Pine’s safety rules).
2. Per-bin features (computed every bar):
• RSI-style balance using Wilder’s RMA (not ta.rsi()), then mapped to −1…+1.
• Momentum as (close − EMA(L)) / EMA(L) (dimensionless drift).
3. Agent vote: For its assigned bin, an agent forms a weighted score: score = wRSI*RSI_like + wMOM*Momentum. A small dead-band near zero suppresses chop; votes are +1/−1/0.
4. Fitness update (bar close): If the agent’s previous vote agreed with the next bar’s direction, multiply its fitness by learnGain; otherwise by learnPain. Fitness is clamped so it never explodes or dies.
5. Consensus: Weighted average of all votes using fitness as weights → map to 0–100 and smooth with EMA.
Why it doesn’t repaint:
• No future references, no MTF resampling, fitness updates only on confirmed bars.
• All TA primitives (RMA/EMA/deltas) are computed every bar unconditionally.
⸻
Signals & confidence
• Bullish bias: consensus ≥ bullThr (e.g., 55).
• Bearish bias: consensus ≤ bearThr (e.g., 45).
• Confidence (0–100):
• Distance score: how far consensus is from 50.
• Momentum score: how strong the recent change is versus its recent average.
• Combined into a single gate; start filtering entries at ≥60 for higher quality.
Tip: For range sessions, raise thresholds (60/40) and increase smoothing; for momentum sessions, lower smoothing and keep thresholds at 55/45.
⸻
Inputs you’ll actually tune
• Agents & horizons:
• N_agents (e.g., 64–128)
• lenMin / lenMax (e.g., 6–30 intraday, 10–60 swing)
• numBins (e.g., 12–24)
• Weights & smoothing:
• wRSI vs wMOM (e.g., 0.7/0.3 for FX & indices; 0.6/0.4 for crypto)
• deadBand (0.03–0.08)
• consSmooth (3–8)
• Thresholds & hygiene:
• bullThr/bearThr (55/45 default)
• cooldownBars to avoid signal spam
⸻
Playbooks (ready-to-use)
1) Breakout / Trend continuation
• Timeframe: 15m–1h for day/swing.
• Filter: Take longs only when consensus > 55 and confidence ≥ 60.
• Execution: Use your ORB/VWAP/pullback trigger for entry. Trail with swing lows or 1.5×ATR. Exit on a close back under 50 or when a bearish signal prints.
2) Mean reversion (fade)
• When: Sideways days or low-volatility clusters.
• Setup: Increase deadBand and consSmooth.
• Signal: Bearish fades when consensus rolls over below ≈55 but stays above 50; bullish fades when it rolls up above ≈45 but stays below 50.
• Targets: The neutral zone (~50) as the first take-profit.
3) Multi-TF alignment
• Keep BioSwarm on 1H for bias, execute on 5–15m:
• Only take entries in the direction of the 1H consensus.
• Skip counter-bias scalps unless confidence is very low (explicit mean-reversion plan).
⸻
Integrations that work
• DynamoSent Pro+ (macro bias): Only act when macro bias and swarm consensus agree.
• ORB + Session VWAP Pro: Trade London/NY ORB breakouts that retest while consensus >55 (long) or <45 (short).
• Levels/Orderflow: BioSwarm is your “go / no-go”; execution stays with your usual triggers.
⸻
Quick start
1. Drop the indicator on a 1H chart.
2. Start with: N_agents=64, lenMin=6, lenMax=30, numBins=16, deadBand=0.06, consSmooth=5, thresholds 55/45.
3. Trade only when confidence ≥ 60.
4. Add your favorite execution tool (VWAP/levels/OR) for entries & exits.
⸻
Non-repainting & safety notes
• No request.security(); no hidden lookahead.
• Bar-close confirmation for fitness and signals.
• All TA calls are unconditional (no “sometimes called” warnings).
• No series-length inputs to RSI/EMA — we use RMA/EMA formulas that accept fixed simple ints per bin.
⸻
Known limits & tips
• Too many signals? Raise deadBand, increase consSmooth, widen thresholds to 60/40.
• Too few signals? Lower deadBand, reduce consSmooth, narrow thresholds to 53/47.
• Over-fitting risk: Keep learnGain/learnPain modest (e.g., ×1.04 / ×0.96).
• Compute load: Large N_agents × numBins is heavier; scale to your device.
⸻
Example recipes
EURUSD 1H (swing):
lenMin=8, lenMax=34, numBins=16, wRSI=0.7, wMOM=0.3, deadBand=0.06, consSmooth=6, thr=55/45
Buy breakouts when consensus >55 and confidence ≥60; confirm with 5–15m pullback to VWAP or level.
SPY 15m (US session):
lenMin=6, lenMax=24, numBins=12, consSmooth=4, deadBand=0.05
On trend days, stay with longs as long as consensus >55; add on shallow pullbacks.
BTC 1H (24/7):
Increase momentum weight: wRSI=0.6, wMOM=0.4, extend lenMax to ~50. Use dynamic stops (ATR) and partials on strong verticals.
⸻
Final word
BioSwarm is a state engine: it tells you when the market is primed to continue or mean-revert. Pair it with your entries and risk framework to turn that state into trades. If you’d like, I can supply a companion strategy template that consumes the consensus and back-tests the three playbooks (Breakout/Fade/Flip) with standard risk management.

Triple RSI | MisinkoMasterThe Triple RSI (TRSI) is an advanced trend-following oscillator designed to capture trend reversals with speed and smoothness, combining concepts from traditional RSI, multi-timeframe momentum analysis, and layered moving average smoothing.
By blending multiple RSI lengths and applying a unique smoothing sequence, the TRSI creates a fast, momentum-driven RSI oscillator that reduces noise without sacrificing responsiveness.
🔎 Methodology
The indicator is built in three main steps:
Multi-Length RSI Calculation
Three RSIs are calculated using different lengths derived from the user’s input n:
RSI(√n) → very fast, highly responsive.
RSI(n/2) → moderately fast.
RSI(n) → slower, more stable baseline.
Each RSI is normalized by subtracting 50, centering values around zero.
Triple RSI Formula
The three RSIs are combined into the base formula:
TRSI=RSI(√n)+RSI(n/2)−RSI(n)
TRSI=RSI(√n)+RSI(n/2)−RSI(n)
This subtracts the slower RSI from the faster ones, boosting responsiveness and making the TRSI more momentum-oriented than a standard RSI.
Layered Smoothing
The raw TRSI is smoothed in three steps:
RMA(n/2)
RMA(√n)
HMA(√n)
This sequence balances stability and speed:
RMA provides consistency and reduces false noise.
HMA adds responsiveness and precision.
The result is a smooth yet reactive oscillator, optimized for reversal detection.
📈 Trend Classification
The TRSI offers three ways to interpret trend direction:
Oscillator Values
Above 0 → Bullish (uptrend).
Below 0 → Bearish (downtrend).
Oscillator Colors
Green TRSI line → Positive momentum.
Red TRSI line → Negative momentum.
Background Colors
Green background flash → Reversal into bullish trend.
Red background flash → Reversal into bearish trend.
This makes it easy to scan past price history and quickly identify turning points.
🎨 Visualization
TRSI line plotted with dynamic coloring (green/red).
Filled area between TRSI and zero-line reflects momentum bias.
Background flashes highlight trend reversal points, adding context and clarity for visual traders.
⚡ Features
Adjustable length parameter (n).
Dynamic use of √n and n/2 for multi-speed RSI blending.
Built-in smoothing with 2× RMA + 1× HMA.
Multiple trend detection methods (value, color, background).
Works across all assets and timeframes (crypto, forex, stocks, indices).
✅ Use Cases
Reversal Detection → Catch early shifts in trend direction.
Trend Confirmation → Stay aligned with momentum.
Momentum Filter → Avoid counter-trend trades in trending markets.
Historical Analysis → Quickly scan past reversals via background coloring.
⚠️ Limitations
As with all oscillators, TRSI may give false signals in sideways/choppy markets.
Optimal sensitivity depends on asset volatility → adjust n for best results.
It is not a standalone system and should be combined with other tools (trend filters, volume, higher timeframe confluence).
Trend Gauge [BullByte]Trend Gauge
Summary
A multi-factor trend detection indicator that aggregates EMA alignment, VWMA momentum scaling, volume spikes, ATR breakout strength, higher-timeframe confirmation, ADX-based regime filtering, and RSI pivot-divergence penalty into one normalized trend score. It also provides a confidence meter, a Δ Score momentum histogram, divergence highlights, and a compact, scalable dashboard for at-a-glance status.
________________________________________
## 1. Purpose of the Indicator
Why this was built
Traders often monitor several indicators in parallel - EMAs, volume signals, volatility breakouts, higher-timeframe trends, ADX readings, divergence alerts, etc., which can be cumbersome and sometimes contradictory. The “Trend Gauge” indicator was created to consolidate these complementary checks into a single, normalized score that reflects the prevailing market bias (bullish, bearish, or neutral) and its strength. By combining multiple inputs with an adaptive regime filter, scaling contributions by magnitude, and penalizing weakening signals (divergence), this tool aims to reduce noise, highlight genuine trend opportunities, and warn when momentum fades.
Key Design Goals
Signal Aggregation
Merged trend-following signals (EMA crossover, ATR breakout, higher-timeframe confirmation) and momentum signals (VWMA thrust, volume spikes) into a unified score that reflects directional bias more holistically.
Market Regime Awareness
Implemented an ADX-style filter to distinguish between trending and ranging markets, reducing the influence of trend signals during sideways phases to avoid false breakouts.
Magnitude-Based Scaling
Replaced binary contributions with scaled inputs: VWMA thrust and ATR breakout are weighted relative to recent averages, allowing for more nuanced score adjustments based on signal strength.
Momentum Divergence Penalty
Integrated pivot-based RSI divergence detection to slightly reduce the overall score when early signs of momentum weakening are detected, improving risk-awareness in entries.
Confidence Transparency
Added a live confidence metric that shows what percentage of enabled sub-indicators currently agree with the overall bias, making the scoring system more interpretable.
Momentum Acceleration Visualization
Plotted the change in score (Δ Score) as a histogram bar-to-bar, highlighting whether momentum is increasing, flattening, or reversing, aiding in more timely decision-making.
Compact Informational Dashboard
Presented a clean, scalable dashboard that displays each component’s status, the final score, confidence %, detected regime (Trending/Ranging), and a labeled strength gauge for quick visual assessment.
________________________________________
## 2. Why a Trader Should Use It
Main benefits and use cases
1. Unified View: Rather than juggling multiple windows or panels, this indicator delivers a single score synthesizing diverse signals.
2. Regime Filtering: In ranging markets, trend signals often generate false entries. The ADX-based regime filter automatically down-weights trend-following components, helping you avoid chasing false breakouts.
3. Nuanced Momentum & Volatility: VWMA and ATR breakout contributions are normalized by recent averages, so strong moves register strongly while smaller fluctuations are de-emphasized.
4. Early Warning of Weakening: Pivot-based RSI divergence is detected and used to slightly reduce the score when price/momentum diverges, giving a cautionary signal before a full reversal.
5. Confidence Meter: See at a glance how many sub-indicators align with the aggregated bias (e.g., “80% confidence” means 4 out of 5 components agree ). This transparency avoids black-box decisions.
6. Trend Acceleration/Deceleration View: The Δ Score histogram visualizes whether the aggregated score is rising (accelerating trend) or falling (momentum fading), supplementing the main oscillator.
7. Compact Dashboard: A corner table lists each check’s status (“Bull”, “Bear”, “Flat” or “Disabled”), plus overall Score, Confidence %, Regime, Trend Strength label, and a gauge bar. Users can scale text size (Normal, Small, Tiny) without removing elements, so the full picture remains visible even in compact layouts.
8. Customizable & Transparent: All components can be enabled/disabled and parameterized (lengths, thresholds, weights). The full Pine code is open and well-commented, letting users inspect or adapt the logic.
9. Alert-ready: Built-in alert conditions fire when the score crosses weak thresholds to bullish/bearish or returns to neutral, enabling timely notifications.
________________________________________
## 3. Component Rationale (“Why These Specific Indicators?”)
Each sub-component was chosen because it adds complementary information about trend or momentum:
1. EMA Cross
o Basic trend measure: compares a faster EMA vs. a slower EMA. Quickly reflects trend shifts but by itself can whipsaw in sideways markets.
2. VWMA Momentum
o Volume-weighted moving average change indicates momentum with volume context. By normalizing (dividing by a recent average absolute change), we capture the strength of momentum relative to recent history. This scaling prevents tiny moves from dominating and highlights genuinely strong momentum.
3. Volume Spikes
o Sudden jumps in volume combined with price movement often accompany stronger moves or reversals. A binary detection (+1 for bullish spike, -1 for bearish spike) flags high-conviction bars.
4. ATR Breakout
o Detects price breaking beyond recent highs/lows by a multiple of ATR. Measures breakout strength by how far beyond the threshold price moves relative to ATR, capped to avoid extreme outliers. This gives a volatility-contextual trend signal.
5. Higher-Timeframe EMA Alignment
o Confirms whether the shorter-term trend aligns with a higher timeframe trend. Uses request.security with lookahead_off to avoid future data. When multiple timeframes agree, confidence in direction increases.
6. ADX Regime Filter (Manual Calculation)
o Computes directional movement (+DM/–DM), smoothes via RMA, computes DI+ and DI–, then a DX and ADX-like value. If ADX ≥ threshold, market is “Trending” and trend components carry full weight; if ADX < threshold, “Ranging” mode applies a configurable weight multiplier (e.g., 0.5) to trend-based contributions, reducing false signals in sideways conditions. Volume spikes remain binary (optional behavior; can be adjusted if desired).
7. RSI Pivot-Divergence Penalty
o Uses ta.pivothigh / ta.pivotlow with a lookback to detect pivot highs/lows on price and corresponding RSI values. When price makes a higher high but RSI makes a lower high (bearish divergence), or price makes a lower low but RSI makes a higher low (bullish divergence), a divergence signal is set. Rather than flipping the trend outright, the indicator subtracts (or adds) a small penalty (configurable) from the aggregated score if it would weaken the current bias. This subtle adjustment warns of weakening momentum without overreacting to noise.
8. Confidence Meter
o Counts how many enabled components currently agree in direction with the aggregated score (i.e., component sign × score sign > 0). Displays this as a percentage. A high percentage indicates strong corroboration; a low percentage warns of mixed signals.
9. Δ Score Momentum View
o Plots the bar-to-bar change in the aggregated score (delta_score = score - score ) as a histogram. When positive, bars are drawn in green above zero; when negative, bars are drawn in red below zero. This reveals acceleration (rising Δ) or deceleration (falling Δ), supplementing the main oscillator.
10. Dashboard
• A table in the indicator pane’s top-right with 11 rows:
1. EMA Cross status
2. VWMA Momentum status
3. Volume Spike status
4. ATR Breakout status
5. Higher-Timeframe Trend status
6. Score (numeric)
7. Confidence %
8. Regime (“Trending” or “Ranging”)
9. Trend Strength label (e.g., “Weak Bullish Trend”, “Strong Bearish Trend”)
10. Gauge bar visually representing score magnitude
• All rows always present; size_opt (Normal, Small, Tiny) only changes text size via text_size, not which elements appear. This ensures full transparency.
________________________________________
## 4. What Makes This Indicator Stand Out
• Regime-Weighted Multi-Factor Score: Trend and momentum signals are adaptively weighted by market regime (trending vs. ranging) , reducing false signals.
• Magnitude Scaling: VWMA and ATR breakout contributions are normalized by recent average momentum or ATR, giving finer gradation compared to simple ±1.
• Integrated Divergence Penalty: Divergence directly adjusts the aggregated score rather than appearing as a separate subplot; this influences alerts and trend labeling in real time.
• Confidence Meter: Shows the percentage of sub-signals in agreement, providing transparency and preventing blind trust in a single metric.
• Δ Score Histogram Momentum View: A histogram highlights acceleration or deceleration of the aggregated trend score, helping detect shifts early.
• Flexible Dashboard: Always-visible component statuses and summary metrics in one place; text size scaling keeps the full picture available in cramped layouts.
• Lookahead-Safe HTF Confirmation: Uses lookahead_off so no future data is accessed from higher timeframes, avoiding repaint bias.
• Repaint Transparency: Divergence detection uses pivot functions that inherently confirm only after lookback bars; description documents this lag so users understand how and when divergence labels appear.
• Open-Source & Educational: Full, well-commented Pine v6 code is provided; users can learn from its structure: manual ADX computation, conditional plotting with series = show ? value : na, efficient use of table.new in barstate.islast, and grouped inputs with tooltips.
• Compliance-Conscious: All plots have descriptive titles; inputs use clear names; no unnamed generic “Plot” entries; manual ADX uses RMA; all request.security calls use lookahead_off. Code comments mention repaint behavior and limitations.
________________________________________
## 5. Recommended Timeframes & Tuning
• Any Timeframe: The indicator works on small (e.g., 1m) to large (daily, weekly) timeframes. However:
o On very low timeframes (<1m or tick charts), noise may produce frequent whipsaws. Consider increasing smoothing lengths, disabling certain components (e.g., volume spike if volume data noisy), or using a larger pivot lookback for divergence.
o On higher timeframes (daily, weekly), consider longer lookbacks for ATR breakout or divergence, and set Higher-Timeframe trend appropriately (e.g., 4H HTF when on 5 Min chart).
• Defaults & Experimentation: Default input values are chosen to be balanced for many liquid markets. Users should test with replay or historical analysis on their symbol/timeframe and adjust:
o ADX threshold (e.g., 20–30) based on instrument volatility.
o VWMA and ATR scaling lengths to match average volatility cycles.
o Pivot lookback for divergence: shorter for faster markets, longer for slower ones.
• Combining with Other Analysis: Use in conjunction with price action, support/resistance, candlestick patterns, order flow, or other tools as desired. The aggregated score and alerts can guide attention but should not be the sole decision-factor.
________________________________________
## 6. How Scoring and Logic Works (Step-by-Step)
1. Compute Sub-Scores
o EMA Cross: Evaluate fast EMA > slow EMA ? +1 : fast EMA < slow EMA ? -1 : 0.
o VWMA Momentum: Calculate vwma = ta.vwma(close, length), then vwma_mom = vwma - vwma . Normalize: divide by recent average absolute momentum (e.g., ta.sma(abs(vwma_mom), lookback)), clip to .
o Volume Spike: Compute vol_SMA = ta.sma(volume, len). If volume > vol_SMA * multiplier AND price moved up ≥ threshold%, assign +1; if moved down ≥ threshold%, assign -1; else 0.
o ATR Breakout: Determine recent high/low over lookback. If close > high + ATR*mult, compute distance = close - (high + ATR*mult), normalize by ATR, cap at a configured maximum. Assign positive contribution. Similarly for bearish breakout below low.
o Higher-Timeframe Trend: Use request.security(..., lookahead=barmerge.lookahead_off) to fetch HTF EMAs; assign +1 or -1 based on alignment.
2. ADX Regime Weighting
o Compute manual ADX: directional movements (+DM, –DM), smoothed via RMA, DI+ and DI–, then DX and ADX via RMA. If ADX ≥ threshold, market is considered “Trending”; otherwise “Ranging.”
o If trending, trend-based contributions (EMA, VWMA, ATR, HTF) use full weight = 1.0. If ranging, use weight = ranging_weight (e.g., 0.5) to down-weight them. Volume spike stays binary ±1 (optional to change if desired).
3. Aggregate Raw Score
o Sum weighted contributions of all enabled components. Count the number of enabled components; if zero, default count = 1 to avoid division by zero.
4. Divergence Penalty
o Detect pivot highs/lows on price and corresponding RSI values, using a lookback. When price and RSI diverge (bearish or bullish divergence), check if current raw score is in the opposing direction:
If bearish divergence (price higher high, RSI lower high) and raw score currently positive, subtract a penalty (e.g., 0.5).
If bullish divergence (price lower low, RSI higher low) and raw score currently negative, add a penalty.
o This reduces score magnitude to reflect weakening momentum, without flipping the trend outright.
5. Normalize and Smooth
o Normalized score = (raw_score / number_of_enabled_components) * 100. This yields a roughly range.
o Optional EMA smoothing of this normalized score to reduce noise.
6. Interpretation
o Sign: >0 = net bullish bias; <0 = net bearish bias; near zero = neutral.
o Magnitude Zones: Compare |score| to thresholds (Weak, Medium, Strong) to label trend strength (e.g., “Weak Bullish Trend”, “Medium Bearish Trend”, “Strong Bullish Trend”).
o Δ Score Histogram: The histogram bars from zero show change from previous bar’s score; positive bars indicate acceleration, negative bars indicate deceleration.
o Confidence: Percentage of sub-indicators aligned with the score’s sign.
o Regime: Indicates whether trend-based signals are fully weighted or down-weighted.
________________________________________
## 7. Oscillator Plot & Visualization: How to Read It
Main Score Line & Area
The oscillator plots the aggregated score as a line, with colored fill: green above zero for bullish area, red below zero for bearish area. Horizontal reference lines at ±Weak, ±Medium, and ±Strong thresholds mark zones: crossing above +Weak suggests beginning of bullish bias, above +Medium for moderate strength, above +Strong for strong trend; similarly for bearish below negative thresholds.
Δ Score Histogram
If enabled, a histogram shows score - score . When positive, bars appear in green above zero, indicating accelerating bullish momentum; when negative, bars appear in red below zero, indicating decelerating or reversing momentum. The height of each bar reflects the magnitude of change in the aggregated score from the prior bar.
Divergence Highlight Fill
If enabled, when a pivot-based divergence is confirmed:
• Bullish Divergence : fill the area below zero down to –Weak threshold in green, signaling potential reversal from bearish to bullish.
• Bearish Divergence : fill the area above zero up to +Weak threshold in red, signaling potential reversal from bullish to bearish.
These fills appear with a lag equal to pivot lookback (the number of bars needed to confirm the pivot). They do not repaint after confirmation, but users must understand this lag.
Trend Direction Label
When score crosses above or below the Weak threshold, a small label appears near the score line reading “Bullish” or “Bearish.” If the score returns within ±Weak, the label “Neutral” appears. This helps quickly identify shifts at the moment they occur.
Dashboard Panel
In the indicator pane’s top-right, a table shows:
1. EMA Cross status: “Bull”, “Bear”, “Flat”, or “Disabled”
2. VWMA Momentum status: similarly
3. Volume Spike status: “Bull”, “Bear”, “No”, or “Disabled”
4. ATR Breakout status: “Bull”, “Bear”, “No”, or “Disabled”
5. Higher-Timeframe Trend status: “Bull”, “Bear”, “Flat”, or “Disabled”
6. Score: numeric value (rounded)
7. Confidence: e.g., “80%” (colored: green for high, amber for medium, red for low)
8. Regime: “Trending” or “Ranging” (colored accordingly)
9. Trend Strength: textual label based on magnitude (e.g., “Medium Bullish Trend”)
10. Gauge: a bar of blocks representing |score|/100
All rows remain visible at all times; changing Dashboard Size only scales text size (Normal, Small, Tiny).
________________________________________
## 8. Example Usage (Illustrative Scenario)
Example: BTCUSD 5 Min
1. Setup: Add “Trend Gauge ” to your BTCUSD 5 Min chart. Defaults: EMAs (8/21), VWMA 14 with lookback 3, volume spike settings, ATR breakout 14/5, HTF = 5m (or adjust to 4H if preferred), ADX threshold 25, ranging weight 0.5, divergence RSI length 14 pivot lookback 5, penalty 0.5, smoothing length 3, thresholds Weak=20, Medium=50, Strong=80. Dashboard Size = Small.
2. Trend Onset: At some point, price breaks above recent high by ATR multiple, volume spikes upward, faster EMA crosses above slower EMA, HTF EMA also bullish, and ADX (manual) ≥ threshold → aggregated score rises above +20 (Weak threshold) into +Medium zone. Dashboard shows “Bull” for EMA, VWMA, Vol Spike, ATR, HTF; Score ~+60–+70; Confidence ~100%; Regime “Trending”; Trend Strength “Medium Bullish Trend”; Gauge ~6–7 blocks. Δ Score histogram bars are green and rising, indicating accelerating bullish momentum. Trader notes the alignment.
3. Divergence Warning: Later, price makes a slightly higher high but RSI fails to confirm (lower RSI high). Pivot lookback completes; the indicator highlights a bearish divergence fill above zero and subtracts a small penalty from the score, causing score to stall or retrace slightly. Dashboard still bullish but score dips toward +Weak. This warns the trader to tighten stops or take partial profits.
4. Trend Weakens: Score eventually crosses below +Weak back into neutral; a “Neutral” label appears, and a “Neutral Trend” alert fires if enabled. Trader exits or avoids new long entries. If score subsequently crosses below –Weak, a “Bearish” label and alert occur.
5. Customization: If the trader finds VWMA noise too frequent on this instrument, they may disable VWMA or increase lookback. If ATR breakouts are too rare, adjust ATR length or multiplier. If ADX threshold seems off, tune threshold. All these adjustments are explained in Inputs section.
6. Visualization: The screenshot shows the main score oscillator with colored areas, reference lines at ±20/50/80, Δ Score histogram bars below/above zero, divergence fill highlighting potential reversal, and the dashboard table in the top-right.
________________________________________
## 9. Inputs Explanation
A concise yet clear summary of inputs helps users understand and adjust:
1. General Settings
• Theme (Dark/Light): Choose background-appropriate colors for the indicator pane.
• Dashboard Size (Normal/Small/Tiny): Scales text size only; all dashboard elements remain visible.
2. Indicator Settings
• Enable EMA Cross: Toggle on/off basic EMA alignment check.
o Fast EMA Length and Slow EMA Length: Periods for EMAs.
• Enable VWMA Momentum: Toggle VWMA momentum check.
o VWMA Length: Period for VWMA.
o VWMA Momentum Lookback: Bars to compare VWMA to measure momentum.
• Enable Volume Spike: Toggle volume spike detection.
o Volume SMA Length: Period to compute average volume.
o Volume Spike Multiplier: How many times above average volume qualifies as spike.
o Min Price Move (%): Minimum percent change in price during spike to qualify as bullish or bearish.
• Enable ATR Breakout: Toggle ATR breakout detection.
o ATR Length: Period for ATR.
o Breakout Lookback: Bars to look back for recent highs/lows.
o ATR Multiplier: Multiplier for breakout threshold.
• Enable Higher Timeframe Trend: Toggle HTF EMA alignment.
o Higher Timeframe: E.g., “5” for 5-minute when on 1-minute chart, or “60” for 5 Min when on 15m, etc. Uses lookahead_off.
• Enable ADX Regime Filter: Toggles regime-based weighting.
o ADX Length: Period for manual ADX calculation.
o ADX Threshold: Value above which market considered trending.
o Ranging Weight Multiplier: Weight applied to trend components when ADX < threshold (e.g., 0.5).
• Scale VWMA Momentum: Toggle normalization of VWMA momentum magnitude.
o VWMA Mom Scale Lookback: Period for average absolute VWMA momentum.
• Scale ATR Breakout Strength: Toggle normalization of breakout distance by ATR.
o ATR Scale Cap: Maximum multiple of ATR used for breakout strength.
• Enable Price-RSI Divergence: Toggle divergence detection.
o RSI Length for Divergence: Period for RSI.
o Pivot Lookback for Divergence: Bars on each side to identify pivot high/low.
o Divergence Penalty: Amount to subtract/add to score when divergence detected (e.g., 0.5).
3. Score Settings
• Smooth Score: Toggle EMA smoothing of normalized score.
• Score Smoothing Length: Period for smoothing EMA.
• Weak Threshold: Absolute score value under which trend is considered weak or neutral.
• Medium Threshold: Score above Weak but below Medium is moderate.
• Strong Threshold: Score above this indicates strong trend.
4. Visualization Settings
• Show Δ Score Histogram: Toggle display of the bar-to-bar change in score as a histogram. Default true.
• Show Divergence Fill: Toggle background fill highlighting confirmed divergences. Default true.
Each input has a tooltip in the code.
________________________________________
## 10. Limitations, Repaint Notes, and Disclaimers
10.1. Repaint & Lag Considerations
• Pivot-Based Divergence Lag: The divergence detection uses ta.pivothigh / ta.pivotlow with a specified lookback. By design, a pivot is only confirmed after the lookback number of bars. As a result:
o Divergence labels or fills appear with a delay equal to the pivot lookback.
o Once the pivot is confirmed and the divergence is detected, the fill/label does not repaint thereafter, but you must understand and accept this lag.
o Users should not treat divergence highlights as predictive signals without additional confirmation, because they appear after the pivot has fully formed.
• Higher-Timeframe EMA Alignment: Uses request.security(..., lookahead=barmerge.lookahead_off), so no future data from the higher timeframe is used. This avoids lookahead bias and ensures signals are based only on completed higher-timeframe bars.
• No Future Data: All calculations are designed to avoid using future information. For example, manual ADX uses RMA on past data; security calls use lookahead_off.
10.2. Market & Noise Considerations
• In very choppy or low-liquidity markets, some components (e.g., volume spikes or VWMA momentum) may be noisy. Users can disable or adjust those components’ parameters.
• On extremely low timeframes, noise may dominate; consider smoothing lengths or disabling certain features.
• On very high timeframes, pivots and breakouts occur less frequently; adjust lookbacks accordingly to avoid sparse signals.
10.3. Not a Standalone Trading System
• This is an indicator, not a complete trading strategy. It provides signals and context but does not manage entries, exits, position sizing, or risk management.
• Users must combine it with their own analysis, money management, and confirmations (e.g., price patterns, support/resistance, fundamental context).
• No guarantees: past behavior does not guarantee future performance.
10.4. Disclaimers
• Educational Purposes Only: The script is provided as-is for educational and informational purposes. It does not constitute financial, investment, or trading advice.
• Use at Your Own Risk: Trading involves risk of loss. Users should thoroughly test and use proper risk management.
• No Guarantees: The author is not responsible for trading outcomes based on this indicator.
• License: Published under Mozilla Public License 2.0; code is open for viewing and modification under MPL terms.
________________________________________
## 11. Alerts
• The indicator defines three alert conditions:
1. Bullish Trend: when the aggregated score crosses above the Weak threshold.
2. Bearish Trend: when the score crosses below the negative Weak threshold.
3. Neutral Trend: when the score returns within ±Weak after being outside.
Good luck
– BullByte

Volume Weighted RSI (VW RSI)The Volume Weighted RSI (VW RSI) is a momentum oscillator designed for TradingView, implemented in Pine Script v6, that enhances the traditional Relative Strength Index (RSI) by incorporating trading volume into its calculation. Unlike the standard RSI, which measures the speed and change of price movements based solely on price data, the VW RSI weights its analysis by volume, emphasizing price movements backed by significant trading activity. This makes the VW RSI particularly effective for identifying bullish or bearish momentum, overbought/oversold conditions, and potential trend reversals in markets where volume plays a critical role, such as stocks, forex, and cryptocurrencies.
Key Features
Volume-Weighted Momentum Calculation:
The VW RSI calculates momentum by comparing the volume associated with upward price movements (up-volume) to the volume associated with downward price movements (down-volume).
Up-volume is the volume on bars where the closing price is higher than the previous close, while down-volume is the volume on bars where the closing price is lower than the previous close.
These volumes are smoothed over a user-defined period (default: 14 bars) using a Running Moving Average (RMA), and the VW RSI is computed using the formula:
\text{VW RSI} = 100 - \frac{100}{1 + \text{VoRS}}
where
\text{VoRS} = \frac{\text{Average Up-Volume}}{\text{Average Down-Volume}}
.
Oscillator Range and Interpretation:
The VW RSI oscillates between 0 and 100, with a centerline at 50.
Above 50: Indicates bullish volume momentum, suggesting that volume on up bars dominates, which may signal buying pressure and a potential uptrend.
Below 50: Indicates bearish volume momentum, suggesting that volume on down bars dominates, which may signal selling pressure and a potential downtrend.
Overbought/Oversold Levels: User-defined thresholds (default: 70 for overbought, 30 for oversold) help identify potential reversal points:
VW RSI > 70: Overbought, indicating a possible pullback or reversal.
VW RSI < 30: Oversold, indicating a possible bounce or reversal.
Visual Elements:
VW RSI Line: Plotted in a separate pane below the price chart, colored dynamically based on its value:
Green when above 50 (bullish momentum).
Red when below 50 (bearish momentum).
Gray when at 50 (neutral).
Centerline: A dashed line at 50, optionally displayed, serving as the neutral threshold between bullish and bearish momentum.
Overbought/Oversold Lines: Dashed lines at the user-defined overbought (default: 70) and oversold (default: 30) levels, optionally displayed, to highlight extreme conditions.
Background Coloring: The background of the VW RSI pane is shaded red when the indicator is in overbought territory and green when in oversold territory, providing a quick visual cue of potential reversal zones.
Alerts:
Built-in alerts for key events:
Bullish Momentum: Triggered when the VW RSI crosses above 50, indicating a shift to bullish volume momentum.
Bearish Momentum: Triggered when the VW RSI crosses below 50, indicating a shift to bearish volume momentum.
Overbought Condition: Triggered when the VW RSI crosses above the overbought threshold (default: 70), signaling a potential pullback.
Oversold Condition: Triggered when the VW RSI crosses below the oversold threshold (default: 30), signaling a potential bounce.
Input Parameters
VW RSI Length (default: 14): The period over which the up-volume and down-volume are smoothed to calculate the VW RSI. A longer period results in smoother signals, while a shorter period increases sensitivity.
Overbought Level (default: 70): The threshold above which the VW RSI is considered overbought, indicating a potential reversal or pullback.
Oversold Level (default: 30): The threshold below which the VW RSI is considered oversold, indicating a potential reversal or bounce.
Show Centerline (default: true): Toggles the display of the 50 centerline, which separates bullish and bearish momentum zones.
Show Overbought/Oversold Lines (default: true): Toggles the display of the overbought and oversold threshold lines.
How It Works
Volume Classification:
For each bar, the indicator determines whether the price movement is upward or downward:
If the current close is higher than the previous close, the bar’s volume is classified as up-volume.
If the current close is lower than the previous close, the bar’s volume is classified as down-volume.
If the close is unchanged, both up-volume and down-volume are set to 0 for that bar.
Smoothing:
The up-volume and down-volume are smoothed using a Running Moving Average (RMA) over the specified period (default: 14 bars) to reduce noise and provide a more stable measure of volume momentum.
VW RSI Calculation:
The Volume Relative Strength (VoRS) is calculated as the ratio of smoothed up-volume to smoothed down-volume.
The VW RSI is then computed using the standard RSI formula, but with volume data instead of price changes, resulting in a value between 0 and 100.
Visualization and Alerts:
The VW RSI is plotted with dynamic coloring to reflect its momentum direction, and optional lines are drawn for the centerline and overbought/oversold levels.
Background coloring highlights overbought and oversold conditions, and alerts notify the trader of significant crossings.
Usage
Timeframe: The VW RSI can be used on any timeframe, but it is particularly effective on intraday charts (e.g., 1-hour, 4-hour) or daily charts where volume data is reliable. Shorter timeframes may require a shorter length for increased sensitivity, while longer timeframes may benefit from a longer length for smoother signals.
Markets: Best suited for markets with significant and reliable volume data, such as stocks, forex, and cryptocurrencies. It may be less effective in markets with low or inconsistent volume, such as certain futures contracts.
Trading Strategies:
Trend Confirmation:
Use the VW RSI to confirm the direction of a trend. For example, in an uptrend, look for the VW RSI to remain above 50, indicating sustained bullish volume momentum, and consider buying on pullbacks when the VW RSI dips but stays above 50.
In a downtrend, look for the VW RSI to remain below 50, indicating sustained bearish volume momentum, and consider selling on rallies when the VW RSI rises but stays below 50.
Overbought/Oversold Conditions:
When the VW RSI crosses above 70, the market may be overbought, suggesting a potential pullback or reversal. Consider taking profits on long positions or preparing for a short entry, but confirm with price action or other indicators.
When the VW RSI crosses below 30, the market may be oversold, suggesting a potential bounce or reversal. Consider entering long positions or covering shorts, but confirm with additional signals.
Divergences:
Look for divergences between the VW RSI and price to spot potential reversals. For example, if the price makes a higher high but the VW RSI makes a lower high, this bearish divergence may signal an impending downtrend.
Conversely, if the price makes a lower low but the VW RSI makes a higher low, this bullish divergence may signal an impending uptrend.
Momentum Shifts:
A crossover above 50 can signal the start of bullish momentum, making it a potential entry point for long trades.
A crossunder below 50 can signal the start of bearish momentum, making it a potential entry point for short trades or an exit for long positions.
Example
On a 4-hour SOLUSDT chart:
During an uptrend, the VW RSI might rise above 50 and stay there, confirming bullish volume momentum. If it approaches 70, it may indicate overbought conditions, as seen near a price peak of 145.08, suggesting a potential pullback.
During a downtrend, the VW RSI might fall below 50, confirming bearish volume momentum. If it drops below 30 near a price low of 141.82, it may indicate oversold conditions, suggesting a potential bounce, as seen in a slight recovery afterward.
A bullish divergence might occur if the price makes a lower low during the downtrend, but the VW RSI makes a higher low, signaling a potential reversal.
Limitations
Lagging Nature: Like the traditional RSI, the VW RSI is a lagging indicator because it relies on smoothed data (RMA). It may not react quickly to sudden price reversals, potentially missing the start of new trends.
False Signals in Ranging Markets: In choppy or ranging markets, the VW RSI may oscillate around 50, generating frequent crossovers that lead to false signals. Combining it with a trend filter (e.g., ADX) can help mitigate this.
Volume Data Dependency: The VW RSI relies on accurate volume data, which may be inconsistent or unavailable in some markets (e.g., certain forex pairs or futures contracts). In such cases, the indicator’s effectiveness may be reduced.
Overbought/Oversold in Strong Trends: During strong trends, the VW RSI can remain in overbought or oversold territory for extended periods, leading to premature exit signals. Use additional confirmation to avoid exiting too early.
Potential Improvements
Smoothing Options: Add options to use different smoothing methods (e.g., EMA, SMA) instead of RMA for the up/down volume calculations, allowing users to adjust the indicator’s responsiveness.
Divergence Detection: Include logic to detect and plot bullish/bearish divergences between the VW RSI and price, providing visual cues for potential reversals.
Customizable Colors: Allow users to customize the colors of the VW RSI line, centerline, overbought/oversold lines, and background shading.
Trend Filter: Integrate a trend strength filter (e.g., ADX > 25) to ensure signals are generated only during strong trends, reducing false signals in ranging markets.
The Volume Weighted RSI (VW RSI) is a powerful tool for traders seeking to incorporate volume into their momentum analysis, offering a unique perspective on market dynamics by emphasizing price movements backed by significant trading activity. It is best used in conjunction with other indicators and price action analysis to confirm signals and improve trading decisions.

Trend indicatorThe Trend Indicator script is a custom oscillator-based tool designed for identifying potential entry and exit points in the market. Using a combination of Exponential Moving Average (EMA) and Relative Moving Average (RMA) calculations, it captures the trend direction and signals market momentum shifts. The indicator visually presents buy and sell signals and color-codes background conditions based on potential trend reversals, offering a clear and structured approach for trend-based trading strategies.
Key Components
1. User Inputs
Smoothing Length (smoothLength): The script allows the trader to input a smoothing length for adjusting the EMA and RMA calculations. This parameter fine-tunes the indicator's sensitivity to price movements, where lower values result in a more responsive oscillator, while higher values make it smoother and less reactive to minor fluctuations.
Source (source): This is the price data input for the script, defaulting to the close price but customizable to other price points (e.g., open, high, or low) based on user preference.
2. Smoothed Price Calculation
Using an Exponential Moving Average (EMA), the script smooths the selected source price to reduce noise and make trends clearer. The EMA’s calculation length is determined by the smoothLength input, and this moving average forms the baseline from which other components derive.
3. Oscillator Calculation
The oscillator value represents the relative strength or weakness of price momentum. Here, the oscillator is computed using Relative Moving Average (RMA), applied to the difference between the smoothed price and the SMA of the source price. The RMA further filters short-term fluctuations to identify the core trend direction.
This oscillator measures the divergence between the smoothed price and the SMA, providing insight into whether the market is experiencing bullish or bearish pressure.
4. Signal Line
The Signal Line is a Simple Moving Average (SMA) of the oscillator, using the same smoothLength parameter. The SMA smooths the oscillator’s values, offering a secondary reference that traders can use to identify changes in momentum when it crosses the oscillator line.
5. Buy and Sell Signals
Buy Signal (bullSignal): The script triggers a buy signal when the oscillator crosses above zero. This indicates that momentum may be shifting in favor of buyers, potentially signaling an uptrend.
Sell Signal (bearSignal): The script triggers a sell signal when the oscillator crosses below zero, suggesting a shift in momentum to the downside, potentially initiating a downtrend.
Visualization
1. Plotting the Oscillator and Signal Line
The oscillator line is plotted in blue, representing the current momentum of the price. The signal line, plotted in red, serves as a smoother baseline.
When the oscillator crosses the signal line, it hints at a potential trend shift, which can be a signal for cautious traders to pay attention to trend reversals.
2. Buy/Sell Signal Markers
Buy Signal Marker: A green label appears below the bar whenever the oscillator crosses above zero, indicating a potential buying opportunity.
Sell Signal Marker: A red label appears above the bar whenever the oscillator crosses below zero, marking a potential selling opportunity.
These visual cues make it easy for traders to spot signals directly on the chart without needing to watch the oscillator values closely.
3. Background Coloring for Trend Direction
To further aid in trend identification, the background color changes to green when a bullish signal is active and red during bearish signals. This coloring helps visually reinforce the current trend direction, allowing traders to spot prolonged uptrends or downtrends easily.
Trading Strategy Suggestions
This indicator can be adapted to various trading strategies. Here are a few practical suggestions:
Trend-Following Strategy:
When the oscillator crosses above zero (green background), it could indicate the start of a potential uptrend. Consider entering a long position on this signal and holding it until the oscillator crosses back below zero.
Conversely, a cross below zero (red background) may signal a downtrend, making it suitable for short positions or exiting long trades.
Cross-Confirmation with Signal Line:
Use the crossover of the oscillator and signal line to confirm trends. For example, when the oscillator is above zero and crosses above the signal line, it could reinforce a strong buy signal. Similarly, a cross below the signal line when the oscillator is below zero could strengthen a sell signal.
Combining with Other Indicators:
For added accuracy, combine this indicator with other trend-confirming tools like Moving Averages or Bollinger Bands to confirm the validity of buy/sell signals.
Risk Management:
Always set stop-losses below recent lows in uptrends or above recent highs in downtrends. This indicator is useful for entry and exit points but should always be paired with solid risk management practices.
The Trend Indicator is a comprehensive tool for identifying market momentum and potential reversal points. By smoothing out price data and using an oscillator to track momentum shifts, it offers traders a structured approach to trading trends. Its built-in buy/sell markers and background coloring make it visually accessible and easy to interpret at a glance. However, as with any indicator, it's most effective when combined with other strategies and a disciplined approach to risk management.
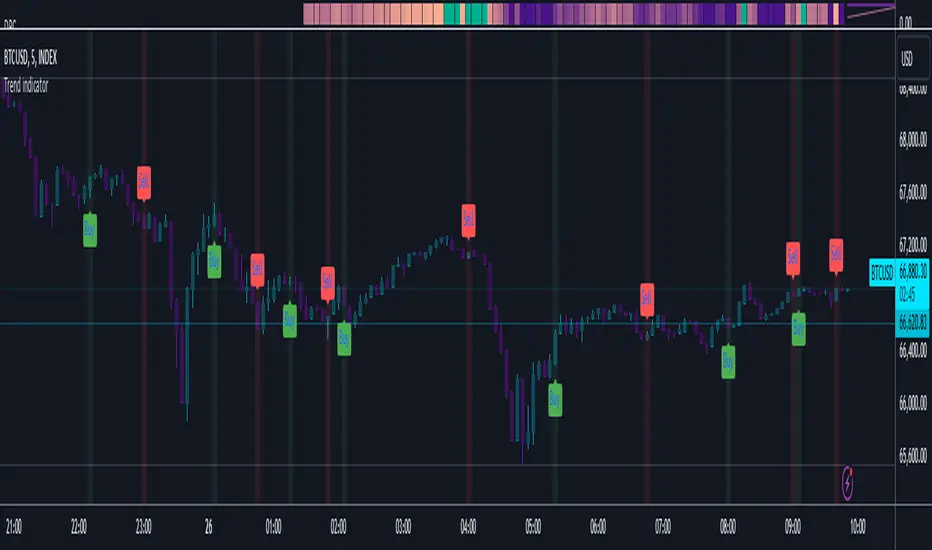
VolumeSpreadAnalysisLibrary "VolumeSpreadAnalysis"
A library for Volume Spread Analysis (VSA).
spread(_barIndex)
Calculates the spread of a bar.
Parameters:
_barIndex (int) : (int) The index of the bar.
Returns: (float) The spread of the bar.
volume(_barIndex)
Retrieves the volume of a bar.
Parameters:
_barIndex (int) : (int) The index of the bar.
Returns: (float) The volume of the bar.
body(_barIndex)
Calculates the body of a bar.
Parameters:
_barIndex (simple int) : (int) The index of the bar.
Returns: (float) The body size of the bar.
wickUpper(_barIndex)
Calculates the upper wick of a bar (upper shadow).
Parameters:
_barIndex (simple int) : (int) The index of the bar.
Returns: (float) The upper wick size of the bar.
wickLower(_barIndex)
Calculates the lower wick of a bar (lower shadow).
Parameters:
_barIndex (simple int) : (int) The index of the bar.
Returns: (float) The lower wick size of the bar.
calcForecastedSMA(_source, _length, _forecastedLevel)
Calculates the forecasted Simple Moving Average (SMA).
Parameters:
_source (float) : (series float) Source data for calculation.
_length (simple int) : (int) The length of the SMA.
_forecastedLevel (float) : (float) The forecasted level to include in the calculation.
Returns: (float) The forecasted SMA value.
calcForecastedEMA(_source, _length, _forecastedLevel)
Calculates the forecasted Exponential Moving Average (EMA).
Parameters:
_source (float) : (series float) Source data for calculation.
_length (simple int) : (int) The length of the EMA.
_forecastedLevel (float) : (float) The forecasted level to include in the calculation.
Returns: (float) The forecasted EMA value.
calcForecastedRMA(_source, _length, _forecastedLevel)
Calculates the forecasted Relative Moving Average (RMA).
Parameters:
_source (float) : (series float) Source data for calculation.
_length (simple int) : (int) The length of the RMA.
_forecastedLevel (float) : (float) The forecasted level to include in the calculation.
Returns: (float) The forecasted RMA value.
calcForecastedWMA(_source, _length, _forecastedLevel)
Calculates the forecasted Weighted Moving Average (WMA).
Parameters:
_source (float) : (series float) Source data for calculation.
_length (simple int) : (int) The length of the WMA.
_forecastedLevel (float) : (float) The forecasted level to include in the calculation.
Returns: (float) The forecasted WMA value.
calcElapsedTimePercent()
Calculates the elapsed time percent of the current bar.
Returns: (float) The elapsed time percent.
calcForecastedSpread(multiplierAtMidpoints, multiplierAtPeaks)
Calculates the forecasted spread using elapsed time and dynamic multipliers, handling spread's non-linear nature.
Parameters:
multiplierAtMidpoints (float) : (float) The multiplier value at midpoints.
multiplierAtPeaks (float) : (float) The multiplier value at peaks.
Returns: (float) The forecasted spread value.
calcForecastedVolume()
Calculates the forecasted volume using elapsed time, satisfying volume's linear nature.
Returns: (float) The forecasted volume value.
calcForecastedMA(_source, _length, _forecastedSource, _type)
Calculates the forecasted Moving Average (MA) based on the specified type.
Parameters:
_source (float) : (series float) Source data for calculation.
_length (simple int) : (int) The length of the MA.
_forecastedSource (float) : (float) The forecasted level to include in the calculation.
_type (simple string) : (string) The type of the MA ("SMA", "EMA", "SMMA (RMA)", "WMA").
Returns: (float) The forecasted MA value.
calcMA(_source, _length, _type)
Calculates the Moving Average (MA) based on the specified type.
Parameters:
_source (float) : (series float) Source data for calculation.
_length (simple int) : (int) The length of the MA.
_type (simple string) : (string) The type of the MA ("SMA", "EMA", "SMMA (RMA)", "WMA").
Returns: (float) The MA value.
bullBar(_barIndex)
Determines if the bar is bullish.
Parameters:
_barIndex (simple int) : (int) The index of the bar.
Returns: (bool) True if the bar is bullish, otherwise false.
bearBar(_barIndex)
Determines if the bar is bearish.
Parameters:
_barIndex (simple int) : (int) The index of the bar.
Returns: (bool) True if the bar is bearish, otherwise false.
breakout(_barIndex)
Determines if there is a breakout above the previous bar.
Parameters:
_barIndex (simple int) : (int) The index of the bar.
Returns: (bool) True if there is a breakout, otherwise false.
breakdown(_barIndex)
Determines if there is a breakdown below the previous bar.
Parameters:
_barIndex (simple int) : (int) The index of the bar.
Returns: (bool) True if there is a breakdown, otherwise false.
rejectionWickUpper(_rejectionWick)
Determines if the upper wick is a rejection wick.
Parameters:
_rejectionWick (simple float) : (float) The rejection wick percentage.
Returns: (bool) True if the upper wick is a rejection wick, otherwise false.
rejectionWickLower(_rejectionWick)
Determines if the lower wick is a rejection wick.
Parameters:
_rejectionWick (simple float) : (float) The rejection wick percentage.
Returns: (bool) True if the lower wick is a rejection wick, otherwise false.
setupDataVolume(_data, _mult_Low, _mult_High, _mult_Ultra, _maLengthVolume, _maTypeVolume)
Sets up data for volume levels.
Parameters:
_data (map) : (map) The map to store the levels.
_mult_Low (simple float) : (float) The multiplier for low level.
_mult_High (simple float) : (float) The multiplier for high level.
_mult_Ultra (simple float) : (float) The multiplier for ultra level.
_maLengthVolume (simple int) : (int) The length for MA.
_maTypeVolume (simple string) : (string) The type for MA.
Returns: (void) Nothing.
setupDataSpread(_data, _mult_Low, _mult_High, _mult_Ultra, _maLengthSpread, _maTypeSpread)
Sets up data for spread levels.
Parameters:
_data (map) : (map) The map to store the levels.
_mult_Low (simple float) : (float) The multiplier for low level.
_mult_High (simple float) : (float) The multiplier for high level.
_mult_Ultra (simple float) : (float) The multiplier for ultra level.
_maLengthSpread (simple int) : (int) The length for MA.
_maTypeSpread (simple string) : (string) The type for MA.
Returns: (void) Nothing.
setupDataForecastVolume(_dataForecast, _mult_Low, _mult_High, _mult_Ultra, _maLengthVolume, _predictedLevelVolume, _maTypeVolume)
Sets up data for volume and spread levels for forecast.
Parameters:
_dataForecast (map)
_mult_Low (simple float) : (float) The multiplier for low level.
_mult_High (simple float) : (float) The multiplier for high level.
_mult_Ultra (simple float) : (float) The multiplier for ultra level.
_maLengthVolume (simple int) : (int) The length for MA.
_predictedLevelVolume (float) : (float) The predicted level for MA.
_maTypeVolume (simple string) : (string) The type for MA.
Returns: (void) Nothing.
setupDataForecastSpread(_dataForecast, _mult_Low, _mult_High, _mult_Ultra, _maLengthSpread, _predictedLevelSpread, _maTypeSpread)
Sets up data for spread levels for forecast.
Parameters:
_dataForecast (map)
_mult_Low (simple float) : (float) The multiplier for low level.
_mult_High (simple float) : (float) The multiplier for high level.
_mult_Ultra (simple float) : (float) The multiplier for ultra level.
_maLengthSpread (simple int) : (int) The length for MA.
_predictedLevelSpread (float) : (float) The predicted level for MA.
_maTypeSpread (simple string) : (string) The type for MA.
Returns: (void) Nothing.
isVolumeLow(_data, _barIndex)
Determines if the volume is low.
Parameters:
_data (map) : (map) The data map with volume levels.
_barIndex (int)
Returns: (bool) True if the volume is low, otherwise false.
isVolumeNormal(_data, _barIndex)
Determines if the volume is normal.
Parameters:
_data (map) : (map) The data map with volume levels.
_barIndex (int)
Returns: (bool) True if the volume is normal, otherwise false.
isVolumeHigh(_data, _barIndex)
Determines if the volume is high.
Parameters:
_data (map) : (map) The data map with volume levels.
_barIndex (int)
Returns: (bool) True if the volume is high, otherwise false.
isVolumeUltra(_data, _barIndex)
Determines if the volume is ultra.
Parameters:
_data (map) : (map) The data map with volume levels.
_barIndex (int)
Returns: (bool) True if the volume is ultra, otherwise false.
isSpreadLow(_data, _barIndex)
Determines if the spread is low.
Parameters:
_data (map) : (map) The data map with spread levels.
_barIndex (int)
Returns: (bool) True if the spread is low, otherwise false.
isSpreadNormal(_data, _barIndex)
Determines if the spread is normal.
Parameters:
_data (map) : (map) The data map with spread levels.
_barIndex (int)
Returns: (bool) True if the spread is normal, otherwise false.
isSpreadHigh(_data, _barIndex)
Determines if the spread is high.
Parameters:
_data (map) : (map) The data map with spread levels.
_barIndex (int)
Returns: (bool) True if the spread is high, otherwise false.
isSpreadUltra(_data, _barIndex)
Determines if the spread is ultra.
Parameters:
_data (map) : (map) The data map with spread levels.
_barIndex (int)
Returns: (bool) True if the spread is ultra, otherwise false.
isVolumeText(_data)
Determines text string representing the volume area level.
Parameters:
_data (map) : (map) The data map with volume levels.
Returns: (string) Text string of Low, Normal, High, or Ultra.
isSpreadText(_data)
Determines text string representing the spread area level.
Parameters:
_data (map) : (map) The data map with spread levels.
Returns: (string) Text string of Low, Normal, High, or Ultra.
calcBarColor(_value, _level)
Calculates the color based level.
Parameters:
_value (float) : (float) The value to check.
_level (float) : (float) The value level for comparison.
Returns: (color) The color for the bar.
bullPinBar(_maxBodyPercent, _minWickPercent)
Determines if the bar is a bull pin bar.
Parameters:
_maxBodyPercent (simple float) : (float) The maximum body percentage.
_minWickPercent (simple float) : (float) The minimum wick percentage.
Returns: (bool) True if the bar is a bull pin bar, otherwise false.
bearPinBar(_maxBodyPercent, _minWickPercent)
Determines if the bar is a bear pin bar.
Parameters:
_maxBodyPercent (simple float) : (float) The maximum body percentage.
_minWickPercent (simple float) : (float) The minimum wick percentage.
Returns: (bool) True if the bar is a bear pin bar, otherwise false.
dojiBar(_maxBodyPercent)
Determines if the bar is a doji.
Parameters:
_maxBodyPercent (simple float) : (float) The maximum body percentage.
Returns: (bool) True if the bar is a doji, otherwise false.
spinningTopBar(_minWicksPercent, _emaLength)
Determines if the bar is a spinning top.
Parameters:
_minWicksPercent (simple float) : (float) The minimum wicks percentage.
_emaLength (simple int) : (int) The length for EMA calculation.
Returns: (bool) True if the bar is a spinning top, otherwise false.
highWaveBar(_minBodyPercent, _minWickPercent, _bars)
Determines if the bar is a high wave bar.
Parameters:
_minBodyPercent (simple float) : (float) The minimum body percentage.
_minWickPercent (simple float) : (float) The minimum wick percentage.
_bars (simple int) : (int) The number of bars for comparison.
Returns: (bool) True if the bar is a high wave bar, otherwise false.
consolidationBar(_data, _spread, _bars)
Determines if the bars are in consolidation.
Parameters:
_data (map) : (map) The data map with spread levels.
_spread (simple float) : (float) The spread percentage for comparison.
_bars (simple int) : (int) The number of bars for comparison.
Returns: (bool) True if the bars are in consolidation, otherwise false.
S_DownThrust(_data, _bullPinBarMaxBody, _bullPinBarMinWick)
Determines if there is a sign of strength (DownThrust).
Parameters:
_data (map) : (map) The data map with volume and spread levels.
_bullPinBarMaxBody (simple float) : (float) The maximum body percentage for bull pin bar.
_bullPinBarMinWick (simple float) : (float) The minimum wick percentage for bull pin bar.
Returns: (bool) True if there is a sign of strength (DownThrust), otherwise false.
S_SellingClimax(_data, _rejectionWick)
Determines if there is a sign of strength (Selling Climax).
Parameters:
_data (map) : (map) The data map with volume and spread levels.
_rejectionWick (simple float) : (float) The rejection wick percentage.
Returns: (bool) True if there is a sign of strength (Selling Climax), otherwise false.
S_NoEffortBearishResult()
Determines if there is a sign of strength (No Effort Bearish Result).
Returns: (bool) True if there is a sign of strength (No Effort Bearish Result), otherwise false.
S_BearishEffortNoResult()
Determines if there is a sign of strength (Bearish Effort No Result).
Returns: (bool) True if there is a sign of strength (Bearish Effort No Result), otherwise false.
S_InverseDownThrust(_data, _bearPinBarMaxBody, _bearPinBarMinWick)
Determines if there is a sign of strength (Inverse DownThrust).
Parameters:
_data (map) : (map) The data map with volume and spread levels.
_bearPinBarMaxBody (simple float) : (float) The maximum body percentage for bear pin bar.
_bearPinBarMinWick (simple float) : (float) The minimum wick percentage for bear pin bar.
Returns: (bool) True if there is a sign of strength (Inverse DownThrust), otherwise false.
S_FailedSellingClimax()
Determines if there is a sign of strength (Failed Selling Climax).
Returns: (bool) True if there is a sign of strength (Failed Selling Climax), otherwise false.
S_BullOutsideReversal(_data)
Determines if there is a sign of strength (Bull Outside Reversal).
Parameters:
_data (map) : (map) The data map with volume and spread levels.
Returns: (bool) True if there is a sign of strength (Bull Outside Reversal), otherwise false.
S_EndOfFallingMarket(_data)
Determines if there is a sign of strength (End of Falling Market).
Parameters:
_data (map) : (map) The data map with volume and spread levels.
Returns: (bool) True if there is a sign of strength (End of Falling Market), otherwise false.
S_PseudoDownThrust(_bullPinBarMaxBody, _bullPinBarMinWick)
Determines if there is a sign of strength (Pseudo DownThrust).
Parameters:
_bullPinBarMaxBody (simple float) : (float) The maximum body percentage for bull pin bar.
_bullPinBarMinWick (simple float) : (float) The minimum wick percentage for bull pin bar.
Returns: (bool) True if there is a sign of strength (Pseudo DownThrust), otherwise false.
S_NoSupply(_bullPinBarMaxBody, _bullPinBarMinWick)
Determines if there is a sign of strength (No Supply).
Parameters:
_bullPinBarMaxBody (simple float) : (float) The maximum body percentage for bull pin bar.
_bullPinBarMinWick (simple float) : (float) The minimum wick percentage for bull pin bar.
Returns: (bool) True if there is a sign of strength (No Supply), otherwise false.
W_UpThrust(_data, _bearPinBarMaxBody, _bearPinBarMinWick)
Determines if there is a sign of weakness (UpThrust).
Parameters:
_data (map) : (map) The data map with volume and spread levels.
_bearPinBarMaxBody (simple float) : (float) The maximum body percentage for bear pin bar.
_bearPinBarMinWick (simple float) : (float) The minimum wick percentage for bear pin bar.
Returns: (bool) True if there is a sign of weakness (UpThrust), otherwise false.
W_BuyingClimax(_data, _rejectionWick)
Determines if there is a sign of weakness (Buying Climax).
Parameters:
_data (map) : (map) The data map with volume and spread levels.
_rejectionWick (simple float) : (float) The rejection wick percentage.
Returns: (bool) True if there is a sign of weakness (Buying Climax), otherwise false.
W_NoEffortBullishResult()
Determines if there is a sign of weakness (No Effort Bullish Result).
Returns: (bool) True if there is a sign of weakness (No Effort Bullish Result), otherwise false.
W_BullishEffortNoResult()
Determines if there is a sign of weakness (Bullish Effort No Result).
Returns: (bool) True if there is a sign of weakness (Bullish Effort No Result), otherwise false.
W_InverseUpThrust(_data, _bullPinBarMaxBody, _bullPinBarMinWick)
Determines if there is a sign of weakness (Inverse UpThrust).
Parameters:
_data (map) : (map) The data map with volume and spread levels.
_bullPinBarMaxBody (simple float) : (float) The maximum body percentage for bull pin bar.
_bullPinBarMinWick (simple float) : (float) The minimum wick percentage for bull pin bar.
Returns: (bool) True if there is a sign of weakness (Inverse UpThrust), otherwise false.
W_FailedBuyingClimax()
Determines if there is a sign of weakness (Failed Buying Climax).
Returns: (bool) True if there is a sign of weakness (Failed Buying Climax), otherwise false.
W_BearOutsideReversal(_data)
Determines if there is a sign of weakness (Bear Outside Reversal).
Parameters:
_data (map) : (map) The data map with volume and spread levels.
Returns: (bool) True if there is a sign of weakness (Bear Outside Reversal), otherwise false.
W_EndOfRisingMarket(_data)
Determines if there is a sign of weakness (End of Rising Market).
Parameters:
_data (map) : (map) The data map with volume and spread levels.
Returns: (bool) True if there is a sign of weakness (End of Rising Market), otherwise false.
W_PseudoUpThrust(_bearPinBarMaxBody, _bearPinBarMinWick)
Determines if there is a sign of weakness (Pseudo UpThrust).
Parameters:
_bearPinBarMaxBody (simple float) : (float) The maximum body percentage for bear pin bar.
_bearPinBarMinWick (simple float) : (float) The minimum wick percentage for bear pin bar.
Returns: (bool) True if there is a sign of weakness (Pseudo UpThrust), otherwise false.
W_NoDemand(_bearPinBarMaxBody, _bearPinBarMinWick)
Determines if there is a sign of weakness (No Demand).
Parameters:
_bearPinBarMaxBody (simple float) : (float) The maximum body percentage for bear pin bar.
_bearPinBarMinWick (simple float) : (float) The minimum wick percentage for bear pin bar.
Returns: (bool) True if there is a sign of weakness (No Demand), otherwise false.
N_QuietDoji(_dojiBarMaxBody)
Determines if there is a neutral signal (Quiet Doji).
Parameters:
_dojiBarMaxBody (simple float) : (float) The maximum body percentage for doji bar.
Returns: (bool) True if there is a neutral signal (Quiet Doji), otherwise false.
N_BalancedDoji(_data, _dojiBarMaxBody)
Determines if there is a neutral signal (Balanced Doji).
Parameters:
_data (map) : (map) The data map with volume and spread levels.
_dojiBarMaxBody (simple float) : (float) The maximum body percentage for doji bar.
Returns: (bool) True if there is a neutral signal (Balanced Doji), otherwise false.
N_StrongDoji(_dojiBarMaxBody)
Determines if there is a neutral signal (Strong Doji).
Parameters:
_dojiBarMaxBody (simple float) : (float) The maximum body percentage for doji bar.
Returns: (bool) True if there is a neutral signal (Strong Doji), otherwise false.
N_QuietSpinningTop(_spinningTopBarMinWicks, _spinningTopBarEmaLength)
Determines if there is a neutral signal (Quiet Spinning Top).
Parameters:
_spinningTopBarMinWicks (simple float) : (float) The minimum wicks percentage for spinning top bar.
_spinningTopBarEmaLength (simple int) : (int) The length for EMA calculation.
Returns: (bool) True if there is a neutral signal (Quiet Spinning Top), otherwise false.
N_BalancedSpinningTop(_data, _spinningTopBarMinWicks, _spinningTopBarEmaLength)
Determines if there is a neutral signal (Balanced Spinning Top).
Parameters:
_data (map) : (map) The data map with volume and spread levels.
_spinningTopBarMinWicks (simple float) : (float) The minimum wicks percentage for spinning top bar.
_spinningTopBarEmaLength (simple int) : (int) The length for EMA calculation.
Returns: (bool) True if there is a neutral signal (Balanced Spinning Top), otherwise false.
N_StrongSpinningTop(_spinningTopBarMinWicks, _spinningTopBarEmaLength)
Determines if there is a neutral signal (Strong Spinning Top).
Parameters:
_spinningTopBarMinWicks (simple float) : (float) The minimum wicks percentage for spinning top bar.
_spinningTopBarEmaLength (simple int) : (int) The length for EMA calculation.
Returns: (bool) True if there is a neutral signal (Strong Spinning Top), otherwise false.
N_QuietHighWave(_highWaveBarMinBody, _highWaveBarMinWick, _highWaveBarBars)
Determines if there is a neutral signal (Quiet High Wave).
Parameters:
_highWaveBarMinBody (simple float) : (float) The minimum body percentage for high wave bar.
_highWaveBarMinWick (simple float) : (float) The minimum wick percentage for high wave bar.
_highWaveBarBars (simple int) : (int) The number of bars for comparison.
Returns: (bool) True if there is a neutral signal (Quiet High Wave), otherwise false.
N_BalancedHighWave(_data, _highWaveBarMinBody, _highWaveBarMinWick, _highWaveBarBars)
Determines if there is a neutral signal (Balanced High Wave).
Parameters:
_data (map) : (map) The data map with volume and spread levels.
_highWaveBarMinBody (simple float) : (float) The minimum body percentage for high wave bar.
_highWaveBarMinWick (simple float) : (float) The minimum wick percentage for high wave bar.
_highWaveBarBars (simple int) : (int) The number of bars for comparison.
Returns: (bool) True if there is a neutral signal (Balanced High Wave), otherwise false.
N_StrongHighWave(_highWaveBarMinBody, _highWaveBarMinWick, _highWaveBarBars)
Determines if there is a neutral signal (Strong High Wave).
Parameters:
_highWaveBarMinBody (simple float) : (float) The minimum body percentage for high wave bar.
_highWaveBarMinWick (simple float) : (float) The minimum wick percentage for high wave bar.
_highWaveBarBars (simple int) : (int) The number of bars for comparison.
Returns: (bool) True if there is a neutral signal (Strong High Wave), otherwise false.
N_Consolidation(_data, _consolidationBarSpread, _consolidationBarBars)
Determines if there is a neutral signal (Consolidation).
Parameters:
_data (map) : (map) The data map with volume and spread levels.
_consolidationBarSpread (simple float) : (float) The spread percentage for consolidation bar.
_consolidationBarBars (simple int) : (int) The number of bars for comparison.
Returns: (bool) True if there is a neutral signal (Consolidation), otherwise false.

ATR GOD Strategy by TradeSmart (PineConnector-compatible)This is a highly-customizable trading strategy made by TradeSmart, focusing mainly on ATR-based indicators and filters. The strategy is mainly intended for trading forex , and has been optimized using the Deep Backtest feature on the 2018.01.01 - 2023.06.01 interval on the EUR/USD (FXCM) 15M chart, with a Slippage value of 3, and a Commission set to 0.00004 USD per contract. The strategy is also made compatible with PineConnector , to provide an easy option to automate the strategy using a connection to MetaTrader. See tooltips for details on how to set up the bot, and check out our website for a detailed guide with images on how to automate the strategy.
The strategy was implemented using the following logic:
Entry strategy:
A total of 4 Supertrend values can be used to determine the entry logic. There is option to set up all 4 Supertrend parameters individually, as well as their potential to be used as an entry signal/or a trend filter. Long/Short entry signals will be determined based on the selected potential Supertrend entry signals, and filtered based on them being in an uptrend/downtrend (also available for setup). Please use the provided tooltips for each setup to see every detail.
Exit strategy:
4 different types of Stop Losses are available: ATR-based/Candle Low/High Based/Percentage Based/Pip Based. Additionally, Force exiting can also be applied, where there is option to set up 4 custom sessions, and exits will happen after the session has closed.
Parameters of every indicator used in the strategy can be tuned in the strategy settings as follows:
Plot settings:
Plot Signals: true by default, Show all Long and Short signals on the signal candle
Plot SL/TP lines: false by default, Checking this option will result in the TP and SL lines to be plotted on the chart.
Supertrend 1-4:
All the parameters of the Supertrends can be set up here, as well as their individual role in the entry logic.
Exit Strategy:
ATR Based Stop Loss: true by default
ATR Length (of the SL): 100 by default
ATR Smoothing (of the SL): RMA/SMMA by default
Candle Low/High Based Stop Loss: false by default, recent lowest or highest point (depending on long/short position) will be used to calculate stop loss value. Set 'Base Risk Multiplier' to 1 if you would like to use the calculated value as is. Setting it to a different value will count as an additional multiplier.
Candle Lookback (of the SL): 50 by default
Percentage Based Stop Loss: false by default, Set the stop loss to current price - % of current price (long) or price + % of current price (short).
Percentage (of the SL): 0.3 by default
Pip Based Stop Loss: Set the stop loss to current price - x pips (long) or price + x pips (short). Set 'Base Risk Multiplier' to 1 if you would like to use the calculated value as is. Setting it to a different value will count as an additional multiplier.
Pip (of the SL): 10 by default
Base Risk Multiplier: 4.5 by default, the stop loss will be placed at this risk level (meaning in case of ATR SL that the ATR value will be multiplied by this factor and the SL will be placed that value away from the entry level)
Risk to Reward Ratio: 1.5 by default, the take profit level will be placed such as this Risk/Reward ratio is met
Force Exiting:
4 total Force exit on custom session close options: none applied by default. If enabled, trades will close automatically after the set session is closed (on next candle's open).
Base Setups:
Allow Long Entries: true by default
Allow Short Entries: true by default
Order Size: 10 by default
Order Type: Capital Percentage by default, allows adjustment on how the position size is calculated: Cash: only the set cash amount will be used for each trade Contract(s): the adjusted number of contracts will be used for each trade Capital Percentage: a % of the current available capital will be used for each trade
ATR Limiter:
Use ATR Limiter: true by default, Only enter into any position (long/short) if ATR value is higher than the Low Boundary and lower than the High Boundary.
ATR Limiter Length: 50 by default
ATR Limiter Smoothing: RMA/SMMA by default
High Boundary: 1000 by default
Low Boundary: 0.0003 by default
MA based calculation: ATR value under MA by default, If not Unspecified, an MA is calculated with the ATR value as source. Only enter into position (long/short) if ATR value is higher/lower than the MA.
MA Type: RMA/SMMA by default
MA Length: 400 by default
Waddah Attar Filter:
Explosion/Deadzone relation: Not specified by default, Explosion over Deadzone: trades will only happen if the explosion line is over the deadzone line; Explosion under Deadzone: trades will only happen if the explosion line is under the deadzone line; Not specified: the opening of trades will not be based on the relation between the explosion and deadzone lines.
Limit trades based on trends: Not specified by default, Strong Trends: only enter long if the WA bar is colored green (there is an uptrend and the current bar is higher then the previous); only enter short if the WA bar is colored red (there is a downtrend and the current bar is higher then the previous); Soft Trends: only enter long if the WA bar is colored lime (there is an uptrend and the current bar is lower then the previous); only enter short if the WA bar is colored orange (there is a downtrend and the current bar is lower then the previous); All Trends: only enter long if the WA bar is colored green or lime (there is an uptrend); only enter short if the WA bar is colored red or orange (there is a downtrend); Not specified: the color of the WA bar (trend) is not relevant when considering entries.
WA bar value: Not specified by default, Over Explosion and Deadzone: only enter trades when the WA bar value is over the Explosion and Deadzone lines; Not specified: the relation between the explosion/deadzone lines to the value of the WA bar will not be used to filter opening trades.
Sensitivity: 150 by default
Fast MA Type: SMA by default
Fast MA Length: 10 by default
Slow MA Type: SMA
Slow MA Length: 20 by default
Channel MA Type: EMA by default
BB Channel Length: 20 by default
BB Stdev Multiplier: 2 by default
Trend Filter:
Use long trend filter 1: false by default, Only enter long if price is above Long MA.
Show long trend filter 1: false by default, Plot the selected MA on the chart.
TF1 - MA Type: EMA by default
TF1 - MA Length: 120 by default
TF1 - MA Source: close by default
Use short trend filter 1: false by default, Only enter long if price is above Long MA.
Show short trend filter 1: false by default, Plot the selected MA on the chart.
TF2 - MA Type: EMA by default
TF2 - MA Length: 120 by default
TF2 - MA Source: close by default
Volume Filter:
Only enter trades where volume is higher then the volume-based MA: true by default, a set type of MA will be calculated with the volume as source, and set length
MA Type: RMA/SMMA by default
MA Length: 200 by default
Date Range Limiter:
Limit Between Dates: false by default
Start Date: Jan 01 2023 00:00:00 by default
End Date: Jun 24 2023 00:00:00 by default
Session Limiter:
Show session plots: false by default, show market sessions on chart: Sidney (red), Tokyo (orange), London (yellow), New York (green)
Use session limiter: false by default, if enabled, trades will only happen in the ticked sessions below.
Sidney session: false by default, session between: 15:00 - 00:00 (EST)
Tokyo session: false by default, session between: 19:00 - 04:00 (EST)
London session: false by default, session between: 03:00 - 11:00 (EST)
New York session: false by default, session between: 08:00 - 17:00 (EST)
Trading Time:
Limit Trading Time: true by default, tick this together with the options below to enable limiting based on day and time
Valid Trading Days Global: 123567 by default, if the Limit Trading Time is on, trades will only happen on days that are present in this field. If any of the not global Valid Trading Days is used, this field will be neglected. Values represent days: Sunday (1), Monday (2), ..., Friday (6), Saturday(7) To trade on all days use: 123457
(1) Valid Trading Days: false, 123456 by default, values represent days: Sunday (1), Monday (2), ..., Friday (6), Saturday(7) The script will trade on days that are present in this field. Please make sure that this field and also (1) Valid Trading Hours Between is checked
(1) Valid Trading Hours Between: false, 1800-2000 by default, hours between which the trades can happen. The time is always in the exchange's timezone
All other options are also disabled by default
PineConnector Automation:
Use PineConnector Automation: false by default, In order for the connection to MetaTrader to work, you will need do perform prerequisite steps, you can follow our full guide at our website, or refer to the official PineConnector Documentation. To set up PineConnector Automation on the TradingView side, you will need to do the following:
1. Fill out the License ID field with your PineConnector License ID;
2. Fill out the Risk (trading volume) with the desired volume to be traded in each trade (the meaning of this value depends on the EA settings in Metatrader. Follow the detailed guide for additional information);
3. After filling out the fields, you need to enable the 'Use PineConnector Automation' option (check the box in the strategy settings);
4. Check if the chart has updated and you can see the appropriate order comments on your chart;
5. Create an alert with the strategy selected as Condition, and the Message as {{strategy.order.comment}} (should be there by default);
6. Enable the Webhook URL in the Notifications section, set it as the official PineConnector webhook address and enjoy your connection with MetaTrader.
License ID: 60123456789 by default
Risk (trading volume): 1 by default
NOTE! Fine-tuning/re-optimization is highly recommended when using other asset/timeframe combinations.

120x ticker screener (composite tickers)In specific circumstances, it is possible to extract data, far above the 40 `request.*()` call limit for 1 single script .
The following technique uses composite tickers . Changing tickers needs to be done in the code itself as will be explained further.
⎯⎯⎯⎯⎯⎯⎯⎯⎯⎯⎯⎯⎯⎯⎯⎯⎯⎯⎯⎯⎯⎯⎯⎯⎯⎯⎯⎯⎯⎯⎯⎯⎯⎯⎯⎯⎯⎯⎯⎯⎯⎯⎯⎯⎯⎯⎯⎯⎯⎯⎯⎯⎯⎯⎯
🔶 PRINCIPLE
Standard example:
c1 = request.security('MTLUSDT' , 'D', close)
This will give the close value from 1 ticker (MTLUSDT); c1 for example is 1.153
Now let's add 2 tickers to MTLUSDT; XMRUSDT and ORNUSDT with, for example, values of 1.153 (I), 143.4 (II) and 0.8242 (III) respectively.
Just adding them up 'MTLUSDT+XMRUSDT+ORNUSDT' would give 145.3772 as a result, which is not something we can use...
Let's multiply ORNUSDT by 100 -> 14340
and multiply MTLUSDT by 1000000000 -> 1153000000 (from now, 10e8 will be used instead of 1000000000)
Then we make the sum.
When we put this in a security call (just the close value) we get:
c1 = request.security('MTLUSDT*10e8+XMRUSDT*100+ORNUSDT', 'D', close)
'MTLUSDT*10e8+XMRUSDT*100+ORNUSDT' -> 1153000000 + 14340 + 0.8242 = 1153014340.8242 (a)
This (a) will be split later on, for example:
1153014330.8242 / 10e8 = 1.1530143408242 -> round -> in this case to 1.153 (I), multiply again by 10e8 -> 1153000000.00 (b)
We subtract this from the initial number:
1153014340.8242 (a)
- 1153000000.0000 (b)
–––––––––––––––––
14340.8242 (c)
Then -> 14340.8242 / 100 = 143.408242 -> round -> 143.4 (II) -> multiply -> 14340.0000 (d)
-> subtract
14340.8242 (c)
- 14340.0000 (d)
––––––––––––
0.8242 (III)
Now we have split the number again into 3 tickers: 1.153 (I), 143.4 (II) and 0.8242 (III)
⎯⎯⎯⎯⎯⎯⎯⎯⎯⎯⎯⎯⎯⎯⎯⎯⎯⎯⎯⎯⎯⎯⎯⎯⎯⎯⎯⎯⎯⎯⎯⎯⎯⎯⎯⎯⎯⎯⎯⎯⎯⎯⎯⎯⎯⎯⎯⎯⎯⎯⎯⎯⎯⎯⎯
In this publication the function compose_3_() will make a composite ticker of 3 tickers, and the split_3_() function will split these 3 tickers again after passing 1 request.security() call.
In this example:
t46 = 'BINANCE:MTLUSDT', n46 = 10e8 , r46 = 3, t47 = 'BINANCE:XMRUSDT', n47 = 10e1, r47 = 1, t48 = 'BINANCE:ORNUSDT', r48 = 4 // T16
•••
T16= compose_3_(t48, t47, n47, t46, n46)
•••
= request.security(T16, res, )
•••
= split_3_(c16, n46, r46, n47, r47, r48)
🔶 CHANGING TICKERS
If you need to change tickers, you only have to change the first part of the script, USER DEFINED TICKERS
Back to our example, at line 26 in the code, you'll find:
t46 = 'BINANCE:MTLUSDT', n46 = 10e8 , r46 = 3, t47 = 'BINANCE:XMRUSDT', n47 = 10e1, r47 = 1, t48 = 'BINANCE:ORNUSDT', r48 = 4 // T16
( t46 , T16 ,... will be explained later)
You need to figure out how much you need to multiply each ticker, and the number for rounding, to get a good result.
In this case:
'BINANCE:MTLUSDT', multiply number = 10e8, round number is 3 (example value 1.153)
'BINANCE:XMRUSDT', multiply number = 10e1, round number is 1 (example value 143.4)
'BINANCE:ORNUSDT', NO multiply number, round number is 4 (example value 0.8242)
The value with most digits after the decimal point by preference is placed to the right side (ORNUSDT)
If you want to change these 3, how would you do so?
First pick your tickers and look for the round values, for example:
'MATICUSDT', example value = 0.5876 -> round -> 4
'LTCUSDT' , example value = 77.47 -> round -> 2
'ARBUSDT' , example value = 1.0231 -> round -> 4
Value with most digits after the decimal point -> MATIC or ARB, let's pick ARB to go on the right side, LTC at the left of ARB, and MATIC at the most left side.
-> 'MATICUSDT', LTCUSDT', ARBUSDT'
Then check with how much 'LTCUSDT' and 'MATICUSDT' needs to be multiplied to get this: 5876 0 7747 0 1.0231
'MATICUSDT' -> 10e10
'LTCUSDT' -> 10e3
Replace:
t46 = 'BINANCE:MTLUSDT', n46 = 10e8 , r46 = 3, t47 = 'BINANCE:XMRUSDT', n47 = 10e1, r47 = 1, t48 = 'BINANCE:ORNUSDT', r48 = 4 // T16
->
t46 = 'BINANCE:MATICUSDT', n46 = 10e10 , r46 = 4, t47 = 'BINANCE:LTCUSDT', n47 = 10e3, r47 = 2, t48 = 'BINANCE:ARBUSDT', r48 = 4 // T16
DO NOT change anything at t46, n46,... if you don't know what you're doing!
Only
• tickers ('BINANCE:MTLUSDT', 'BINANCE:XMRUSDT', 'BINANCE:ORNUSDT', ...),
• multiply numbers (10e8, 10e1, ...) and
• round numbers (3, 1, 4, ...)
should be changed.
There you go!
🔶 LIMITATIONS
🔹 The composite ticker fails when 1 of the 3 isn't in market in the weekend, while the other 2 are.
That is the reason all tickers are crypto. I think it is possible to combine stock,... tickers, but they have to share the same market hours.
🔹 The number cannot be as large as you want, the limit lays around 15-16 digits.
This means when you have for example 123, 45.67 and 0.000000000089, you'll get issues when composing to this:
-> 123045670.000000000089 (21 digits)
Make sure the numbers are close to each other as possible, with 1 zero (or 2) in between:
-> 1.230045670089 (13 digits by doing -> (123 * 10e-3) + (45.67 * 10e-7) + 0.000000000089)
🔹 This script contains examples of calculated values, % change, SMA, RMA and RSI.
These values need to be calculated from HTF close data at current TF (timeframe).
This gives challenges. For example the SMA / %change is not a problem (same values at 1h TF from Daily data).
RMA , RSI is not so easy though...
Daily values are rather similar on a 2-3h TF, but 1h TF and lower is quite different.
At the moment I haven't figured out why, if someone has an idea, don't hesitate to share.
The main goal of this publication is 'composite tickers ~ request.security()' though.
🔹 When a ticker value changes substantially (x10, x100), the multiply number needs to be adjusted accordingly.
🔶 SETTINGS
SHOW SETS
SET
• Length : length of SMA, RMA and RSI
• HTF : Higher TimeFrame (default Daily)
TABLE
• Size table : \ _ Self-explanatory
• Include exchange name : /
• Sort : If exchange names are shown, the exchanges will be sorted first
COLOURS
• CH%
• RSI
• SMA (RMA)
DEBUG
Remember t46 , T16 ,... ?
This can be used for debugging/checking
ALWAYS DISABLE " sort " when doing so.
Example:
Set string -> T1 (tickers FIL, CAKE, SOL)
(Numbers are slightly different due to time passing by between screen captures)
Placing your tickers at the side panel makes it easy to compare with the printed label below the table (right side, 332201415014.45 ),
together with the line T1 in the script:
t1 = 'BINANCE:FILUSDT' , n1 = 10e10, r1 = 4, t2 = 'BINANCE:CAKEUSDT' , n2 = 10e5 , r2 = 3, t3 = 'BINANCE:SOLUSDT' , r3 = 2 // T1
FIL : 3.322
CAKE: 1.415
SOL : 14.56
Now it is easy to check whether the tickers are placed close enough to each other, with 1-2 zero's in between.
If you want to check a specific ticker, use " Show Ticker" , see out initial example:
Set string -> T16
Show ticker -> 46 (in the code -> t46 = 'BINANCE:MTLUSDT')
(Set at 0 to disable " check string " and NONE to disable " Set string ")
-> Debug/check/set away! 😀
🔶 OTHER TECHNIQUES
• REGEX ( Regular expression ) and str.match() is used to delete the exchange name from the ticker, in other words, everything before ":" is deleted by following regex:
exch(t) => incl_exch ? t : str.match(t, "(?<=:) +")
• To sort, array.sort_indices() is used (line 675 in the code), just as in my first "sort" publication Sort array alphabetically - educational
aSort = arrT.copy()
sort_Indices = array.sort_indices(id= aSort, order= order.ascending)
• Numbers and text colour will adjust automatically when switching between light/dark mode by using chart.fg_color / chart.bg_color
🔹 DISCLAIMER
Please don't ask me for custom screeners, thank you.

Any RibbonThis indicator displays a ribbon of two individually configured Fast and Slow and Moving Averages for a fixed time frame. It also displays the last close price of the configured time frame, colored green when above the band, red below and blue when interacting. A label shows the percentage distance of the current price from the band, (again red below, green above, blue interacting), when the price is within the band it will show the percentage distance from median of the band.
The Fast and Slow Moving Averages can be set to:
Simple Moving Average (SMA)
Exponential Moving Average (EMA)
Weighted Moving Average (WMA)
Volume-Weighted Moving Average (VWMA)
Hull Moving Average (HMA)
Exponentially Weighted Moving Average (RMA) (SMMA)
Linear regression curve Moving Average (LSMA)
Double EMA (DEMA)
Double SMA (DSMA)
Double WMA (DWMA)
Double RMA (DRMA)
Triple EMA (TEMA)
Triple SMA (TSMA)
Triple WMA (TWMA)
Triple RMA (TRMA)
Symmetrically Weighted Moving Average (SWMA) ** length does not apply **
Arnaud Legoux Moving Average (ALMA)
Variable Index Dynamic Average (VIDYA)
Fractal Adaptive Moving Average (FRAMA)
I wrote this script after identifying some interesting moving average bands with my AMACD indicator and wanting to see them on the price chart. As an example look at the interactions between ETHBUSD 4hr and the band of VIDYA 32 Open and VIDYA 39 Open. Or start from the good old BTC Bull market support band, Weekly EMA 21 and SMA 20 and see if you can get a better fit. I find the Double RMA 22 a better fast option than the standard EMA 21.

historicalrangeLibrary "historicalrange"
Library provices a method to calculate historical percentile range of series.
hpercentrank(source) calculates historical percentrank of the source
Parameters:
source : Source for which historical percentrank needs to be calculated. Source should be ranging between 0-100. If using a source which can beyond 0-100, use short term percentrank to baseline them.
Returns: pArray - percentrank array which contains how many instances of source occurred at different levels.
upperPercentile - percentile based on higher value
lowerPercentile - percentile based on lower value
median - median value of the source
max - max value of the source
distancefromath(source) returns stats on historical distance from ath in terms of percentage
Parameters:
source : for which stats are calculated
Returns: percentile and related historical stats regarding distance from ath
distancefromma(maType, length, source) returns stats on historical distance from moving average in terms of percentage
Parameters:
maType : Moving Average Type : Can be sma, ema, hma, rma, wma, vwma, swma, highlow, linreg, median
length : Moving Average Length
source : for which stats are calculated
Returns: percentile and related historical stats regarding distance from ath
bpercentb(source, maType, length, multiplier, sticky) returns percentrank and stats on historical bpercentb levels
Parameters:
source : Moving Average Source
maType : Moving Average Type : Can be sma, ema, hma, rma, wma, vwma, swma, highlow, linreg, median
length : Moving Average Length
multiplier : Standard Deviation multiplier
sticky : - sticky boundaries which will only change when value is outside boundary.
Returns: percentile and related historical stats regarding Bollinger Percent B
kpercentk(source, maType, length, multiplier, useTrueRange, sticky) returns percentrank and stats on historical kpercentk levels
Parameters:
source : Moving Average Source
maType : Moving Average Type : Can be sma, ema, hma, rma, wma, vwma, swma, highlow, linreg, median
length : Moving Average Length
multiplier : Standard Deviation multiplier
useTrueRange : - if set to false, uses high-low.
sticky : - sticky boundaries which will only change when value is outside boundary.
Returns: percentile and related historical stats regarding Keltener Percent K
dpercentd(useAlternateSource, alternateSource, length, sticky) returns percentrank and stats on historical dpercentd levels
Parameters:
useAlternateSource : - Custom source is used only if useAlternateSource is set to true
alternateSource : - Custom source
length : - donchian channel length
sticky : - sticky boundaries which will only change when value is outside boundary.
Returns: percentile and related historical stats regarding Donchian Percent D
oscillator(type, length, shortLength, longLength, source, highSource, lowSource, method, highlowLength, sticky) oscillator - returns Choice of oscillator with custom overbought/oversold range
Parameters:
type : - oscillator type. Valid values : cci, cmo, cog, mfi, roc, rsi, stoch, tsi, wpr
length : - Oscillator length - not used for TSI
shortLength : - shortLength only used for TSI
longLength : - longLength only used for TSI
source : - custom source if required
highSource : - custom high source for stochastic oscillator
lowSource : - custom low source for stochastic oscillator
method : - Valid values for method are : sma, ema, hma, rma, wma, vwma, swma, highlow, linreg, median
highlowLength : - length on which highlow of the oscillator is calculated
sticky : - overbought, oversold levels won't change unless crossed
Returns: percentile and related historical stats regarding oscillator
[EG] MA ATR ChannelsGreetings - the aim of this indicator was to code a single indicator with a selectable moving average, so I could examine price relationships to MA's and Average True Range (ATR) bollinger type bands. You can obviously approach this tool in so many different ways so I am going to share first an overview of moving averages and a short overview of how I use this this indicator.
Simple ( SMA ) – A simple average of the past N (length) prices. Just add the price data for each N (bar) and divide the total by N.
Exponential ( EMA ) – An exponential moving average with a greater weight for recent prices. The weighting is exponential. An N-period EMA takes more than N data points into account and gradually dilutes past data’s effect.
Double Exponential ( DEMA ) - Same as an EMA , the Double exponential moving average , or DEMA , is a measure of a security's trending average price that gives the even more weight to recent price data. Aimed to help reduce lag.
Triple Exponential ( TEMA ) - Same as an EMA , the Triple exponential moving average , or TEMA , is a measure of a security's trending average price that gives the even more weight to recent price data than EMA or DEMA . Aimed to help reduce lag.
Weighted ( WMA ) – An average of the past N prices with a linear weighting, again giving greater weight to more recent prices.
Hull ( HMA ) - The Hull Moving Average (developed by Alan Hull) has the purpose of reducing lag, increasing responsiveness while at the same time eliminating noise. It emphasises recent prices over older ones, resulting in a fast-acting yet smooth moving average that can be used to identify the prevailing market trend.
Wilder's (RMA) - Wilder's smoothing is a type of exponential moving average . It takes one parameter, the period n, and price. Larger values for n will have a greater smoothing effect on the input data but will also create more lag. It is equivalent to a 2n-1 Exponential Moving Average . For example, a 10 period Wilder's smoothing is the same as a 19 period exponential moving average .
Symmetrically Weighted ( SWMA ) - Weight distribution starts from median of given period and it's reduced linearly to the sides so the ending and starting point of period have the least weight. It's smooth and fast but reacts late to trend changes on higher lengths (lookback).
Arnaud Legoux ( ALMA ) - Arnaud Legoux Moving Average removes small price fluctuations and enhances trend via applying a moving average twice, once from left to right, and once from right to left and combines both. At the end of this process the phase shift (price lag) commonly associated with moving averages is significantly reduced.
Volume-Weighted ( VWMA ) - A Volume-Weighted Moving Average gives a different weight to each closing price and this weight depends on the volume of that period. For example, the closing price of a day with high volume will have a greater weight on the moving average value.
Volume Weighted Average Price ( VWAP ) - Though not necessarily a MA - Volume-weighted average price ( VWAP ) is a ratio of the cumulative share price to the cumulative volume traded over a given time period and so I thought would be useful as an ATR tool. The VWAP is calculated using the opening price for each day and adjusting in real time right up until the close of the session. Thus, the calculation uses intraday data only.
So what is Average True Range ?
Average True Range is a measure of volatility . It's an area that represents roughly how much you can expect a security to change in price over a time period. Average true range is usually calculated by applying Wilders Smoothing to True Range. If you want regular ATR - use RMA as the input for the ATR. The ATR is then divided into periods based on derivatives of Phi (3.14) and Fibs (0.618, 1.618 etc.) You will notice price bounces off the lines. Look for patterns.
The indicator - consisting of 3 parts:
Price/Fast MA - this is an MA anywhere between 3-20 periods that is reflective of very recent price action. It is red when price is below - and green when above. Recommendations : SMA , EMA , WMA , HMA
Trend/Medium MA - this is a slower MA that you could set anywhere between 30 - 100 periods that is reflective of overall bull/bear market trend depending on both it's direction and whether the Price MA / price is lower or higher. Recommendations: EMA , WMA , VWMA , RMA, ALMA
Average True Range - this is a way to measure and visualise range the price may be capable of in - if it is towards or below the 2.1 multiplier - a bull reversal is more likely and vice versea. The multi's are set to factors of Pi and Fibonacci ratio's. Green channel means bullish, red channel means bearish. Gold means sign of a likely reversal. If the PMA enters the channel - it is likely the reversal is cancelled for a short period more.
Recommendations : RMA, EMA , VWMA , ALMA , SWMA , VWAP
How I use it :
First of all - Consider longs when channel is green - or going to bounce on a support line - and consider shorts based on the opposite. This is not a buy/sell indicator - this is a MAP to PRICE to give reference and meaning to price movements across multiple time frames - very useful when using with a volume indicator and an RSI. I personally use it on the 3m chart but change the TFM to 5 for 15m data.
If you wish to see any other more exotic or interesting MA's added please feel free to request them in the comments ! And thanks for checking out my first indicator
Octuple Mean AverageHere you can combine up to 8 moving averages and make 1 "OMA" (Octuple Mean Average)
In this way:
- advantages of several ma's can be mixed
- a mean averages can be improved without the need to change the length
(for example if you want a RMA, SMA,... to react faster combine it with 1 or more EMA's)
- smoothing and shifting possibilities (combine with a dema and adjust the lookback),
again without the need to change the length
- ...
This is a combination of a RMA, VWMA, DEMA and TEMA:
Here is a DEMA (lookback 20), smoothed by adding a RMA:
Or, 3x RMA, 2x SMA, 1x EMA and 1x WMA:
Color can be made unicolor by disabling 'bicolor ?'
When disabled the first color only is applied
Bicolor options:
- OMA changes color when it is rising/falling
- OMA changes color when source is above/below OMA
Cheers!

Ultimate Strategy TemplateHello Traders
As most of you know, I'm a member of the PineCoders community and I sometimes take freelance pine coding jobs for TradingView users.
Off the top of my head, users often want to:
- convert an indicator into a strategy, so as to get the backtesting statistics from TradingView
- add alerts to their indicator/strategy
- develop a generic strategy template which can be plugged into (almost) any indicator
My gift for the community today is my Ultimate Strategy Template
Step 1: Create your connector
Adapt your indicator with only 2 lines of code and then connect it to this strategy template.
For doing so:
1) Find in your indicator where are the conditions printing the long/buy and short/sell signals.
2) Create an additional plot as below
I'm giving an example with a Two moving averages cross.
Please replicate the same methodology for your indicator wether it's a MACD, ZigZag, Pivots, higher-highs, lower-lows or whatever indicator with clear buy and sell conditions
//@version=4
study(title='Moving Average Cross', shorttitle='Moving Average Cross', overlay=true, precision=6, max_labels_count=500, max_lines_count=500)
type_ma1 = input(title="MA1 type", defval="SMA", options= )
length_ma1 = input(10, title = " MA1 length", type=input.integer)
type_ma2 = input(title="MA2 type", defval="SMA", options= )
length_ma2 = input(100, title = " MA2 length", type=input.integer)
// MA
f_ma(smoothing, src, length) =>
iff(smoothing == "RMA", rma(src, length),
iff(smoothing == "SMA", sma(src, length),
iff(smoothing == "EMA", ema(src, length), src)))
MA1 = f_ma(type_ma1, close, length_ma1)
MA2 = f_ma(type_ma2, close, length_ma2)
// buy and sell conditions
buy = crossover(MA1, MA2)
sell = crossunder(MA1, MA2)
plot(MA1, color=color_ma1, title="Plot MA1", linewidth=3)
plot(MA2, color=color_ma2, title="Plot MA2", linewidth=3)
plotshape(buy, title='LONG SIGNAL', style=shape.circle, location=location.belowbar, color=color_ma1, size=size.normal)
plotshape(sell, title='SHORT SIGNAL', style=shape.circle, location=location.abovebar, color=color_ma2, size=size.normal)
/////////////////////////// SIGNAL FOR STRATEGY /////////////////////////
Signal = buy ? 1 : sell ? -1 : 0
plot(Signal, title="🔌Connector🔌", transp=100)
Basically, I identified my buy, sell conditions in the code and added this at the bottom of my indicator code
Signal = buy ? 1 : sell ? -1 : 0
plot(Signal, title="🔌Connector🔌", transp=100)
Important Notes
🔥 The Strategy Template expects the value to be exactly 1 for the bullish signal , and -1 for the bearish signal
Now you can connect your indicator to the Strategy Template using the method below or that one
Step 2: Connect the connector
1) Add your updated indicator to a TradingView chart
2) Add the Strategy Template as well to the SAME chart
3) Open the Strategy Template settings and in the Data Source field select your 🔌Connector🔌 (which comes from your indicator)
From then, you should start seeing the signals and plenty of other stuff on your chart
🔥 Note that whenever you'll update your indicator values, the strategy statistics and visual on your chart will update in real-time
Settings
- Color Candles : Color the candles based on the trade state (bullish, bearish, neutral)
- Close positions at market at the end of each session : useful for everything but cryptocurrencies
- Session time ranges : Take the signals from a starting time to an ending time
- Close Direction : Choose to close only the longs, shorts, or both
- Date Filter : Take the signals from a starting date to an ending date
- Set the maximum losing streak length with an input
- Set the maximum winning streak length with an input
- Set the maximum consecutive days with a loss
- Set the maximum drawdown (in % of strategy equity)
- Set the maximum intraday loss in percentage
- Limit the number of trades per day
- Limit the number of trades per week
- Stop-loss: None or Percentage or Trailing Stop Percentage or ATR
- Take-Profit: None or Percentage or ATR
- Risk-Reward based on ATR multiple for the Stop-Loss and Take-Profit
This script is open-source so feel free to use it, and optimize it as you want
Alerts
Maybe you didn't know it but alerts are available on strategy scripts.
I added them in this template - that's cool because:
- if you don't know how to code, now you can connect your indicator and get alerts
- you have now a cool template showing you how to create alerts for strategy scripts
Source: www.tradingview.com
I hope you'll like it, use it, optimize it and most importantly....make some optimizations to your indicators thanks to this Strategy template
Special Thanks
Special thanks to @JosKodify as I borrowed a few risk management snippets from his website: kodify.net
Additional features
I thought of plenty of extra filters that I'll add later on this week on this strategy template
Best
Dave

RvMA BandsI modified my EvMA Bands and replaced EMA with RMA.
The center line is named RvMA and is a volume-weighted Running Moving Average.
Since the original RMA is a moving average line that is quite slow to respond, it can be said that the part where RvMA moves significantly is price fluctuations accompanied by volume.
The standard deviation used in this Inge is the newly developed Running and volume-weighted standard deviation smoothed by RMA.
I think that the usage in trading is the same as the Bollinger band
拙作のEvMA Bandsを改造して、EMAをRMAに差し替えたものです
中央線はRvMAと名付けて、出来高加重修正移動平均線です
元になったRMAはかなり反応が鈍い移動平均線ですので、RvMAが大きく動いてる部分は出来高を伴う価格変動だといえます
このインジで使用している標準偏差は新開発の出来高加重修正標準偏差をRMAでスムージングしたものです
トレードでの使い方はボリンジャーバンドと同じ感じで良いと考えます

HG Scalpius - ATR Up/Down Tick HighlightHG Scalpius - ATR Up/Down Tick Highlight
This indicator highlights ATR(14) upticks (green) and downticks (red) and has the below application:
- If a new trend closing high (low) is made on a downtick in ATR, decreasing volatility mode turns on
If you come across or think of any other useful scripts for the HG Scalpius system please comment below!
Links to 2 previous HG Scalpius scripts:
-
-
Happy trading!
Code:
study(title="Average True Range", shorttitle="ATR", overlay=false)
length = input(title="Length", defval=14, minval=1)
smoothing = input(title="Smoothing", defval="RMA", options= )
ma_function(source, length) =>
if smoothing == "RMA"
rma(source, length)
else
if smoothing == "SMA"
sma(source, length)
else
if smoothing == "EMA"
ema(source, length)
else
wma(source, length)
ATR = ma_function(tr(true), length)
c = ATR >= ATR ? color.lime : color.red
plot(ATR, title = "ATR", color=c, transp=0)

Accumulation/Distribution Percentage (ADP) [Cyrus c|:D]Accumulation/Distribution Percentage ( ADP ) is used to measure money flow similar to Chaikin Money Flow ( CMF ) and Money Flow. It is the range-bound version of my previous indicator ADMF. This indicator can be used for analyzing momentum, buy/sell pressure, and overbought/oversold conditions. I believe that this indicator is more accurate than CMF and MFI (I will publish a TA about it one day!).
What to look for:
- When this indicator moves up, it means buy pressure is increasing and the other way around for sell pressure. Crossing 0 means that trend has changed in the given period (it is best to look for confirmation of buy/sell pressure in larger TFs)
- Overbought above 40 and oversold below -40 (these numbers vary depending on the security. Look for historical levels to determine overbought and oversold conditions of each security)
- Regular divergence shows that momentum of a trend is declining. Hidden divergence implies continuation of a trend. The non-bound mode should be more accurate for identifying divergence.
- Failure swings can detect potential reversals.
Please read Relative Strength Index and Money Flow for more information and similar disclaimers.
Recommendations:
- hlc3 (AKA typical price) as input source might be better than "close" as it captures more information. If you use hlc3 as a source, then change the chart type to line and set hlc3 as the source for identifying divergence.
- Use hybrid tickers e.g.(BITFINEX:BTCUSD+COINBASE:BTCUSD+BITSTAMP:BTCUSD)/3. Volume-based indicators are susceptible to wash trading/volume printing and hybrid tickers mitigate this issue.
- In non-bound mode, small TFs with longer length should be more accurate than larger TFs with standard length (same is true for many other indicators)
Background:
I have developed 4 indicators based on a simple but elegant concept of A/D ratio. A/D ratio is equal to (current close - previous close)/True Range (when there are no price gaps, True Range = High - Low)
1) What you see on ADV indicator as darker green and red is equal to A/D ratio x volume.
2) ADL indicator shows the summation of ADV
3) ADMF (or ADP in non-bound mode) shows Moving Average of ADV
4) ADP shows relative accumulation strength which is calculated as RMA (accumulations)/RMA(accumulation + distribution). ADP equation is based on RSI equation which is RMA(gains)/RMA(gains + losses). That is why these two indicators look quite similar.
PS: Please leave a like if you find these indicators useful. I am working on improvements on these and other indicators. I am trying my best to keep them as simple as possible. Please let me know in the comments if you want me to make future indicators even simpler.
--------
Complementary indicators based on the same concept:
ADL: a replacement for Chaikin's Accum/Dist, On Balance Volume, and Price Volume Trend
ADV: a replacement for regular volume indicator
ADP also has a scaled RSI and ADMF built in (ie ADMF is obsolete).
