ChopFlow ATR Scalp StrategyA lean, high-velocity scalp framework for NQ and other futures that blends trend clarity, volume confirmation, and adaptive exits to give you precise, actionable signals—no cluttered bands or lagging indicators.
⸻
🔍 Overview
This strategy locks onto rapid intraday moves by:
• Filtering for directional momentum with the Choppiness Index (CI)
• Confirming conviction via On-Balance Volume (OBV) against its moving average
• Automatically sizing stops and targets with a multiple of the Average True Range (ATR)
It’s designed for scalp traders who need clean, timely entries without wading through choppy noise.
⸻
⚙️ Key Features & Inputs
1. ATR Length & Multiplier
• Controls exit distances based on current volatility.
2. Choppiness Length & Threshold
• Measures trend strength; only fires when the market isn’t “stuck in the mud.”
3. OBV SMA Length
• Smoothes volume flow to confirm genuine buying or selling pressure.
4. Custom Session Hours
• Avoid overnight gaps or low-liquidity periods.
All inputs are exposed for rapid tuning to your preferred scalp cadence.
🚀 How It Works
1. Long Entry triggers when:
• CI < threshold (strong trend)
• OBV > its SMA (positive volume flow)
• You’re within the defined session
2. Short Entry mirrors the above (CI < threshold, OBV < SMA)
3. Exit uses ATR × multiplier for both stop-loss and take-profit
⸻
🎯 Usage Tips
• Start with defaults (ATR 14, multiplier 1.5; CI 14, threshold 60; OBV SMA 10).
• Monitor signal frequency, then tighten/loosen CI or OBV look-back as needed.
• Pair with a fast MA crossover or price-action trigger if you want even sharper timing.
• Backtest across different sessions (early open vs. power hours) to find your edge.
⸻
⚠️ Disclaimer
This script is provided “as-is” for educational and research purposes. Always paper-trade any new setup extensively before deploying live capital, and adjust risk parameters to your personal tolerance.
⸻
Elevate your scalp game with ChopFlow ATR—where trend, volume, and volatility converge for clear, confident entries. Happy scalping!
Search in scripts for "scalp"

Scalping Tool with Dynamic Take Profit & Stop Loss### **Scalping Indicator: Summary and User Guide**
The **Scalping Indicator** is a powerful tool designed for traders who focus on short-term price movements. It combines **Exponential Moving Averages (EMA)** for trend identification and **Average True Range (ATR)** for dynamic stop loss and take profit levels. The indicator is highly customizable, allowing traders to adapt it to their specific trading style and risk tolerance.
---
### **Key Features**
1. **Trend Identification**:
- Uses two EMAs (Fast and Slow) to identify trend direction.
- Generates **Buy Signals** when the Fast EMA crosses above the Slow EMA.
- Generates **Sell Signals** when the Fast EMA crosses below the Slow EMA.
2. **Dynamic Take Profit (TP) and Stop Loss (SL)**:
- **Take Profit (TP)**:
- TP levels are calculated as a percentage above (for long trades) or below (for short trades) the entry price.
- TP levels are **dynamically recalculated** when the price reaches the initial target, allowing for multiple TP levels during a single trade.
- **Stop Loss (SL)**:
- SL levels are calculated using the ATR multiplier, providing a volatility-based buffer to protect against adverse price movements.
3. **Separate Settings for Long and Short Trades**:
- Users can independently enable/disable and configure TP and SL for **Buy** and **Sell** orders.
- This flexibility ensures that the indicator can be tailored to different market conditions and trading strategies.
4. **Visual Signals and Levels**:
- **Buy/Sell Signals**: Clearly marked on the chart with labels ("BUY" or "SELL").
- **TP and SL Levels**: Plotted on the chart for both long and short trades, making it easy to visualize risk and reward.
---
### **How to Use the Scalping Indicator**
#### **1. Setting Up the Indicator**
- Apply the indicator to your chart in TradingView.
- Configure the input parameters based on your trading preferences:
- **Fast Length**: The period for the Fast EMA (default: 5).
- **Slow Length**: The period for the Slow EMA (default: 13).
- **ATR Length**: The period for the ATR calculation (default: 14).
- **Buy/Sell TP and SL**: Enable/disable and set the percentage or ATR multiplier for TP and SL levels.
#### **2. Interpreting the Signals**
- **Buy Signal**:
- When the Fast EMA crosses above the Slow EMA, a "BUY" label appears below the price bar.
- The TP and SL levels for the long trade are plotted on the chart.
- **Sell Signal**:
- When the Fast EMA crosses below the Slow EMA, a "SELL" label appears above the price bar.
- The TP and SL levels for the short trade are plotted on the chart.
#### **3. Managing Trades**
- **Take Profit (TP)**:
- When the price reaches the initial TP level, the indicator automatically recalculates the next TP level based on the new close price.
- This allows traders to capture additional profits as the trend continues.
- **Stop Loss (SL)**:
- The SL level is based on the ATR multiplier, providing a dynamic buffer against market volatility.
- If the price hits the SL level, the trade is considered closed, and the indicator resets.
#### **4. Customization**
- Adjust the **Fast Length** and **Slow Length** to suit your trading timeframe (e.g., shorter lengths for scalping, longer lengths for swing trading).
- Modify the **ATR Multiplier** and **TP Percentage** to align with your risk-reward ratio.
- Enable/disable TP and SL for long and short trades based on your trading strategy.
---
### **Tips for Getting the Best Results**
1. **Combine with Price Action**:
- Use the Scalping Indicator in conjunction with support/resistance levels, candlestick patterns, or other technical analysis tools to confirm signals.
2. **Optimize for Your Timeframe**:
- For **scalping**, use shorter EMA lengths (e.g., Fast: 5, Slow: 13).
- For **swing trading**, use longer EMA lengths (e.g., Fast: 10, Slow: 20).
3. **Adjust Risk Management**:
- Use a smaller **ATR Multiplier** for tighter stop losses in low-volatility markets.
- Increase the **TP Percentage** to allow for larger price movements in high-volatility markets.
4. **Backtest and Practice**:
- Test the indicator on historical data to understand its performance in different market conditions.
- Use a demo account to practice trading with the indicator before applying it to live trading.
---
### **Conclusion**
The **Scalping Indicator** is a versatile and user-friendly tool for traders who want to capitalize on short-term price movements. By combining trend-following EMAs with dynamic TP and SL levels, it provides a clear and systematic approach to trading. Whether you're a scalper or a swing trader, this indicator can help you identify high-probability setups and manage risk effectively. Customize it to fit your strategy, and always remember to combine it with sound risk management principles for the best results.

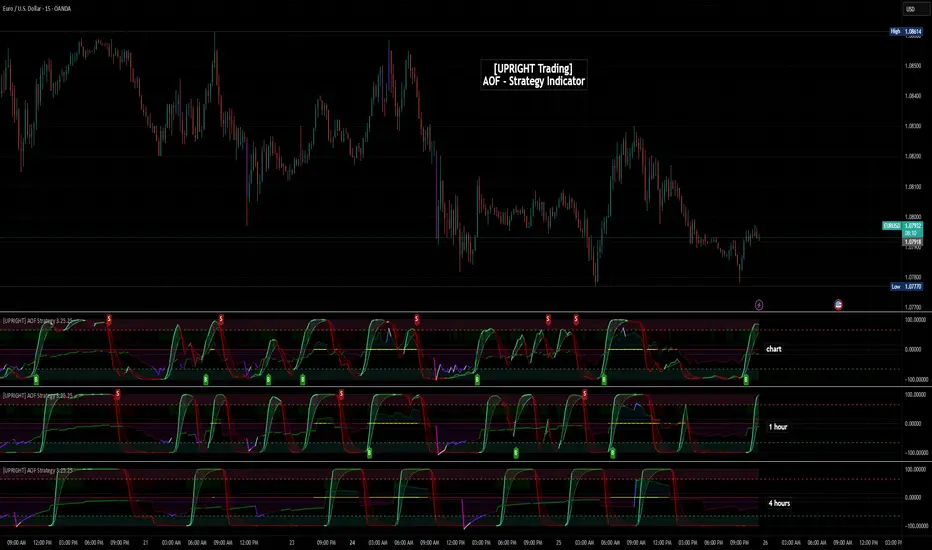
[UPRIGHT Trading] Academy of Forex - Scalp Strategy█ OVERVIEW
This is a collaboration of efforts of The Academy of Forex and UPRIGHT Trading .
The Academy of Forex - Scalp Strategy Indicator is a clean & reimagined lower indicator. To enable optimization & potential automation, we re-coded & optimized it at UPRIGHT Trading.
It is based on the one presented on its YT channel.
The idea is for it to be an easy to use - simple indicator - that works not just for confirmation, but also entering and exiting quickly (scalping).
█ CONCEPTS
The idea is that %B (derived from BBs) is able to pick up some pretty significant moves. With that as one of the bases the Inverse Fisher Transform (Ribbon) acts to show some of the movement of the asset highlighting when it at extremes. The RSI highlights are there as another confirmation to help normalize the sometimes too frequent movement of %B.
As expected the indicator often acts as a reversal indicator, but with the optimizations of logic it's able to pick up more than just the reversals and works as a pretty decent Buy/Sell Algorithm.
█ CALCULATIONS
Calculations used included, but not limited to:
- %B - Quantifies the price as a percentage to the Upper and Lower Band of the Popular Bollinger Bands, which were named after their inventor John Bollinger in 1980.
- Inverse Fisher Transform RSI - is a variation of the IFT, created by John Ehlers, the idea is for the IFT to convert Gaussian normal distribution and to take it a step further the RSI version is to just use overbought and oversold placements. This indicator is meant to highlight when price has moved to an extreme and in this process helps to spot turning points.
- Relative Strength Index (RSI) - As most of you know already the RSI is a technical analysis tool invented by J. Welles Wilder, that oscillates and is used to measure the momentum of price changes. It normalizes to index 0-100 with overbought and oversold defined by the user, but often around 70 as overbought and 30 as oversold.
- Pivot/Swing Points - Implemented to show recent Higher-Highs or Lower-Lows, Pivot points are included in the indicator for structure tracking.
- Moving Averages - Moving averages help to get an idea of when price is moving near the norm or outside to extremes.
█ FEATURES
Indicator Features:
-2 Buy/Sell Signals.
-U Signals (UPRIGHT optimized).
-Exit Reminders.
-Alerts allowing Automation of Scalp Strategy.
-H/L Swings.
-Color Customization.
-Clean Mode.
-Inverse Fisher Transform Ribbon.
-RSI Bullish/Bearish Highlights.
-Options for More Signals (including: Oversold/Overbought Circles, %B Bull/Bear Squares and Triangles, and IFT Highlights).
Showing some of the signals close up.
Should look like this:
Enjoy!
Sincerely,
Mike
Attrition Scalper v2.0Green/Red Arrowed Buy/Sell signals are just simple buy sell signals based on SuperTrend, VWAP, Bollinger, Linear Regression
Purple Arrowed Buy/Sell Signals happen when the price/candle cross over or under the yellow outer lines (4.236 fib lines) It's extremely rare and hard for price to stay above these lines therefore we can usually and comfortably buy/sell it, a key information here though when price pumps or dumps super fast and hard to the point of crossing these borders, the trend might also be extremely strong and continous so even if the price temporarily goes back inside the borders as the lines expand over time price can continue riding or crossing these lines back again and continue the uptrend/downtrend, therefore crossing these outer borders doesn't necessarilly and always mean a reversal is due.
When analyzing the instrument you're trading the important factors for support/resistance areas are usually the outer lines like i said previously it's super hard for price to be outside these and will almost always get back inside quickly. The Middle thicker green/red line which is Variable Index Dynamic Average should also be a nice pivot line for major support and resistance . All the other lines are also important dynamic support/resistance lines.
Their Importance Order
1- Outer Yellow Line (4.236 Fibs)
2- Thicker Middle Green/Red Line (VIDYA)
3- Thinner Upper/Lower Green/Red Line (VIDYA +3, VIDYA -3)
4- The Rest Of The Lines (Fib Lines)
You can use this indicator in any market condition in any market to determine key support/resistance levels, use it for mean reversion through price expanding to outside of the most outer line therefore being overbought/oversold basically using the purple buy/sell signals or only follow the normal buy/sell signals or use it in confluence with each other. You can also use this indicator in confluence with your own manual technical analysis or other indicators/strategies you are already using and are comfortable with.
A good part is the support/resistance lines from timeframe to timeframe pictures the whole situation quite well, you can use lower timeframe to find your entry/exit positions and higher timeframe to find your key support/resistance points, they all should be somewhat in confluence from timeframe to timeframe anyways. My recommendation would be to look at 1HR, 4HR and 1D charts for swing trading and 5-15 Min for quick scalping/day trading
You should still probably at least take a look to higher timeframes so that you don't get burned when you realize there is a huge resistance line at price XXXXX on the 4 hour chart but you're expecting it to go above it on the 5 minute chart, it can go above it temporarily but we analyze everything on a closing basis so it most likely won't close above it. Again don't take a position or FOMO when price breaks a support/resistance line, we're looking for a CLOSE above/below them and a retest to see if S/R flip happened would even be better.
Sometimes the most outer line won't be the 4.236 (Yellow) lines as when it gets quite volatile the Thinner Upper/Lower Green/Red Lines (VIDYA +3, VIDYA-3) might cross them to be the most outer line, in this case i have observed that the trend is extremely strong this time price almost always doesn't go above or below the VIDYA line but can stay outside of the Yellow 4.236 Fib line for an extended amount of time (price will still get back inside the channel relatively quickly, just not as fast as the normal condition)
With Proper Risk Management and Discipline this indicator can be of great use to you as it's surprisingly successful especially at mean reversion and pointing out the support/resistance lines, they are so much more successful than your average MA/EMA lines.

Morning Scalp StrategyThe Morning Scalp Strategy combines the 50EMA with the Stochastic Momentum Index. The morning period is when penny stocks usually have the highest volatility, so the strategy works between 10:00 AM and 12:10 PM.
***It opens only long positions. The ideal timeframe for this scalping strategy is 5 minutes on low-price stocks. The stock should spike in the morning with momentum and Volume.
***Look for a daily or intraday support area, close to the open position, to increase the confidence in the play
The components are:
- EMA50: Exponential Moving Average (EMA50)
- Stochastic Momentum Index (SMI)
Rules:
- Period: 10:00 AM and 12:10 PM
- if SMI Crossover and SMI < 0, open a position
- If close < EMA50, close the position
- Profit target: To be decided by the user, default value = 10% above the entry price
If you have any questions, let me know!

Optimal Confidence Scalper [OCS]Introduction
OCS : Optimal Confidence Scalpers, Utilise the computational approach towards finding confidence estimating in signal generating process, It helps u enter and exit the financial markets quickly, It buy and sell many times in a day with the objective of making consistent profits from incremental movements in the traded security's price. As we all know Lag is very undesirable because a trading system. Late trades can many times be worse than no trades at all, Main aim of the System is to find optimal Entry and Exit points for a successful trade
Mathematics behind the indicator
The indicator use two fundamentals pillars :
Estimation of a Confidence Interval
In frequentist statistics, a confidence interval (CI) is a range of estimates for an unknown parameter. A confidence interval is computed at a designated confidence level; the 95% confidence level is most common, but other levels, such as 90% or 99%, are sometimes used.
Desired properties are Validity, Optimality and Invariance
Polynomial Filters
The polynomial filters are based on the orthogonal polynomials of Legendre and Laguerre. Orthogonal polynomials are widely used in applied mathematics, physics and engineering, and the Legendre and Laguerre polynomials are only two of infinitely many sets, each of which has its own weight function.
They can be characterized in three equivalent ways:
1. They are the optimal lowpass filters that minimize the NRR, subject to additional constraints than the DC unity-gain condition
2. They are the optimal filters that minimize the NRR whose frequency response H(ω) satisfies certain flatness constraints at DC
3. They are the filters that optimally fit, in a least-squares sense, a set of data points to polynomials of different degrees.
The System uses Predictive Differentiation Filters, as subset to Polynomial Filters
Components of the System
Buy Signal and Sell Signals
=====================
=====================------ HOW TO USE IT
=====================
ENTRY and EXITS
Momentum Bands
Confidence Levels
Indicator Properties
Provision For Alerts
1. Buy Signal Alert
2. Sell Signal Alert
3. Exit Alert if in Buy Trade
4. Exit Alert if in Sell Trade
Some Examples
What TimeFrames To Use
U can use any Timeframe, The indicator is Adaptive in Nature,
I personally use timeframes such as : 1m, 5m 10m, 15m, ..... 1D, 1W
How to Access
U will need to privately message me.
use comment box for constructive comments
Thanks
Relative Andean ScalpingThis is an experimental signal providing script for scalper that uses 2 of open source indicators.
First one provides the signals for us called Andean Oscillator by @alexgrover . We use it to create long signals when bull line crosses over signal line while being above the bear line. And reverse is true for shorts where bear line crosses over signal line while being above bull line.
Second one is used for filtering out low volatility areas thanks to great idea by @HeWhoMustNotBeNamed called Relative Bandwidth Filter . We use it to filter out signals and create signals only when the Relative Bandwith Line below middle line.
The default values for both indicators changed a bit, especially used linreg values to create relatively better signals. These can be changed in settings. Please be aware that i did not do extensive testing with this indicator in different market conditions so it should be used with caution.

Venky's Scalping Signals This indicator developed specifically for the use of scalping trading.
This is combination of Most powerful indicators available in the market
1. Central Pivot Range
2. Moving Average
3. Average True Range
All the above indicators are available independently, but as per my experience combination of all these will be very good support for scalping.
How to trade this setup.
Moving Average: Look for only Long trades when market is above 200 EMA and vice versa.
4 Types of EMA can be added, Standard values kept as 8, 20, 50 & 200 for identifying scalping entry
Enjoy the ride till price does not close below/upper of EMA 8.
20 EMA can be used in trending market to re-enter a trade when price takes support or rejection from 20 EMA near an important pivot zone.
Central Pivot Range: This will indicate the immediate support and resistance zones, and we can fix our entry and exit accordingly.
Available timeframes (change in inputs tab): Daily-D, Weekly -W, Monthly -M
Change from Standard Pivots / Camarilla Pivots is possible
Tomorrow pivot is added to give a framework to plan trades to carry over for the next day.
Average True Range: This indicates the market direction and look for Long trades while the market is trading above ATR curve.
if there is a signal at important Pivot points, it can prove to be a high probability trade.
For best results and trending move, if all the signals are in the same direction, it will have a most trending move on the day.
This indicator works on all time frame, but be sure that all the 3 signals are in the same direction before entering the trade.
For Long Entry
Best Time Frame = 4 Mins
ATR Line should be Green
Price to be above ATR Line
Market should be above 200 & 50 Moving Average (If from bottom 200, 50, 20 & 8 then it will excellent most probable profitable entry)
Buy signals (Yellow Up arrow mark) appears, Immediately enter the market, or you can wait for candle close.
Exit when Exit signal (Yellow Down Arrow mark).
Stop Loss - Normally entry candle low, and you can trail stop loss for every next candle low.
For short Entry
Best Time Frame = 4 Mins
ATR Line Should be Red
Price to be below ATR Line
Market should be below 200 & 50 Moving Average (If From Top 200, 50, 20 & 8 then it will excellent most probable profitable entry)
Sell Signals (Yellow Down Arrow Mark) appears, Immediately enter the market, or you can wait for candle close.
Exit when Exit signal (Yellow Up Arrow Mark).
Stop Loss - Normally entry candle low, and you can trail stop loss for every next candle low.
Trading psychology is important, if market above 200 Moving average, look for only Long Trades.
If market below 200 Moving average, look for only Short Trades.

Forex Fractal EMA ScalperThis is a forex scalper designed for very short timeframes 1-5 min max.
At the same time due to the short timeframe, is recommend to re optimize it weekly .
Its components are
Fractals
Triple EMA with different lengths
Rules for entry:
For long : we have an up fractal and all 3 ema are in ascending order
For short: we have a down fractal and all 3 ema are in descending order.
Rules for exit
We exit when we either get a reverse order or when we hit the take profit or stop loss calculated in fixed pips.

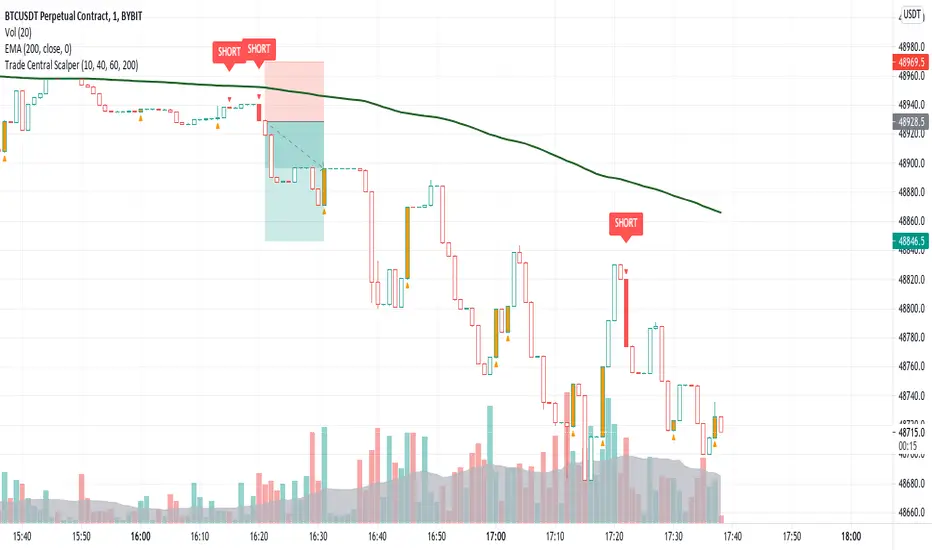
Trade Central ScalperTrade Central Scalper is a scalping signal indicator based on trend and strength of the move using EMA and RSI. It determines the short term trend using EMA and strength of move using RSI. Price above set EMA allows only long trades and price below set EMA allows only short trades. Increasing RSI values from lower levels as defined in settings combined with trend as per EMA triggers the signal.
Indicator shows bars in 4 colors - Green, Red, Orange and White. Signal candles, i.e. long and short, are green and red respectively. Orange candles with opposite signal (triangle up/down) are potential reversal points where exiting from current position is recommended. Rest of the candles are white and no action is needed when candles are white.
Trading using the script is simple - you enter a long trade on a green bar and enter a short trade on red bar. Detailed rules for trade execution are mentioned below.
Trading Rules
Recommended Timeframe: 1 minute
Go LONG after a green bar when signal candle high is broken. For example, on BTC chart if signal candle (green) high is 50000 then enter at least 3-5 points above it, i.e. 50003. If the signal candle high isn't broken then wait for that to happen, but signal/trade gets invalidated if the signal candle low is broken before signal candle high is broken .
Go SHORT after a red bar when signal candle low is broken. For example, on BTC chart if signal candle (red) low is 50000 then enter at least 3-5 points below it, i.e. 49997. If the signal candle low isn't broken then wait for that to happen, but signal/trade gets invalidated if the signal candle high is broken before signal candle low is broken .
Set the SL below previous swing low for long entry. SL above previous swing high for short entry. If the SL is too big then avoid the trade and ensure risk reward is favorable, i.e. minimum 1:2 is recommended.
Once you're in a trade and you encounter an orange bar with opposite triangle sign then exit the current position else let the trade hit either defined target or SL.
Default settings work best on 1 minute timeframe and has been tested on BTC and ETH, though it works well on forex as well. You can try our different EMA and RSI values for other timeframes. Backtesting for 1 week (all signals between 16th August 2021 and 22nd August 2021 on 1 minute timeframe) on BTC, indicator gave 68% win ratio. There were around 205 trades in the week. Will share details over a YouTube video.
Will strongly recommend paper trading in desired market/asset before executing live trades.
GODXBT Scalper 15minGodxbt scalper is specifically designed for short term trades on 15min timeframe
This indicator is based on price action
What this indicator includes:
1) BULL,BEAR signals based on price action
2) 3 EMA(exponential moving average) for the market trend/direction .
3) take profits points ( based on oscillators ) shows overbought and oversold conditions.
How to trade :
This indicator works on 15min timeframe the parameters for the indicator is locked for 15min timeframe
***Important: Signal confirms on bar close
1) “BULL” signal shows buying opportunity
Buys are more profitable than sells if EMA ribbon is blue which means bullish trend (buyers are in control)
2) “BEAR” signal shows selling opportunity
Sells are more profitable when EMA ribbon is red which means bearish trend (sellers are in control)
3) TP+ and TP- appears below and above candles it shows the potential reversal points for the price action
There you should take some profits off the trade
Ema ribbon shows market trend
Default ema inputs are set on 20 and 50 (you can add your own sets of ema by changing the input )
Blue ribbon is bullish trend which also acts as a support
Red ribbon is bearish trend which also acts as a resistance
You can use ribbon to add stoploss below and above the ribbon
222 EMA for strong support and resistance
DM for the access

Cyatophilum Scalper [ALERTSETUP]This indicator comes with a backtest and alert version. This is the alert version. Its purpose is to create low timeframe and scalping strategies, by choosing from a list of built-in entry points which are described in detail below, and by configuring a risk management system to your liking.
Before diving into the entry points, I will explain the strategy and risk management settings.
These 3 settings allow to choose your strategy direction, and main behavior.
- Go Long ↗: activate or deactivate long entry points.
- Go Short ↘: activate or deactivate short entry points.
- Reversal strategy ↗↘↗↘: Activate this option will allow trades to reverse position from an opposite entry point. Keep it deactivated and trades will either wait a TakeProfit(TP) or StopLoss(SL) to be closed. When neither SL nor TP or set, this option is automatically activated.
StopLoss settings:
Both Long and Short SL can be activated and configured.
The base % price is the starting point of the stoploss, in a percentage of current price.
Trailing stop, when activated, works with 2 settings:
- % Price to Trigger: a percentage of current price the price should move in a bar to trigger a trailing movement.
- % Price Movement: the stoploss variation in a percentage of current price that moves on each bar.
TakeProfit settings:
Both Long and Short TP can be activated and configured.
The base % price is the value of the TP, in a percentage of current price.
Trailing Profit Deviation %: Percent deviation for the trailing take profit.
DCA:
DCA stands for Dollar Cost Average. The idea is to open additional orders from the base order so as to improve risk management.
These additional orders are also called Safety Orders. The indicator can handle up to 9 safety orders.
The strategy will exit either from a take profit based on percentage from base order or from a total volume percentage (Configurable in the parameters).
The steps spacing (space between each step) and safety orders volume (order size) can both scale by adding a scale multiplier.
By choosing from the base strategy dropdown menu, the indicator will generate entry points.
1. BUY SELL:
-> Low timeframes spot trading, with simple buy and sell orders.
How it works:
The indicator used is a combination of QQE (Atr based trend following indicator) and RMA 100 trendline.
I think the QQE does a great job in low timeframes because it is not impacted by the noise.
The RMA which is the moving average used in the RSI, will help giving confirmation to the entry points.
How to use:
It is meant to be used as a reversal strategy, but you can add a TP or SL if you want.
When comparing to Buy & Hold, make sure to deactivate the "Short results in the backtest" setting.
2. TREND SCALPING
-> A strategy for low timeframes trading.
How it works:
The strategy creates high volatility entries filtered by a duo convergence of adaptive trendlines (Adaptive HULL MA using the chart's resolution, Adaptive Tilson T3 using 1H resolution) and a higher timeframe (1H) RSI filter (long threshold: 70, short threshold: 40, RSI length: 10).
How to use:
Must be used on charts with a resolution smaller than 1H. Recommended: from 1m to 30m.
Must NOT be used as reversal strategy. Use it with a take profit and stop loss, and DCA if you can.
Sample risk management settings:
3. Support/Resistance BREAKOUTS
-> Trade low timeframes pivot points breakouts.
How it works:
The indicator calculates the 100 previous bars swing high and low. Any break above high or below low will trigger an entry point.
The entry is however filtered by an Adaptive Tilson T3 Trendline, an ADX 30 minimum threshold and a minimum average volume threshold.
How to use:
I recommend to click "Reversal" Strategy and set a Takeprofit target.
Find the best timeframe between 1m and 30m using the backtest version.
Example here with BTCUSDTPERP on 15m:
4. AGGRESSIVE SCALPING
-> Lots of trades in low timeframes.
How it works:
Created using Cyato AI, Higher/Lower Highs and Lows and 2 HULLMA crosses as entries, and 2 Adaptive Tilson T3 as trendfilter, a 25 ADX threshold filter and a volume filter.
How to use:
Recommended Risk Management settings: Takeprofit, Stoploss and DCA (Safety orders).
Find which timeframe work the best from 30 min and below. Should not be used above 30 min since this is the resolution for the MTF Tilson.
How to create Alerts:
Click Add alert, then select the indicator, and choose the alert for your order.
Most used alerts are "LONG ENTRY", "SHORT ENTRY" and "ALL EXITS".
You will find a description of each alert in the default alert message.
To gain access to this paid indicator, please use the link below.

Cyatophilum Scalper [BACKTEST]This indicator comes with a backtest and alert version. This is the backtest version. Its purpose is to create low timeframe and scalping strategies, by choosing from a list of built-in entry points which are described in detail below, and by configuring a risk management system to your liking.
Before diving into the entry points, I will explain the strategy and risk management settings.
These 3 settings allow to choose your strategy direction, and main behavior.
- Go Long ↗: activate or deactivate long entry points.
- Go Short ↘: activate or deactivate short entry points.
- Reversal strategy ↗↘↗↘: Activate this option will allow trades to reverse position from an opposite entry point. Keep it deactivated and trades will either wait a TakeProfit(TP) or StopLoss(SL) to be closed. When neither SL nor TP or set, this option is automatically activated.
StopLoss settings:
Both Long and Short SL can be activated and configured.
The base % price is the starting point of the stoploss, in a percentage of current price.
Trailing stop, when activated, works with 2 settings:
- % Price to Trigger: a percentage of current price the price should move in a bar to trigger a trailing movement.
- % Price Movement: the stoploss variation in a percentage of current price that moves on each bar.
TakeProfit settings:
Both Long and Short TP can be activated and configured.
The base % price is the value of the TP, in a percentage of current price.
Trailing Profit Deviation %: Percent deviation for the trailing take profit.
DCA:
DCA stands for Dollar Cost Average. The idea is to open additional orders from the base order so as to improve risk management.
These additional orders are also called Safety Orders. The indicator can handle up to 9 safety orders.
The strategy will exit either from a take profit based on percentage from base order or from a total volume percentage (Configurable in the parameters).
The steps spacing (space between each step) and safety orders volume (order size) can both scale by adding a scale multiplier.
By choosing from the base strategy dropdown menu, the indicator will generate entry points.
1. BUY SELL:
-> Low timeframes spot trading, with simple buy and sell orders.
How it works:
The indicator used is a combination of QQE (Atr based trend following indicator) and RMA 100 trendline.
I think the QQE does a great job in low timeframes because it is not impacted by the noise.
The RMA which is the moving average used in the RSI, will help giving confirmation to the entry points.
How to use:
It is meant to be used as a reversal strategy, but you can add a TP or SL if you want.
When comparing to Buy & Hold, make sure to deactivate the "Short results in the backtest" setting.
2. TREND SCALPING
-> A strategy for low timeframes trading.
How it works:
The strategy creates high volatility entries filtered by a duo convergence of adaptive trendlines (Adaptive HULL MA using the chart's resolution, Adaptive Tilson T3 using 1H resolution) and a higher timeframe (1H) RSI filter (long threshold: 70, short threshold: 40, RSI length: 10).
How to use:
Must be used on charts with a resolution smaller than 1H. Recommended: from 1m to 30m.
Must NOT be used as reversal strategy. Use it with a take profit and stop loss, and DCA if you can.
Sample risk management settings:
3. Support/Resistance BREAKOUTS
-> Trade low timeframes pivot points breakouts.
How it works:
The indicator calculates the 100 previous bars swing high and low. Any break above high or below low will trigger an entry point.
The entry is however filtered by an Adaptive Tilson T3 Trendline, an ADX 30 minimum threshold and a minimum average volume threshold.
How to use:
I recommend to click "Reversal" Strategy and set a Takeprofit target.
Find the best timeframe between 1m and 30m using the backtest version.
Example here with BTCUSDTPERP on 15m:
4. AGGRESSIVE SCALPING
-> Lots of trades in low timeframes.
How it works:
Created using Cyato AI, Higher/Lower Highs and Lows and 2 HULLMA crosses as entries, and 2 Adaptive Tilson T3 as trendfilter, a 25 ADX threshold filter and a volume filter.
How to use:
Recommended Risk Management settings: Takeprofit, Stoploss and DCA (Safety orders).
Find which timeframe work the best from 30 min and below. Should not be used above 30 min since this is the resolution for the MTF Tilson.
How to create Strategy Alerts:
Write your alert messages for EXIT, LONG and SHORT orders in the settings (Backtest section).
Then click add alert, and in the alert message, write the following:
{{strategy.order.alert_message}}
BACKTEST PARAMETERS
- Inital capital: 10 000$
- Base order size: 0.1 contract (0.1 btc)
- Safety order size: 0.1 contract (0.1 btc)
- Commission: 0.1%
- Slippage: 100 ticks
Oldest trade: 2020-08-31
Backtest Period: From 2020-08-31 to 2020-11-12
Configuration used: see the live chart configuration panel at the top.
To gain access to this paid indicator, please use the link below.

cosmic scalperCosmic Scalper is an intuitive & exotic trading engine, designed to Identify Trend, visually highlight our “Zone of Interest” & plot entry lines at its base, like a barcode, providing critical information to the trader’s mind in a clean, elegant way without cluttering the chart.
Components Of Script :
1. Trend Support Cloud : Based on Fibonacci ratio, the cloud has 3 layers or bands.
2. Entry Engine : The last band of the cloud gets highlighted when we enter “Zone of Interest” & vertical lines appear indicating possible entry points. Together this forms a trend fingerprint.
Mechanism Of Action :
1. Identify trend : The script observers multiple parameters on higher timeframes to identify trend & plots the fibonacci based 3 layer trend support cloud. The script will indicate a change of trend when the last band is breached & sustained.
2. Zone Of Interest : Once a trend is identified, we are looking for entries. But we wait for the other side to get exhausted first. When exhaustion is identified, the last band of the cloud gets highlighted. This “exhaustion” is measured using bespoke datasets created within the protocol. Conventional datasets like RSI, VWAP, MACD etc are only used as secondary or tertiary layer of information.
3. Entries : Once we have entered the highlighted ‘Zone of Interest’ the script will offer entry points represented by vertical lines in the last band, this Highlight + Vertical Lines together forms the trend fingerprint, giving traders crucial visual information to make informed decisions.
How to use :
1. Make a Higher Timeframe Analysis, 4hr, 6hr or Daily timeframe. Use TA or Bollinger Bands.
2. Once you have an informed bias, switch to the Cosmic Scalper on 1min timeframe to take position.
3. Target, Stop, Leverage : at user discretion
Have Questions? Feel free to PM me on TradingView

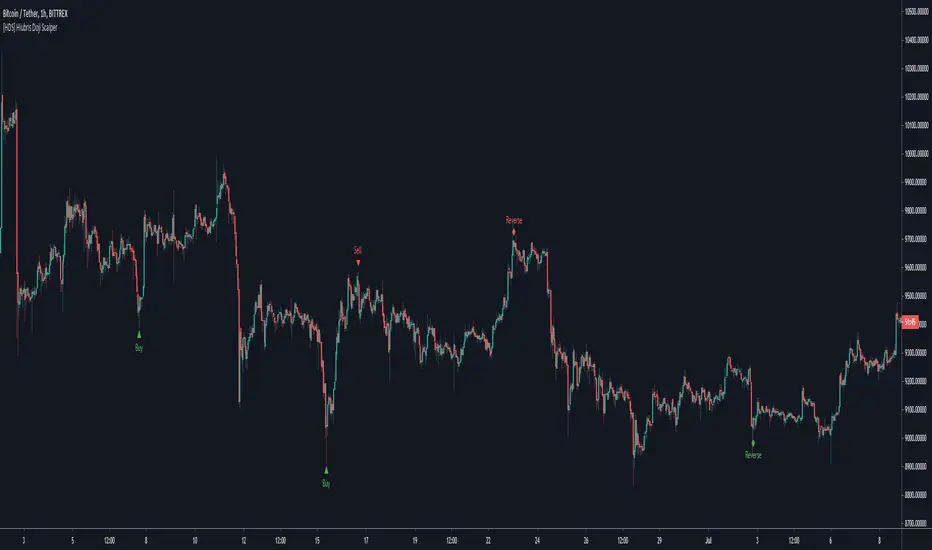
[HDS] Hiubris Doji ScalperThis is a simple Scalping Strategy based on custom Candle Patterns
The script mainly identifies reversal patterns and signals them on the chart.
All chart signals can be setup as live alerts !
It works well on literarly any Pair/Timeframe
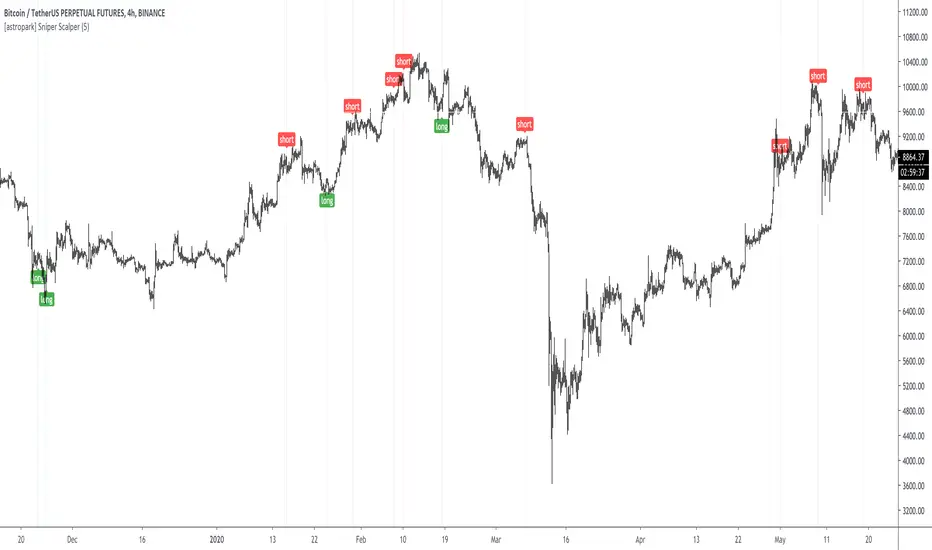
[astropark] Sniper ScalperDear Followers,
today a new Scalper Tool , which works great on all timeframes , from 1 minute to 1 month!
Keep in mind that this is a Scalper, so it's always a good idea to take or lock your profits, despite you may use it also for swing trading.
This tool has some cool features:
it works on all timeframes , from 1 minute to 1 month!
you can change a filter option from 1 (lowest) to 7 (highest)
Here some examples on how it performs on many timeframes and charts.
EURUSD 15m chart
AMZN 1h chart
Bitmex XBTUSD 4h chart
Bitfinex ETHUSD 1h chart
Binance Chainlink LINKBTC 1h chart
Binance Ethereum ETHBTC 1h chart
GOLD XAUUSD 15m chart
The user who wants to use this strategy, especially via an automated bot, must always manage to set a take profit and stoploss, as well as use a proper money and risk management strategies .
This is not the "Holy Grail", so use it with caution.
This is a premium indicator , so send me a private message in order to get access to this script.
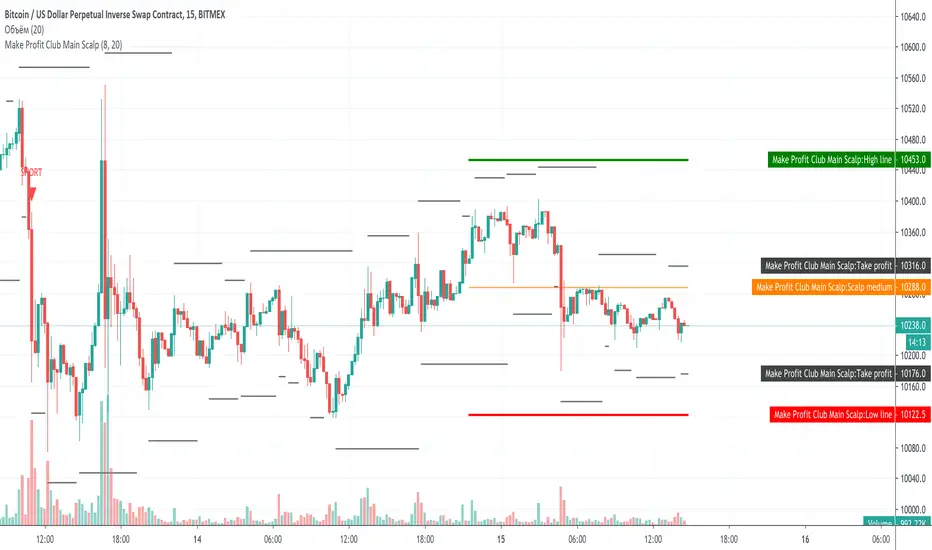
Make Profit Club Main ScalpThe main scalping indicator.
We use this indicator to trade for a short time in a TF of 5-15 minutes.
We have created takeprofit zones for you so that you can understand where we can get to and take your profit. these points are mostly very helpful.
There are basic settings that allow you to adjust the indicator individually for each situation; because of this, this indicator can be used for any exchange and any currency pair.
For Scalp trading, we use 3 different strategies available to our clients. If you enter them correctly, you can never see the minus sign.
Use the link below to obtain access to this indicator.
Genesis 20/200 Trend ScalperThis is a 20 / 200 SMa trend scalper, works on all time frames to Identify Trend and short/long scalp opportunities. The Indicator is very simple and it includes the following
20 SMA
100 SMA
200 SMA
when the 20 SMA is green and above the 200 SMA go long...When the 20 SMA is red and below the 200 SMA then short.

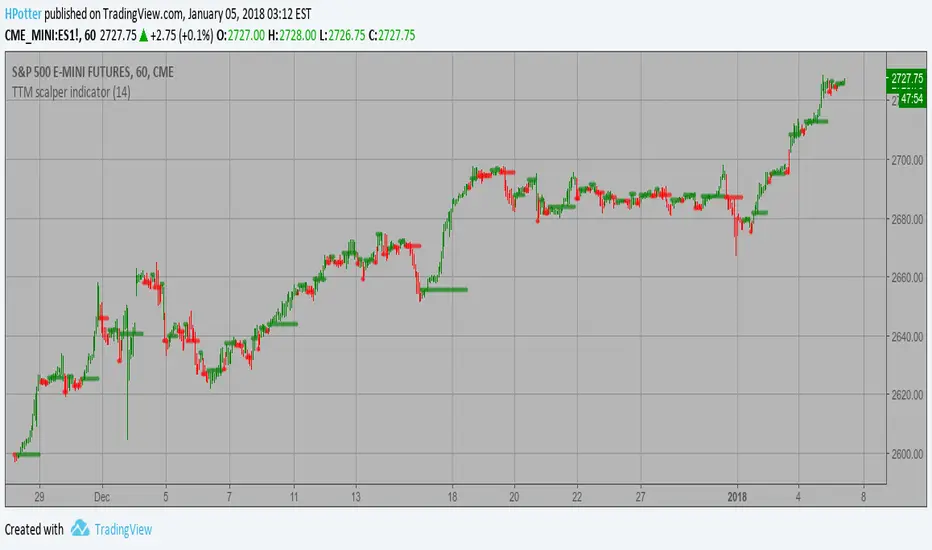
TTM scalper indicator Strategy TTM scalper indicator of John Carter’s Scalper Buys and Sells. The methodology
is a close approximation of the one described in his book Mastering the Trade.
The book is highly recommended. Note the squares are not real-time but will
show up once the third bar has confirmed a reversal.
WARNING:
- This script to change bars colors.
TonyUX EMA Scalper - Buy / SellThis is a simple scalping strategy that works for all time frames... I have only tested it on FOREX
It works by checking if the price is currently in an uptrend and if it crosses the 20 EMA.
If it crosses the 20 EMA and its in and uptrend it will post a BUY SIGNAL.
If it crosses the 20 EMA and its in and down it will post a SELL SIGNAL.
The red line is the highest close of the previous 8 bars --- This is resistance
The green line is the lowest close of the previous 8 bars -- This is support

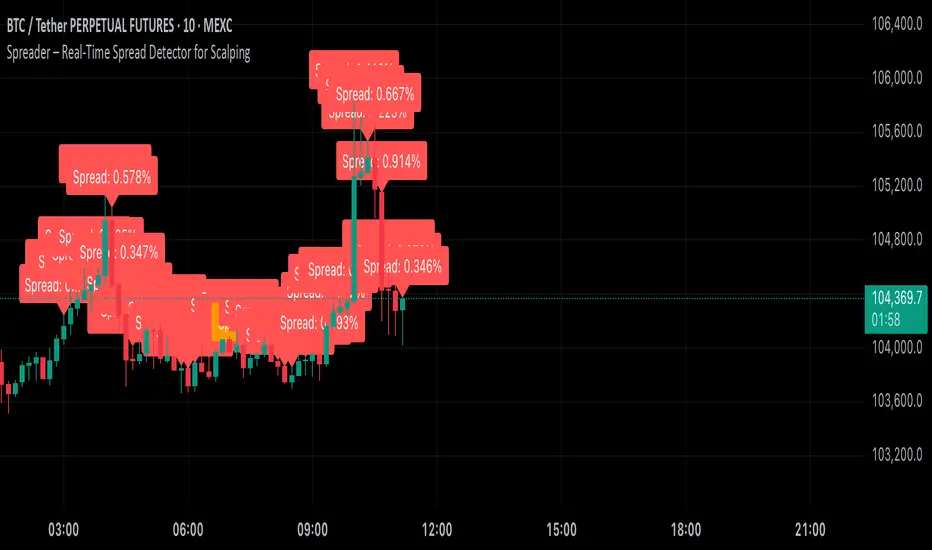
Spreader – Real-Time Spread Detector for ScalpingSpreader is a professional tool built for scalpers and intraday traders, designed to visually display live bid-ask spread on your chart. By showing you the true market friction in real time, it helps you avoid poor entries and reduce immediate trade losses.