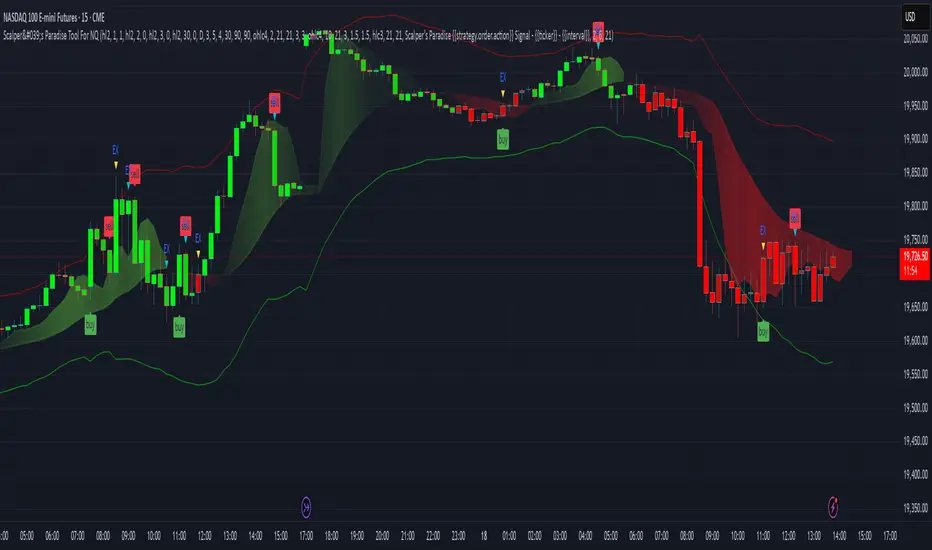
Scalper's Paradise Tool For NQThis powerful scalping tool was specifically designed for NQ and MNQ. Scalper's Paradise adds buy and sell signals to the chart using a proprietary blend of confluence trading principals that are incredibly accurate. Many of the settings can be customized for uses on higher time-frames and different markets. Along with the buy and sell signals, this indicator offers weakness signaling (seen as dots on the chart), along with potential exit points marked as 'EX' on the chart over a diamond shape.
How To Use:
This indicator is designed for intra-day scalping. When a buy or sell signal is marked on the chart, it's safe to enter a position. Exit the position when you see weakness in the trend or where the EX (exits) are marked.
The Trend Cloud offers great visibility for trend strength and overall volatility and can be used in conjunction with the entries and exits for added confidence that your trade is a worthwhile trade.
The red and green backgrounds on the chart are a filtering tool designed to save you from trades that otherwise don't carry enough momentum to be worth entering the market. This part of the indicator has 3 major adjustable settings that allow you to truly dial in your risk.
Identify momentum areas and trade with confidence using Scalper's Paradise!
Trend Cloud for momentum and confidence
Buy and Sell Signals
Marked Exits and Trend Weakness dots on the chart
ADX Based Clean Trade Filter allows for full customization of your trading risk profile. This part of the indicator will SUPPRESS any and all signals while the chart's background is red.
The Safer Trades Filtering in the settings allows further confidence by suppressing riskier trade signals
Limitations:
This script does not mark reversals. It will only identify safe trade zones during periods of strong momentum.
Disclaimer:
The information contained in my scripts/indicators/ideas does not constitute financial advice or a solicitation to buy or sell any securities of any type. I will not accept liability for any loss or damage, including without limitation any loss of profit, which may arise directly or indirectly from the use of or reliance on such information.
All investments involve risk, and the past performance of a security, industry, sector, market, financial product, trading strategy, or individual’s trading does not guarantee future results or returns. Investors are fully responsible for any investment decisions they make. Such decisions should be based solely on an evaluation of their financial circumstances, investment objectives, risk tolerance, and liquidity needs.
My scripts/indicators/strategies/ideas are only for educational purposes!
Search in scripts for "scalping"
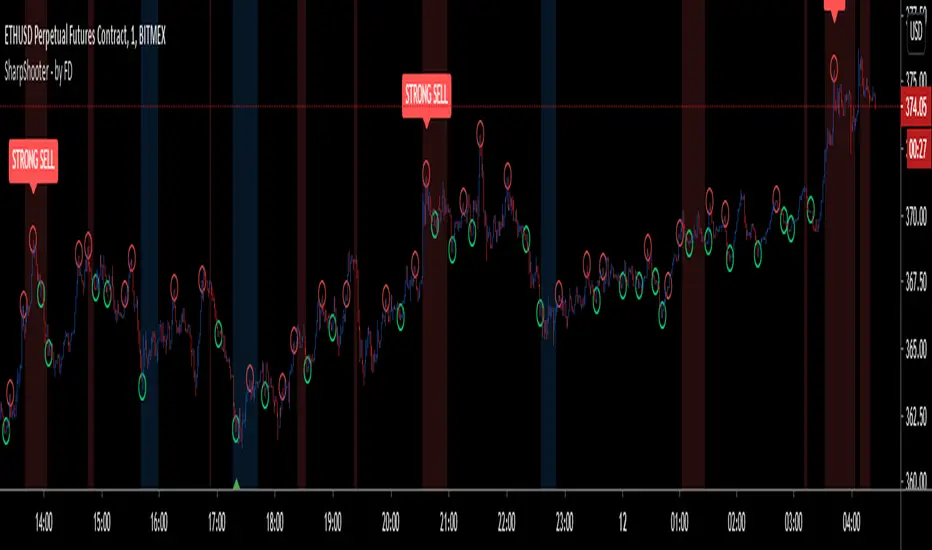
Sharp Shooter - by FiatDropoutThis is an experimental script and is intended to be used only on LTF charts for scalping. It may or may not be useful on other charts and time frame, but that is subject to back testing.
Now, coming back to this script. It has multiple features yet i tried to keep it as clean in representation as possible.
As obvious, few things are easily recognizable on chart, such as:
BUY - Go LONG
STRONG BUY - Heavy Uptrend is expected, Go LONG
SELL - Go SHORT
STRONG SHORT - Heavy Downtrend is expected, Go SHORT.
on addition to above signals, there are few other plot-shapes, which are:
Red Circle - Acts as TP for LONG during uptrend and acts as Add-On SHORT during downtrend
Green Circle - Acts as TP for SHORT during downtrend and acts as Add-on LONG during uptrend.
Red Background - Bearish Peak, potential start of downtrend
Blue Background - Bullish Peak, potential start of uptrend
------------------------------------------------------------------------------------------------------------------------------------------------------------------------------------
Now that plots are over, lets go to how to use them. As name of this script suggests, it intends to find most optimal entry and exit for long and short while taking profit on the way and adding to the position until trend changes.
Be aware that trend here is very much based on current time-frame and does not represent other time-frame's bias. Also, trend here is intended to be used as a scalp trend and not a swing trend.
Now once, you get a signal for BUY(example), then wait for "Bullish Peak"(blue background) to appear with either "STRONG BUY" or just "BUY" and take an entry at respective price, next look for "red circle" which acts as TP for long(refer sec, above) and either move stop to entry, or take partial profits or close position entirely.
Now every subsequent "green circle" will act as add-on for long and every "red circle" will act as TP for long, until "Bearish Peak" appears, which will reverse the order of how circles are used and direction of the trade. Now during "Bearish Peak" and until "Bullish Peak" appears, "red circle" will act as add-on for short and "green circle" will act as TP for short.
It might take some time to adjust to the plots, but i have decided to keep it that way in order to keep chart clean of too many signals.
------------------------------------------------------------------------------------------------------------------------------------------------------------------------------------
NOTE : Please use stops and be sure to place orders quickly as prices move faster on minute charts and you should be able to place orders and stop right away, so if you are new to trading and are currently in early stage of the business, scalping is strongly not advised, let alone this indicator. Also, past performance are not guarantee of future results and most importantly, this indicator does not repaint. By using this indicator, you accept that i am not responsible for any losses or gains made by user by trading with help of this bot.
Also, in next update, i will fix some bug, add some SS and also add alerts. Alerts are not being added currently because of high volatile nature of the bot signals which if tried on automation can give varied results. Once everything is set, i shall add alerts.
for any other queries, feel free to get back here on chat or DM.
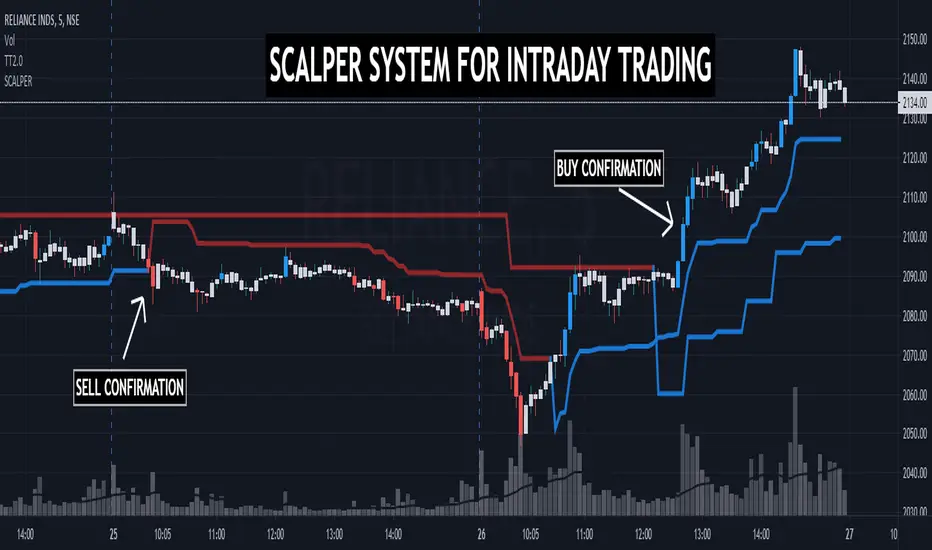
TRADINGEDGE ACADEMY'S INTRADAY SCALPING SYSTEMTE SCALPER has been designed to assist the traders during the live market hours in their decision making process. Along with Multitimeframe Trend Analyzer, this system supports the traders to quickly decide ENTRY & EXIT prices while SCALPING.
TimeFrame: Works best in 3mins & 5mins TF.
How to take entry:
1. Conifrm Trend using Multitimeframe Trend Analyzer.
BLUE - BULLISH
RED - BEARISH
2. FOR BULLISH ENTRY
1st BLUE candle shows probable BUYING ENTRY. 2nd BLUE candle closing above the 1st BLUE candle gives CONFIRMATION.
After CONFIRMATION, BUY at candle's HIGH with last wave's LOW as SL for TARGET R:R - 1:1.
REMEMBER, THIS IS A SCALPING TOOL. KEEP BOOKING PROFITS.
3. FOR BEARISH ENTRY - Folow the same rules.
NOTE - For DEMO & ACCESS, contact me.

CryptoScalper: NightMODE by BiO-618Hey guys!
It's me with a new version of the script.
Since a lot of people wanted to use it for scalping, I adjusted it for that.
More buy signals, more sell signals, 90% accuracy (at least ;) )
Remember to use the pivots to set Take Profits and Stop Losses, no software is 100% accurate, otherwise the market would trash it.
SELL SIGNALS
Red "S": Sell signal
Yellow "Sell": Strong+ sell signal
Orange "SELL": Strong++ sell signal. Shortable signal.
Red triangledown "SELL!": Strongest+++ sell signal, bearish divergences from MACD . Shortable signal.
BUY SIGNALS
Yellow triangleup "Weakening": Bear trend is getting weak, as the asset is getting oversold.
Green "BUY!": Strong buy, bullish divergence from MACD . Strongest buy signal.
Remember, again, to ALWAYS set your TP and SL beforehand. The key to be profitable is to act before the market acts.
It's better 3% in hand than 1% below your initial balance.
From a manual backtesting, I got a 53% profit on 2 weeks, trust my advice to manage the risk and you will be profitable aswell ;)
Check my other scripts to get more options :)
I also made a 4Hours and 12Hours optimized scripts, you might found that which one works better for your strategy, asset, and timeframe.

Spacer - SRThis script spaces prices between charts while scalping
They can be used as potential support and resistance
Prices are spaced with odd numbers only 1,3,5,7,9
Enjoy the script

PeBAS €$ Scalper 5m ALERT VersionHere is the EurDollar ScalpingScript for Alerts.
Have fun and the sun in your heart!

GB · Set upUp & Confirmation (Lower Pane)The GB Set-Up & Confirmation Indicator transforms raw momentum into a clear, color-coded decision framework for intraday scalping.
It’s the heartbeat monitor of 0DTE trading — revealing when momentum quietly shifts and when it explodes into confirmation.
Milliseconds Ahead: Confirm-on-Prior mode mimics predictive confirmation, letting traders catch reversals before the lag candle.
Noise-Adaptive: Near-zero band filtering reduces false breaks from micro volatility.
Visual Precision: Dual markers and labeled confirmations remove hesitation in execution.
Configurable Latency: Sensitivity presets + fine-tune ensure adaptability from SPX 1-min charts to QQQ 5-min momentum waves.
Platform: Designed for lower-pane deployment beneath the main price chart.
Primary Use: Time-sensitive momentum confirmation for 0DTE SPX/SPY/QQQ scalps.
Typical Workflow:
Wait for Early (Set-Up) triangle near the zero band → signals momentum shift.
Enter on the Confirmed triangle (or one candle prior if using “Confirm on Prior”).
Exit when opposite signal fires or wave color fades (momentum exhaustion).
Complementary Indicators: Pairs seamlessly with GB TMA Overlay, GB ORB Shading, or Phoenix Fire Confluence for full-stack entry validation.
Adaptive Sensitivity Presets
- Aggressive: reacts early to momentum pulses (scalp mode).
- Balanced: optimized for intraday consistency.
- Strict: waits for full trend maturity (swing mode).

Options Scalping Banknifty ContributionThis Indicator is Owned by Team Option Scalping.
This Indicator tell us about the contribution of constituents in BANKNIFTY
BANKNIFTY is an index in National Stock Exchange (NSE) which holds banking stocks.
More than 15 stocks contribute in Banknifty Index in different % ( Based on there valuation )
We took top 12 Stocks and there contribution points in table.
We can see Banknifty points at the Top and stocks contribution below that.
And if you sum it up all stocks contribution then it will be equal to Banknifty points.
This keeps on changing on real time. And rows automatically sorts based on Constituents points
Like if SBIN is contributing the most for BANKNIFTY then it will be at top
And If any other stock is contribution the least ( in negative ) then it will be at the bottom of the table.
Color coding is Algo give , if green then stocks has contributed on positive points
If red then stock has contributed on negative points
Indicator has input of placing the table on different position on screen
Other than that no input parameters are there.
List of stocks and there contribution are controlled by us only.

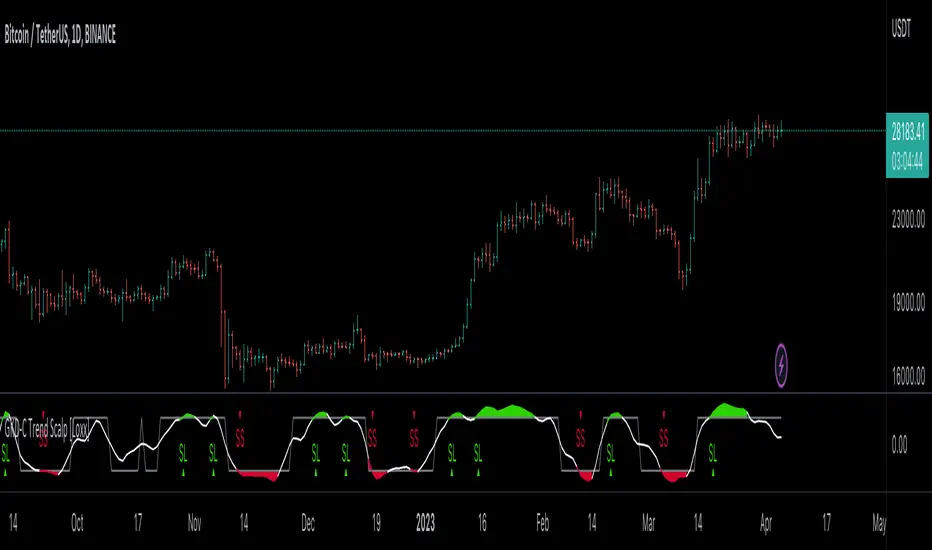
GKD-C Trend Scalp [Loxx]Giga Kaleidoscope GKD-C Trend Scalp is a Confirmation module included in Loxx's "Giga Kaleidoscope Modularized Trading System".
█ Giga Kaleidoscope Modularized Trading System
What is Loxx's "Giga Kaleidoscope Modularized Trading System"?
The Giga Kaleidoscope Modularized Trading System is a trading system built on the philosophy of the NNFX (No Nonsense Forex) algorithmic trading.
What is the NNFX algorithmic trading strategy?
The NNFX (No-Nonsense Forex) trading system is a comprehensive approach to Forex trading that is designed to simplify the process and remove the confusion and complexity that often surrounds trading. The system was developed by a Forex trader who goes by the pseudonym "VP" and has gained a significant following in the Forex community.
The NNFX trading system is based on a set of rules and guidelines that help traders make objective and informed decisions. These rules cover all aspects of trading, including market analysis, trade entry, stop loss placement, and trade management.
Here are the main components of the NNFX trading system:
1. Trading Philosophy: The NNFX trading system is based on the idea that successful trading requires a comprehensive understanding of the market, objective analysis, and strict risk management. The system aims to remove subjective elements from trading and focuses on objective rules and guidelines.
2. Technical Analysis: The NNFX trading system relies heavily on technical analysis and uses a range of indicators to identify high-probability trading opportunities. The system uses a combination of trend-following and mean-reverting strategies to identify trades.
3. Market Structure: The NNFX trading system emphasizes the importance of understanding the market structure, including price action, support and resistance levels, and market cycles. The system uses a range of tools to identify the market structure, including trend lines, channels, and moving averages.
4. Trade Entry: The NNFX trading system has strict rules for trade entry. The system uses a combination of technical indicators to identify high-probability trades, and traders must meet specific criteria to enter a trade.
5. Stop Loss Placement: The NNFX trading system places a significant emphasis on risk management and requires traders to place a stop loss order on every trade. The system uses a combination of technical analysis and market structure to determine the appropriate stop loss level.
6. Trade Management: The NNFX trading system has specific rules for managing open trades. The system aims to minimize risk and maximize profit by using a combination of trailing stops, take profit levels, and position sizing.
Overall, the NNFX trading system is designed to be a straightforward and easy-to-follow approach to Forex trading that can be applied by traders of all skill levels.
Core components of an NNFX algorithmic trading strategy
The NNFX algorithm is built on the principles of trend, momentum, and volatility. There are six core components in the NNFX trading algorithm:
1. Volatility - price volatility; e.g., Average True Range, True Range Double, Close-to-Close, etc.
2. Baseline - a moving average to identify price trend
3. Confirmation 1 - a technical indicator used to identify trends
4. Confirmation 2 - a technical indicator used to identify trends
5. Continuation - a technical indicator used to identify trends
6. Volatility/Volume - a technical indicator used to identify volatility/volume breakouts/breakdown
7. Exit - a technical indicator used to determine when a trend is exhausted
What is Volatility in the NNFX trading system?
In the NNFX (No Nonsense Forex) trading system, ATR (Average True Range) is typically used to measure the volatility of an asset. It is used as a part of the system to help determine the appropriate stop loss and take profit levels for a trade. ATR is calculated by taking the average of the true range values over a specified period.
True range is calculated as the maximum of the following values:
-Current high minus the current low
-Absolute value of the current high minus the previous close
-Absolute value of the current low minus the previous close
ATR is a dynamic indicator that changes with changes in volatility. As volatility increases, the value of ATR increases, and as volatility decreases, the value of ATR decreases. By using ATR in NNFX system, traders can adjust their stop loss and take profit levels according to the volatility of the asset being traded. This helps to ensure that the trade is given enough room to move, while also minimizing potential losses.
Other types of volatility include True Range Double (TRD), Close-to-Close, and Garman-Klass
What is a Baseline indicator?
The baseline is essentially a moving average, and is used to determine the overall direction of the market.
The baseline in the NNFX system is used to filter out trades that are not in line with the long-term trend of the market. The baseline is plotted on the chart along with other indicators, such as the Moving Average (MA), the Relative Strength Index (RSI), and the Average True Range (ATR).
Trades are only taken when the price is in the same direction as the baseline. For example, if the baseline is sloping upwards, only long trades are taken, and if the baseline is sloping downwards, only short trades are taken. This approach helps to ensure that trades are in line with the overall trend of the market, and reduces the risk of entering trades that are likely to fail.
By using a baseline in the NNFX system, traders can have a clear reference point for determining the overall trend of the market, and can make more informed trading decisions. The baseline helps to filter out noise and false signals, and ensures that trades are taken in the direction of the long-term trend.
What is a Confirmation indicator?
Confirmation indicators are technical indicators that are used to confirm the signals generated by primary indicators. Primary indicators are the core indicators used in the NNFX system, such as the Average True Range (ATR), the Moving Average (MA), and the Relative Strength Index (RSI).
The purpose of the confirmation indicators is to reduce false signals and improve the accuracy of the trading system. They are designed to confirm the signals generated by the primary indicators by providing additional information about the strength and direction of the trend.
Some examples of confirmation indicators that may be used in the NNFX system include the Bollinger Bands, the MACD (Moving Average Convergence Divergence), and the MACD Oscillator. These indicators can provide information about the volatility, momentum, and trend strength of the market, and can be used to confirm the signals generated by the primary indicators.
In the NNFX system, confirmation indicators are used in combination with primary indicators and other filters to create a trading system that is robust and reliable. By using multiple indicators to confirm trading signals, the system aims to reduce the risk of false signals and improve the overall profitability of the trades.
What is a Continuation indicator?
In the NNFX (No Nonsense Forex) trading system, a continuation indicator is a technical indicator that is used to confirm a current trend and predict that the trend is likely to continue in the same direction. A continuation indicator is typically used in conjunction with other indicators in the system, such as a baseline indicator, to provide a comprehensive trading strategy.
What is a Volatility/Volume indicator?
Volume indicators, such as the On Balance Volume (OBV), the Chaikin Money Flow (CMF), or the Volume Price Trend (VPT), are used to measure the amount of buying and selling activity in a market. They are based on the trading volume of the market, and can provide information about the strength of the trend. In the NNFX system, volume indicators are used to confirm trading signals generated by the Moving Average and the Relative Strength Index. Volatility indicators include Average Direction Index, Waddah Attar, and Volatility Ratio. In the NNFX trading system, volatility is a proxy for volume and vice versa.
By using volume indicators as confirmation tools, the NNFX trading system aims to reduce the risk of false signals and improve the overall profitability of trades. These indicators can provide additional information about the market that is not captured by the primary indicators, and can help traders to make more informed trading decisions. In addition, volume indicators can be used to identify potential changes in market trends and to confirm the strength of price movements.
What is an Exit indicator?
The exit indicator is used in conjunction with other indicators in the system, such as the Moving Average (MA), the Relative Strength Index (RSI), and the Average True Range (ATR), to provide a comprehensive trading strategy.
The exit indicator in the NNFX system can be any technical indicator that is deemed effective at identifying optimal exit points. Examples of exit indicators that are commonly used include the Parabolic SAR, the Average Directional Index (ADX), and the Chandelier Exit.
The purpose of the exit indicator is to identify when a trend is likely to reverse or when the market conditions have changed, signaling the need to exit a trade. By using an exit indicator, traders can manage their risk and prevent significant losses.
In the NNFX system, the exit indicator is used in conjunction with a stop loss and a take profit order to maximize profits and minimize losses. The stop loss order is used to limit the amount of loss that can be incurred if the trade goes against the trader, while the take profit order is used to lock in profits when the trade is moving in the trader's favor.
Overall, the use of an exit indicator in the NNFX trading system is an important component of a comprehensive trading strategy. It allows traders to manage their risk effectively and improve the profitability of their trades by exiting at the right time.
How does Loxx's GKD (Giga Kaleidoscope Modularized Trading System) implement the NNFX algorithm outlined above?
Loxx's GKD v1.0 system has five types of modules (indicators/strategies). These modules are:
1. GKD-BT - Backtesting module (Volatility, Number 1 in the NNFX algorithm)
2. GKD-B - Baseline module (Baseline and Volatility/Volume, Numbers 1 and 2 in the NNFX algorithm)
3. GKD-C - Confirmation 1/2 and Continuation module (Confirmation 1/2 and Continuation, Numbers 3, 4, and 5 in the NNFX algorithm)
4. GKD-V - Volatility/Volume module (Confirmation 1/2, Number 6 in the NNFX algorithm)
5. GKD-E - Exit module (Exit, Number 7 in the NNFX algorithm)
(additional module types will added in future releases)
Each module interacts with every module by passing data between modules. Data is passed between each module as described below:
GKD-B => GKD-V => GKD-C(1) => GKD-C(2) => GKD-C(Continuation) => GKD-E => GKD-BT
That is, the Baseline indicator passes its data to Volatility/Volume. The Volatility/Volume indicator passes its values to the Confirmation 1 indicator. The Confirmation 1 indicator passes its values to the Confirmation 2 indicator. The Confirmation 2 indicator passes its values to the Continuation indicator. The Continuation indicator passes its values to the Exit indicator, and finally, the Exit indicator passes its values to the Backtest strategy.
This chaining of indicators requires that each module conform to Loxx's GKD protocol, therefore allowing for the testing of every possible combination of technical indicators that make up the six components of the NNFX algorithm.
What does the application of the GKD trading system look like?
Example trading system:
Backtest: Strategy with 1-3 take profits, trailing stop loss, multiple types of PnL volatility, and 2 backtesting styles
Baseline: Hull Moving Average
Volatility/Volume: Hurst Exponent
Confirmation 1: Trend Scalp as shown on the chart above
Confirmation 2: Williams Percent Range
Continuation: Fisher Transform
Exit: Rex Oscillator
Each GKD indicator is denoted with a module identifier of either: GKD-BT, GKD-B, GKD-C, GKD-V, or GKD-E. This allows traders to understand to which module each indicator belongs and where each indicator fits into the GKD protocol chain.
Giga Kaleidoscope Modularized Trading System Signals (based on the NNFX algorithm)
Standard Entry
1. GKD-C Confirmation 1 Signal
2. GKD-B Baseline agrees
3. Price is within a range of 0.2x Volatility and 1.0x Volatility of the Goldie Locks Mean
4. GKD-C Confirmation 2 agrees
5. GKD-V Volatility/Volume agrees
Baseline Entry
1. GKD-B Baseline signal
2. GKD-C Confirmation 1 agrees
3. Price is within a range of 0.2x Volatility and 1.0x Volatility of the Goldie Locks Mean
4. GKD-C Confirmation 2 agrees
5. GKD-V Volatility/Volume agrees
6. GKD-C Confirmation 1 signal was less than 7 candles prior
Continuation Entry
1. Standard Entry, Baseline Entry, or Pullback; entry triggered previously
2. GKD-B Baseline hasn't crossed since entry signal trigger
3. GKD-C Confirmation Continuation Indicator signals
4. GKD-C Confirmation 1 agrees
5. GKD-B Baseline agrees
6. GKD-C Confirmation 2 agrees
1-Candle Rule Standard Entry
1. GKD-C Confirmation 1 signal
2. GKD-B Baseline agrees
3. Price is within a range of 0.2x Volatility and 1.0x Volatility of the Goldie Locks Mean
Next Candle:
1. Price retraced (Long: close < close or Short: close > close )
2. GKD-B Baseline agrees
3. GKD-C Confirmation 1 agrees
4. GKD-C Confirmation 2 agrees
5. GKD-V Volatility/Volume agrees
1-Candle Rule Baseline Entry
1. GKD-B Baseline signal
2. GKD-C Confirmation 1 agrees
3. Price is within a range of 0.2x Volatility and 1.0x Volatility of the Goldie Locks Mean
4. GKD-C Confirmation 1 signal was less than 7 candles prior
Next Candle:
1. Price retraced (Long: close < close or Short: close > close )
2. GKD-B Baseline agrees
3. GKD-C Confirmation 1 agrees
4. GKD-C Confirmation 2 agrees
5. GKD-V Volatility/Volume Agrees
PullBack Entry
1. GKD-B Baseline signal
2. GKD-C Confirmation 1 agrees
3. Price is beyond 1.0x Volatility of Baseline
Next Candle:
1. Price is within a range of 0.2x Volatility and 1.0x Volatility of the Goldie Locks Mean
3. GKD-C Confirmation 1 agrees
4. GKD-C Confirmation 2 agrees
5. GKD-V Volatility/Volume Agrees
█ GKD-C Trend Scalp
What is T3?
The T3 Moving Average (T3MA) is a technical analysis indicator that was developed by Tim Tillson. It is a trend-following indicator that aims to provide a smoother and more accurate representation of price trends than other moving average indicators.
The T3MA is a type of exponential moving average ( EMA ) that is calculated using a series of complex formulas. Unlike a simple or exponential moving average , which use fixed smoothing factors, the T3MA uses a variable smoothing factor that is based on the volatility of the underlying asset. This means that the T3MA is able to adapt to changing market conditions and provide more accurate signals.
The formula for calculating the T3MA is as follows:
T3 = a * EMA1 + (1 - a) * T3
Where:
-T3 is the current value of the T3MA
-EMA1 is the current value of the first EMA
-T3 is the previous value of the T3MA
-a is the smoothing factor, which is based on the volatility of the underlying asset and is calculated using the following formulas:
-c1 = -1 + exp (-sqrt(2) * pi / period)
-c2 = 2 * c1 * c1 + 2 * c1
-c3 = 1 - c1 - c2
-a = c1 * sqrt(period) * (close - T3) + c2 * T3 + c3 * EMA1
In simple terms, the T3MA is calculated by taking a weighted average of two different EMAs, with the weight given to each EMA depending on the volatility of the asset being analyzed. The T3MA is then smoothed using a second smoothing factor, which further reduces noise and improves the accuracy of the indicator.
The T3MA can be used in a variety of ways by traders and analysts. Some common applications include using the T3MA as a trend-following indicator, with buy signals generated when the price of an asset crosses above the T3MA and sell signals generated when the price crosses below. The T3MA can also be used in combination with other indicators and analytical techniques to confirm trading decisions and identify potential trend reversals.
Overall, the T3 Moving Average is a highly sophisticated and complex technical indicator that is designed to provide a more accurate and reliable representation of price trends. While it may be difficult for novice traders to understand and use effectively, experienced traders and analysts may find the T3MA to be a valuable tool in their trading toolbox.
What is Trend Scalp?
Trend Scalp calculates the difference between bull and bear power and then smooths this calculation using the T3 filter. This indicator is good for lower timeframe scalping. For use in regular trading, decrease the levels value, for scalps, keep the levels value high.
Requirements
Inputs
Confirmation 1 and Solo Confirmation: GKD-V Volatility / Volume indicator
Confirmation 2: GKD-C Confirmation indicator
Outputs
Confirmation 2 and Solo Confirmation Complex: GKD-E Exit indicator
Confirmation 1: GKD-C Confirmation indicator
Continuation: GKD-E Exit indicator
Solo Confirmation Simple: GKD-BT Backtest strategy
Additional features will be added in future releases.
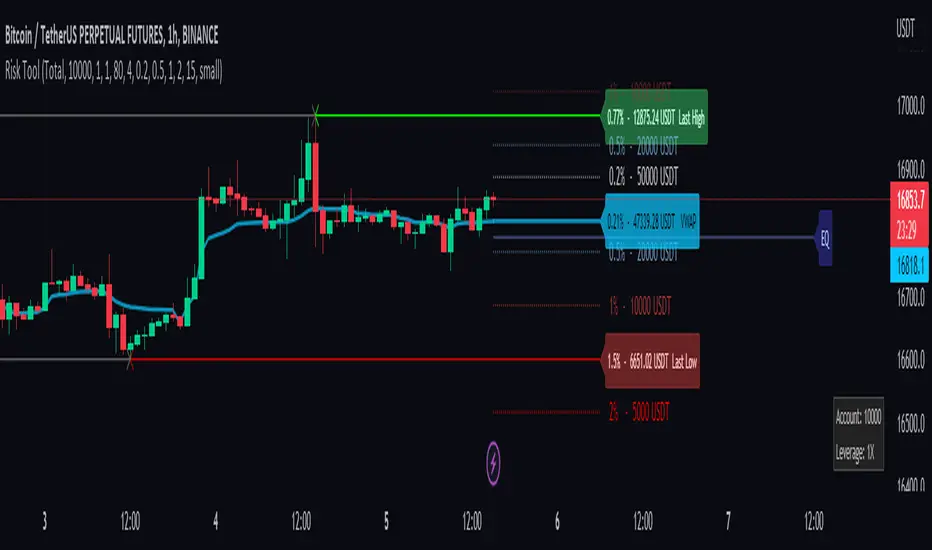
Risk Management ToolThis tool is a good way to get quick position sizing. No need to use your calculator and find that your price asset is already out of your range.
It works best with Cryptocurrencies Exchange way to manage position size calculation.
Really useful when scalping. This tool tracks the last high and low following your custom lookback bars number. It also follows the VWAP level.
You also have 4 custom ranges around the current price with the calculated position size. You set the desired percentage distance from the current price and you get the position size you need.
1. You choose the type of order
2. Account balance
3. Leverage if you use the cost base orders type
4. Amount to risk
and you get real-time risk management.
RF+ Replay for Heikin AshiRF+ Replay for Heikin Ashi
RF+ Replay for Heikin Ashi generates fully customisable Heikin Ashi candlesticks presented on a standard chart, enabling traders to utilise the Tradingview Replay feature with Heikin Ashi candlesticks when analysing and backtesting HA style strategies.
The features of this indicator include:
- Fully customisable Heikin Ashi Candles, including custom colour options for candle bodies, borders and wicks.
- Optional real-time, real-price close dots painted onto each candlestick.
- A optional set of 2 x Range Filters designed to indicate short term trend identification upon color change, ideal for low timeframe scalping.
- A optional set of 3 x fully customisable Moving Averages.
- An option to enable Heikin Ashi calculated data for the Range Filters and Moving Averages, so they present as they would on a Heikin Ashi non-standard chart type, without having to use an actual Heikin Ashi chart. Enabled by default.
- An optional sessions indicator, to highlight your prefered trading session for the purpose of backtesting.
- An optional watermark featuring customisable text and well as symbol and timeframe information, as seen in the screenshot of this indicator.
Instructions for use:
1) Because this indicator generates candlesticks and presents them onto your chart, you will need to hide the existing candlesticks so you do not see two sets of candles. You can do this by going into your Tradingview chart settings and making the candle bodies, borders and wicks fully transparent. You can then save this as a layout template. You can access your Chart Settings by clicking on the cog icon, or by right clicking on the chart itself and selecting 'Chart Settings' from the list.
2) Ensure you have the standard chart type selected - you do not need to select a Heikin Ashi type chart.
3) You will now be able to analyise and even backtest your Heikin Ashi style strategies including the use of the Tradingview Replay feature found at the top of the chart.
Heikin Ashi means 'average bar' in Japanese, which speaks to the fact that Heikin Ashi candles are calculated differently to standard Japanese candlesticks. The general idea of Heikin Ashi candles is to 'smooth' the appearance of price movement, by the use of averages within their calculation. It is important to understand that the Open and Close values of a Heikin Ashi candlestick do not reflect real Open and Close prices. You can use the real price dots feature to clearly see the real time and real price Close of each candle.
The formula for calculating a Heikin Ashi candlestick is as follows:
High = Maximum of High, Open, or Close (whichever is highest)
Low = Minimum of Low, Open, or Close (whichever is lowest)
Open = Open (previous bar) + Close (previous bar) /2
Close = (Open + High + Low + Close) / 4
If you found this useful, be sure to leave a like, comment and subscribe to show your support.
Until next time.

Heikin ashi candlestick patterns for scalping by lalocoutinoThis indicator will show you when a heikin ashi candlestick pattern forms based on volume.
It contains different candlestick patterns to be able to use it in scalping.
Each pattern has a specific name to identify it
It is recommended to use it in 1 minute charts.

candlestick patterns for scalping by lalocoutinoThis indicator will show you when a volume-based candlestick pattern forms.
It contains different candlestick patterns to be able to use it in scalping.
Each pattern has a specific name to identify it
It is recommended to use it in 1 minute charts.

MACD ULTRA with ALERTS - by OVARIDE WORK IN PROGRESS!
Coded by OVARIDE (littlegreenfish)
Made to be used with Dark Theme. Made to be used with Heikin Ashi bars (You can enable Real Price from chart settings). Test and use at your own risk. Not recommended for NEW/ INEXPERIENCED TRADERS using this for short-timeframe scalping. Bot integration is possible for high timeframes using the built-in alerts as a trigger via webhooks
Features
This is a reworked MACD code with added buffs for traders wanting more information from this basic indicator.
What this indicator does -
1. Plots a traditional MACD indicator with full input control from within the settings. All colors and values are editable , as you would expect from the standalone indicator.
2. Adds shape to the chart when MACD crosses over Signal line, while both MACD and Signal lines are below the ZERO line.
3. Adds shape to the chart when MACD crosses over ZERO line.
4. Highlights trend direction. Purple = Up Trend Likely , Yellow = Up Trend may end (use caution) , Red = Strong Down Trend Begins.
5. Ability to set alerts for -
a) When MACD crosses Signal Line.
b) When MACD crosses Zero line.
c) When an Up Trend is likely to begin.
d) When an Up Trend is slowing and may end.
e) When a Strong Down Trend begins.
Considerations -
1. Traders may use this indicator in conjunction with an existing strategy to confirm entries and exits. Traders may also use this indicator as a standalone indicator to assist with entries and exits.
2. Possible Long entries -
a) When MACD crosses Signal line while blow the Zero Line
b) When MACD crosses Zero
c) When Up Trend is Likely to begin and the background is highlighted in purple.
3. Possible stop-loss / exits (Omitted MACD crossing below Signal line and MACD crossing below Zero line)
a) When Up Trend Is slowing and the background is highlighted Yellow
b) When a Strong Down trend begins and the background is highlighted in Red. All open long position trades should be ended here.
4. The trend algorithm is hard-coded. Changing the MACD and Signal values from within the settings WILL NOT change the result of when and how the trend directions are highlighted.
5. Trend highlights are ONLY A GUIDE . You can still take entry positions in non-highlighted, yellow or red regions if your overall technical analysis tells you to.
UPDATE NOTES (IF ANY) WILL BE PUBLISHED BELOW

TrendLineScalping-BasicDear Traders,
Here is the thought which came to my mind on the trendline break scalping. sometimes during the trade we do plot trendlines and we do anticipate for the line to break and take a trade. with the same thing in mind I had created this basic script to help you and other to create based on the logic used in the script.
This is just a logic based script and doesn't do any kind of wonders. Hence you may use it as necessary.
Regards....

Eliza Ellis Improved FractalsA little side project of mine. may enhance further in the future. Used best for scalping. The longer you're in the market the more the news is waiting to eat you so I'd recommend using high volume and getting in and out quickly

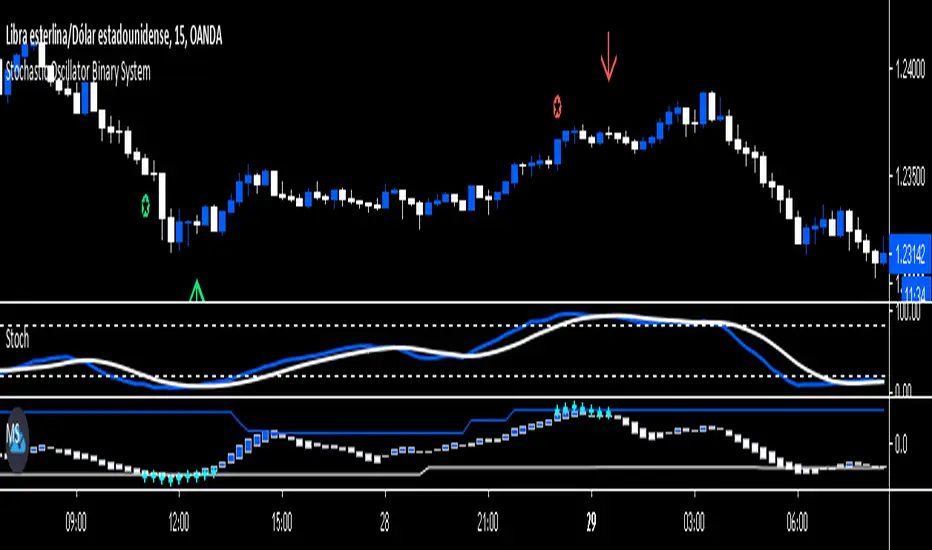
Stochastic Oscillator Binary System by Hashtag_binaryRules
- Time Frame 1 min.
- Expires Time 3 min or 15 min (the best option).
- Markets: Forex (only volatile currency pair), Futures.
- Sessions: London and New York.
Call
- Heiken Ashi Dodger blue;
-Stochastic Oscillator cross upward from oversold Zone (conservative trade, aggressive trade: Stochastic Oscillator cross upward ).
-Matrix three square dodger blue.
Put
- Heiken Ashi white;
- Stochastic Oscillator cross downward from overbougth Zone (conservative trade, aggressive trade: Stochastic Oscillator cross downward ).
- Matrix three square withe.
This Binary System is also good for trade scalping. The same rule for entry with conservative trade:
Exit position options
- For Buy close position when the stochastic line touches 80 levels,
- For Sell close positions when stochastic line touches 20 levels.
- Initial Stop loss on the previous swing.
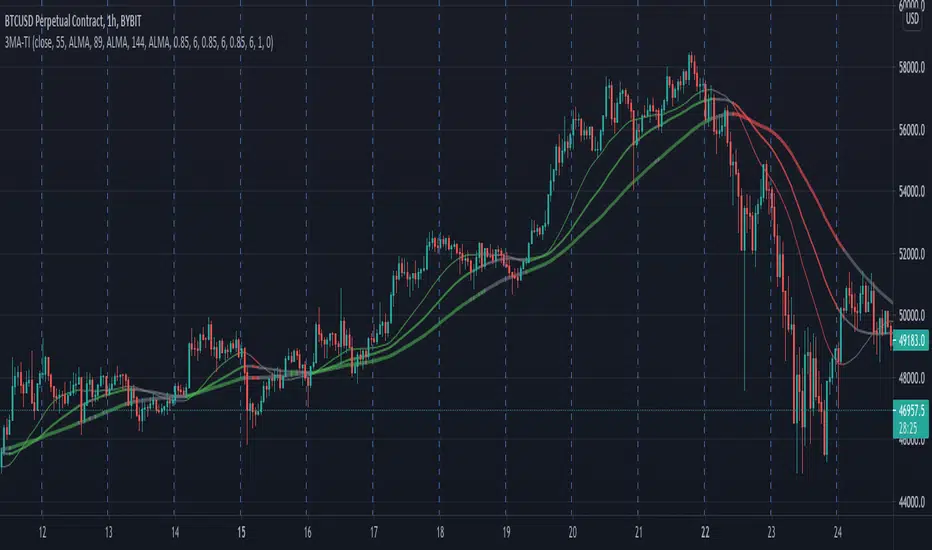
3 MA Trend IndicatorIt is a trend detector indicator, using 3 moving averages.
You can select different MA's and set the periods of them. If all 3 is increasing, the color will be green, if decreasing, the color will be red, gray otherwise.
It can be used for e.g. scalping.
HiLoMAHiLoMA (High/Low Moving Average) was designed specifically for calculating moving average boundries similar to Bollinger Bands, but is derived from the highest and lowest prices of an asset, not just the closing price. The timeframe is configurable and the study displays arrows where buys (below) and sells (above) should take place.
On exchanges with low or discounted fees, the study does excessively well at scalping. Backtesting, in general, shows this study to be very robust in any market conditions.
The alert conditions are clearly identified as BUY ASSET and SELL ASSET for automated trading.
Buys only occur when the entire spread is below the momentum line.
Sells only take place when the entire spread is above the momentum line.
When the momentum line cuts through the spread, any potentional buys/sells are ignored as these are considered weak.
Be sure your calculate your momentum on the basis of your candlestick timeframe. If you are using 3 minutes candlesticks and you want a 24 hour momentum, you need to set your momentum to 480. This holds true for all timeframes.
Sep 24
Release Notes: Seperated buys/sells where spread crosses momentum.
Cyan (lighter blue) arrows are buy/sell signals that disregard momentum.
Buys/Sells that honour momentum are now labeled MOMBUY ASSET and MOMSELL ASSET.
Buys/Sells that disregard momentum are now BUY ASSET and SELL ASSET accordingly.
Oct 4
Release Notes: Momentum is now a band with an upper and lower boundry. Buys and sells must now be completely above the band or below the band respectively. The effect is to produce stronger signals for momentum precomditional trades.

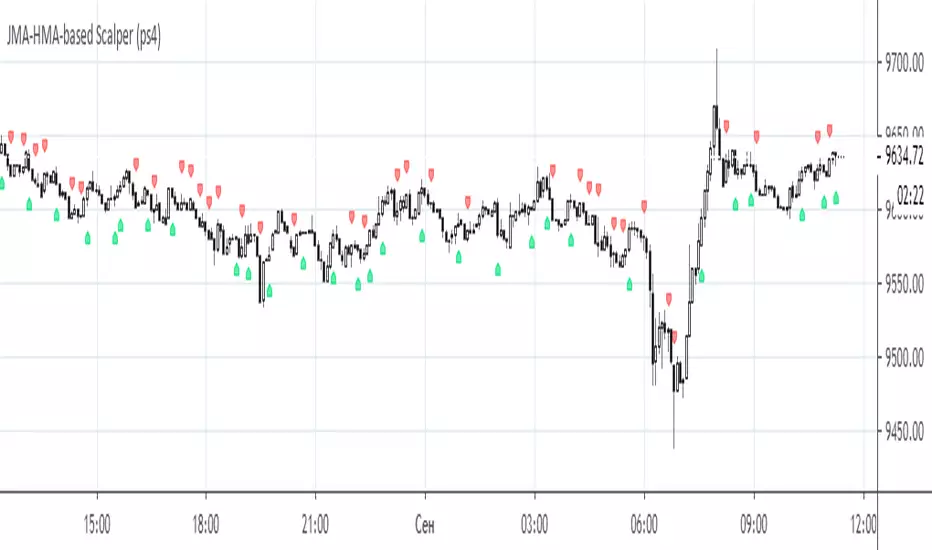
JMA-HMA-based Scalper (ps4)This is an old compilation of mine suitable for scalping. To filter out the generated signals use Difference value between on the Settings menu.
Luxmi AI Filtered Option Scalping Signals (INDEX)Introduction:
Luxmi AI Filtered Option Scalping Signals (INDEX) is an enhanced iteration of the Luxmi AI Directional Option Buying (Long Only) indicator. It's designed for use on index charts alongside the Luxmi AI Smart Sentimeter (INDEX) indicator to enhance performance. This indicator aims to provide refined signals for option scalping strategies, optimizing trading decisions within index markets.
Understanding directional bias is crucial when trading index and index options because it helps traders align their strategies with the expected movement of the underlying index.
The Luxmi AI Filtered Option Scalping Signals (INDEX) indicator aims to simplify and expedite decision-making through comprehensive technical analysis of various data points on a chart. By leveraging advanced analysis of data points, this indicator scrutinizes multiple factors simultaneously to offer traders clear and rapid insights into market dynamics.
The indicator is specifically designed for option scalping, a trading strategy that aims to profit from short-term price fluctuations. It prioritizes signals that are conducive to quick execution and capitalizes on rapid market movements typical of scalping strategies.
Major Features:
Trend Cloud:
Working Principle:
The script utilizes the Relative Strength Index (RSI) to assess market momentum, identifying bullish and bearish phases based on RSI readings. It calculates two boolean variables, bullmove and bearmove, which signal shifts in momentum direction by considering changes in the Exponential Moving Average (EMA) of the closing price. When RSI indicates bullish momentum and the closing price's EMA exhibits positive changes, bullmove is triggered, signifying the start of a bullish phase. Conversely, when RSI suggests bearish momentum and the closing price's EMA shows negative changes, bearmove is activated, marking the beginning of a bearish phase. This systematic approach helps in understanding the current trend of the price. The script visually emphasizes these phases on the chart using plot shape markers, providing traders with clear indications of trend shifts.
Benefits of Using Trend Cloud:
Comprehensive Momentum Assessment: The script offers a holistic view of market momentum by incorporating RSI readings and changes in the closing price's EMA, enabling traders to identify both bullish and bearish phases effectively.
Structured Trend Recognition: With the calculation of boolean variables, the script provides a structured approach to recognizing shifts in momentum direction, enhancing traders' ability to interpret market dynamics.
Visual Clarity: Plotshape markers visually highlight the start and end of bullish and bearish phases on the chart, facilitating easy identification of trend shifts and helping traders to stay informed.
Prompt Response: Traders can promptly react to changing market conditions as the script triggers alerts when bullish or bearish phases begin, allowing them to seize potential trading opportunities swiftly.
Informed Decision-Making: By integrating various indicators and visual cues, the script enables traders to make well-informed decisions and adapt their strategies according to prevailing market sentiment, ultimately enhancing their trading performance.
How to use this feature:
The most effective way to maximize the benefits of this feature is to use it in conjunction with other key indicators and visual cues. By combining the color-coded clouds, which indicate bullish and bearish sentiment, with other features such as IS candles, microtrend candles, volume candles, and sentimeter candles, traders can gain a comprehensive understanding of market dynamics. For instance, aligning the color of the clouds with the trend direction indicated by IS candles, microtrend candles, and sentimeter candles can provide confirmation of trend strength or potential reversals.
Furthermore, traders can leverage the trend cloud as a trailing stop-loss tool for long entries, enhancing risk management strategies. By adjusting the stop-loss level based on the color of the cloud, traders can trail their positions to capture potential profits while minimizing losses. For long entries, maintaining the position as long as the cloud remains green can help traders stay aligned with the prevailing bullish sentiment. Conversely, a shift in color from green to red serves as a signal to exit the position, indicating a potential reversal in market sentiment and minimizing potential losses. This integration of the trend cloud as a trailing stop-loss mechanism adds an additional layer of risk management to trading strategies, increasing the likelihood of successful trades while reducing exposure to adverse market movements.
Moreover, the red cloud serves as an indicator of decay in option premiums and potential theta effect, particularly relevant for options traders. When the cloud turns red, it suggests a decline in option prices and an increase in theta decay, highlighting the importance of managing options positions accordingly. Traders may consider adjusting their options strategies, such as rolling positions or closing out contracts, to mitigate the impact of theta decay and preserve capital. By incorporating this insight into options pricing dynamics, traders can make more informed decisions about their options trades.
Scalping Cloud:
The scalping cloud serves as a specialized component within the trend cloud feature, specifically designed to pinpoint potential long and short entry points within the overarching trend cloud. Here's how it works:
Trend Identification: The trend cloud feature typically highlights the prevailing trend direction based on various technical indicators, price action, or other criteria. It visually represents the momentum and direction of the market over a given period.
Refined Entry Signals: Within this broader trend context, the scalping cloud narrows its focus to identify shorter-term trading opportunities. It does this by analyzing more granular price movements and shorter timeframes, seeking out potential entry points that align with the larger trend.
Long and Short Entries: The scalping cloud distinguishes between potential long (buy) and short (sell) entry opportunities within the trend cloud. For instance, within an uptrend indicated by the trend cloud, the scalping cloud might identify brief retracements or pullbacks as potential long entry points. Conversely, in a downtrend, it may signal short entry opportunities during temporary upward corrections.
Risk Management: By identifying potential entry points within the context of the trend, the scalping cloud also aids in risk management. Traders can use these signals to place stop-loss orders and manage their positions effectively, reducing the risk of adverse price movements.
The scalping cloud operates by analyzing the crossover and crossunder events between two key indicators: the Double Exponential Moving Average (DEMA) and a Weighted Average. Here's how it works:
Double Exponential Moving Average (DEMA): DEMA is a type of moving average that seeks to reduce lag by applying a double smoothing technique to price data. It responds more quickly to price changes compared to traditional moving averages, making it suitable for identifying short-term trends and potential trading opportunities.
Weighted Average: The weighted average calculates the average price of an asset over a specified period. However, it incorporates a weighting scheme that assigns more significance to recent price data, resulting in a more responsive indicator that closely tracks current market trends.
CE and NO CE Signals:
CE signals typically represent a Long Scalping Opportunity, suggesting that conditions are favorable for entering a long position. These signals indicate a strong upward momentum in the market, which traders can exploit for short-term gains through scalping strategies.
On the other hand, when there are no CE signals present, it doesn't necessarily mean that the trend has reversed or turned bearish. Instead, it indicates that the trend is still bullish, but the market is experiencing an active pullback. During a pullback, prices may temporarily retreat from recent highs as traders take profits or reevaluate their positions. While the overall trend remains upward, the pullback introduces a degree of uncertainty, making it less favorable for entering new long positions.
In such a scenario, traders may opt to exercise caution and refrain from entering new long positions until the pullback phase has concluded. Instead, they might consider waiting for confirmation signals, such as the resumption of CE signals or other bullish indications, before reengaging in long positions.
PE and NO PE Signals:
PE signals typically indicate a Short Entry opportunity, signaling that market conditions are conducive to entering a short position.
Conversely, when there are no PE signals present, it signifies that while the trend remains bearish, the market is currently in an active phase of consolidation or pullback. During such periods, prices may temporarily rise from recent lows, reflecting a pause in the downward momentum. While the overall trend remains downward, the absence of PE signals suggests that it may not be an optimal time to enter new short positions.
In this context, traders may exercise caution and wait for clearer signals before initiating new short positions. They might monitor the market closely for signs of a resumption in bearish momentum, such as the emergence of PE signals or other bearish indications. Alternatively, traders may choose to wait on the sidelines until market conditions stabilize or provide clearer directional signals.
Working Principle Of CE and PE Signals:
The feature calculates candlestick values based on the open, high, low, and close prices of each bar. By comparing these derived candlestick values, it determines whether the current candlestick is bullish or bearish. Additionally, it signals when there is a change in the color (bullish or bearish) of the derived candlesticks compared to the previous bar, enabling traders to identify potential shifts in market sentiment.
Micro Trend Candles:
Working Principle:
This feature begins by initializing variables to determine trend channel width and track price movements. Average True Range (ATR) is then calculated to measure market volatility, influencing the channel's size. Highs and lows are identified within a specified range, and trends are assessed based on price breaches, with potential changes signaled accordingly. The price channel is continually updated to adapt to market shifts, and arrows are placed to indicate potential entry points. Colors are assigned to represent bullish and bearish trends, dynamically adjusting based on current market conditions. Finally, candles on the chart are colored to visually depict the identified micro trend, offering traders an intuitive way to interpret market sentiment and potential entry opportunities.
Benefits of using Micro Trend Candles:
Traders can use these identified micro trends to spot potential short-term trading opportunities. For example:
Trend Following: Traders may decide to enter trades aligned with the prevailing micro trend. If the candles are consistently colored in a certain direction, traders may consider entering positions in that direction.
Reversals: Conversely, if the script signals a potential reversal by changing the candle colors, traders may anticipate trend reversals and adjust their trading strategies accordingly. For instance, they might close existing positions or enter new positions in anticipation of a trend reversal.
It's important to note that these micro trends are short-term in nature and may not always align with broader market trends. Therefore, traders utilizing this script should consider their trading timeframes and adjust their strategies accordingly.
How to use this feature:
This feature assigns colors to candles to represent bullish and bearish trends, with adjustments made based on current market conditions. Green candles accompanied by a green trend cloud signal a potential long entry, while red candles suggest caution, indicating a bearish trend. This visual representation allows traders to interpret market sentiment intuitively, identifying optimal entry points and exercising caution during potential downtrends.
Scalping Candles (Inspired by Elliott Wave and Open Interest Concepts):
Working Principle:
This feature draws inspiration from the Elliot Wave method, utilizing technical analysis techniques to discern potential market trends and sentiment shifts. It begins by calculating the variance between two Exponential Moving Averages (EMAs) of closing prices, mimicking Elliot Wave's focus on wave and trend analysis. The shorter-term EMA captures immediate price momentum, while the longer-term EMA reflects broader market trends. A smoother Exponential Moving Average (EMA) line, derived from the difference between these EMAs, aids in identifying short-term trend shifts or momentum reversals.
Benefits of using Scalping Candles Inspired by Elliott Wave:
The Elliott Wave principle is a form of technical analysis that attempts to predict future price movements by identifying patterns in market charts. It suggests that markets move in repetitive waves or cycles, and traders can potentially profit by recognizing these patterns.
While this script does not explicitly analyze Elliot Wave patterns, it is inspired by the principle's emphasis on trend analysis and market sentiment. By calculating and visualizing the difference between EMAs and assigning colors to candles based on this analysis, the script aims to provide traders with insights into potential market sentiment shifts, which can align with the broader philosophy of Elliott Wave analysis.
How to use this feature:
Candlestick colors are assigned based on the relationship between the EMA line and the variance. When the variance is below or equal to the EMA line, candles are colored red, suggesting a bearish sentiment. Conversely, when the variance is above the EMA line, candles are tinted green, indicating a bullish outlook. Though not explicitly analyzing Elliot Wave patterns, the script aligns with its principles of trend analysis and market sentiment interpretation. By offering visual cues on sentiment shifts, it provides traders with insights into potential trading opportunities, echoing Elliot Wave's emphasis on pattern recognition and trend analysis.
Chart Timeframe Support and Resistance:
Working Principle:
This feature serves to identify and visualize support and resistance levels on the chart, primarily based on the chosen Chart Timeframe (CTF). It allows users to specify parameters such as the number of bars considered on the left and right sides of each pivot point, as well as line width and label color. Moreover, users have the option to enable or disable the display of these levels. By utilizing functions to calculate pivot highs and lows within the specified timeframe, the script determines the highest high and lowest low surrounding each pivot point.
Additionally, it defines functions to create lines and labels for each detected support and resistance level. Notably, this feature incorporates a trading method that emphasizes the concept of resistance turning into support after breakouts, thereby providing valuable insights for traders employing such strategies. These lines are drawn on the chart, with colors indicating whether the level is above or below the current close price, aiding traders in visualizing key levels and making informed trading decisions.
Benefits of Chart Timeframe Support and Resistance:
Identification of Price Levels: Support and resistance levels help traders identify significant price levels where buying (support) and selling (resistance) pressure may intensify. These levels are often formed based on historical price movements and are regarded as areas of interest for traders.
Decision Making: Support and resistance levels assist traders in making informed trading decisions. By observing price reactions near these levels, traders can gauge market sentiment and adjust their strategies accordingly. For example, traders may choose to enter or exit positions, set stop-loss orders, or take profit targets based on price behavior around these levels.
Risk Management: Support and resistance levels aid in risk management by providing reference points for setting stop-loss orders. Traders often place stop-loss orders below support levels for long positions and above resistance levels for short positions to limit potential losses if the market moves against them.
How to use this feature:
Planning Long Positions: When considering long positions, it's advantageous to strategize when the price is in proximity to a support level identified by the script. This suggests a potential area of buying interest where traders may expect a bounce or reversal in price. Additionally, confirm the bullish bias by ensuring that the trend cloud is green, indicating favorable market conditions for long trades.
Waiting for Breakout: If long signals are generated near resistance levels detected by the script, exercise patience and wait for a breakout above the resistance. A breakout above resistance signifies potential strength in the upward momentum and may present a more opportune moment to enter long positions. This approach aligns with trading methodologies that emphasize confirmation of bullish momentum before initiating trades.
StopLoss and Target Lines:
In addition to generating entry signals, this indicator also incorporates predefined stop-loss ray lines and configurable risk-reward (R:R) target lines to enhance risk management and profit-taking strategies. Here's how these features work:
Predefined Stop-loss Ray Lines: The indicator automatically plots stop-loss ray lines on the chart, serving as visual guidelines for setting stop-loss levels. These stop-loss lines are predetermined based on specific criteria, such as volatility levels, support and resistance zones, or predefined risk parameters. Traders can use these lines as reference points to place their stop-loss orders, aiming to limit potential losses if the market moves against their position.
Configurable Risk-Reward (R:R) Target Lines: In addition to stop-loss lines, the indicator allows traders to set configurable risk-reward (R:R) target lines on the chart. These target lines represent predefined price levels where traders intend to take profits based on their desired risk-reward ratio. By adjusting the placement of these lines, traders can customize their risk-reward ratios according to their trading preferences and risk tolerance.
Risk Management: The predefined stop-loss ray lines help traders manage risk by providing clear exit points if the trade goes against their expectations. By adhering to these predetermined stop-loss levels, traders can minimize potential losses and protect their trading capital, thereby enhancing overall risk management.
Profit-taking Strategy: On the other hand, the configurable R:R target lines assist traders in establishing profit-taking strategies. By setting target levels based on their desired risk-reward ratio, traders can aim to capture profits at predefined price levels that offer favorable risk-reward profiles. This allows traders to systematically take profits while ensuring that potential gains outweigh potential losses over the long term.
The stop-loss and target lines incorporated in this indicator are dynamic in nature, providing traders with the flexibility to utilize them as trailing stop-loss and extended take-profit targets. Here's how these dynamic features work:
Trailing Stop-loss: Traders can employ the stop-loss lines as trailing stop-loss levels, allowing them to adjust their stop-loss orders as the market moves in their favor. As the price continues to move in the desired direction, indicator can dynamically adjust the stop-loss line to lock in profits while still allowing room for potential further gains. This trailing stop-loss mechanism helps traders secure profits while allowing their winning trades to continue running as long as the market remains favorable.
Extended Take Profit Targets: Similarly, traders can utilize the target lines as extended take-profit targets, enabling them to capture additional profits beyond their initial profit targets. By adjusting the placement of these target lines based on evolving market conditions or technical signals, traders can extend their profit-taking strategy to capitalize on potential price extensions or trend continuations. This flexibility allows traders to maximize their profit potential by capturing larger price movements while managing their risk effectively.
Rangebound Bars:
When the Rangebound Bars feature is enabled, the indicator represents candles in a distinct purple color to visually denote periods of sideways or range-bound price action. This visual cue helps traders easily identify when the market is consolidating and lacking clear directional momentum. Here's how it works:
Purple Candle Color: When the Rangebound Bars feature is active, the indicator displays candlesticks in a purple color to highlight periods of sideways price movement. This color differentiation stands out against the usual colors used for bullish (e.g., green or white) and bearish (e.g., red or black) candles, making it easier for traders to recognize range-bound conditions at a glance.
Signaling Sideways Price Action: The purple coloration of candles indicates that price movements are confined within a relatively narrow range and lack a clear upward or downward trend. This may occur when the market is consolidating, experiencing indecision, or undergoing a period of accumulation or distribution.
Working Principle:
The Rangebound Bars feature of this indicator is designed to assist traders in identifying and navigating consolidating market conditions, where price movements are confined within a relatively narrow range. This feature utilizes Pivot levels and the Average True Range (ATR) concept to determine when the market is range-bound and provides signals to stay out of such price action. Here's how it works:
Pivot Levels: Pivot levels are key price levels derived from the previous period's high, low, and closing prices. They serve as potential support and resistance levels and are widely used by traders to identify significant price levels where price action may stall or reverse. The Rangebound Bars feature incorporates Pivot levels into its analysis to identify ranges where price tends to consolidate.
Average True Range (ATR): The Average True Range is a measure of market volatility that calculates the average range between the high and low prices over a specified period. It provides traders with insights into the level of price volatility and helps set appropriate stop-loss and take-profit levels. In the context of the Rangebound Bars feature, ATR is used to gauge the extent of price fluctuations within the identified range.

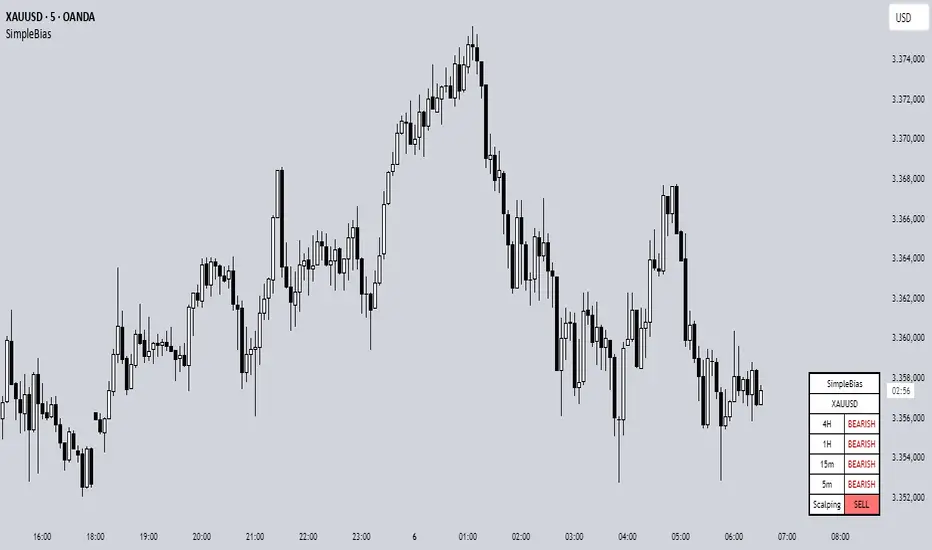
SimpleBiasSimpleBias - Multi-Timeframe Bias Analysis Indicator
Overview
SimpleBias is a comprehensive multi-timeframe bias analysis indicator designed to help traders make informed trading decisions by displaying market bias across multiple timeframes in a clean, organized table format.
Key Features
Multi-Timeframe Analysis
8 Timeframes Supported : 1M, 1W, 1D, 4H, 1H, 15m, 5m, 1m
Adaptive Display : Shows only relevant timeframes based on current chart timeframe
Real-time Bias Detection : Compares current open price with previous period's open price
Signal Generation
Day Trading Mode : Ideal for 15-minute timeframe analysis
Scalping Mode : Optimized for 5-minute timeframe trading
Signal OFF : Pure bias analysis without trade signals
Customization Options
Theme Support : Light mode and dark mode with automatic color adaptation
Position Control : Table can be positioned at top-right, middle-right, or bottom-right
Size Options : Tiny, small, or normal text size
Color Customization : Full control over bias colors, signal colors, and interface elements
Transparency : Optional transparent background for cleaner chart appearance
How It Works
Bias Calculation
The indicator determines market bias by comparing the current timeframe's open price with the previous period's open price:
BULLISH : Current open > Previous open
BEARISH : Current open < Previous open
NEUTRAL : Current open = Previous open
Adaptive Timeframe Display
The indicator intelligently shows only relevant timeframes based on your current chart:
On 1M chart: Shows 1M bias only
On 1W chart: Shows 1M, 1W bias
On 1D chart: Shows 1M, 1W, 1D bias
And so on...
Signal Logic
Day Trading : Compares current price with 4H open price
Scalping : Compares current price with 1H open price
Usage Instructions
Add to Chart : Apply the indicator to any timeframe chart
Configure Settings :
- Choose table position and text size
- Select signal mode (OFF/Day Trade/Scalping)
- Customize colors and theme
Interpret Results :
- Green/Blue text = Bullish bias
- Red text = Bearish bias
- Gray text = Neutral bias
Customization Guide
Theme Settings
Light Mode : Traditional white background with dark text
Dark Mode : Dark background with light text, optimized for dark charts
Transparent Background : Clean overlay without background color
Color Schemes
Bias Colors : Separate customization for bullish, bearish, and neutral bias
Signal Colors : Distinct colors for buy, sell, and neutral signals
Interface : Control table background and border colors
Best Practices
For Day Trading
Use 15-minute or 1-hour charts
Enable "Day Trade" signal mode
Focus on 4H and higher timeframe bias alignment
For Scalping
Use 5-minute charts
Enable "Scalping" signal mode
Watch for 1H and 4H bias alignment
For Swing Trading
Use 4H or daily charts
Keep signal mode OFF
Focus on weekly and monthly bias alignment
Important Notes
This indicator is for educational and analysis purposes only
Not financial advice - always do your own research
Past performance does not guarantee future results
Risk management is essential in all trading activities
Technical Specifications
Pine Script Version : v6
Overlay : True (displays on price chart)
Performance : Optimized with cached security requests
Compatibility : Works on all TradingView timeframes and instruments
---
SimpleBias - Indikator Analisis Bias Multi-Timeframe
Gambaran Umum
SimpleBias adalah indikator analisis bias multi-timeframe yang komprehensif, dirancang untuk membantu trader membuat keputusan trading yang tepat dengan menampilkan bias pasar di berbagai timeframe dalam format tabel yang bersih dan terorganisir.
Fitur Utama
Analisis Multi-Timeframe
8 Timeframe Didukung : 1M, 1W, 1D, 4H, 1H, 15m, 5m, 1m
Tampilan Adaptif : Hanya menampilkan timeframe yang relevan berdasarkan timeframe chart saat ini
Deteksi Bias Real-time : Membandingkan harga open saat ini dengan harga open periode sebelumnya
Mode Sinyal Trading
Mode Day Trading : Ideal untuk analisis timeframe 15 menit
Mode Scalping : Dioptimalkan untuk trading timeframe 5 menit
Mode OFF : Analisis bias murni tanpa sinyal trading
Opsi Kustomisasi
Dukungan Theme : Mode terang dan gelap dengan adaptasi warna otomatis
Kontrol Posisi : Tabel dapat diposisikan di kanan-atas, kanan-tengah, atau kanan-bawah
Opsi Ukuran : Ukuran teks kecil, sedang, atau normal
Kustomisasi Warna : Kontrol penuh atas warna bias, warna sinyal, dan elemen interface
Transparansi : Background transparan opsional untuk chart yang lebih bersih
Cara Kerja
Perhitungan Bias
Indikator menentukan bias pasar dengan membandingkan harga open timeframe saat ini dengan harga open periode sebelumnya:
BULLISH : Open saat ini > Open sebelumnya
BEARISH : Open saat ini < Open sebelumnya
NEUTRAL : Open saat ini = Open sebelumnya
Petunjuk Penggunaan
Tambahkan ke Chart : Terapkan indikator ke chart timeframe apapun
Konfigurasi Settings :
- Pilih posisi tabel dan ukuran teks
- Pilih mode sinyal (OFF/Day Trade/Scalping)
- Sesuaikan warna dan theme
Interpretasi Hasil :
- Teks hijau/biru = Bias bullish
- Teks merah = Bias bearish
- Teks abu-abu = Bias neutral
Best Practices
Untuk Day Trading
Gunakan chart 15 menit atau 1 jam
Aktifkan mode sinyal "Day Trade"
Fokus pada alignment bias timeframe 4H ke atas
Untuk Scalping
Gunakan chart 5 menit
Aktifkan mode sinyal "Scalping"
Perhatikan alignment bias 1H dan 4H
Catatan Penting
Indikator ini hanya untuk tujuan edukasi dan analisis
Bukan nasihat keuangan - selalu lakukan riset sendiri
Performa masa lalu tidak menjamin hasil masa depan
Manajemen risiko sangat penting dalam semua aktivitas trading
SimpleBias membantu trader mempertahankan kesadaran terhadap bias pasar di berbagai timeframe, mendukung timing dan pengambilan keputusan yang lebih baik dalam strategi trading mereka.