Kviateq - Session PivotsFirst of all, I must say that this script wouldn't be possible without the help of one of the best script developers on TradingView - @ahancock (thanks a bunch for your help)
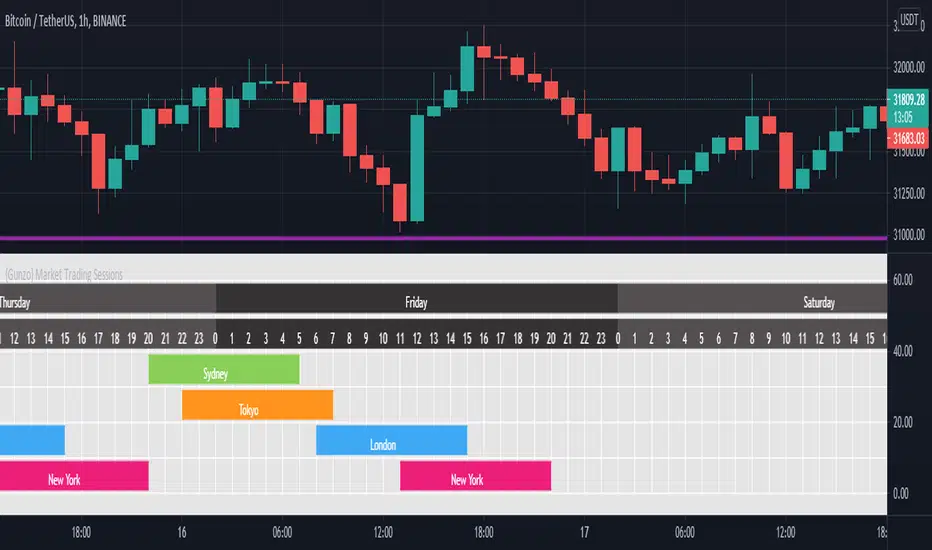
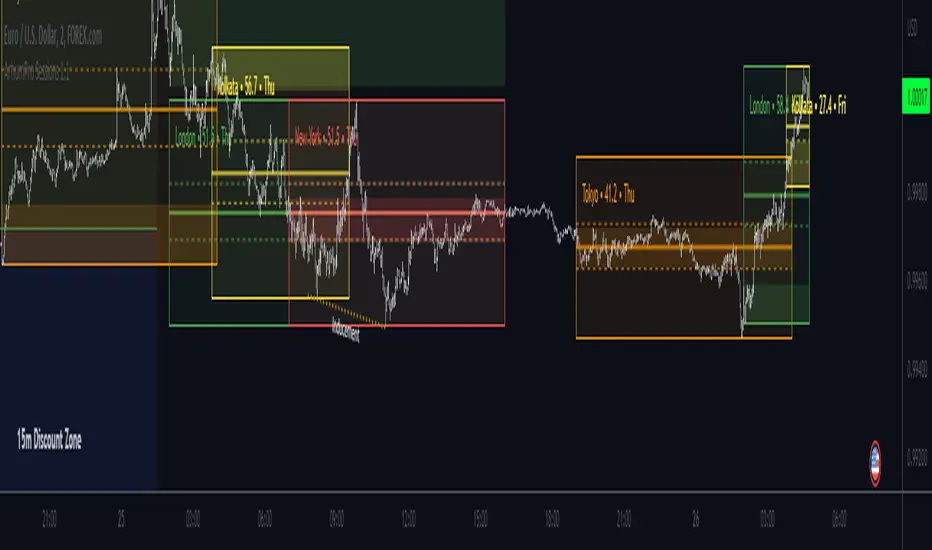
This script draws opening ranges for each of the sessions - Tokyo, London and New York and plots session high, low and pivot range of the previous session.
So if you trade London session - you would only take longs if we're above the Tokyo pivot range and vice versa for shorts.
Often times previous session's highs act as resistance and lows act as support, so careful trading around those levels.
It is obviously meant for lower timeframes, since each of the sessions only lasts a few hours.
Default settings are set to the exchange that I use and my timezone (GMT +7), so you might need to adjust the settings accordingly.
Tokyo - 12am GMT
London - 7am GMT
New York - 12pm GMT
Pine Script® indicator