Reflex - A new Ehlers indicatorSource: Stocks and Commodities V38
Hooray! A new John Ehlers indicator!
John claims this indicator is lag-less and uses the SPY on the Daily as an example.
He states that drawing a line from peak to peak (or trough to trough) will correspond perfectly with the Asset.
I have to say I agree! There is typically one bar of lag or no lag at all!
I believe this indicator can be used for either entries or exits, but not both.
Entry
1. Entering Long positions at the pivot low points (Stocks and ETFs)
2. Entering Long when the Reflex crosses above the zero lines (Stocks, ETFs, Commodities)
Exit
1. Exiting Long positions at a new pivot high point (Stocks and ETFs)
2. Exiting Long when the Reflex crosses below the zero lines (Stocks, ETFs, Commodities)
In this example, I place a Long order on the SPY every time the Reflex crosses above the zero level and exit when it crosses below or pops my stop loss, set at 1.5 * Daily ATR.
4/6 Wins
+10.76%
For me, that's good enough to create a strategy and backtest on several Indices and ETFs, which is what I have a hunch this will work on.
I think there is a lot of promise from a single Indicator!
Let me know in the comment section if you're able to use this in a strategy.
Search in scripts for "spy"

Hide Extended Hours/non-intraday American BarsOnly works with American bar style.
Not works with Candles.
--------
This script can hide the extended hours/non-intraday bars and leave the intraday bars only, especially for future users, such as ES/NQ/RTY/YM, etc.,.
Now you can find the intraday support/resistance quite easily!
Example, as a ES investor, you can easily find the intraday support/resistance level ,which is almost equal to SPY / SPX , no longer need to check SPY / SPX separately again, saving your time a lot.
--------
IMPORTANT INSTRUCTION
In order to make the script work, you have to bring it to the most top visual layer.
Please do as the following steps:
Add the script to chart
Hover mouse on the script name, and tap the right-most 'more' button (which appears as 3 dots)
Select "Visual Order", then select "Bring to front".
Done!
Also, in order to have a better view effect and make the bars COMPLETELY "Hidden", you can adjust the hidden bar color in the "setting" menu to the exact color of your chart background.

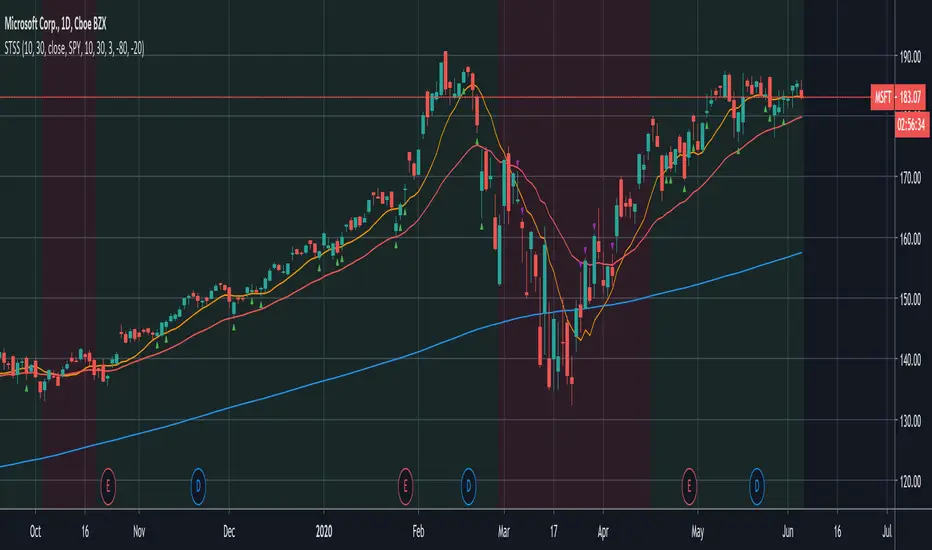
Swing-Trade-Stocks SystemThis is a simple swing trade system inspired by sources on the internet. The rules are as follows:
Buy when first green arrow appears after 10ma above 30ma
Set stop-loss below most recent support
Set take-profit below most recent swing point high or wait until price closes below 30ma (red)
Short when first purple arrow appears after 10ma below 30ma
Set stop-loss above most recent resistance
Set take-profit above most recent swing point low or wait until price closes above 30ma (red)
The background color changes based on the direction of SPY. If SPY is going down (10ma < 30ma) the
background will be red and only short indicators (purple arrows) will appear. If SPY is going up (10ma > 30ma),
the background will be green and only long indicators (green arrows) will appear.
Happy trading!
Market Internals [Makit0] MARKET INTERNALS INDICATOR v0.5beta
Market Internals are suitable for day trade equity indices, named SPY or /ES, please do your own research about what they are and how to use them
This scripts plots the NYSE market internals charts as an indicator for an easy and full visualization of market internal structure all in one chart, useful for SPY and /ES trading
Description of the Market Internals
- TICK: NYSE stocks ticking up vs stocks ticking down, extreme values may point to trend continuation on trending days or reversal in non trending days, example of extreme values can be 800 and 1000
- ADD: NYSE stocks going up vs stocks going down, if price auctions around the zero line may be a non trend day, otherwise may be a trend day
- VOLD: NYSE volume of stocks up vs volume of stocks going down, identify clearly where the volume is going, as example if volume is flowing down may be a good idea no to place longs
- TRIN: NYSE up stocks vs down stocks ratio divided by up volume vs down volume ratio. A value of 1 indicates parity, below that the strength is on the long side, above the strength is in the short side.
A basic use of market internals may be looking for divergences, for example:
- /ES is trading in a range but ADD and VOLD are trending up nonstop, may /ES will break the range to the upside
- /ES is trading in a range and ADD and VOLD are trading around the zero line but got an extreme reading on TICK, may be a non trending day and the TICK extreme reading is at one of the extremes of the /ES range, may be a good probability trade to fade that move
- /ES is trading in a trend to the downside, ADD and VOLD too, you catch a good portion of the move but are fearful to flat and miss more gains, you see in the TICK a lot of extreme values below -800 so your're confident in the continuation of the downtrend, until the TICK goes beyond -1000 and you use that signal to go flat
Market internals give you context and confirmation, price in /ES may be trending but if market internals do not confirm the move may a reversal is on its way
Price is an advertise, you can see the real move in the structure below, in the behavior of the individual components of the market, those are the real questions:
- How many stocks are going up/down (ADD)
- How many volume is flowing up/down (VOLD)
- How many stocks are ticking up/down (TICK)
- What is the overall volume breath of the market (TRIN)
FEATURES:
- Plot one of the four basic market internal indices: TICK, ADD, VOLD and TRIN
- Show labels with values beyond an user defined threshold
- Show ZERO line
- Show user defined Dotted and Dashed lines
- Show user defined moving average
SETTINGS:
- Market internal: ticker to plot in the indicator, four options to choose from (TICK, ADD, VOLD and TRIN)
- Labels threshold: all values beyond this will be ploted as labels
- Dot lines at: two dotted lines will be plotted at this value above and below the zero line
- Dash lines at: two dashed lines will be plotted at this value above and below the zero line
- MA type: two options avaiable SMA (Simple Moving Average) or EMA (Exponential Moving Average)
- MA length: number of bars to calculate the moving average
- Show zero line: show or hide zero line
- Show dot line: show or hide dotted lines
- Show dash line: show or hide dashed lines
- Show labels: show or hide labels
GOOD LUCK AND HAPPY TRADING

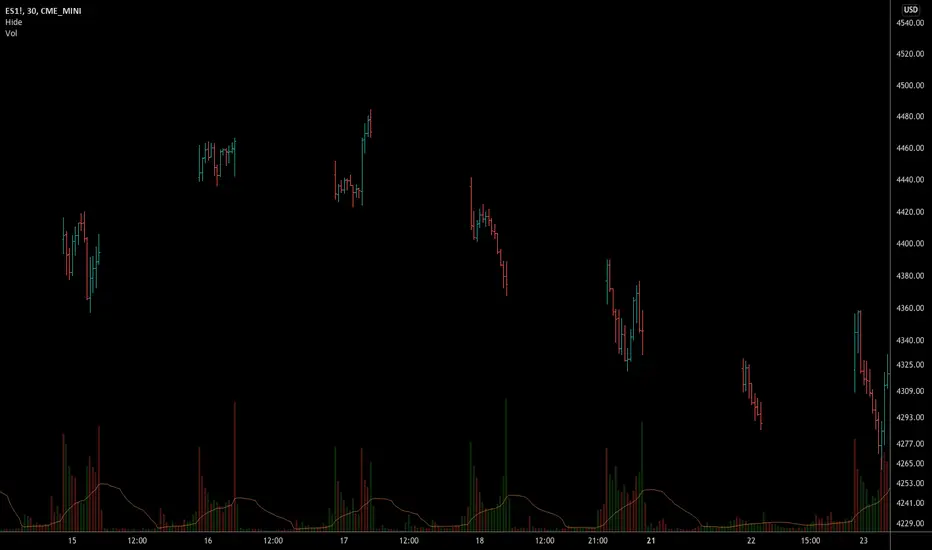
Hide extended hours/non-intraday barsEspecially for future users, such as ES/NQ/RTY/YM, etc., this script can hide the extended hours/non-intraday bars and leave the intraday bars only.
With this script , you can find the intraday support/resistance quite easily!
Example, if you are a ES investor, you can easily find the intraday support/resistance level ,which is almost equal to SPY, with this script, and no need to check SPY separately again , saving your time a lot.
Note: Please couple this script with American Bars. If you use candle charts, the upper/lower pins of the candle can't be hidden with the bars together, which is restricted by the code editor itself...
Swim Trading - Beta Trend FilterSwim Trading's Optimized Beta Trend Filter
Validated Outcome For SPY
Expected CAR (1995 to 2019): 15.11% p.a.
MDD: 19.03%
Buy & Hold SPY: 7.8% p.a. CAR

GA - Comparative Relative StrengthGA - Comparative Relative Strength is an Oscillator. It shows the Relative Strength of a Financial Instrument .
It defines the Relative Strength in relation to Markets, Sectors, Sub-sectors ETFs . Besides, it includes also Currency Indices and the manual selection of Financial Instruments.
Groups of ETFs and Manual Selection
You enable the Group of Financial Instruments that collects the ETF in your interest. Besides, you can enable more that one group. This lets you show Relative Strength Curves related to ETFs of the groups selected.
For example, it can show the Relative Strength related to Market and Sector ETFs. Besides, you can show the Relative Strength related to Sector and Industry ETFs.
The Groups of ETFs are SPDR Categories:
SPDR Core ETFs.
SPDR Select Sector ETFs.
SPDR Industry ETFs.
An extra group includes Currency Indices.
Oscillator around Zero
The Relative Strength of 2 Financial Instruments waves around a borderline. This line is a mean. The GA - Comparative Relative Strength normalizes the curve to the borderline. This makes an Oscillator around Zero.
Upper and Lower Bands
Upper and Lower Bands can follow the full curve. But you can Enable or Disable the visualization of Partial Bands. They follow the curve only for positive waves or for negative waves.
Bands are dynamic levels. Their role is to define where the Relative Strength becomes relevant or normal. When the Relative Strength persists above the Upper Band, Financial Instrument is strong. When the Relative Strength persists below the Lower Band, Financial Instrument is weak.
The Upper and Lower Bands are relevant tools in the decision process to enter the market long or short.
You need to buy Financial Instrument that is outperforming the related market. In the same way, short/sell financial instruments that are under-performing the marketplace.
A Relative Strength that decreases below the Upper Band shows a weakening. A Relative Strength that increases above the Lower Band shows a reinforcement. These indications can precede an eventual change of sentiment of large investors.
Currency Indices
The difficult part is when you want to define the Relative Strength of a Currency Pair. In this case, you can compare a pair with a group of other related pairs. In the same way, you can try to use a Currency Index or a specific calculation.
The use of a Currency Index shows limitations to define the Relative Strength in a proper way.
But an expert trader can define it in different ways so as with different tools. Besides, an expert trader knows the pairs included in the currency index. Moreover, he knows the formula and the weights of the currency pairs included in the index.
The GA - Comparative Relative Strength gives you a collection of Currency Indices. You can enable it and use the Currency Index you need.
Note: I restrict access to the tool.
Regards
Girolamo Aloe
Founder of Profiting Me
------------
Examples
Comparative Relative Strength of APD on SPY (Market Composite Average)
Comparative Relative Strength of APD on XLB Materials Sector
Comparative Relative Strength of ADP on SPY and ADP on XLB

Two level MACD into one indicatorMerged two level MACD into one indicator, then Long Entry (buy) and Short Entry (sell) is more clearly now.
Try and test it, please send me some feedback or suggestions, then the indicator can help you make money more easy!
good luck!
AMEX:SPY

SS EMA / SMA RibbonColor Change if above or below EMAs / Ribbon
StokedStocks EMA / SMA Ribbon 9 20 25 30 35 40 45 50 55 60 65 70 75 80 85 90 95 100 200
EMAs Color Change if above or below EMAs / Ribbon
Lime : Uptrending; Long Bias
Green : Dip Buy / ReEntry or downtrend reversal warning
Red : Downtrend. Short Bias
Maroon : Short Reentry (sell the peak) or uptrend reversal warning
1st strategy Long when Price crosses above all EMAs
2nd strategy if late is buy first or second pullback to 9 or 20 EMA which are the 1st and 2nd ribbon lines (in an uptrend)
3rd strategy is Short once price crosses UNDER all EMAs
Use Trailing stop % once long or short
Better when shorter time frames line up with Longer time Frames for less risk EXAMPLE Above all EMAs on 5min chart and on Daily Chart

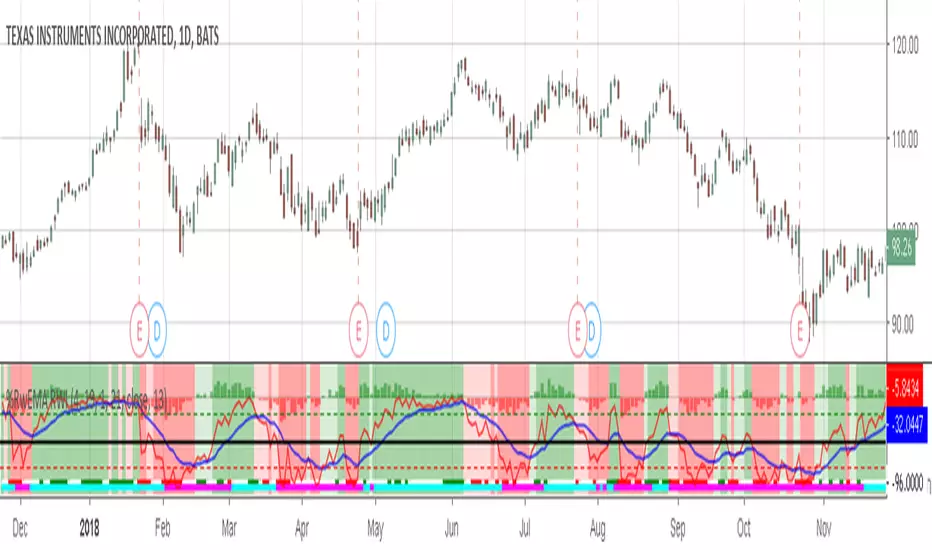
Willams %RwEMAspy
Was looking for something else when surfed into an old question
wanting %R 21 period with EMA 13 period of the %R signal
and being a rookie at this, made this code to post for them.
Tried to comment the script in such a way that other rookies
like me could make better sense of what is being done. Hope
this helps someone. I find it useful as one of my indicators for
trading.
Pinescript for tradingview.com user Tom1trader
All time frames.
Interpretation:
%R (Red) crosses above it's average (Blue) - bull
%R crosses below it's average - bear. Background
color changes green-up red-down with above crossings.
Most but not all of serious price movement takes place
from the time the %R (red) goes into oversold (or bought) and
exits again.
%R centerline crosses can also be useful.
I use various indicators and want all of the confirmation
that I can get for expectations BUT I never know what the
next bar will do and define my risks accordingly.
Sectors Relative Strength Normal DistributionI wrote this indicator as an attempt to see the Relative Strengths of different sectors in the same scale, but there is also other ways to do that.
This indicator plots the normal distribution for the 10 sectors of the SPY for the last X bars of the selected resolution, based on the selected comparative security. It shows which sectors are outperforming and underperforming the SPY (or any other security) relatively to each other by the given deviation.

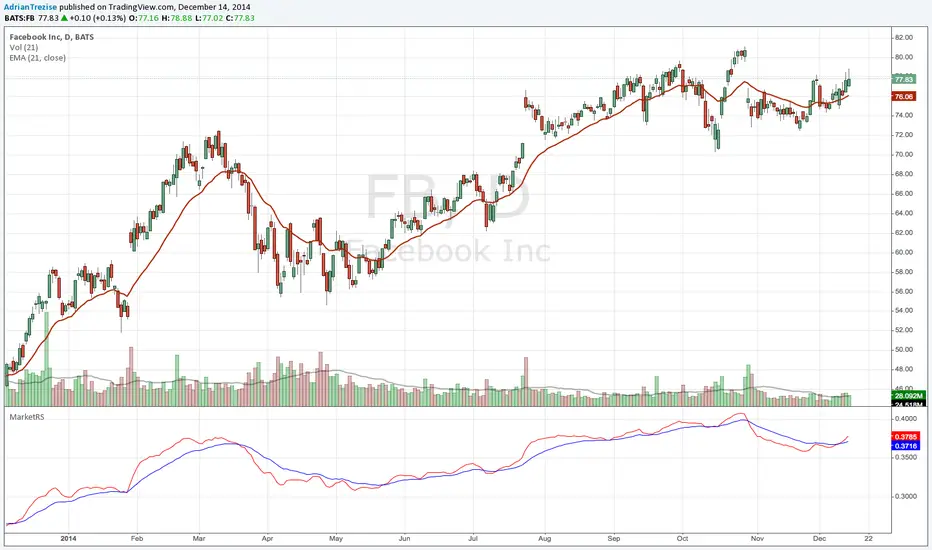
MarketRSThe strength of a stock relative to the market (SPY) is an import indicator accumulation of a stock by institutionan funds, especially during a market decline. This indicator plot the ratio of a security/SPY and plots a fast (5 period) and slow (21 period) EMA.
Market Pressure Regime [Interakktive]The Market Pressure Regime (MPR) is a 4-state market classifier that models how structural forces create "pressure zones" — regions where price movement is either supported (Release) or suppressed (Pinned) by market microstructure.
It combines compression analysis, follow-through efficiency, and stress detection into a composite pressure score, classifying markets into Release, Suppressed, Transition, or Trap states — helping traders understand WHY price is moving (or not moving) in the current environment.
█ USAGE
MPR addresses a core question traders face: Is the market in a regime where directional moves are likely to follow through, or is it structurally pinned?
For swing traders, MPR identifies Release phases where momentum strategies work best, and Suppressed phases where mean reversion dominates.
For day traders, it highlights Trap conditions — high effort with no follow-through — where reversals are probable and trend entries fail.
🔹 The 4-State Model
The indicator classifies markets into four distinct regimes:
• Release (Teal): Pressure score ≥ +5. Directional flow dominates. Price moves efficiently with follow-through. Favor trend continuation.
• Suppressed (Grey): Pressure score ≤ -5. Compression dominates. Price is range-bound or pinned. Fade extremes, expect reversion.
• Transition (Amber): Score between thresholds OR instability detected. Regime is uncertain — wait for confirmation before committing.
• Trap (Magenta): High stress + low follow-through. Effort without result. Expect reversals.
🔹 Reading the Pressure Histogram
The histogram displays the composite Pressure Score (range approximately -100 to +100):
• Positive values: Follow-through exceeds compression. Market is "releasing" — directional moves are supported.
• Negative values: Compression exceeds follow-through. Market is "suppressed" — price movement is constrained.
• Color reflects confirmed state: The histogram uses persistence filtering — a state must hold for N bars before the color changes, preventing false signals from noise.
🔹 The 5-Stage Calculation
MPR synthesizes five analytical stages into the final state:
1. Compression Score: Measures how tight the current range is relative to ATR. High compression suggests structural forces are pinning price.
2. Follow-Through Score: Measures price path efficiency (MER-style). Efficient moves indicate genuine directional flow, not chop.
3. Stress Score: Detects effort-without-result (ERD-style). High volume or range with no price progress = absorption.
4. Composite Pressure: Combines follow-through and compression into a single directional score.
5. Persistence Filter: Requires states to hold for configurable bars before confirming, eliminating flickering.
█ SETTINGS
Core Settings
• ATR Length: Period for volatility normalization. Default 14.
• Baseline Lookback: Period for compression and efficiency baselines. Default 20.
• Volume Average Length: Period for stress calculation baseline. Default 20.
State Classification
• Release Threshold: Pressure score above this = Release. Default +5.
• Suppressed Threshold: Pressure score below this = Suppressed. Default -5.
• Trap Threshold: Stress score above this (with low follow-through) = Trap. Default 30.
• Persistence Bars: Bars required to confirm state change. Default 3.
• Stability Lookback: Period for stability calculation. Default 20.
• Stability Threshold: Below this = forced Transition state. Default 0.5.
Visual Settings
• Show Pressure Histogram: Display the main pressure score histogram.
• Show Zero Line: Display the zero reference line.
• Show Background Tint: Subtle background color by state (default OFF).
Data Window
• Show Data Window Values: Export all calculated scores for analysis.
█ INTERPRETATION GUIDE
When to Use Trend Strategies (Release):
• Histogram tall and positive
• Teal coloring confirmed
• Price making efficient higher highs or lower lows
When to Use Mean Reversion (Suppressed):
• Histogram flat or negative
• Grey coloring confirmed
• Price oscillating without follow-through
When to Wait (Transition):
• Amber coloring
• Mixed signals — don't force trades
• Wait for state to resolve
When to Expect Reversals (Trap):
• Magenta coloring
• High volume moves that don't stick
• Often occurs at structural inflection points
█ COMPLEMENTARY TOOLS
MPR pairs well with:
• Volatility State Index (VSI) — Confirms whether volatility is expanding into the pressure regime
• Effort-Result Divergence (ERD) — Provides bar-by-bar absorption/vacuum detection
• Market Efficiency Ratio (MER) — Validates follow-through quality
█ SUITABLE MARKETS
Works across all liquid markets:
• Equities: SPY, QQQ, liquid single stocks
• Futures: ES, NQ, CL, GC
• Crypto: BTC, ETH
• Forex: Major pairs
Works on any timeframe, but 1H–Daily provides cleanest regime classification. Intraday (5m–15m) useful for session-level tactical decisions.
█ OPEN SOURCE
This indicator is open-source for educational purposes. Review the code to understand the full calculation methodology.
█ DISCLAIMER
This indicator is for educational and informational purposes only. It does not constitute financial advice. Past performance does not guarantee future results. Always conduct your own analysis and use proper risk management.

ema200 filler═══════════════════════════════════════════════════════════════
TRADINGVIEW INDICATOR DESCRIPTION
═══════════════════════════════════════════════════════════════
TITLE: EMA 200 Filler - Visual Trend Indicator
SHORT DESCRIPTION:
Instantly see trend direction with color-coded shading between price and the 200 EMA. Green above = bullish, Red below = bearish.
═══════════════════════════════════════════════════════════════
MAIN DESCRIPTION
═══════════════════════════════════════════════════════════════
🎨 SEE THE TREND AT A GLANCE
This elegant indicator fills the space between price and the 200-period Exponential Moving Average (EMA) with color-coded shading, making trend direction instantly obvious without any analysis required.
✨ KEY FEATURES:
• Visual Trend Clarity - Green fill = bullish zone, Red fill = bearish zone
• EMA 200 Line - The institutional trader's favorite trend indicator
• Dynamic Shading - Fill automatically adjusts as price moves
• Clean Design - Semi-transparent fills won't clutter your chart
• Zero Configuration - Works perfectly right out of the box
• Universal Application - Works on any timeframe, any asset
📊 WHAT YOU SEE:
🟢 GREEN SHADED AREA
→ Price is ABOVE the 200 EMA
→ Bullish trend in effect
→ Look for LONG opportunities
🔴 RED SHADED AREA
→ Price is BELOW the 200 EMA
→ Bearish trend in effect
→ Look for SHORT opportunities
🔵 BLUE LINE = 200 EMA
→ The dividing line between bull and bear zones
→ Major support/resistance level
→ Institutional trend filter
💡 WHY THE 200 EMA MATTERS:
The 200-period EMA is one of the most widely watched technical indicators by:
✓ Institutional traders and hedge funds
✓ Day traders and swing traders
✓ Algorithmic trading systems
✓ Technical analysis professionals
When millions of traders watch the same level, it becomes a self-fulfilling prophecy - making it incredibly powerful for entries, exits, and stop placement.
🎯 TRADING APPLICATIONS:
✓ **Trend Filter** - Only take longs in green, shorts in red
✓ **Trend Confirmation** - Strong trends stay on one side for extended periods
✓ **Reversal Signals** - Watch for crossovers when price crosses the 200 EMA
✓ **Support/Resistance** - 200 EMA acts as dynamic support in uptrends, resistance in downtrends
✓ **Stay Out Zones** - Avoid trading when price chops around the 200 EMA (mixed colors)
📈 PERFECT FOR:
✓ Swing traders who need clear trend direction
✓ Day traders using the 200 EMA as a filter
✓ Beginners who want simple trend identification
✓ Multi-timeframe analysis (check higher timeframe trend)
✓ Anyone who wants cleaner charts with instant trend clarity
⚙️ WORKS WITH:
• All asset classes (stocks, forex, crypto, commodities, indices)
• All timeframes (1-minute to monthly charts)
• Combines perfectly with other indicators
• No special settings required - just add and trade
🌟 CLEAN & PROFESSIONAL:
• Semi-transparent fills (70% opacity) - won't hide candles or other indicators
• White price line for clear visibility
• Blue EMA line - industry standard color
• Minimalist design philosophy
🚀 INSTANT SETUP:
1. Add indicator to chart
2. Start trading with the trend
3. That's it - no configuration needed!
The simplest way to visualize trend direction. When you see green, think bullish. When you see red, think bearish. Trading doesn't get more straightforward than this.
═══════════════════════════════════════════════════════════════
CATEGORIES:
• Trend Analysis
• Moving Averages
• Overlays
TAGS:
ema, ema 200, moving average, trend indicator, trend filter, visual indicator, exponential moving average, 200 ema, trend following, color coded, bullish bearish
═══════════════════════════════════════════════════════════════
QUICK START GUIDE
═══════════════════════════════════════════════════════════════
🚀 QUICK START - EMA 200 Filler
──────────────────────────────────────────────────────────────
STEP 1: ADD TO CHART
──────────────────────────────────────────────────────────────
1. Open TradingView
2. Load any chart (stocks, forex, crypto - anything!)
3. Click "Indicators" button at top
4. Search: "EMA 200 Filler"
5. Click to add
You're done! No settings to adjust.
──────────────────────────────────────────────────────────────
STEP 2: UNDERSTAND THE COLORS
──────────────────────────────────────────────────────────────
The indicator fills the space between PRICE and the 200 EMA:
🟢 GREEN FILL = BULLISH ZONE
• Price is above the 200 EMA
• Uptrend is active
• Bias: Look for LONG entries only
🔴 RED FILL = BEARISH ZONE
• Price is below the 200 EMA
• Downtrend is active
• Bias: Look for SHORT entries only
🔵 BLUE LINE = 200 EMA
• The trend dividing line
• Acts as support in uptrends
• Acts as resistance in downtrends
──────────────────────────────────────────────────────────────
STEP 3: BASIC TRADING RULES
──────────────────────────────────────────────────────────────
📈 RULE #1: TRADE WITH THE COLOR
In GREEN zone:
→ Only look for LONG setups
→ Buy dips toward the 200 EMA
→ Avoid shorting against the trend
In RED zone:
→ Only look for SHORT setups
→ Sell rallies toward the 200 EMA
→ Avoid longing against the trend
──────────────────────────────────────────────────────────────
🎯 RULE #2: USE THE 200 EMA AS SUPPORT/RESISTANCE
In GREEN (uptrend):
→ 200 EMA acts as SUPPORT
→ Price bouncing off 200 EMA = buy opportunity
→ Price breaking BELOW 200 EMA = trend change warning
In RED (downtrend):
→ 200 EMA acts as RESISTANCE
→ Price rejecting at 200 EMA = sell opportunity
→ Price breaking ABOVE 200 EMA = trend change warning
──────────────────────────────────────────────────────────────
⚠️ RULE #3: AVOID THE CHOP ZONE
When price keeps crossing the 200 EMA (color changing frequently):
→ Market is RANGING, not trending
→ Stay out or reduce position size
→ Wait for a clear trend to establish
──────────────────────────────────────────────────────────────
STEP 4: TRADING STRATEGIES
──────────────────────────────────────────────────────────────
✅ STRATEGY #1: TREND FOLLOWING (PULLBACK ENTRIES)
Wait for GREEN zone (bullish trend):
1. Price pulls back toward the 200 EMA (blue line)
2. Look for bullish reversal candle near 200 EMA
3. Enter LONG
4. Stop below 200 EMA
5. Hold while in green zone
Example:
• Chart shows green shading
• Price dips to 200 EMA and bounces
• Enter long at bounce confirmation
• Stop 5-10 pips below 200 EMA
• Exit when price crosses back below 200 EMA (turns red)
──────────────────────────────────────────────────────────────
✅ STRATEGY #2: BREAKOUT TRADING (TREND CHANGE)
Watch for color change (crossover):
GREEN → RED (bearish reversal):
1. Price crosses below 200 EMA
2. Fill turns from green to red
3. Enter SHORT on next pullback to 200 EMA
4. Stop above 200 EMA
5. Ride the new downtrend
RED → GREEN (bullish reversal):
1. Price crosses above 200 EMA
2. Fill turns from red to green
3. Enter LONG on next pullback to 200 EMA
4. Stop below 200 EMA
5. Ride the new uptrend
──────────────────────────────────────────────────────────────
✅ STRATEGY #3: HIGHER TIMEFRAME FILTER
Use this indicator on a HIGHER timeframe as a filter:
Example for day trading:
• Add indicator to DAILY chart
• Check the color: Green or Red?
• Switch back to your trading timeframe (5m, 15m, etc.)
• Only take trades in the direction of daily trend
If daily = GREEN → Only take longs on lower timeframes
If daily = RED → Only take shorts on lower timeframes
This keeps you aligned with the bigger trend!
──────────────────────────────────────────────────────────────
STEP 5: REAL TRADING EXAMPLES
──────────────────────────────────────────────────────────────
📊 EXAMPLE #1: LONG ENTRY IN UPTREND
Chart: SPY on 1-hour timeframe
Indicator: Green fill (price above 200 EMA)
Setup:
• Price at 450, 200 EMA at 445
• Green shading shows bullish trend
• Price pulls back to 446 (near 200 EMA)
• Bullish hammer candle forms at 200 EMA
Trade:
→ Enter LONG at 446.50
→ Stop at 444.50 (below 200 EMA)
→ Target: Previous high at 452
→ Risk: 2 points | Reward: 5.50 points = 2.75:1 R/R
──────────────────────────────────────────────────────────────
📊 EXAMPLE #2: SHORT ENTRY IN DOWNTREND
Chart: EUR/USD on 4-hour timeframe
Indicator: Red fill (price below 200 EMA)
Setup:
• Price at 1.0850, 200 EMA at 1.0900
• Red shading shows bearish trend
• Price rallies to 1.0895 (near 200 EMA)
• Bearish rejection candle at 200 EMA
Trade:
→ Enter SHORT at 1.0890
→ Stop at 1.0910 (above 200 EMA)
→ Target: 1.0820 (recent support)
→ Risk: 20 pips | Reward: 70 pips = 3.5:1 R/R
──────────────────────────────────────────────────────────────
📊 EXAMPLE #3: AVOID THE CHOP
Chart: Bitcoin on 15-minute timeframe
Indicator: Color keeps changing (green/red/green/red)
Observation:
• Price crossed 200 EMA 4 times in 2 hours
• No clear trend established
• Whipsaw action
Action:
→ STAY OUT - wait for clear trend
→ Check higher timeframe for direction
→ Come back when one color dominates
──────────────────────────────────────────────────────────────
STEP 6: PRO TIPS
──────────────────────────────────────────────────────────────
💡 **Combine with Price Action**
Don't just enter because it's green - wait for bullish candle patterns (hammer, engulfing, etc.) at the 200 EMA for high-probability setups.
💡 **Respect the 200 EMA**
The longer price stays on one side, the stronger that side becomes. A stock green for months has strong bullish momentum.
💡 **Watch Volume at Crossovers**
When price crosses the 200 EMA with HIGH volume = strong signal
Low volume crossover = might be false breakout
💡 **Use Multiple Timeframes**
• Daily chart = overall trend direction
• 4H chart = swing trade setups
• 1H chart = day trade entries
Always align smaller timeframe trades with larger timeframe color!
💡 **Strongest Setups = Clean Trends**
Best trades happen when:
• Chart stays ONE color for extended period
• Price respects 200 EMA as support/resistance
• No frequent crossovers
──────────────────────────────────────────────────────────────
COMMON QUESTIONS
──────────────────────────────────────────────────────────────
❓ "What if price crosses the 200 EMA frequently?"
→ That's a ranging market. Stay out or trade smaller size. Wait for a clear trend.
❓ "Can I change the colors?"
→ Not in this version, but green/red is universal and intuitive.
❓ "Does this work on all timeframes?"
→ Yes! But longer timeframes (4H, Daily) tend to give cleaner signals.
❓ "Should I always use the 200 EMA?"
→ The 200 is the institutional standard. Stick with it for consistency.
❓ "What about the 50 or 20 EMA?"
→ You can add those separately. This indicator focuses on the proven 200 EMA.
──────────────────────────────────────────────────────────────
THE GOLDEN RULE
──────────────────────────────────────────────────────────────
🟢 GREEN = GO LONG (or stay long)
🔴 RED = GO SHORT (or stay short)
🔄 FREQUENT CHANGES = STAY OUT
It's that simple. The trend is your friend - this indicator just makes it impossible to miss!
──────────────────────────────────────────────────────────────
Happy Trading! 📈
──────────────────────────────────────────────────────────────

ODTE Layman Signals 📌 Script Name
Layman Options Signals – Structured BUY CALL / BUY PUT with SL & TP
📖 Overview
This indicator is a complete, finished intraday trading system designed to simplify options trading (including 0DTE and weekly options) by converting price action and market structure into clear, actionable signals.
The script performs all analysis in the background and displays only what the trader needs to execute consistently:
BUY CALL or BUY PUT
Predefined Stop Loss (SL)
Two Take Profit levels (TP1 and TP2)
Trade status and levels displayed in a live status box
The focus of this tool is execution discipline, not prediction.
🧠 Core Concepts Used (What Makes This Script Original)
This script combines multiple price-action concepts into a single, rule-based framework:
1️⃣ Opening Range Breakout (ORB)
The script calculates the opening range high and low using the first X minutes of the regular session.
Trades are only allowed above ORB high for CALLs and below ORB low for PUTs.
This filters low-quality trades during early chop.
2️⃣ Market Structure Confirmation
CALL trades require higher highs and higher lows
PUT trades require lower lows and lower highs
This prevents trading against structure.
3️⃣ Retest & Liquidity Sweep Validation
Breakouts are validated using:
ORB retests (price accepts above/below the range)
Liquidity sweeps (false breakouts that trap traders)
This helps reduce fake breakouts.
4️⃣ Volatility-Aware Risk Management
Stop losses are placed using market structure + ATR buffer
This avoids stops being placed at obvious levels.
5️⃣ Multi-Target Trade Management
TP1 = partial profit (risk reduction)
TP2 = runner target (trend continuation)
After TP1, stop loss can move to breakeven (optional)
6️⃣ Discipline Controls
Only one active trade at a time
Cooldown period after a stop loss
Prevents over-trading and revenge trading
📊 What the Indicator Displays
The script plots the following directly on the chart:
Entry level
Stop Loss (SL)
Take Profit 1 (TP1)
Take Profit 2 (TP2)
Opening Range High & Low
It also includes a Status Box that always shows one of the following states:
WAIT
BUY CALL
BUY PUT
IN TRADE
COOLDOWN
This allows traders to understand the current state at a glance without reading code.
▶️ How to Use the Indicator
Recommended Timeframes
1-minute or 2-minute charts
Intraday use only
Entry Rules
When BUY CALL appears → Buy an ATM or slightly ITM call
When BUY PUT appears → Buy an ATM or slightly ITM put
Risk Management
Exit immediately if price hits the SL line
Take partial profits at TP1
Hold remaining position for TP2 if conditions allow
When Status Shows WAIT or COOLDOWN
No trade should be taken
⚙️ Recommended Instruments
SPY / QQQ
Liquid large-cap stocks
Intraday options (0DTE / weeklies)
⚠️ Important Disclaimer
This script is provided for educational purposes only.
It is not financial advice
It does not guarantee profits
It does not place trades automatically
Options trading involves significant risk
Always test using paper trading or small size before live use.
🎯 Who This Script Is For
✔ Traders who want clear rules
✔ Traders who prefer price action over indicators
✔ Options traders who value risk management
✔ Users who want less chart clutter and more discipline
❌ Not intended for swing trading
❌ Not intended for automated trading systems
🧩 Final Notes
This is a complete, finished indicator, not a test or experimental script.
All logic is deterministic, non-repainting, and designed for real-time use.
The philosophy behind this tool is simple:
Good trading comes from structure, discipline, and risk control — not prediction.

Volume Weighted Initial Balance This indicator dynamically calculates and plots a Volume-Weighted Initial Balance (VW-IB) for U.S. equity trading sessions (Regular Trading Hours: 9:30–16:00 ET). Unlike traditional time-based Initial Balance (fixed first 30/60 minutes), this version ends the IB formation when a user-defined percentage of the 20-day Average Daily Volume (ADV) is reached – providing a more adaptive, market-activity-driven range that better reflects actual participation.
Key Concepts and Methodology:
- 20-day Average Daily Volume (ADV20) is calculated using daily volume from the security's daily timeframe.
- A customizable target volume percentage (default 25%, adjustable 10–50%) determines the threshold (e.g., 25% of ADV20).
- The Initial Balance period begins at 9:30 AM ET and accumulates intrabar volume in real time.
- The IB completes on the first bar where either:
- Cumulative volume since open reaches or exceeds the target, OR
- A safety time cap (default 30 minutes, adjustable 15–60) is hit.
- Once complete, the script locks in the high and low of the IB period and plots them as horizontal lines.
- Additionally, it maintains a rolling 20-day history of prior IB ranges and computes their average. This average range is projected as a centered band around today's 9:30 open price, giving traders a statistical expectation of "normal" early-session volatility based on recent behavior.
Visual Features:
- Solid green/red lines for today's completed IB high and low.
- Blue circled lines and lightly filled band showing the 20-day average IB projection (centered on actual 9:30 open price).
- Subtle background shading while the IB is still forming.
- A clean top-right table displaying live status: completion state, today's IB range, 20-day average range, ADV20, and volume target.
- A label appears at completion showing exact range, minutes taken, and volume reached.
Usage Ideas:
- Use the VW-IB high/low as early support/resistance or breakout levels.
- Compare today's actual IB range to the 20-day average band for expansion/contraction context (wide today = high volatility day potential).
- Ideal for day traders on stocks, ETFs, or futures with clear RTH sessions (e.g., ES, NQ, SPY, QQQ, AAPL).
- Built-in alert fires only once per day when the VW-IB completes.
This is not a simple replication of fixed-time Initial Balance indicators. The volume-weighted termination (instead of rigid clock time), combined with real-time intrabar volume accumulation, safety time cap, rolling 20-day average projection band centered on actual open, and comprehensive live table, makes it uniquely adaptive and informative.

Minervini Scanner [MarketSmith RS] (up to 40 tickers)"Find the Leaders. Ignore the Laggards."
This dashboard is a complete Trend & Momentum Command Center designed to replicate the manual screening process of top growth traders like Mark Minervini and William O'Neil. It scans up to 40 tickers simultaneously to identify "Stage 2" super-performance candidates while filtering out broken trends and "zombie" stocks.
Core Features
1. The "Trend Template" Engine The scanner automatically checks every ticker against 7 strict trend criteria to verify a healthy Stage 2 Uptrend:
Price > 150-Day & 200-Day Moving Averages.
150-Day MA > 200-Day MA.
200-Day MA is Trending Up (at least 1 month).
50-Day MA > 150-Day & 200-Day MAs.
Price > 50-Day MA (Momentum Check).
Price > 25% above 52-Week Low.
Price within 25% of 52-Week High.
2. Institutional RS Rating (0-99) Unlike standard "Relative Strength" indicators that just compare price to SPY, this script uses the IBD/MarketSmith Methodology:
Weighted Performance: It calculates a composite score based on price performance over the last 12 months, with a heavy 40% weight on the most recent quarter.
Percentile Proxy: It maps this weighted score to a 1-99 rating scale using fixed constants derived from historical market leader data.
90-99 (Blue): Market Leaders (Top 10%).
80-89 (Green): Institutional Candidates.
< 70 (Red): Laggards.
How to Read the Dashboard
STAGE 2 (Lime Green): The "Holy Grail" signal. The stock meets 7/7 trend criteria. It is fundamentally sound and ready for a setup (like a VCP).
SETTING UP (Yellow): Score 5/7 or 6/7. The trend is developing but not perfect (e.g., 200MA might still be flat). Watch for improvements.
AVOID (Maroon): Broken trend. Moving averages are stacked downward. Do not trade long.
RS Rating: Look for the "Power Combo": A STAGE 2 trend status combined with an RS Rating of 80+. This indicates the stock is not only going up but is outperforming the vast majority of the market.
Settings & Customization
40-Ticker Watchlist: Monitor your entire focus list in one panel.
Adjustable Constants: You can fine-tune the RS Rating thresholds (p99, p90) to adapt to Bull or Bear market volatility.
MA Type: Switch between SMA (Simple) and EMA (Exponential) moving averages.
Disclaimer: This tool provides technical analysis data, not financial advice. Always manage risk.

Trading Volatility Clock⏰ TRADING VOLATILITY CLOCK - Know When the Action Happens (Anywhere in the World)
A real-time session tracker with multi-timezone support for active traders who need to know when US market volatility strikes - no matter where they are in the world. Perfect for day traders, scalpers, and anyone trading liquid US markets.
══════════════════════════════════════════════════════
📊 WHAT IT DOES
This indicator displays a live clock showing:
- Current time in YOUR selected timezone (10 major timezones supported)
- Active US market session with color-coded volatility levels
- Countdown timer showing time remaining in current session
- Preview of the next upcoming session
- Optional alerts when entering high-volatility periods
══════════════════════════════════════════════════════
🌍 MULTI-TIMEZONE SUPPORT
SESSIONS ALWAYS TRACK US MARKET HOURS (Eastern Time):
No matter which timezone you select, the sessions always trigger at the correct US market times. Perfect for international traders who want to:
• See their local time while tracking US market sessions
• Know exactly when US volatility hits in their timezone
• Plan their trading day around US market hours
SUPPORTED TIMEZONES:
• America/New_York (ET) - Eastern Time
• America/Chicago (CT) - Central Time
• America/Los_Angeles (PT) - Pacific Time
• Europe/London (GMT) - Greenwich Mean Time
• Europe/Berlin (CET) - Central European Time
• Asia/Tokyo (JST) - Japan Standard Time
• Asia/Shanghai (CST) - China Standard Time
• Asia/Hong_Kong (HKT) - Hong Kong Time
• Australia/Sydney (AEDT) - Australian Eastern Time
• UTC - Coordinated Universal Time
EXAMPLE: A trader in Tokyo selects "Asia/Tokyo"
• Clock shows: 11:30 PM JST
• Session shows: "Opening Drive" 🔥 HIGH
• They know: US market just opened (9:30 AM ET in New York)
══════════════════════════════════════════════════════
🎯 WHY IT'S USEFUL
Whether you trade futures, high-volume stocks, or ETFs, volatility isn't constant throughout the day. Knowing WHEN to expect movement is critical:
🔥 HIGH VOLATILITY (Red):
• Opening Drive (9:30-10:30 AM ET) - Highest volume of the day
• Power Hour (3:00-4:00 PM ET) - Second-highest volume, final push
⚡ MEDIUM VOLATILITY (Yellow):
• Pre-Market (8:00-9:30 AM ET) - Building momentum
• Lunch Return (1:00-2:00 PM ET) - Traders returning
• Afternoon Session (2:00-3:00 PM ET) - Trend continuation
• After Hours (4:00-5:00 PM ET) - News reactions
💤 LOW VOLATILITY (Gray):
• Overnight Grind (12:00-8:00 AM ET) - Thin volume
• Mid-Morning Chop (10:30-11:30 AM ET) - Ranges form
• Lunch Hour (11:30 AM-1:00 PM ET) - Dead zone
• Evening Fade (5:00-8:00 PM ET) - Volume dropping
══════════════════════════════════════════════════════
⚙️ CUSTOMIZATION OPTIONS
TIMEZONE SETTINGS:
• Select from 10 major timezones worldwide
• Clock automatically displays in your local time
• Sessions remain locked to US market hours
SESSION TIME CUSTOMIZATION:
• Every session boundary is adjustable (in minutes from midnight ET)
• Perfect for traders who define sessions differently
• Advanced users can create custom volatility schedules
DISPLAY OPTIONS:
• Toggle next session preview on/off
• Enable/disable high volatility alerts
• Clean, unobtrusive table display in top-right corner
══════════════════════════════════════════════════════
💡 HOW TO USE
1. Add indicator to any chart (works on all timeframes)
2. Select your timezone in Settings → Timezone Settings
3. Set your chart to 1-minute timeframe for real-time updates
4. Customize session times if needed (Settings → Session Time Customization)
5. Watch the top-right corner for live session tracking
TRADING APPLICATIONS:
• Avoid trading during dead zones (lunch hour, mid-morning chop)
• Increase position size during high volatility windows
• Set alerts for Opening Drive and Power Hour
• Plan your trading day around US market volatility schedule
• International traders can track US sessions in their local time
══════════════════════════════════════════════════════
🎓 EDUCATIONAL VALUE
This indicator teaches traders:
• Market microstructure and volume patterns
• Why certain times produce better opportunities
• How institutional flows create intraday patterns
• The importance of timing in active trading
• How to adapt US market trading to any timezone
══════════════════════════════════════════════════════
⚠️ IMPORTANT NOTES
- Works best on 1-minute charts for frequent updates
- Sessions are ALWAYS based on US Eastern Time (ET)
- Timezone selection only changes the clock display
- Clock updates when new bar closes (not tick-by-tick)
- Alerts trigger once per bar when enabled
- Perfect for international traders tracking US markets
══════════════════════════════════════════════════════
📈 BEST USED WITH
- High-volume US stocks: TSLA, NVDA, AAPL, AMD, META
- Major US ETFs: SPY, QQQ, IWM, DIA
- US Futures: ES, NQ, RTY, YM, MES, MNQ
- Any liquid US instrument with clear intraday volume patterns
══════════════════════════════════════════════════════
🌏 FOR INTERNATIONAL TRADERS
This tool is specifically designed for traders outside the US who need to:
• Track US market sessions in their local timezone
• Know when to be at their desk for US volatility
• Avoid waking up for low-volatility periods
• Maximize trading efficiency around US market hours
No more timezone confusion. No more missing the opening bell. Just set your timezone and trade with confidence.
══════════════════════════════════════════════════════
This is an open-source educational tool. Feel free to modify and adapt to your trading style!
Happy Trading! 🚀

Market Regime# MARKET REGIME IDENTIFICATION & TRADING SYSTEM
## Complete User Guide
---
## 📋 TABLE OF CONTENTS
1. (#overview)
2. (#regimes)
3. (#indicator-usage)
4. (#entry-signals)
5. (#exit-signals)
6. (#regime-strategies)
7. (#confluence)
8. (#backtesting)
9. (#optimization)
10. (#examples)
---
## OVERVIEW
### What This System Does
This is a **complete market regime identification and trading system** that:
1. **Identifies 6 distinct market regimes** automatically
2. **Adapts trading tactics** to each regime
3. **Provides high-probability entry signals** with confluence scoring
4. **Shows optimal exit points** for each trade
5. **Can be backtested** to validate performance
### Two Components Provided
1. **Indicator** (`market_regime_indicator.pine`)
- Visual regime identification
- Entry/exit signals on chart
- Dynamic support/resistance
- Info tables with live data
- Use for manual trading
2. **Strategy** (`market_regime_strategy.pine`)
- Fully automated backtestable version
- Same logic as indicator
- Position sizing and risk management
- Performance metrics
- Use for backtesting and automation
---
## THE 6 MARKET REGIMES
### 1. 🟢 BULL TRENDING
**Characteristics:**
- Strong uptrend
- Price above SMA50 and SMA200
- ADX > 25 (strong trend)
- Higher highs and higher lows
- DI+ > DI- (bullish momentum)
**What It Means:**
- Market has clear upward direction
- Buyers in control
- Pullbacks are buying opportunities
- Strongest regime for long positions
**How to Trade:**
- ✅ **BUY dips to EMA20 or SMA20**
- ✅ Enter when RSI < 60 on pullback
- ✅ Hold through minor corrections
- ❌ Don't short against the trend
- ❌ Don't sell too early
**Expected Behavior:**
- Pullbacks are shallow (5-10%)
- Bounces are strong
- Support at moving averages holds
- Volume increases on rallies
---
### 2. 🔴 BEAR TRENDING
**Characteristics:**
- Strong downtrend
- Price below SMA50 and SMA200
- ADX > 25 (strong trend)
- Lower highs and lower lows
- DI- > DI+ (bearish momentum)
**What It Means:**
- Market has clear downward direction
- Sellers in control
- Rallies are selling opportunities
- Strongest regime for short positions
**How to Trade:**
- ✅ **SELL rallies to EMA20 or SMA20**
- ✅ Enter when RSI > 40 on bounce
- ✅ Hold through minor bounces
- ❌ Don't buy against the trend
- ❌ Don't cover shorts too early
**Expected Behavior:**
- Rallies are weak (5-10%)
- Selloffs are strong
- Resistance at moving averages holds
- Volume increases on declines
---
### 3. 🔵 BULL RANGING
**Characteristics:**
- Bullish bias but consolidating
- Price near or above SMA50
- ADX < 20 (weak trend)
- Trading in range
- Choppy price action
**What It Means:**
- Uptrend is pausing
- Accumulation phase
- Support and resistance zones clear
- Lower volatility
**How to Trade:**
- ✅ **BUY at support zone**
- ✅ Enter when RSI < 40
- ✅ Take profits at resistance
- ⚠️ Smaller position sizes
- ⚠️ Tighter stops
**Expected Behavior:**
- Range-bound oscillations
- Support bounces repeatedly
- Resistance rejections common
- Eventually breaks higher (usually)
---
### 4. 🟠 BEAR RANGING
**Characteristics:**
- Bearish bias but consolidating
- Price near or below SMA50
- ADX < 20 (weak trend)
- Trading in range
- Choppy price action
**What It Means:**
- Downtrend is pausing
- Distribution phase
- Support and resistance zones clear
- Lower volatility
**How to Trade:**
- ✅ **SELL at resistance zone**
- ✅ Enter when RSI > 60
- ✅ Take profits at support
- ⚠️ Smaller position sizes
- ⚠️ Tighter stops
**Expected Behavior:**
- Range-bound oscillations
- Resistance holds repeatedly
- Support bounces are weak
- Eventually breaks lower (usually)
---
### 5. ⚪ CONSOLIDATION
**Characteristics:**
- No clear direction
- Range compression
- Very low ADX (< 15 often)
- Price inside tight range
- Neutral sentiment
**What It Means:**
- Market is coiling
- Building energy for next move
- Indecision between buyers/sellers
- Calm before the storm
**How to Trade:**
- ✅ **WAIT for breakout direction**
- ✅ Enter on high-volume breakout
- ✅ Direction becomes clear
- ❌ Don't trade inside the range
- ❌ Avoid choppy scalping
**Expected Behavior:**
- Narrow range
- Low volume
- False breakouts possible
- Explosive move when it breaks
---
### 6. 🟣 CHAOS (High Volatility)
**Characteristics:**
- Extreme volatility
- No clear direction
- Erratic price swings
- ATR > 2x average
- Unpredictable
**What It Means:**
- Market panic or euphoria
- News-driven moves
- Emotion dominates logic
- Highest risk environment
**How to Trade:**
- ❌ **STAY OUT!**
- ❌ No positions
- ❌ Wait for stability
- ✅ Protect existing positions
- ✅ Reduce risk
**Expected Behavior:**
- Large intraday swings
- Gaps up/down
- Stop hunts
- Whipsaws
- Eventually calms down
---
## INDICATOR USAGE
### Visual Elements
#### 1. Background Colors
- **Light Green** = Bull Trending (go long)
- **Light Red** = Bear Trending (go short)
- **Light Teal** = Bull Ranging (buy dips)
- **Light Orange** = Bear Ranging (sell rallies)
- **Light Gray** = Consolidation (wait)
- **Purple** = Chaos (stay out!)
#### 2. Regime Labels
- Appear when regime changes
- Show new regime name
- Positioned at highs (bullish) or lows (bearish)
#### 3. Entry Signals
- **Green "LONG"** labels = Buy here
- **Red "SHORT"** labels = Sell here
- Number shows confluence score (X/5 signals)
- Hover for details (stop, target, RSI, etc.)
#### 4. Exit Signals
- **Orange "EXIT LONG"** = Close long position
- **Orange "EXIT SHORT"** = Close short position
- Shows exit reason in tooltip
#### 5. Support/Resistance Lines
- **Green line** = Dynamic support (buy zone)
- **Red line** = Dynamic resistance (sell zone)
- Adapts to regime automatically
#### 6. Moving Averages
- **Blue** = SMA 20 (short-term trend)
- **Orange** = SMA 50 (medium-term trend)
- **Purple** = SMA 200 (long-term trend)
### Information Tables
#### Top Right Table (Main Info)
Shows real-time market conditions:
- **Current Regime** - What regime we're in
- **Bias** - Long, Short, Breakout, or Stay Out
- **ADX** - Trend strength (>25 = strong)
- **Trend** - Strong, Moderate, or Weak
- **Volatility** - High or Normal
- **Vol Ratio** - Current vs average volatility
- **RSI** - Momentum (>70 overbought, <30 oversold)
- **vs SMA50/200** - Price position relative to MAs
- **Support/Resistance** - Exact price levels
- **Long/Short Signals** - Confluence scores (X/5)
#### Bottom Right Table (Regime Guide)
Quick reference for each regime:
- What action to take
- What strategy to use
- Color-coded for quick identification
---
## ENTRY SIGNALS EXPLAINED
### Confluence Scoring System (5 Factors)
Each entry signal is scored 0-5 based on how many factors align:
#### For LONG Entries:
1. ✅ **Regime Alignment** - In Bull Trending or Bull Ranging
2. ✅ **RSI Pullback** - RSI between 35-50 (not overbought)
3. ✅ **Near Support** - Price within 2% of dynamic support
4. ✅ **MACD Turning Up** - Momentum shifting bullish
5. ✅ **Volume Confirmation** - Above average volume
#### For SHORT Entries:
1. ✅ **Regime Alignment** - In Bear Trending or Bear Ranging
2. ✅ **RSI Rejection** - RSI between 50-65 (not oversold)
3. ✅ **Near Resistance** - Price within 2% of dynamic resistance
4. ✅ **MACD Turning Down** - Momentum shifting bearish
5. ✅ **Volume Confirmation** - Above average volume
### Confluence Requirements
**Minimum Confluence** (default = 2):
- 2/5 = Entry signal triggered
- 3/5 = Good signal
- 4/5 = Strong signal
- 5/5 = Excellent signal (rare)
**Higher confluence = Higher probability = Better trades**
### Specific Entry Patterns
#### 1. Bull Trending Entry
```
Requirements:
- Regime = Bull Trending
- Price pulls back to EMA20
- Close above EMA20 (bounce)
- Up candle (close > open)
- RSI < 60
- Confluence ≥ 2
```
#### 2. Bear Trending Entry
```
Requirements:
- Regime = Bear Trending
- Price rallies to EMA20
- Close below EMA20 (rejection)
- Down candle (close < open)
- RSI > 40
- Confluence ≥ 2
```
#### 3. Bull Ranging Entry
```
Requirements:
- Regime = Bull Ranging
- RSI < 40 (oversold)
- Price at or below support
- Up candle (reversal)
- Confluence ≥ 1 (more lenient)
```
#### 4. Bear Ranging Entry
```
Requirements:
- Regime = Bear Ranging
- RSI > 60 (overbought)
- Price at or above resistance
- Down candle (rejection)
- Confluence ≥ 1 (more lenient)
```
#### 5. Consolidation Breakout
```
Requirements:
- Regime = Consolidation
- Price breaks above/below range
- Volume > 1.5x average (explosive)
- Strong directional candle
```
---
## EXIT SIGNALS EXPLAINED
### Three Types of Exits
#### 1. Regime Change Exits (Automatic)
- **Long Exit**: Regime changes to Bear Trending or Chaos
- **Short Exit**: Regime changes to Bull Trending or Chaos
- **Reason**: Market character changed, strategy no longer valid
#### 2. Support/Resistance Break Exits
- **Long Exit**: Price breaks below support by 2%
- **Short Exit**: Price breaks above resistance by 2%
- **Reason**: Key level violated, trend may be reversing
#### 3. Momentum Exits
- **Long Exit**: RSI > 70 (overbought) AND down candle
- **Short Exit**: RSI < 30 (oversold) AND up candle
- **Reason**: Overextension, take profits
### Stop Loss & Take Profit
**Stop Loss** (Automatic in strategy):
- Placed at Entry - (ATR × 2)
- Adapts to volatility
- Protected from whipsaws
- Typically 2-4% for stocks, 5-10% for crypto
**Take Profit** (Automatic in strategy):
- Placed at Entry + (Stop Distance × R:R Ratio)
- Default 2.5:1 reward:risk
- Example: $2 risk = $5 reward target
- Allows winners to run
---
## TRADING EACH REGIME
### BULL TRENDING - Most Profitable Long Environment
**Strategy: Buy Every Dip**
**Entry Rules:**
1. Wait for pullback to EMA20 or SMA20
2. Look for RSI < 60
3. Enter when candle closes above MA
4. Confluence should be 2+
**Stop Loss:**
- Below the recent swing low
- Or 2 × ATR below entry
**Take Profit:**
- At previous high
- Or 2.5:1 R:R minimum
**Position Size:**
- Can use full size (2% risk)
- High win rate regime
**Example Trade:**
```
Price: $100, pulls back to $98 (EMA20)
Entry: $98.50 (close above EMA)
Stop: $96.50 (2 ATR)
Target: $103.50 (2.5:1)
Risk: $2, Reward: $5
```
---
### BEAR TRENDING - Most Profitable Short Environment
**Strategy: Sell Every Rally**
**Entry Rules:**
1. Wait for bounce to EMA20 or SMA20
2. Look for RSI > 40
3. Enter when candle closes below MA
4. Confluence should be 2+
**Stop Loss:**
- Above the recent swing high
- Or 2 × ATR above entry
**Take Profit:**
- At previous low
- Or 2.5:1 R:R minimum
**Position Size:**
- Can use full size (2% risk)
- High win rate regime
**Example Trade:**
```
Price: $100, rallies to $102 (EMA20)
Entry: $101.50 (close below EMA)
Stop: $103.50 (2 ATR)
Target: $96.50 (2.5:1)
Risk: $2, Reward: $5
```
---
### BULL RANGING - Buy Low, Sell High
**Strategy: Range Trading (Long Bias)**
**Entry Rules:**
1. Wait for price at support zone
2. Look for RSI < 40
3. Enter on reversal candle
4. Confluence should be 1-2+
**Stop Loss:**
- Below support zone
- Tighter than trending (1.5 ATR)
**Take Profit:**
- At resistance zone
- Don't hold through resistance
**Position Size:**
- Reduce to 1-1.5% risk
- Lower win rate than trending
**Example Trade:**
```
Range: $95-$105
Entry: $96 (at support, RSI 35)
Stop: $94 (below support)
Target: $104 (at resistance)
Risk: $2, Reward: $8 (4:1)
```
---
### BEAR RANGING - Sell High, Buy Low
**Strategy: Range Trading (Short Bias)**
**Entry Rules:**
1. Wait for price at resistance zone
2. Look for RSI > 60
3. Enter on rejection candle
4. Confluence should be 1-2+
**Stop Loss:**
- Above resistance zone
- Tighter than trending (1.5 ATR)
**Take Profit:**
- At support zone
- Don't hold through support
**Position Size:**
- Reduce to 1-1.5% risk
- Lower win rate than trending
**Example Trade:**
```
Range: $95-$105
Entry: $104 (at resistance, RSI 65)
Stop: $106 (above resistance)
Target: $96 (at support)
Risk: $2, Reward: $8 (4:1)
```
---
### CONSOLIDATION - Wait for Breakout
**Strategy: Breakout Trading**
**Entry Rules:**
1. Identify consolidation range
2. Wait for VOLUME SURGE (1.5x+ avg)
3. Enter on close outside range
4. Direction must be clear
**Stop Loss:**
- Opposite side of range
- Or 2 ATR
**Take Profit:**
- Measure range height, project it
- Example: $10 range = $10 move expected
**Position Size:**
- Reduce to 1% risk
- 50% false breakout rate
**Example Trade:**
```
Consolidation: $98-$102 (4-point range)
Breakout: $102.50 (high volume)
Entry: $103
Stop: $100 (back in range)
Target: $107 (4-point range projected)
Risk: $3, Reward: $4
```
---
### CHAOS - STAY OUT!
**Strategy: Preservation**
**What to Do:**
- ❌ NO new positions
- ✅ Close existing positions if near entry
- ✅ Tighten stops on profitable trades
- ✅ Reduce position sizes dramatically
- ✅ Wait for regime to stabilize
**Why It's Dangerous:**
- Stop hunts are common
- Whipsaws everywhere
- News-driven volatility
- No technical reliability
- Even "perfect" setups fail
**When Does It End:**
- Volatility ratio drops < 1.5
- ADX starts rising (direction appears)
- Price respects support/resistance again
- Usually 1-5 days
---
## CONFLUENCE SYSTEM
### How It Works
The system scores each potential entry on 5 factors. More factors aligning = higher probability.
### Confluence Requirements by Regime
**Trending Regimes** (strictest):
- Minimum 2/5 required
- 3/5 = Good
- 4-5/5 = Excellent
**Ranging Regimes** (moderate):
- Minimum 1-2/5 required
- 2/5 = Good
- 3+/5 = Excellent
**Consolidation** (breakout only):
- Volume is most critical
- Direction confirmation
- Less confluence needed
### Adjusting Minimum Confluence
**If too few signals:**
- Lower from 2 to 1
- More trades, lower quality
**If too many false signals:**
- Raise from 2 to 3
- Fewer trades, higher quality
**Recommendation:**
- Start at 2
- Adjust based on win rate
- Aim for 55-65% win rate
---
## STRATEGY BACKTESTING
### Loading the Strategy
1. Copy `market_regime_strategy.pine`
2. Open Pine Editor in TradingView
3. Paste and "Add to Chart"
4. Strategy Tester tab opens at bottom
### Initial Settings
```
Risk Per Trade: 2%
ATR Stop Multiplier: 2.0
Reward:Risk Ratio: 2.5
Trade Longs: ✓
Trade Shorts: ✓
Trade Trending Only: ✗ (test both)
Avoid Chaos: ✓
Minimum Confluence: 2
```
### What to Look For
**Good Results:**
- Win Rate: 50-60%
- Profit Factor: 1.8-2.5
- Net Profit: Positive
- Max Drawdown: <20%
- Consistent equity curve
**Warning Signs:**
- Win Rate: <45% (too many losses)
- Profit Factor: <1.5 (barely profitable)
- Max Drawdown: >30% (too risky)
- Erratic equity curve (unstable)
### Testing Different Regimes
**Test 1: Trending Only**
```
Trade Trending Only: ✓
Result: Higher win rate, fewer trades
```
**Test 2: All Regimes**
```
Trade Trending Only: ✗
Result: More trades, potentially lower win rate
```
**Test 3: Long Only**
```
Trade Longs: ✓
Trade Shorts: ✗
Result: Works in bull markets
```
**Test 4: Short Only**
```
Trade Longs: ✗
Trade Shorts: ✓
Result: Works in bear markets
```
---
## SETTINGS OPTIMIZATION
### Key Parameters to Adjust
#### 1. Risk Per Trade (Most Important)
- **0.5%** = Very conservative
- **1.0%** = Conservative (recommended for beginners)
- **2.0%** = Moderate (recommended)
- **3.0%** = Aggressive
- **5.0%** = Very aggressive (not recommended)
**Impact:** Higher risk = higher returns BUT bigger drawdowns
#### 2. Reward:Risk Ratio
- **2:1** = More wins needed, hit target faster
- **2.5:1** = Balanced (recommended)
- **3:1** = Fewer wins needed, hold longer
- **4:1** = Very patient, best in trending
**Impact:** Higher R:R = can have lower win rate
#### 3. Minimum Confluence
- **1** = More signals, lower quality
- **2** = Balanced (recommended)
- **3** = Fewer signals, higher quality
- **4** = Very selective
- **5** = Almost never triggers
**Impact:** Higher = fewer but better trades
#### 4. ADX Thresholds
- **Trending: 20-30** (default 25)
- Lower = detect trends earlier
- Higher = only strong trends
- **Ranging: 15-25** (default 20)
- Lower = identify ranging earlier
- Higher = only weak trends
#### 5. Trend Period (SMA)
- **20-50** = Short-term trends
- **50** = Medium-term (default, recommended)
- **100-200** = Long-term trends
**Impact:** Longer period = slower regime changes, more stable
### Optimization Workflow
**Step 1: Baseline**
- Use all default settings
- Test on 3+ years
- Record: Win Rate, PF, Drawdown
**Step 2: Risk Optimization**
- Test 1%, 1.5%, 2%, 2.5%
- Find best risk-adjusted return
- Balance profit vs drawdown
**Step 3: R:R Optimization**
- Test 2:1, 2.5:1, 3:1
- Check which maximizes profit factor
- Consider holding time
**Step 4: Confluence Optimization**
- Test 1, 2, 3
- Find sweet spot for win rate
- Aim for 55-65% win rate
**Step 5: Regime Filter**
- Test with/without trend filter
- Test with/without chaos filter
- Find what works for your asset
---
## REAL TRADING EXAMPLES
### Example 1: Bull Trending - SPY
**Setup:**
- Regime: BULL TRENDING
- Price pulls back from $450 to $445
- EMA20 at $444
- RSI drops to 45
- Confluence: 4/5
**Entry:**
- Price closes at $445.50 (above EMA20)
- LONG signal appears
- Enter at $445.50
**Risk Management:**
- Stop: $443 (2 ATR = $2.50)
- Target: $451.75 (2.5:1 = $6.25)
- Risk: $2.50 per share
- Position: 80 shares (2% of $10k = $200 risk)
**Outcome:**
- Price rallies to $452 in 3 days
- Target hit
- Profit: $6.50 × 80 = $520
- Return: 2.6 × risk (excellent)
---
### Example 2: Bear Ranging - AAPL
**Setup:**
- Regime: BEAR RANGING
- Range: $165-$175
- Price rallies to $174
- Resistance at $175
- RSI at 68
- Confluence: 3/5
**Entry:**
- Rejection candle at $174
- SHORT signal appears
- Enter at $173.50
**Risk Management:**
- Stop: $176 (above resistance)
- Target: $166 (support)
- Risk: $2.50
- Position: 80 shares
**Outcome:**
- Price drops to $167 in 2 days
- Target hit
- Profit: $6.50 × 80 = $520
- Return: 2.6 × risk
---
### Example 3: Consolidation Breakout - BTC
**Setup:**
- Regime: CONSOLIDATION
- Range: $28,000 - $30,000
- Compressed for 2 weeks
- Volume declining
**Breakout:**
- Price breaks $30,000
- Volume surges 200%
- Close at $30,500
- LONG signal
**Entry:**
- Enter at $30,500
**Risk Management:**
- Stop: $29,500 (back in range)
- Target: $32,000 (range height = $2k)
- Risk: $1,000
- Position: 0.2 BTC ($200 risk on $10k)
**Outcome:**
- Price runs to $33,000
- Target exceeded
- Profit: $2,500 × 0.2 = $500
- Return: 2.5 × risk
---
### Example 4: Avoiding Chaos - Tesla
**Setup:**
- Regime: BULL TRENDING
- LONG position from $240
- Elon tweets something crazy
- Regime changes to CHAOS
**Action:**
- EXIT signal appears
- Close position immediately
- Current price: $242 (small profit)
**Outcome:**
- Next 3 days: wild swings
- High $255, Low $230
- By staying out, avoided:
- Potential stop out
- Whipsaw losses
- Stress
**Result:**
- Small profit preserved
- Capital protected
- Re-enter when regime stabilizes
---
## ALERTS SETUP
### Available Alerts
1. **Bull Trending Regime** - Market goes bullish
2. **Bear Trending Regime** - Market goes bearish
3. **Chaos Regime** - High volatility, stay out
4. **Long Entry Signal** - Buy opportunity
5. **Short Entry Signal** - Sell opportunity
6. **Long Exit Signal** - Close long
7. **Short Exit Signal** - Close short
### How to Set Up
1. Click **⏰ (Alert)** icon in TradingView
2. Select **Condition**: Choose indicator + alert type
3. **Options**: Popup, Email, Webhook, etc.
4. **Message**: Customize notification
5. Click **Create**
### Recommended Alert Strategy
**For Active Traders:**
- Long Entry Signal
- Short Entry Signal
- Long Exit Signal
- Short Exit Signal
**For Position Traders:**
- Bull Trending Regime (enter longs)
- Bear Trending Regime (enter shorts)
- Chaos Regime (exit all)
**For Conservative:**
- Only regime change alerts
- Manually review entries
- More selective
---
## TIPS FOR SUCCESS
### 1. Start Small
- Paper trade first
- Then 0.5% risk
- Build to 1-2% over time
### 2. Follow the Regime
- Don't fight it
- Adapt your style
- Different tactics for each
### 3. Trust the Confluence
- 4-5/5 = Best trades
- 2-3/5 = Good trades
- 1/5 = Skip unless desperate
### 4. Respect Exits
- Don't hope and hold
- Cut losses quickly
- Take profits at targets
### 5. Avoid Chaos
- Seriously, just stay out
- Protect your capital
- Wait for clarity
### 6. Keep a Journal
- Record every trade
- Note regime and confluence
- Review weekly
- Learn patterns
### 7. Backtest Thoroughly
- 3+ years minimum
- Multiple market conditions
- Different assets
- Walk-forward test
### 8. Be Patient
- Best setups are rare
- 1-3 trades per week is normal
- Quality over quantity
- Compound over time
---
## COMMON QUESTIONS
**Q: How many trades per month should I expect?**
A: Depends on timeframe and settings. Daily chart: 5-15 trades/month. 4H chart: 15-30 trades/month.
**Q: What's a good win rate?**
A: 55-65% is excellent. 50-55% is good. Below 50% needs adjustment.
**Q: Should I trade all regimes?**
A: Beginners: Only trending. Intermediate: Trending + ranging. Advanced: All except chaos.
**Q: Can I use this on any timeframe?**
A: Best on Daily and 4H. Works on 1H with more noise. Not recommended <1H.
**Q: What if I'm in a trade and regime changes?**
A: Exit immediately (if using indicator) or let strategy handle it automatically.
**Q: How do I know if I'm over-optimizing?**
A: If results are perfect on one period but fail on another. Use walk-forward testing.
**Q: Should I always take 5/5 confluence trades?**
A: Yes, but they're rare (1-2/month). Don't wait only for these.
**Q: Can I combine this with other indicators?**
A: Yes, but keep it simple. RSI, MACD already included. Maybe add volume profile.
**Q: What assets work best?**
A: Liquid stocks, major crypto, futures. Avoid forex spot (use futures), penny stocks.
**Q: How long to hold positions?**
A: Trending: Days to weeks. Ranging: Hours to days. Breakout: Days. Let the regime guide you.
---
## FINAL THOUGHTS
This system gives you:
- ✅ Clear market context (regime)
- ✅ High-probability entries (confluence)
- ✅ Defined exits (automatic signals)
- ✅ Adaptable tactics (regime-specific)
- ✅ Backtestable results (strategy version)
**Success requires:**
- 📚 Understanding each regime
- 🎯 Following the signals
- 💪 Discipline to wait
- 🧠 Emotional control
- 📊 Proper risk management
**Start your journey:**
1. Load the indicator
2. Watch for 1 week (no trading)
3. Identify regime patterns
4. Paper trade for 1 month
5. Go live with small size
6. Scale up as you gain confidence
**Remember:** The market will always be here. There's no rush. Master one regime at a time, and you'll be profitable in all conditions!
Good luck! 🚀

Pair Creation🙏🏻 The one and only pair construction tech you need, unlike others:
Applies one consistent operation to all the data features (not only prices). Then, the script outputs these, so you can apply other calculations on these outputs.
calculates a very fast and native volatility based hedge ratio, that also takes into account point value (think SPY vs ES) so you can easily use it in position sizing
Has built-in forward pricing aka cost of carry model , so you can de-drift pairs from cost of carry, discover spot price of oil based on futures, and ofc find arbitrage opportunities
Also allows to make a pair as a product of 2 series, useful for triangular arbitrage
This script can make a pair in 2 ways:
Ratio, by dividing leg 1 by leg 2
Product, by multiplying leg 1 by leg 2
The real mathematically right way to construct a pair is a ratio/product (Spreads are in fact = 2 legged portfolio, but I ain't told ya that ok). Why? Because a pair of 2 entities has a mathematically unique beauty, it allows direct comparisons and relationship analysis, smth you can't do directly with 3 and more components.
Multiplication (think inversions like (EURUSD -> USDEUR), and use cases for triangular arbitrage) is useful sometimes too.
...
Quickguide:
First, "Legs" are pair components: make a pair of related assets. Don’t be guided exclusively by clustering, cointegrations, mutual information etc. Common sense and exogenous info can easily made them all Forward pricing model: is useful when u work with spot vs futures pairs. Otherwise: put financing, storage and yield all on zeros, this way u will turn it off and have a pure ratio/product of 2 legs.
Look at the 2 numbers on the script’s status line: the first one would always be 1), and the second one is a variable.
First number (always 1) is multiplier for your position size on leg 1
The second number is the multiplier for your position size on leg 2 in the opposite direction.
If both legs are related, trading your sizes with these multipliers makes you do statistical arbitrage -> trading ~ volatility in risk free mode, while the relationship between the assets is still in place.
Also guys srsly, nobody ‘ever’ made a universal law that somewhy somehow for whatever secret conspiracy reason one shall only trade pairs in mean reverting style xd. You can do whatever you want:
Tilt hedge ratio significantly based on relative strength of legs
Trade the pair in momentum style
Ignore hedge ratio all together
And more and more, the limit is your imagination, e.g.:
Anticipate hedge ratio changes based on exogenous info and act accordingly
Scalp a pair just like any other asset
Make a pair out of 2 pairs
Like I mean it, whatever you desire
About forward pricing model:
It’s applied only to leg 2;
Direct: takes spot price and finds out implied futures price
Inverse: takes futures price and finds out implied spot price (try on oil)
Pls read online how to choose parameters, it’s open access reliable info
About the hedge ratio I use:
You prolly noticed the way I prefer to use inferred volumes vs the “real” ones. In pairs it’s especially meaningful, because real volumes lose sense in pair creation. And while volumes are closely tied to volatility, the inferred volumes ‘Are’ volatility irl (and later can be converted to currency space by using point value, allowing direct comparisons symbol vs symbol).
This hedge ratio is a good example of how discovering the real nature of entities beats making 100s of inventions, why domain knowledge and proper feature engineering beats difficult bulky models, neural networks etc. How simple data understanding & operations on it is all you need.
This script simply does this:
Takes inferred volume delta of both assets, makes a ratio, normalizes it by tick sizes and points values of both legs, calculates a typical value of this series.
That’s it, no step 2, we’re done. No Kalman filters, no TLS regression, no vine copulas, or whatever new fancy keywords you can come up with etc.
...
^^ comparing real ES prices vs theoretical ones by forward-pricing model. Financing: 0.04, yield 0.0175
^^ EURUSD, 6E futures with theoretical futures price calculated with interest rate differential 0.02 (4% USD - 2% EUR interest rates)
^^4 different pairs (RTY/ES, YM/ES, NQ/ES, ES/ZN) each with different plot style (pick one you like in script's Style settings)
^^ YM/RTY pair, each plot represents ratio of different features: ratio of prices, ratio of inferred volume deltas, ratio of inferred volumes, ratio of inferred tick counts (also can be turned on/off in Style settings)
...
How can u upgrade it and make a step forward yourself:
On tradingview missing values are automatically fixed by backfilling, and this never becomes a thing until you hit high frequency data. You can do better and use Kalman filter for filling missing values.
Script contains the functions I use everywhere to calculate inferred volume delta, inferred volume, and inferred tick count.
...
∞

Quality Detector (Buffett Style) + Beta [Solid]This indicator acts as an on-chart fundamental screener, designed to instantly evaluate the quality and financial health of a company directly on your price chart.
The concept is inspired by "Buffettology" principles: looking for large, profitable companies with low debt. Additionally, it includes a Beta calculation to assess market volatility risk.
The tool displays a panel in the bottom-right corner featuring four key metrics and a final verdict.
How it Works & Metrics Used
The script retrieves quarterly fundamental data ("FQ") and performs calculations to verify if the asset meets specific criteria.
1. Market Cap (Size)
What it is: The total market value of the company's outstanding shares.
Goal: To identify established, large-cap companies.
Default Threshold: Must be greater than $10 Billion.
2. ROE - Return on Equity (Quality)
What it is: A measure of financial performance calculated by dividing net income by shareholders' equity.
Goal: To find companies that are efficient at generating profits from shareholders' capital.
Default Threshold: Must be higher than 15%.
3. Total Debt to Equity (Health)
What it is: A ratio indicating the relative proportion of shareholders' equity and debt used to finance a company's assets.
Calculation: This script manually calculates this ratio by fetching TOTAL_DEBT and dividing it by TOTAL_EQUITY from fundamental data to ensure robustness across different symbols.
Goal: To ensure the company is not overly leveraged.
Default Threshold: Must be lower than 1.5.
4. Beta (Risk/Volatility)
What it is: A measure of a stock's volatility in relation to the overall market (S&P 500).
Calculation: It is calculated by comparing the asset's returns against SPY (S&P 500 ETF) returns over a 252-day period (approx. 1 trading year).
Goal: To understand if the stock is more volatile (Beta > 1) or less volatile (Beta < 1) than the market.
Note: Beta does not affect the final "Quality" score but serves as an extra risk indicator, highlighting in orange if Beta > 1.
The Verdict (Scoring System)
The indicator assigns a score from 0 to 3 based on the first three fundamental metrics (Size, ROE, and Debt/Equity).
If a metric passes the threshold, it gets a green background and +1 point.
If it fails, it gets a red background.
Final Verdict:
💎 QUALITY GEM: The company passed all 3 fundamental checks (Score = 3/3).
⚠️ DISCARD: The company failed one or more fundamental checks.
Settings
You can customize the thresholds to fit your own investment strategy in the indicator settings:
Minimum Market Cap (in Billions).
Minimum ROE (%).
Maximum Debt/Equity Ratio.
Disclaimer: This tool is for informational and educational purposes only. It relies on third-party fundamental data which may sometimes be delayed or unavailable. Do not base investment decisions solely on this indicator.

NHNL Breadth Scanner [BIG]═══════════════════════════════════════════════════════════════════════════════
NVENTURES NHNL BREADTH SYSTEM v2.0
═══════════════════════════════════════════════════════════════════════════════
OVERVIEW
The NVentures NHNL Breadth System is an institutional-grade market breadth analysis framework designed for equity traders, portfolio managers, and market technicians who require comprehensive internal market structure visibility beyond price action alone. This system integrates New Highs - New Lows (NHNL) data across multiple exchanges with participation breadth metrics to identify market regime shifts, thrust conditions, divergences, and rotation dynamics between large-cap and small-cap equities.
Version 2.0 introduces the Participation Breadth Module , which monitors the percentage of stocks above their 50-day moving averages across S&P 500, Russell 2000, and NASDAQ 100 indices. This extension enables detection of Risk-On/Risk-Off rotations and narrow rally conditions—critical information for portfolio construction, sector allocation, and tactical hedging decisions.
The framework combines:
- Multi-exchange NHNL aggregation – NYSE, NASDAQ, AMEX breadth data integration
- McClellan Oscillator – Exponential moving average difference for trend momentum
- Thrust detection – Extreme breadth expansion/contraction identification
- Divergence analysis – Price vs. breadth non-confirmation patterns
- Participation breadth – Large-cap vs. small-cap rotation detection
- Composite signal scoring – Multi-factor quantitative breadth assessment
═══════════════════════════════════════════════════════════════════════════════
CORE METHODOLOGY
═══════════════════════════════════════════════════════════════════════════════
• NHNL Data Aggregation
The system retrieves daily New Highs and New Lows from three major U.S. exchanges:
- NYSE – INDEX:HIGN (New Highs), INDEX:LOWN (New Lows)
- NASDAQ – INDEX:HIGQ (New Highs), INDEX:LOWQ (New Lows)
- AMEX – INDEX:HIGA (New Highs), INDEX:LOWA (New Lows)
Users can toggle exchanges on/off to isolate specific market segments. All three exchanges are enabled by default for comprehensive market-wide breadth measurement.
Core Calculations :
- NHNL Raw = Total New Highs - Total New Lows
- NHNL % = (NHNL Raw / Total Issues) × 100
- NH/NL Ratio = New Highs / New Lows
These metrics quantify the internal strength or weakness of market advances/declines independent of price index levels.
• McClellan Oscillator
The McClellan Oscillator applies exponential moving average (EMA) logic to NHNL data:
Formula: McClellan Osc = EMA(NHNL, Fast) - EMA(NHNL, Slow)
Default parameters: Fast = 19, Slow = 39
Interpretation :
- Positive values = Breadth momentum favors bulls (more issues making new highs)
- Negative values = Breadth momentum favors bears (more issues making new lows)
- Zero-line crosses = Regime change signals (bullish above, bearish below)
- Extreme readings (>±100) = Overbought/oversold breadth conditions
The McClellan Oscillator is a standard institutional breadth tool used by market technicians since the 1960s. It smooths daily NHNL volatility while maintaining responsiveness to trend changes.
• Thrust Detection
Thrust conditions identify extreme breadth expansion or contraction that historically precedes sustained directional moves:
Bullish Thrust :
- NHNL % > Threshold (default +40%)
- Sustained for Confirmation Bars (default 2 bars)
- Context : Extreme positive breadth expansion. Historically associated with major rally initiations or continuation thrusts.
Bearish Thrust :
- NHNL % < -Threshold (default -40%)
- Sustained for Confirmation Bars (default 2 bars)
- Context : Extreme negative breadth contraction. Historically associated with panic selling, capitulation events, or major downtrend acceleration.
Thrust conditions are the highest-priority signals in the framework and override other conflicting indicators.
• Divergence Detection
The system identifies non-confirmation patterns between price action and breadth:
Bullish Divergence :
- Price makes lower low
- NHNL % makes higher low
- Context : Selling pressure exhausting despite lower prices. Potential reversal signal as fewer stocks participate in decline.
Bearish Divergence :
- Price makes higher high
- NHNL % makes lower high
- Context : Rally losing internal momentum despite higher prices. Potential reversal signal as fewer stocks participate in advance.
Divergences use pivot detection with configurable lookback periods (default 50 bars) and pivot strength (default 5 bars). Visual divergence lines are drawn directly on the price chart when detected.
• Participation Breadth Module (NEW in v2.0)
This module monitors the percentage of stocks trading above their 50-day moving average across three major indices:
- S&P 500 – INDEX:S5FI (Large-cap participation)
- Russell 2000 – INDEX:R2FI (Small-cap participation)
- NASDAQ 100 – INDEX:NDFI (Tech-cap participation)
Rotation Spread Calculation :
Rotation Spread = Russell 2000 % Above 50D - S&P 500 % Above 50D
Interpretation :
- Positive Spread (>+10%) = Risk-On Rotation
Small caps outperforming large caps. Broad market participation. Risk appetite expanding.
- Negative Spread (<-10%) = Risk-Off Rotation
Large caps outperforming small caps. Narrow rally / defensive positioning. Flight to quality or concentration risk.
- Neutral (-10% to +10%) = Balanced market, no clear rotation
This spread identifies critical regime changes between broad market participation (healthy) and narrow leadership (fragile). Risk-On rotations typically occur during economic expansion phases; Risk-Off rotations occur during uncertainty, recession fears, or late-cycle conditions.
• Composite Signal Score
The framework generates a quantitative breadth score (-100 to +100) by weighting five components:
1. Thrust Score (±40 points) – Active thrust condition
2. Trend Score (±30 points) – McClellan Oscillator above/below zero
3. Momentum Score (±20 points) – NHNL % magnitude
4. Ratio Score (±10 points) – NH/NL Ratio extremes
5. Participation Score (±15 points) – Risk-On/Risk-Off regime + participation health
The composite score is smoothed (EMA 5) and classified into five breadth states:
- +50 to +100 = Strong Bull
- +20 to +50 = Bullish
- -20 to +20 = Neutral
- -50 to -20 = Bearish
- -100 to -50 = Strong Bear
═══════════════════════════════════════════════════════════════════════════════
SIGNAL HIERARCHY & PRIORITY
═══════════════════════════════════════════════════════════════════════════════
The indicator generates multiple signal types with distinct priority levels:
Priority 1: Thrust Signals (Highest conviction)
- Green triangle below bar = Bullish Thrust (40%+ breadth expansion)
- Red triangle above bar = Bearish Thrust (40%+ breadth contraction)
- Chart background highlighted in green/red during active thrust
Priority 2: Rotation Signals (Regime identification)
- Cyan diamond below bar = Risk-On Rotation (small caps outperforming)
- Orange diamond above bar = Risk-Off Rotation (large caps outperforming)
- Chart background highlighted in cyan/orange during active rotation
Priority 3: Divergence Signals (Reversal warnings)
- Green label below bar = Bullish Divergence (price/breadth non-confirmation)
- Red label above bar = Bearish Divergence (price/breadth non-confirmation)
- Dashed lines connect divergence pivot points on price chart
Priority 4: Zero-Line Cross (Trend changes)
- Small circle below bar = McClellan crossing above zero (breadth turning positive)
- Small circle above bar = McClellan crossing below zero (breadth turning negative)
═══════════════════════════════════════════════════════════════════════════════
VISUAL COMPONENTS
═══════════════════════════════════════════════════════════════════════════════
• Comprehensive Information Panel
The top-right dashboard (position customizable) displays:
Section 1: Raw NHNL Data
- Total New Highs (green)
- Total New Lows (red)
- Exchange breakdown (NYSE, NASDAQ, AMEX) with individual deltas
Section 2: Core Metrics
- NHNL % with visual indicator (🔥 for thrusts, arrows for direction)
- NH/NL Ratio with strength bars
- McClellan Oscillator with directional arrows
Section 3: Participation Breadth (NEW)
- S&P 500 % above 50D MA with trend arrow
- Russell 2000 % above 50D MA with trend arrow
- NASDAQ 100 % above 50D MA with trend arrow
- Rotation Spread with regime icon (🚀 Risk-On, 🛡️ Risk-Off)
Section 4: Composite Assessment
- Signal Score (-100 to +100) with visual strength bars
- Market Status (large text): BULLISH THRUST, BEARISH THRUST, RISK-ON ROTATION, RISK-OFF ROTATION, or breadth state classification
• Chart Overlays
- Background color-coding for active regimes (thrust, rotation, extreme readings)
- Signal markers (triangles, diamonds, circles, labels) at key inflection points
- Divergence lines connecting pivot highs/lows on price chart
═══════════════════════════════════════════════════════════════════════════════
KEY FEATURES
═══════════════════════════════════════════════════════════════════════════════
- Multi-exchange breadth aggregation – NYSE, NASDAQ, AMEX with individual on/off toggles
- Institutional McClellan Oscillator – Standard market breadth momentum tool
- Automated thrust detection – Identifies extreme breadth conditions with confirmation logic
- Price-breadth divergence scanning – Non-confirmation pattern detection with visual lines
- Participation breadth integration – Risk-On/Risk-Off rotation detection via large-cap vs. small-cap analysis
- Composite signal scoring – Quantitative multi-factor breadth assessment
- No repainting – All signals confirm on bar close
- Comprehensive alerting – 12+ alert conditions for thrust, divergence, rotation, and confluence events
- Fully customizable parameters – EMA periods, thresholds, lookbacks, visual settings
- Professional dashboard – Real-time metrics with color-coded status indicators
═══════════════════════════════════════════════════════════════════════════════
HOW TO USE
═══════════════════════════════════════════════════════════════════════════════
1. Apply to any chart – The indicator pulls multi-security data; chart symbol does not matter (commonly applied to SPY, SPX, or QQQ for reference)
2. Monitor the dashboard :
• Focus on Market Status (bottom row) for current regime
• Check NHNL % and McClellan for breadth direction and momentum
• Watch Rotation Spread for large-cap vs. small-cap dynamics
• Review Signal Score for composite breadth strength
3. Interpret thrust signals (highest priority):
• Bullish Thrust → Major rally initiation or continuation likely. Consider adding long exposure or reducing hedges.
• Bearish Thrust → Major decline or capitulation event likely. Consider reducing exposure or adding hedges.
• Historical context: Thrust signals are rare (2-5 per year) but highly reliable for significant market moves.
4. Interpret rotation signals (regime identification):
• Risk-On Rotation → Broad market participation. Small caps outperforming. Healthy advance. Favor cyclical sectors, higher beta names.
• Risk-Off Rotation → Narrow rally or defensive positioning. Large caps outperforming. Caution—market leadership concentrating. Favor quality, defensives.
5. Interpret divergence signals (reversal warnings):
• Bullish Divergence → Selling exhaustion. Potential bottom formation. Wait for confirmation (zero-line cross, thrust) before aggressive positioning.
• Bearish Divergence → Rally losing momentum. Potential top formation. Consider profit-taking or hedging.
6. Combine signals for maximum conviction :
• Bull Confluence : Bullish Thrust + Risk-On Rotation + Positive McClellan = Maximum bullish alignment
• Bear Confluence : Bearish Thrust + Risk-Off Rotation + Negative McClellan = Maximum bearish alignment
• Alert system specifically flags these high-conviction confluences
7. Configure parameters for your style :
• Thrust Threshold : Default 40% catches major moves. Increase to 50%+ for extreme-only signals.
• Rotation Threshold : Default 10% spread. Tighten to 7.5% for earlier rotation detection.
• Divergence Lookback : Default 50 bars. Extend to 100+ for longer-term divergences.
8. Use alerts for proactive monitoring :
• Set TradingView alerts for Thrust, Rotation, Divergence, and Confluence conditions
• Receive notifications when critical breadth regime changes occur
═══════════════════════════════════════════════════════════════════════════════
LIMITATIONS
═══════════════════════════════════════════════════════════════════════════════
- U.S. equity markets only – NHNL data limited to NYSE, NASDAQ, AMEX. Does not cover international markets or other asset classes.
- Daily timeframe only – NHNL data is reported daily. Intraday trading requires alternative breadth measures.
- Lagging in fast reversals – McClellan Oscillator and participation metrics use EMAs, introducing lag during rapid regime shifts. Thrust signals respond faster but require extreme conditions.
- Equal-weighting assumption – All stocks within NHNL counts are equally weighted. Large-cap-dominated rallies (e.g., FANG-led advances) may show strong price performance despite mediocre breadth.
- False positives in sideways markets – Divergence signals can produce false positives during extended consolidation phases. Require confirmation from thrust or rotation signals.
- Participation data quality – S5FI, R2FI, NDFI data from TradingView may have occasional gaps or delays. Indicator includes data validation logic and falls back gracefully when data unavailable.
═══════════════════════════════════════════════════════════════════════════════
TECHNICAL SPECIFICATIONS
═══════════════════════════════════════════════════════════════════════════════
- Pine Script v5
- Non-repainting (signals confirmed on bar close)
- Multi-security data feeds (6 NHNL tickers + 3 participation tickers)
- Maximum 500 lines supported (divergence line drawing)
- Real-time dashboard table with 20+ rows
- 12+ alert conditions (thrust, divergence, rotation, ratio extremes, confluence)
- Fully customizable colors, thresholds, and visual elements
═══════════════════════════════════════════════════════════════════════════════
NOTES
═══════════════════════════════════════════════════════════════════════════════
This indicator is designed for experienced equity traders, portfolio managers, and market technicians familiar with:
- Market breadth analysis and internal market structure
- McClellan Oscillator interpretation
- New High - New Low dynamics and their correlation with market cycles
- Large-cap vs. small-cap rotation patterns
- Risk-On/Risk-Off regime identification
The framework provides objective breadth signals but does not account for:
- Fundamental catalysts (earnings, economic data, Fed policy)
- Sector-specific dynamics (may show broad weakness while certain sectors thrive)
- International market correlations
- Volatility regime changes (VIX dynamics)
Best used in combination with:
- Price action analysis (support/resistance, chart patterns)
- Volume analysis (accumulation/distribution)
- Volatility indicators (VIX, put/call ratios)
- Sentiment indicators (survey data, positioning)
Market breadth is a leading indicator of internal market health. Divergences between price and breadth often precede major reversals by weeks or months.
═══════════════════════════════════════════════════════════════════════════════
Developed for institutional market breadth analysis based on New Highs - New Lows methodology with extended participation breadth integration.

Majors FX-REER/NEER Suite [BIG]═══════════════════════════════════════════════════════════════════════════════
BIG MAJORS FX-REER/NEER SUITE
═══════════════════════════════════════════════════════════════════════════════
OVERVIEW
The BIG Majors FX-REER/NEER Suite is a multi-currency valuation framework designed for institutional FX traders, macro strategists, and systematic currency allocators. This indicator calculates Real Effective Exchange Rates (REER) and Nominal Effective Exchange Rates (NEER) for the seven major currency pairs (G7 FX), integrating macroeconomic fundamentals (CPI inflation differentials) with technical trend analysis to identify structural currency misvaluations and mean-reversion opportunities.
Unlike standard FX indicators that only analyze bilateral price action, this suite constructs trade-weighted basket indices that measure each currency's strength against a portfolio of its major trading partners, adjusted for inflation differentials. This approach mirrors central bank and sovereign wealth fund methodologies for assessing equilibrium exchange rate levels.
The framework combines:
- Fundamental valuation metrics – REER/NEER indices with Z-score normalization
- Technical trend filters – Ichimoku Cloud and Aroon oscillator confluence
- Signal classification system – Long/Short/Watch/Conflict regime identification
- Quantitative confidence scoring – 0-100% signal reliability weighting
═══════════════════════════════════════════════════════════════════════════════
CORE METHODOLOGY
═══════════════════════════════════════════════════════════════════════════════
• NEER Calculation (Nominal Effective Exchange Rate)
The NEER measures a currency's value against a trade-weighted basket of its seven major trading partners, geometrically averaged in log-space to ensure symmetry:
1. All seven G7 FX pairs are normalized to USD-pivot (A/USD format)
2. Each currency's log-normalized rate is compared to the arithmetic mean of the other six
3. Formula: NEER_i = (8/7) × log(CCY_i/USD) - mean(log(CCY_others/USD))
This construction ensures that:
- A rising NEER indicates currency appreciation against the basket
- The methodology is symmetric and avoids base-currency bias
- Changes reflect multilateral competitive dynamics, not just bilateral moves
• REER Calculation (Real Effective Exchange Rate)
The REER adjusts the NEER for inflation differentials using Consumer Price Index (CPI) data:
Formula: REER_i = NEER_i + log(CPI_i) - mean(log(CPI_others))
By incorporating CPI differentials, the REER provides a purchasing-power-parity-adjusted valuation metric that accounts for relative inflation rates. This is the institutional standard for assessing fundamental currency equilibrium levels.
Data Sources :
- FX rates: TradingView composite feed (FX:), OANDA, FXCM, FOREXCOM
- CPI data: ECONOMICS namespace (monthly frequency, official statistical releases)
- Supported currencies: USD, EUR, JPY, GBP, CHF, AUD, CAD, NZD
• Valuation Bias Detection
Each currency pair is classified as overvalued (bias = -1, "Short") or undervalued (bias = +1, "Long") based on two independent criteria:
1. Percentage Band Deviation – Relative Index distance from 100 baseline
• Overvalued: Index > 100 × (1 + deviation%), default +5%
• Undervalued: Index < 100 × (1 - deviation%), default -5%
2. Z-Score Threshold – Statistical extremes in rolling lookback window
• Overvalued: Z-Score > +1.5 (default)
• Undervalued: Z-Score < -1.5 (default)
Either condition triggers a bias classification. This dual-filter approach captures both absolute deviations and relative extremes within recent historical context.
• Trend Confirmation (Ichimoku + Aroon)
To avoid counter-trend entries in strong momentum regimes, the suite integrates two independent trend filters:
Ichimoku Cloud
- Bull: Price > Cloud AND Conversion > Base Line
- Bear: Price < Cloud AND Conversion < Base Line
- Parameters: Conv(9), Base(26), Span B(52), Displacement(26)
Aroon Oscillator
- Bull: Aroon Up > 70 AND Aroon Down < 30
- Bear: Aroon Down > 70 AND Aroon Up < 30
- Default lookback: 25 periods
Trend is confirmed only when both indicators agree (Ichimoku + Aroon ≥ +1 for bull, ≤ -1 for bear).
• Setup Classification Logic
The framework combines Bias (fundamental valuation) with Trend (technical momentum) to generate four distinct setup types:
- Long↗︎ (Setup = 1) – Undervalued + Bullish Trend
Context : Mean reversion opportunity with momentum confirmation. Currency trading at fundamental discount while technical trend supports upside.
- Short↘︎ (Setup = -1) – Overvalued + Bearish Trend
Context : Mean reversion opportunity with momentum confirmation. Currency trading at fundamental premium while technical trend supports downside.
- Watch (Setup = 2) – Valuation bias present, but no clear trend
Context : Fundamental mispricing without directional conviction. Monitor for trend emergence before entering.
- Conflict (Setup = 3) – Bias and trend pointing opposite directions
Context : Overvalued currency in uptrend OR undervalued currency in downtrend. Avoid—either trend continuation or valuation mean reversion, but unclear which dominates.
• Confidence Score (0-100%)
Each setup receives a quantitative confidence weighting based on three factors:
1. Band Distance (40%) – How far the Relative Index deviates from 100 baseline
2. Z-Score Magnitude (40%) – Statistical extremeness within lookback window
3. Trend Confluence (20%) – Agreement between Ichimoku and Aroon signals
Score interpretation:
- 70-100% = High confidence (both valuation and trend extremes aligned)
- 40-69% = Moderate confidence (one factor strong, others weak)
- 0-39% = Low confidence (marginal signals, questionable reliability)
═══════════════════════════════════════════════════════════════════════════════
VISUAL COMPONENTS
═══════════════════════════════════════════════════════════════════════════════
• Dashboard Table (Top-Right)
Displays real-time valuation metrics for all seven major pairs:
Column 1: Pair – Currency pair identifier
Column 2: RelIdx – Relative Index (100 = baseline at first valid bar)
Column 3: Z – Z-Score vs. rolling lookback window
Column 4: Bias – Long/Short/Neutral valuation classification
Column 5: Trend – ↑/↓/– trend direction (Ichimoku + Aroon)
Column 6: Setup – Long↗︎/Short↘︎/Watch/Conflict (color-coded)
Column 7: Conf – Confidence score 0-100% (color-coded)
Column 8: Quelle – REER (inflation-adjusted) or NEER (nominal only)
Color coding :
- Green = Long↗︎ setup
- Red = Short↘︎ setup
- Orange = Watch (no trend)
- Purple = Conflict (bias/trend divergence)
• Optional Chart Plot
Select any of the seven pairs to plot its Relative Index on the chart with:
- Baseline at 100 (horizontal gray line)
- +Band at 100 × (1 + deviation%), dashed red
- -Band at 100 × (1 - deviation%), dashed green
- Aqua line tracking the selected pair's Relative Index evolution
• Signal Labels
When a pair transitions into Long↗︎ or Short↘︎ setup:
- Green label below bar = Long↗︎ entry signal
- Red label above bar = Short↘︎ entry signal
- Positioned using ATR offset for visibility
═══════════════════════════════════════════════════════════════════════════════
KEY FEATURES
═══════════════════════════════════════════════════════════════════════════════
- Institutional valuation methodology – REER/NEER framework used by central banks and sovereign wealth funds
- Macro-fundamental integration – CPI inflation differentials adjust for purchasing power parity
- Multi-timeframe flexibility – Daily (D), Weekly (W), Monthly (M) resolution options
- Seven simultaneous pairs – Monitors all G7 FX majors in single unified dashboard
- No repainting – All signals confirm on bar close
- Automated alerts – TradingView notifications when setups transition (Long/Short triggers)
- Confidence weighting – Quantitative scoring allows position sizing calibration
- Fallback logic – Automatically switches to NEER if CPI data incomplete
═══════════════════════════════════════════════════════════════════════════════
HOW TO USE
═══════════════════════════════════════════════════════════════════════════════
1. Apply to any chart – The indicator pulls multi-security data; chart symbol does not matter (commonly applied to SPY or DXY for reference)
2. Select data feed – Default FX: (TradingView composite) is recommended; alternatives: OANDA, FXCM, FOREXCOM
3. Choose timeframe :
• Daily (D) = Swing trading, medium-term mean reversion (2-8 week horizons)
• Weekly (W) = Position trading, macro regime shifts (1-6 month horizons)
• Monthly (M) = Strategic allocation, long-term equilibrium analysis (6-24 month horizons)
4. Configure parameters :
• Z-Score Lookback : Default 252 (one trading year on Daily); adjust for timeframe (52 for Weekly, 36 for Monthly)
• Deviation Band : Default ±5%; tighten to ±3% for more signals, widen to ±7% for higher conviction
• Z-Threshold : Default ±1.5; increase to ±2.0 for extreme-only signals
5. Monitor dashboard table :
• Focus on pairs showing Long↗︎ or Short↘︎ setups with Conf ≥ 70%
• Watch for Watch setups transitioning to directional signals
• Avoid Conflict setups unless you have strong macro conviction
6. Execute mean-reversion trades :
• Long↗︎ = Buy undervalued currency (e.g., EURUSD Long if EUR undervalued)
• Short↘︎ = Sell overvalued currency (e.g., USDJPY Short if JPY overvalued)
• Target: Mean reversion toward 100 baseline or opposite band
7. Position sizing by confidence :
• High confidence (70-100%) → Standard position size
• Moderate confidence (40-69%) → Reduce size by 50%
• Low confidence (<40%) → Avoid or use minimal pilot size
8. Risk management :
• Stop loss: Place beyond recent swing high/low or 1.5× ATR
• Take profit: Opposite valuation band or 100 baseline
• Time stop: Exit if setup reverses (Long→Neutral→Short or vice versa)
═══════════════════════════════════════════════════════════════════════════════
LIMITATIONS
═══════════════════════════════════════════════════════════════════════════════
- CPI data lag – Consumer Price Index releases are monthly and report with 2-4 week delay. REER calculations may lag real-time inflation dynamics.
- Structural shifts ignored – The baseline (100) is set at first valid bar. Long-term structural appreciation/depreciation (e.g., 20-year USD bull market) is not accounted for. Suitable for cyclical mean reversion, not secular trend analysis.
- Equal-weighting assumption – All seven currencies are equally weighted in basket construction. Actual trade-weighted indices use GDP or trade volume weights, which this framework simplifies.
- No emerging market currencies – Limited to G7 majors (USD, EUR, JPY, GBP, CHF, AUD, CAD, NZD). Does not cover EM FX (e.g., CNY, BRL, MXN).
- Technical filter limitations – Ichimoku and Aroon are lagging indicators. In fast-moving markets (e.g., central bank interventions, geopolitical shocks), trend signals may arrive late.
- Mean reversion assumption – The framework assumes currencies revert to equilibrium. During regime changes (e.g., monetary policy divergence, crisis flows), deviations can persist or expand before eventual reversal.
═══════════════════════════════════════════════════════════════════════════════
TECHNICAL SPECIFICATIONS
═══════════════════════════════════════════════════════════════════════════════
- Pine Script v6
- Non-repainting (signals confirmed on bar close)
- Multi-security data feeds (7 FX pairs + 8 CPI series)
- Automated alert system (transitions to Long↗︎/Short↘︎)
- Real-time dashboard table (8 columns × 8 rows)
- Maximum 500 labels supported (100 per pair direction)
- Fallback logic: NEER used if CPI data unavailable
═══════════════════════════════════════════════════════════════════════════════
NOTES
═══════════════════════════════════════════════════════════════════════════════
This indicator is designed for experienced FX traders, macro strategists, and portfolio managers familiar with:
- Real and nominal effective exchange rate concepts
- Purchasing power parity theory and inflation differentials
- Multi-currency portfolio construction and basket hedging
- Carry trade and convergence strategies
- Central bank policy impacts on FX equilibrium levels
The framework provides objective valuation signals but does not account for:
- Interest rate differentials (carry)
- Capital flow dynamics (risk-on/risk-off)
- Central bank intervention zones
- Geopolitical risk premiums
Always combine REER/NEER valuation analysis with macro event calendars, positioning data (CFTC COT reports), and fundamental policy divergence assessments.
═══════════════════════════════════════════════════════════════════════════════
Developed for institutional FX valuation analysis based on central bank REER/NEER methodologies.
