EMA 9/15/45 + MACD Confirm + SupertrendThis indicator uses EMA 9, 15, 45 days along with combination of MACD and Supertrend
Search in scripts for "supertrend"

Awesome SuperTrend Zone Dynamic Alerts// created by © OmegaTools, upgrade to v6 and alert condition added
//@version=6
Awesome SuperTrend Zone Alerts with dynamic alerts

MACD + Supertrend + VWAP (Filtered with Background)MACD + Supertrend + VWAP (Filtered with Background)

FVMA + SuperTrend + top and bottom Strategy Full CustomizationFVMA + SuperTrend + top and bottom Strategy Full Customization
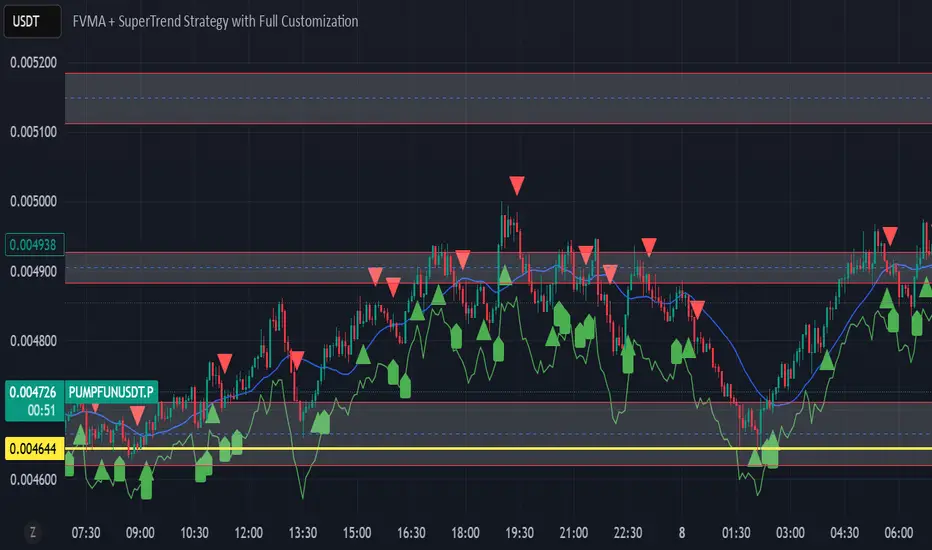
FVMA + SuperTrend Strategythis code is using a combination of 2 indicators, whcih are FVMA and the SuperTrend .
VWAP Price ChannelVWAP Price Channel cuts the crust off of a traditional price channel (Donchian Channel) by anchoring VWAPs at the highs and lows. By doing this, the flat levels, characteristic of traditional Donchian Channels, are no more!
Author's Note: This indicator is formed with no inherent use, and serves solely as a thought experiment.
> Concept
I would be hesitant to call this a "predictive" indicator, however the behavior of it would suggest it could be considered at least partially predictive
Essentially, the Anchored VWAPs creates something from otherwise nothing.
While the DC upper or lower values are staying flat, the VWAPs improvise based on price and volume to project a level that may be a better representation of where future highs or lows may settle.
Visually, this looks like we have cut off the corners of the Donchian Channel.
Note: Notice how we are calculating values before the corners are realized.
> Implementation
While this is only a concept indicator, The specific application I've gone with for this, is a sort of supertrend-ish display (A Trend Flipping Trailing Stop Loss).
The script uses basic logic to create a trend direction, and then displays the Anchored VWAPs as a form of trailing stop loss.
While "In Trend", the script fills in the area between the VWAP and Price in the direction of trend.
When new highs or lows are made while in trend, the opposite VWAP will start to generate at the new highs or lows. These happen on every new high or low, so they are not indicating the trend shift, but could be interpreted as breakout levels for the current trend direction in order for continuation.
Note: All values are drawn live, but when using higher timeframes, there is a natural calculation discrepancy when using live data vs. historical.
> Technicals
In this script, I'm simply detecting new highs or lows from the DC and using those as the anchor frequency on the built-in VWAP function.
So each time a new high or low is made based on DC, the VWAP function re-anchors to the high or low of the candle.
Past that, I have implemented some logic in order to account for a common occurrence I faced during development.
Frequently, the price would outpace the anchored VWAP, so we would end up with the VWAP being further from price than the actual DC upper or lower.
Due to this, what I have ended up with was a third value which, rather than switching between raw VWAP values and DC values, it adjusts the value based on the change in the VWAP value.
This can be simply thought of as a "Start + Change" type of setup.
By doing this, I can use the change values from the actual anchored VWAP, and under normal conditions, this will also be the true VWAP value.
However, situationally, I am able to update the start value which we're applying the VWAP change to.
In other words, when these situations happen, the VWAP change is added to the new (closer to price) DC value.
The specific trend logic being used is nothing fancy at all, we are simply checking if a new high or low is created and setting the trend in that direction.
This is in line with some traditional DC Strategies.
To those who made it here,
Just remember:
The chart may be ugly, but it's the fastest analysis of the data you can get.
Nicer displays often come at the hidden cost of latency.
You have to shoot your shot to make it.
Choose 2: Fast, Clean, Useful
Enjoy!

EMAS + SuperTrend+ Key Levels SpacemanBTC IDWMEma 200 800 supertrend and key levels.
Thanks to spaceman for making the code available.

Triple Trend v2 [DLL]Triple Trend v2 is a multi-layer trend detection tool using three customizable Supertrend calculations.
Plots three trend lines (short, medium, long) with independent ATR settings.
Highlights trend flips with labels (1, 2, 3) showing which trend(s) changed.
Integrates RSI reversal detection (fixed or dynamic) with optional reversal lines and labels.
Includes a bar-size filter to ignore insignificant flips.
Displays a multi-timeframe trend table for higher-timeframe confirmation.
Provides built-in alerts for flips, RSI thresholds, and reversals.

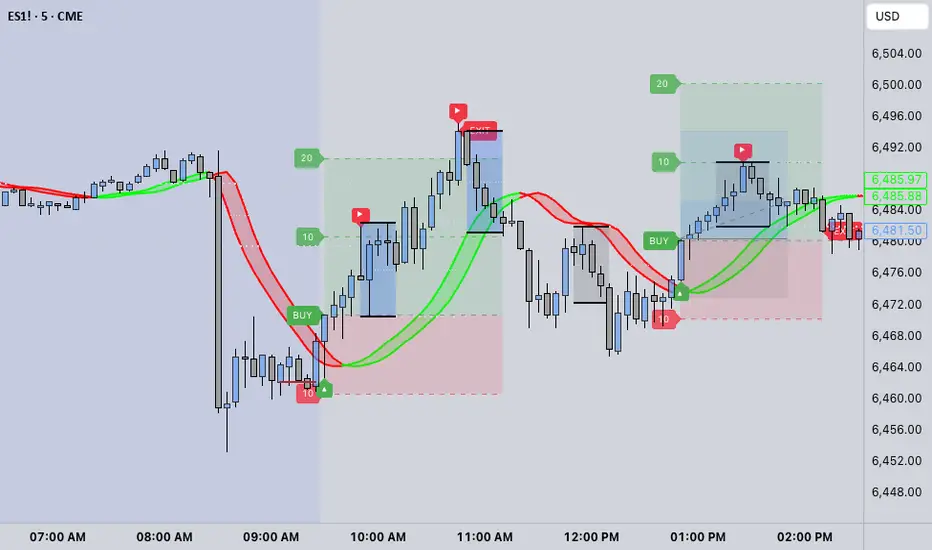
HMA V1 – Hull ATR SuperTrend with HTF Gate (Optimized for ES & NOverview
HMA V1 is a directional trend-following indicator designed for ES and NQ futures, combining a Hull ATR-based SuperTrend system with a Higher Timeframe HMA gate to filter entries. It can also be used on major indices and liquid stocks, but accuracy will be lower compared to ES/NQ optimization.
The indicator generates Buy and Sell signals based on the alignment of short-term price action with the higher timeframe trend filter. The logic is tuned for both scalping (more frequent signals, lower win rate) and day trading (fewer signals, higher win rate).
⸻
Signal Logic
1. Base Trend Engine:
• Uses an ATR-based Hull Moving Average (HMA) to dynamically calculate upper and lower bands for trend detection.
• Price crossing above the upper band in an uptrend = potential Buy trigger.
• Price crossing below the lower band in a downtrend = potential Sell trigger.
2. HTF HMA Gate Filter:
• All signals must pass a Higher Timeframe HMA check to confirm the broader trend direction.
• This acts as a noise filter, reducing false signals in choppy conditions.
3. Timeframe Behavior:
• Long Signals:
• Works best on 15m for day trading (higher win rate).
• 5m gives more scalping opportunities but with more false signals.
• If you want to trade longs, uncheck “Lock Long Signals to Specific Timeframe” for flexibility.
• Short Signals:
• Currently only coded to appear on 5m timeframe (bug to be fixed in future versions).
4. Partial Profit Logic (optional):
• Although not enforced in this version, the system is often used with partial profit-taking at fixed % targets and moving stops to breakeven after P1.
⸻
Best Use Practices:
• ES/NQ Futures: Best performance and most accurate filtering.
• Other Indices/Stocks: Usable but expect lower accuracy; re-tune ATR/HMA parameters for better results.
• Scalping: Use 5m for quicker entries, accept more noise.
• Day Trading: Use 15m for fewer, higher-probability setups.
• Always combine with your own market structure and higher timeframe bias for best results.
⸻
Known Bugs / Limitations:
• Long signal lock is sometimes overly restrictive — uncheck the “Lock Long Signals to Specific Timeframe” option to see more entries.
• Short signals currently only appear on the 5m timeframe.
🔍 Confirmed Scalping Signals (Stoch+EMA+Supertrend)🔍 Confirmed Scalping Signals (Stoch+EMA+Supertrend)
Machine Learning Adaptive Trend Toolkit [Velowave]The Machine Learning Adaptive Trend Toolkit is a technical analysis tool that combines adaptive algorithms with comprehensive market feature extraction to provide insights into changing market conditions. Unlike static indicators with fixed parameters, this system continuously analyzes and adapts to the evolving market environment.
Core Technology
At the heart of this system is a dynamic approach to market analysis:
• Feature Engineering Pipeline: Extracts and normalizes volatility, momentum, volume, and trend strength metrics
• Market Regime Classification: Identifies 10 distinct market environments including trending, ranging, breakout, and reversal conditions
• Parameter Optimization: Automatically adjusts sensitivity based on detected market conditions
• Dynamic Wave Technology: Creates adaptive support/resistance levels that respond to changing volatility
⚠️ Signal Interpretation
Important: The indicator's wave crosses should be interpreted as trend change signals rather than direct buy/sell recommendations. These signals represent potential trend changes based on adaptive parameters, but require confirmation from other analysis before making trading decisions.
(Image showing example color customizability)
Custom Candle Behavior
The custom candlesticks in this indicator are designed to enhance trend visualization but will behave differently than default candlesticks:
• They use linear regression smoothing to reduce noise
• Their coloring is based on position relative to the adaptive wave, not merely open/close relationships
• They may show different patterns than traditional candlesticks on the same chart
• Trading strategies developed using traditional candlestick patterns may not apply directly to these custom candles
This modified representation helps visualize trend conditions more clearly but should be understood as an analytical tool rather than a direct replacement for traditional price action analysis.
Practical Applications
• Trend Identification
The adaptive wave system provides clear visualization of trend direction and strength, with dynamic support and resistance levels that adjust to current volatility conditions.
• Volatility-Adjusted Analysis
Parameters automatically optimize during high and low volatility periods, preventing false signals during consolidation while remaining responsive during breakouts.
• Regime-Based Strategy Selection
Knowing the current market regime allows you to apply appropriate trading techniques for specific conditions rather than using a one-size-fits-all approach.
• Visual Price Action Analysis
Enhanced candlestick coloring instantly communicates price position relative to the adaptive trend, helping you process market information more efficiently.
(Image showing only the supertrend wave and dynamic moving average)
Technical Components
• Adaptive Wave Algorithm: Creates dynamic support/resistance bands based on volatility, volume, and detected regime
• Dynamic Moving Average: Period automatically adjusts based on market conditions - shorter in trending markets, longer in ranging conditions
• Market Regime Engine: Continuously analyzes feature patterns to classify current conditions
• Custom Candlestick Visualization: Provides instant visual feedback on trend position and momentum
Implementation Details
For full transparency, the core calculations include:
• Volatility normalization through comparative ATR analysis
• Momentum feature extraction using multi-timeframe momentum indicators
• Trend strength quantification through price structure analysis
• Regime detection through feature pattern recognition
• Adaptive parameter adjustment based on detected market conditions
The system uses only historical and current price data for its calculations and analyses. It does not use predictive methodologies that could lead to misleading results. The indicator will show different values on an open bar than it will after the bar closes, which is standard behavior for indicators that use closing prices in their calculations.
Risk Disclaimer:
Trading involves significant risk. This indicator is designed as an analytical tool to enhance decision-making, not as a standalone trading system. Past performance is not indicative of future results.

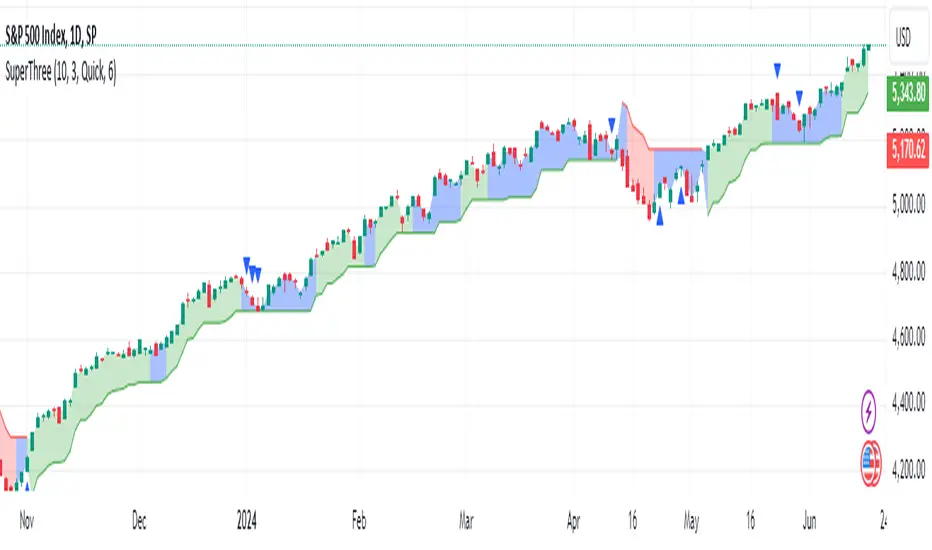
SuperThreeThe SuperThree is a comprehensive technical indicator designed to identify and visualize market trends and counter-trend momentum in trading. It uses a unique color-coding system to represent different market conditions and potential trading opportunities.
Uptrend (Green Fill) : This is indicated by a green fill. An uptrend is a period where prices are increasing overall, suggesting a strong market. It’s an ideal time for traders to consider entering long positions or exiting short positions.
Downtrend (Red Fill) : This is represented by a red fill. A downtrend is a period where prices are decreasing overall, indicating a bearish market. Traders might consider entering short positions or exiting long positions during this phase.
Sideways Trend (Blue Fill) : This is shown by a blue fill. A sideways trend, also known as a horizontal trend, is when the price is relatively stable and not making significant upward or downward movements. It’s often a period of consolidation before the price moves up or down.
Counter-Trend Momentum (Blue Arrows) : Blue arrows indicate counter-trend momentum, which can be a signal to exit trades or look for potential trend reversals. These are crucial points where the market’s momentum is shifting and may be about to move in the opposite direction.
The SuperThree indicator is an enhancement of the Supertrend indicator, providing additional features and visual cues to help traders make informed decisions. However, like all indicators, it should be used in conjunction with other forms of analysis to confirm signals and avoid potential false positives. Always consider your risk tolerance and investment goals before making trading decisions.
Happy trading! 😊
Backtest Strategy Optimizer Adapter - Supertrend ExampleSample Code
This is a sample code for my Backtest Strategy Optimizer Adapter library.
You can find the library at:
Backtest Strategy Optimizer Tester
With this indicator, you will be able to run one or multiple backtests with different variables (combinations). For example, you can run dozens of backtests of Supertrend at once with an increment factor of 0.1, or whatever you prefer. This way, you can easily grab the most profitable settings and use them in your strategy. The chart above shows different color plots, each indicating a profit backtest equal to tradingview backtesting system. This code uses my backtest library, available in my profile.
Below the code you should edit yourself
You can use ChatGPT or write a python script to autogenerate code for you.
// #################################################################
// # ENTRIES AND EXITS
// #################################################################
// You can use the link and code in the description to create
// your code for the desired number of entries / exits.
// #################################################################
// AUTO GENERATED CODE
// ▼▼▼▼▼▼▼▼▼▼▼▼▼▼▼▼▼▼▼▼▼▼▼▼▼▼▼▼▼▼▼▼▼▼▼▼▼▼▼▼▼▼▼▼▼▼▼▼▼▼▼▼▼▼▼▼▼▼▼▼▼▼▼▼▼
= ti.supertrend(10, 0.1)
= ti.supertrend(10, 0.2)
= ti.supertrend(10, 0.3)
= ti.supertrend(10, 0.4)
// 005 etc...
pnl_001 = backtest.profit(date_start, date_end, entry_001, exit_001)
pnl_002 = backtest.profit(date_start, date_end, entry_002, exit_002)
pnl_003 = backtest.profit(date_start, date_end, entry_003, exit_003)
pnl_004 = backtest.profit(date_start, date_end, entry_004, exit_004)
plot(pnl_001, title='0.1', color=backtest.color(001))
plot(pnl_002, title='0.2', color=backtest.color(002))
plot(pnl_003, title='0.3', color=backtest.color(003))
plot(pnl_004, title='0.4', color=backtest.color(004))
// Make sure you set the correct array size.
// The amount of tests + 1 (e.g. 4 tests you set it to 5)
var results_list = array.new_string(5)
if (ta.change(pnl_001))
array.set(results_list, 0, str.tostring(pnl_001) + '|0.1')
if (ta.change(pnl_002))
array.set(results_list, 1, str.tostring(pnl_002) + '|0.2')
if (ta.change(pnl_003))
array.set(results_list, 2, str.tostring(pnl_003) + '|0.3')
if (ta.change(pnl_004))
array.set(results_list, 3, str.tostring(pnl_004) + '|0.4')
// ▲▲▲▲▲▲▲▲▲▲▲▲▲▲▲▲▲▲▲▲▲▲▲▲▲▲▲▲▲▲▲▲▲▲▲▲▲▲▲▲▲▲▲▲▲▲▲▲▲▲▲▲▲▲▲▲▲▲▲▲▲▲▲▲▲
// AUTO GENERATED CODE
// #################################################################
Harmonic Trend Fusion [kikfraben]📈 Harmonic Trend Fusion - Your Personal Trading Assistant
This versatile tool combines multiple indicators to provide a holistic view of market trends and potential signals.
🚀 Key Features:
Multi-Indicator Synergy: Benefit from the combined insights of Aroon, DMI, MACD, Parabolic SAR, RSI, Supertrend, and SMI Ergodic Oscillator, all in one powerful indicator.
Customizable Plot Options: Tailor your chart by choosing which signals to visualize. Whether you're interested in trendlines, histograms, or specific indicators, the choice is yours.
Color-Coded Trends: Quickly identify bullish and bearish trends with the color-coded visualizations. Stay ahead of market movements with clear and intuitive signals.
Table Display: Stay informed at a glance with the interactive table. It dynamically updates to reflect the current market sentiment, providing you with key information and trend direction.
Precision Control: Fine-tune your analysis with precision control over indicator parameters. Adjust lengths, colors, and other settings to align with your unique trading strategy.
🛠️ How to Use:
Customize Your View: Select which indicators to display and adjust plot options to suit your preferences.
Table Insights: Monitor the dynamic table for real-time updates on market sentiment and trend direction.
Indicator Parameters: Experiment with different lengths and settings to find the combination that aligns with your trading style.
Whether you're a seasoned trader or just starting, Harmonic Trend Fusion equips you with the tools you need to navigate the markets confidently. Take control of your trading journey and enhance your decision-making process with this comprehensive trading assistant.

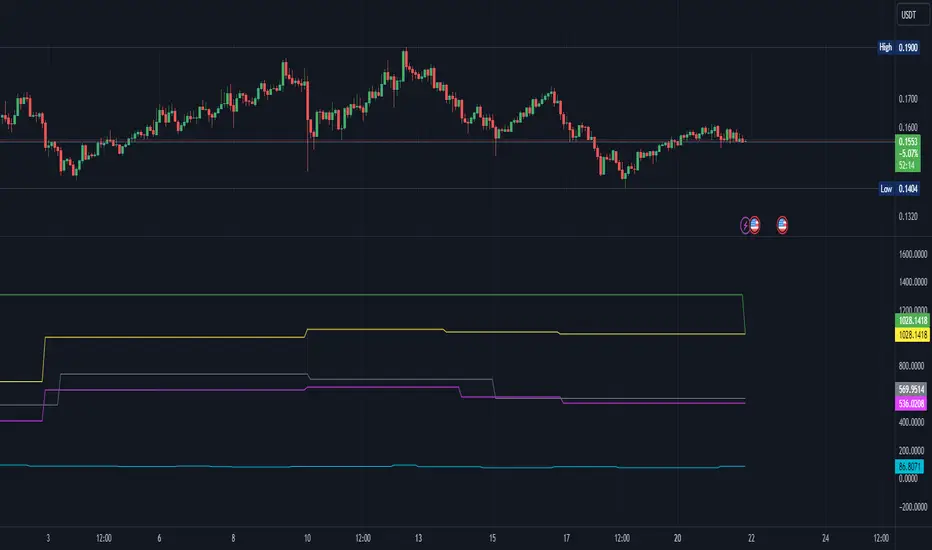
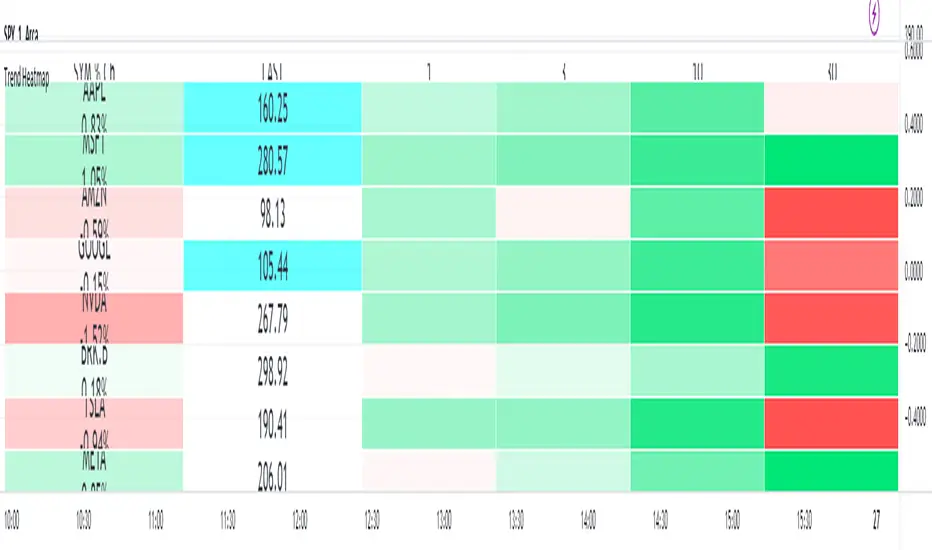
MultiSymbol Multitimeframe Supertrend TableThis is an initial release for four symbols and four timeframes.
Symbols and timeframes are customizable.
There is a gradient heatmap for the daily percentage change as well as another heatmap for each of the timeframe trends.
The two different forms of heatmap have separate settings so can have different colors and scaling if desired.
The trend used is Trading View's built in Supertrend and the gradient for the trend changes based on how far above or below that timeframe's trend the latest price currently is
It is recommended to place this in a separate pane and use it in the top left so it occupies the whole pane.
You can adjust the cell width and height to fit to your own chart window
Triple SuperTrendBased on supertrend by kivancozbilgic this indicator shows 3 lines and consider a valid buy/sell signal the moment when all 3 lines are congruent

Trend SuggestionsThis brings together a number of variables to produce trend predictions that could be utilized as decision-making tools.
Uses the aforementioned price and volume derivatives
- A moving average and three weighted moving averages (WMA1, WMA2, WMA3)
- Super Trend Line (ST)
- Opening Range Breakout on Five Minutes, Resistance Bands Pocket pivots, support, and price volume
he Direction is determined by the High and Low Bands of WMAs and the Supertrend Line, which are used to determine the Upper and Lower Lines around the Price. When the price passes below the lower boundary of the band, a downtrend is said to have begun.
Similarly, for an uptrend, this continues until the price passes over the upper edge of the band. Teal for an uptrend and fuchsia for a downturn area shared by the band to identify the trend.
The first five minutes of the breakout lines have a tiny buffer augmentation of 11% applied to them.
Based on what has been observed, support and resistance zones have been somewhat changed from the figures that are often utilized (might work other markets as well)
The markings that may be seen are as follows:
- Blue Triangle indicates a pocket pivot with an upward bias;
- Maroon Triangle indicates a pocket pivot with a downward bias;
- Teal colored Diamonds indicate price upthrusts and potential trend confirmation locations, depending on success or failure.
- Similar backdrop color changes that look as vertical shading are also used to identify them.
- Fuchsia-colored diamonds indicate price declines and a potential trend, depending on whether it persists or fails.
- Dark green and maroon square boxes indicate potential price reversals in the support and resistance bands, respectively.
It goes without saying that this work is derived from numerous other open-source community initiatives.
Feel free to adjust anything you'd like, and we appreciate any feedback.

MACD x SuperTrend with trailing stoplossThis trading strategy is based on MACD crossover and crossunder. It uses the supertrend to identify the trend it is trading on and takes trades accordingly. You can use the built in risk to reward ratio parameter through the settings of the indicator for your desired R/R
My goal in creating this indicator was to learn about risk management. This indicator will put up a stop-loss and take profit target according to the entry point it shows.
This indicator showed me the best results on BTC at 5min price chart. I'm new to trading so, do your own due diligence

SR Relative StrengthThis is a relative strength model for Indian Stock Markets where in the price of the stock in the current scenario is compared with the benchmark indices ( NIFTY / BANKNIFTY) over a period of 55 days ( by default).
This indicator also has RSI and Supertrend built-in by default. Hence this indicator can be used in place of 3 indicators.
How to use?
1. When the background is blue, it means that the stock is relatively strong as compared to the bench mark indices over a period of 55 days and the RSI is > 50
When both RS > 0 & RSI > 50 the background will be blue. If either or is true it won't turn blue.
2. Superternd by default setting is 10,3 which can be changed as per one's requirement.
Thanks!!

COSMO TREND👉 What is this indicator ?
This indicator is made up with the help of Multiple SuperTrend and Price Action , In this awesome indicator, The buy and sell entry is taken by comparing the trend using our secret logic.
👉 What is special about this indicator ?
More than Ten Takeprofit price points can be seen in this indicator , The Stoploss price point can be seen as well . You can simply adjust take profit percentage and stop loss percentage in indicator settings
👉 What kind of Take Profit signal is there on this indicator ?
Ten types of take profit signals are displayed on this indicator, each marked as TP1,TP2,TP3,TP4,TP5,TP6,TP7,TP8,TP9 and TP10 respectively. The take profit signals available for both buy and sell entries. The take profit of the buy entry is shown in Green Color and the take profit of the sell entry is shown in Red Color.
👉 What kind of Exit signal is there on this indicator ?
Exit signals can be seen at the end of the trend
👉 How many alarms does this indicator have ?
This indicator has 13 types of alarm for Buy , Sell , Take Profit and Exit signal, and it is best to set the alarm by selecting the Alert Once Bar Close option to avoid repaint.
👉 On which coins can this indicator be used ?
This indicator is best used on all cryptocurrencies, forex markets and stocks , This indicator is very helpful to get high returns on all cryptocurrencies with low price and high voltality
Note : This indicator only works well in all time frames ( 1s,5s,10s,1m,5m,1h etc...) , Use appropriate values when using other coins. If you have difficulty finding the value, you can contact us.
Default Setup Instructions 👇
Time Frame : 1 Minute
Default Coin : C98USDT
The following settings can be found in this indicator
You can simply adjust take profit percentage and stoploss percentage in indicator settings
Orgin Factor : This is the ATR Factor Value for High Time Frame trend. You can change this value according to the volatility , the ATR Factor value is also used to reduce the chance of a fake signal
Mid Factor : This is the ATR Factor Value for Low Time Frame trend. You can change this value according to the volatility , the ATR Factor value is also used to reduce the chance of a fake signal
Low Factor : This is the ATR Factor Value for Second Low Time Frame trend.
Take Profit - TP1 Percentage : Give What percentage for take First TP
Take Profit - TP2 Percentage : Give What percentage for take Second TP
Take Profit - TP3 Percentage : Give What percentage for take Third TP
Take Profit - TP4 Percentage : Give What percentage for take Fourth TP
Take Profit - TP4 Percentage : Give What percentage for take Fifth TP
Take Profit - TP4 Percentage : Give What percentage for take Sixth TP
Take Profit - TP4 Percentage : Give What percentage for take Seventh TP
Take Profit - TP4 Percentage : Give What percentage for take Eighth TP
Take Profit - TP4 Percentage : Give What percentage for take Nineth TP
Take Profit - TP4 Percentage : Give What percentage for take Tenth TP

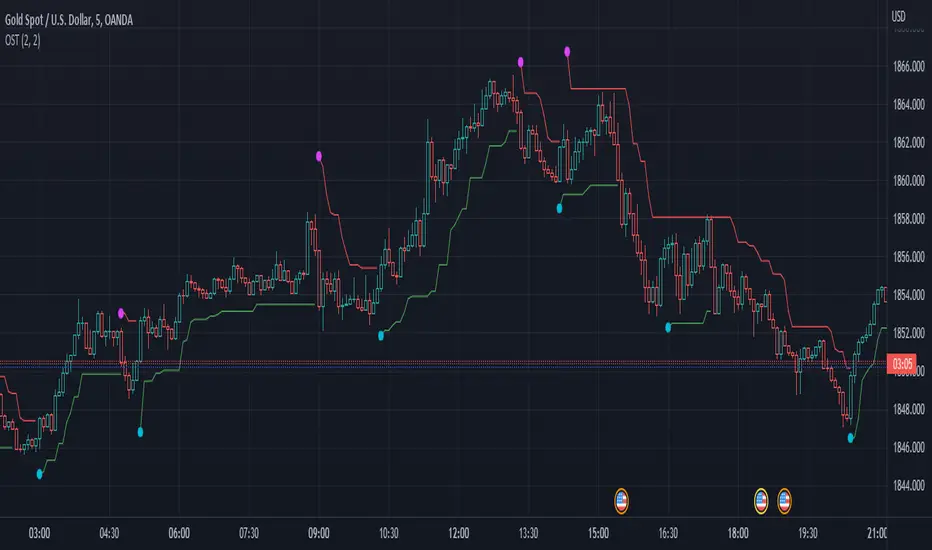
OST - Overlapped Super TrendThis Supertrend indicator uses different source for Uptrend and Downtrend lines.
Uptrend line uses high as its source.
Downtrend line uses low as its source.
Effect: It has faster Uptrend/Downtrend signals.
Triple SupertrendThis script is based on Supertrend Indicator. And added 2 more trends to get better confirmation.
Buy when all 3 lines are Green
Sell when all 3 lines are Red

7 Moving Averages [Plus]Moving Averages are price based, lagging (or reactive) indicators that display the average price of a security over a set period of time. A Moving Average is a good way to gauge momentum as well as to confirm trends, and define areas of support and resistance. Essentially, Moving Averages smooth out the “noise” when trying to interpret charts. Noise is made up of fluctuations of both price and volume. Because a Moving Average is a lagging indicator and reacts to events that have already happened, it is not used as a predictive indicator but as an interpretive one for confirmations and analysis.
Bollinger Bands (BB) are a widely popular technical analysis instrument created by John Bollinger. The BB consist of a band of three lines which are plotted in relation to security prices. The line in the middle is usually a Simple Moving Average (SMA) set to a period of 20 days (the type of trend line and period can be changed by the trader; however a 20 day moving average is by far the most popular). The SMA then serves as a base for the Upper and Lower Bands which are used as a way to measure volatility by observing the relationship between the Bands and price. Typically the Upper and Lower Bands are set to two standard deviations away from the SMA (The Middle Line); however the number of standard deviations can also be adjusted by the trader.
This script shows 6 moving averages and Bollinger Bands.
Features:
- Standard MA inputs.
- MA type.
- MA period.
- MA source.
- MA resolution (time frame).
- MA Offset.
- Forecasting : forcasted prices are calculated using our MAType and MASource for the MAPeriod.
- Trail: Show only candles not included in the MA calculation.
The color of MA1 depends on the chosen strategy, by default this is the 3EMA strategy. You can also select "Pivot Point Supertrend" or "Ichimoku Trend"
Added "Parabolic Stop and Reverse (PSAR)" . The PSAR is a time and price technical analysis tool primarily used to identify points of potential stops and reverses. In fact, the SAR in Parabolic SAR stands for "Stop and Reverse". The indicator's calculations create a parabola which is located below price during a Bullish Trend and above Price during a Bearish Trend.
Added "Linear Regression Channel" which can be correctly plotted on logarithmic charts. A linear regression channel consists of a median line with 2 parallel lines, above and below it, at the same distance. Those lines can be seen as support and resistance. The median line is calculated based on linear regression of the closing prices but the source can also be set to open, high or low. The height of the channel is based on the deviation of price to the median line. Extrapolating the channel forward can help to provide a bias and to find trading opportunities.
