Smart Indicator 21 - Fibonacci LinesA simple Indicator that create Fibonacci Lines as Price.
It's a good way to see next Support and Resistance.
Search in scripts for "support"

Point and Figure (PnF) ChartThis is live and non-repainting Point and Figure Charting tool. The tool has it’s own P&F engine and not using integrated function of Trading View.
Point and Figure method is over 150 years old. It consist of columns that represent filtered price movements. Time is not a factor on P&F chart but as you can see with this script P&F chart created on time chart.
P&F chart provide several advantages, some of them are filtering insignificant price movements and noise, focusing on important price movements and making support/resistance levels much easier to identify.
If you are new to Point & Figure Chart then you better get some information about it before using this tool. There are very good web sites and books. Please PM me if you need help about resources.
Options in the Script
Box size is one of the most important part of Point and Figure Charting. Chart price movement sensitivity is determined by the Point and Figure scale. Large box sizes see little movement across a specific price region, small box sizes see greater price movement on P&F chart. There are four different box scaling with this tool: Traditional, Percentage, Dynamic (ATR), or User-Defined
4 different methods for Box size can be used in this tool.
User Defined: The box size is set by user. A larger box size will result in more filtered price movements and fewer reversals. A smaller box size will result in less filtered price movements and more reversals.
ATR: Box size is dynamically calculated by using ATR, default period is 20.
Percentage: uses box sizes that are a fixed percentage of the stock's price. If percentage is 1 and stock’s price is $100 then box size will be $1
Traditional: uses a predefined table of price ranges to determine what the box size should be.
Price Range Box Size
Under 0.25 0.0625
0.25 to 1.00 0.125
1.00 to 5.00 0.25
5.00 to 20.00 0.50
20.00 to 100 1.0
100 to 200 2.0
200 to 500 4.0
500 to 1000 5.0
1000 to 25000 50.0
25000 and up 500.0
Default value is “ATR”, you may use one of these scaling method that suits your trading strategy.
If ATR or Percentage is chosen then there is rounding algorithm according to mintick value of the security. For example if mintick value is 0.001 and box size (ATR/Percentage) is 0.00124 then box size becomes 0.001.
And also while using dynamic box size (ATR or Percentage), box size changes only when closing price changed.
Reversal : It is the number of boxes required to change from a column of Xs to a column of Os or from a column of Os to a column of Xs. Default value is 3 (most used). For example if you choose reversal = 2 then you get the chart similar to Renko chart.
Source: Closing price or High-Low prices can be chosen as data source for P&F charting.
Chart Style: There are 3 options for chart style: “Candle”, “Area” or “Don’t show”.
As Area:
As Candle:
X/O Column Style: it can show all columns from opening price or only last Xs/Os.
Color Theme: different themes exist => Green/Red, Yellow/Blue, White/Yellow, Orange/Blue, Lime/Red, Blue/Red
Show Breakouts is the option to show Breakouts
This tool detects & shows following Breakouts:
Triple Top/Bottom,
Triple Top Ascending,
Triple Bottom Descending,
Simple Buy/Sell (Double Top/Bottom),
Simple Buy With Rising Bottom,
Simple Sell With Declining Top
Catapult bullish/bearish
Show Horizontal Count Targets: Finds the congestion or consolidation pattern and if there is breakout then it calculates the Target by using Horizontal Count method (based on the width of congestion pattern). It shows how many column exist on congestion area. There is no guarantee that prices will reach the target.
Show Vertical Count Targets: When Triple Top/Bottom Breakouts occured the script calculates the target by using Vertical Count Method (based on the length of the column). There is no guarantee that prices will reach the target.
For both methods there is auto target cancellation if price goes below congestion bottom or above congestion top.
trend is calculated by EMA of closing price of the P&F
Whipsaw protection:
Last options are “Show info panel” and Labeling Offset. Script shows current box size, reversal, and recommanded minimum and maximum box size. And also it shows the price level to reverse the column (Xs <-> Os) and the price level to add at least 1 more box to column. This is the option to put these labels 10, 20, 30, 50 or 100 bars away from the last bar. Labeling content and color change according to X/O column.
do not hesitate to comment.

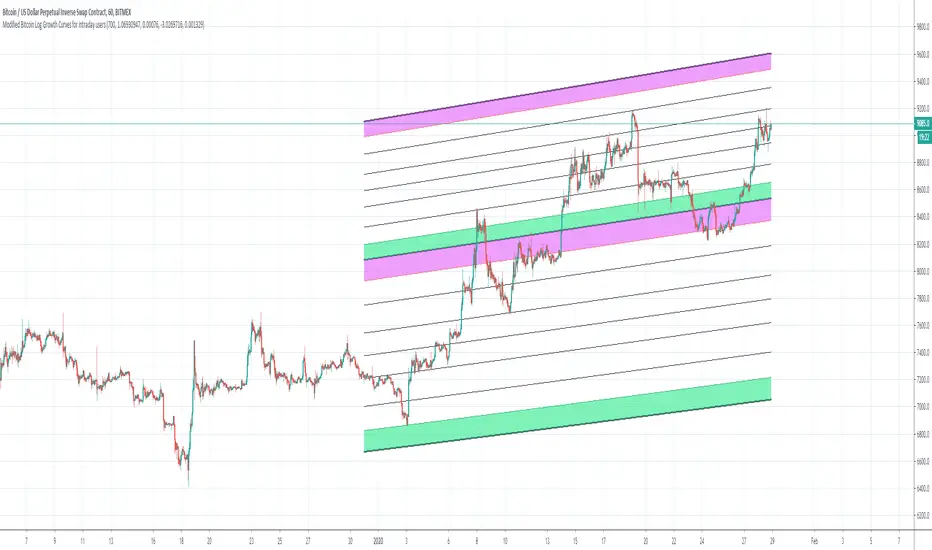
Bitcoin Logarithmic Growth Curves for intraday usersI wish to thank @Quantadelic who created this great indicator and leaving it open for others to improve.
I have made changes to make it user-friendly for the intraday traders.
The changes made have been;
1. Compartmentalized each area of the major Fibonacci level;
2. Added minor Fibonacci levels;
3. Color-coded the support and resistance levels, for better viewing;
4. Zoned each area of the major Fibonacci level; and
5. Created a time-frame display period for quicker loading of the indicator.
I have removed a few things to allow the indicator to run quicker;
1. Future projections; and
2. The major higher levels of the Fibonacci, which may be useful when Bitcoin reaches 100k.
Enjoy
[PX] Lookback LevelHey guys,
this indicator detects support and resistance level based on the number of times a level got tested in a certain range.
How does it work?
In the user input settings, you will be able to choose between two modes "Tested Level" and "Untested Level".
"Tested Level" will be detected by the number of times a certain low or high got tested in the "Lookback"-range, while fitting in the "Deviation"-range of the specific high or low. A crossing of the level is allowed. The "Untested Level" work the same way, but crossings of the level will eliminate it.
The indicator is highly dependent on which input you will use. Please play around with the settings and see how it works on different timeframes and symbols.
As always, it comes with styling options for the levels.
If some of you find it useful, please leave a like and hit the follow button :)
Happy trading,
paaax

5PRBThis script will plot the support and resistance levels calculated based on previous five days OHL data. Apart from the resistance and support levels, this script also plots the pivots for BUY and SELL trigger points.

Support and Resistance linesThis indicator allows you to set 5 SR lines for 8 currency pairs. The SR line variables need to be set in the pine script.
It is easy to add more currency pairs or change the number of SR lines.
The indicator works in the following time frames: 1D, 12H, 8H, 6H, 4H
In the active time frame green and red vertical lines indiate a potential reversal.
Higher time frame occurrences are indicated by e.g. 8H, 12H labels above or below the price line.
So, e.g. in the 12H window you can see D labels. And in the 8H window you can see 12H and D labels.
The indicator recognizes 4 long and 4 short patterns. These patterns are very simple. See the section "Conditions for PriceAction patterns" in the pine script.
If you desire please go ahead and change the patterns or add new ones. This is the most difficult part. If you come up with good ones please post them here.

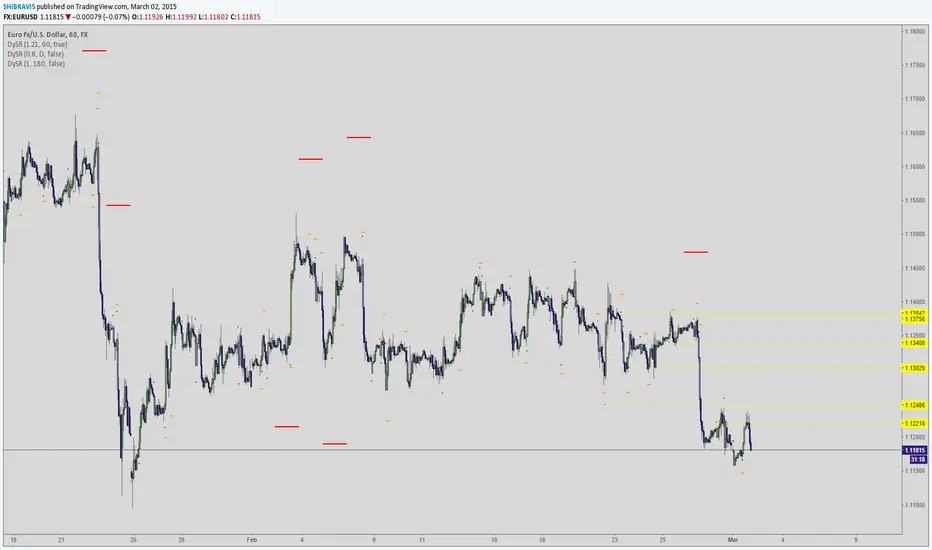
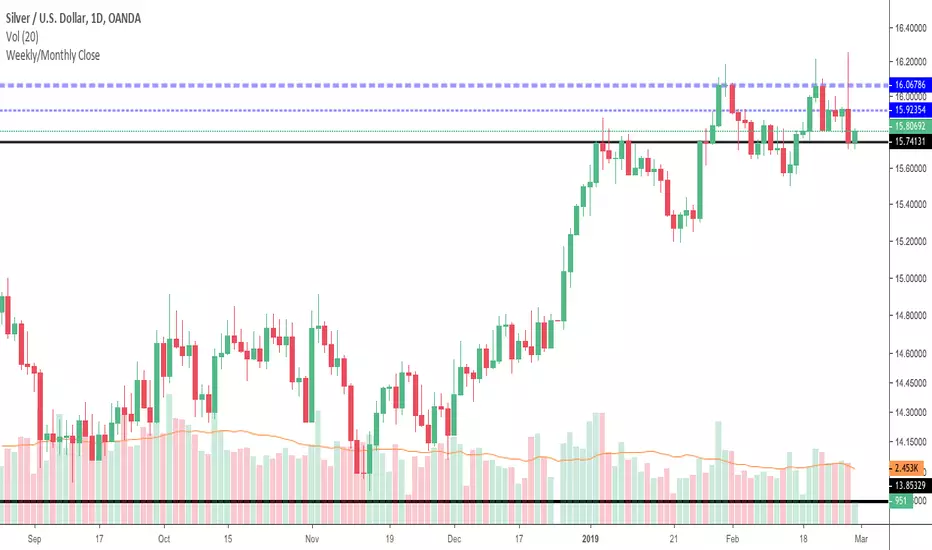
Weekly/Monthly CloseJust a simple support/resistance indicator that display weekly/monthly close price and it is configurable to work in two modes:
tracking mode - to display last week/month's close
history mode - to display weekly/monthly close prices
See how last month's close (ticker blue line) provides nice resistance and the price forms a double top then it consolidates under last week's close line (thiner blue line).
It also works on intraday charts and displays history close prices, see below how last month's close (ticker blue line) provides support over and over and also how price bounces off weekly close history prices (thiner blue line).
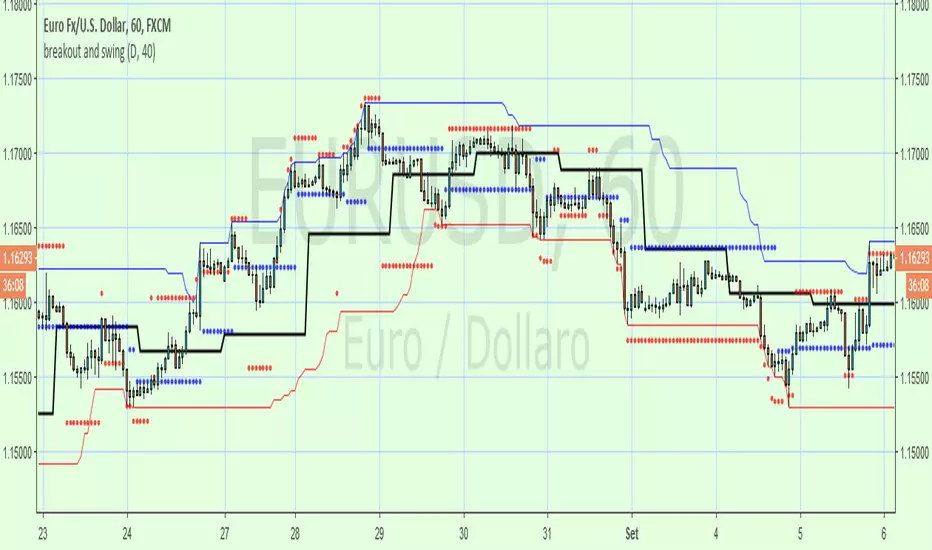
breakout and swingA Price Action system that use swing point and breakout
above the black line (breakout) is long, below short
swing/support/resistance points (blue circles) are displayed after a top or botton, breaking it means an inversion
red circles try to guest a target after a top/bottom or after a swing break.
the main trend is made by the black line that is set on Day period suitable for 1h to 15m time frame , for small TF you can set a smaller period from setting command
By default a set a 40 period channel high/low (the highest and lowest 40 bar back) that is ok for 1 h or smaller tf , but look to long for daily tf, adjust it yourself
Modified Point of ControlThis script finds the candle with the highest volume per an adjustable lookback. It can be used to help determine support and resistance.

CryptoShadows V1The first Diagonal Support and Resistance indicator. Best for bitcoin and cryptocurrencies

SMMA Analyses - Buy / Sell signals and close position signals This script combines the usage of the SMMA indicator in order to provide signals for opening and closing trades, either buy or sell signals.
It uses two SMMA , a fast and a slow one, both configurable by the users.
The trigger of Buy and Sell Signals are calculated through the SMMA crosses:
Buy Signals : The fast SMMA crosses over the slow SMMA . They are highlighting by a green area and a "B" label.
Sell Signals : The fast SMMA crosses under the slow SMMA . They are highlighting by a red area and a "S" label
The trigger of Close Buy and Close Sell Signals are calculated through the close price crosses with the fast SMMA:
Close Buy Signals : The fast SMMA crosses under the close price and at the same time the trend is bullish , so the fast SMMA is greater than the slow SMMA . They are highlighted by a lighter green area
Close Sell Signals : The fast SMMA crosses over the close price and at the same time the trend is bearish , so the fast SMMA is lower than the slow SMMA . They are highlighted by a lighter red area
Few important points about the indicator and the produced signals :
This is not intended to be a strategy, but an indicator for analyzing the SMMA conditions. It gives you the triggers depending on the real time analysis of the SMMA and prices, but not being a proper strategy, pay attention about "fake signals" and add always a visual analysis to the provided signals
Following this indicator, the trade positions should be opened only when a cross happens. Either in this case, analyse the chart in order to see if the signals are a "weak" ones, due to "waves" around the SMMA . In these cases, you might wait for the next confirmation signals after the waves, when the trend will be better defined
The close trade signals are provided in order to help to understand when you should close the buy or sell trades. Even in this case, always add a visual analysis to the signals, and pay attention to the support/resistance areas. Sometimes, you can have the close signals in correspondence to support/resistance areas: in these cases wait for the definition of the trend and eventually for the next close trade signals if they will be better defined

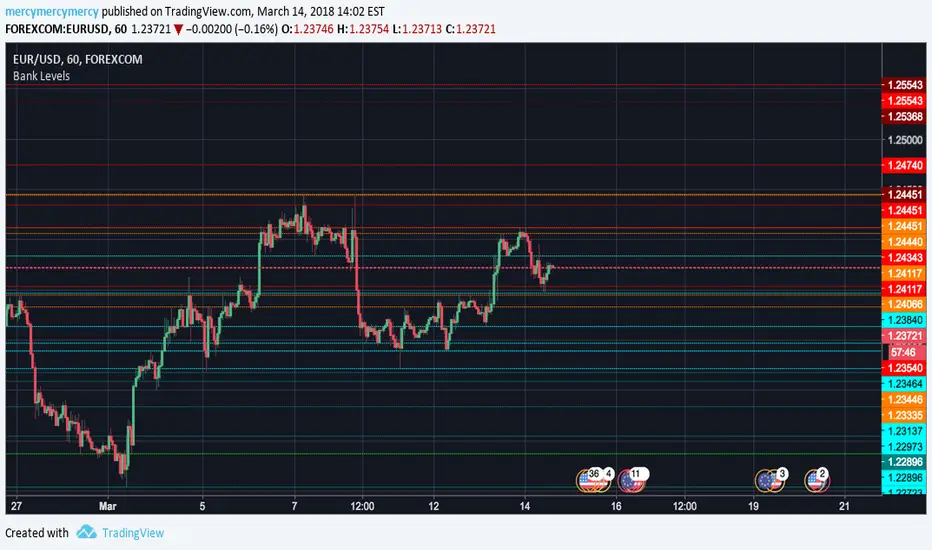
Bank Levels, 6 Previous, D W MIf you trade Forex this is the indicator you need above all. Most recent six highs and lows on the daily, weekly, and monthly (includes current day). Support and resistance isn't quite what it is...until when that's exactly how it often plays out on the lines. They are called bank levels for a reason. *Not every line will support or resist of course*
Bill Williams. Alligator, Fractals & Res/Sup combined (by vlkvr)Bill Williams indicators (each separately) are simple and quite self-sufficient, however, are most often used together. The key ones (Alligator and Fractals) are freely available and everyone can use them, but why use them on the chart separately, when "together more fun", and not conceivable, in my opinion, they are one without the other.
So, I present "split/copypasta" of two key indicators of Bill Williams, plus (as a bonus) visualization of "Support/Resistance" levels (and in fact, lines from extremes or the same fractals).
As a result, before you indicator "three-in-one".

4 Exponential Moving Averages + One Extra for 1D Charts4 Exponential Moving Averages + One Extra for 1D Charts
I use 4 EMAs for my 1 hour and 4 hours Chart.
Additionally for 1D Charts, sometime i need to use 9 EMA. Now is in place. Enjoy it!
I used them only for support my analisys based on Elliot Waves and Fibonacci projections and Retracements, which are my main strategy.

MavilimWThis Indicator plots smoothed weighted moving average combinations of various Fibonacci numbers
a great support and resistance for long term trading and confirmation

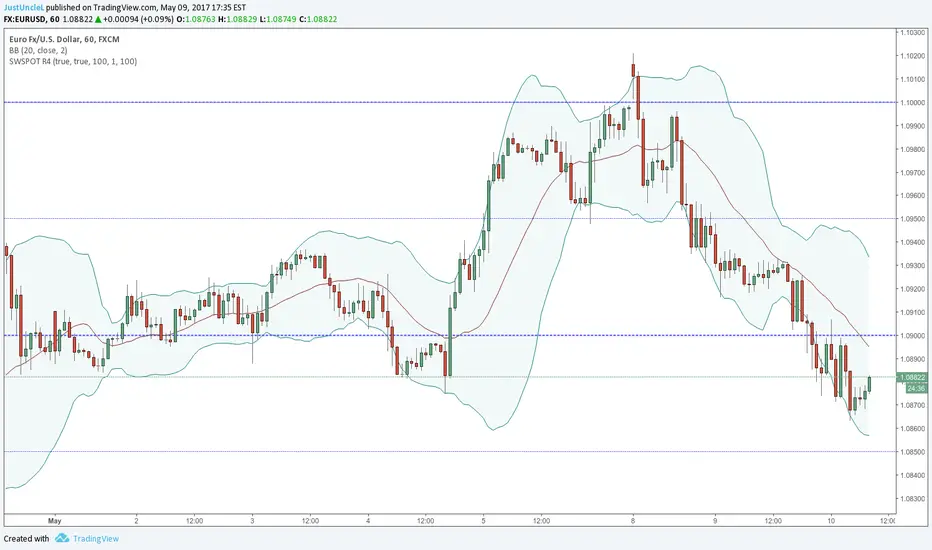
Sweetspot Gold R4-22 - by JustUncleLThis upgrade I have attempted to improve the Automatic levels calculation and better automatic levels selections. It should now work better with exotic currencies, indices, commodities, and stocks.
The indicator plots the so called "round price levels" or "00" levels, which end on 00 and 50: for example, 1.4000, 1.4400, 1.4450. It automatically calculates the levels for based on your charts time frame. Alternatively you can manually select main level size (in pips) and/or the number of sub-levels (0, 1, 2, 3, 9). Generally speaking, the program tries to keep to 3 Digit "00" rounding for currencies and non-stocks, and 2 Digit "00" rounding for Stocks.
Use this indicator as a guidance to a better mapping of Support/Resistance levels on the chart. Next time you draw Support/Resistance lines, if they coincide with round price levels, especially "00", you have got a excellent S/R level to work with!
Scalping PullBack Tool R1 by JustUncleLDescription
This study project is a Scalping Pullback trading Tool that incorporates the majority of the indicators needed to analyse and scalp Trends for Pull Backs and reversals on 1min, 5min or 15min charts. The set up utilies Heikin Ashi candle charts. Incorporated within this tool are the following indicators:
1. Major industry (Banks) recognised important EMAs in an EMA Ribbon:
Green = EMA89
Blue = EMA200
Black = EMA633
2. The 36EMA (default) High/Low+Close Price Action Channel (PAC).
3. Fractals
4. HH, LH, LL, HL finder to help with drawing Trend lines and mini Trend Lines.
5. Coloured coded Bar high lighting based on the PAC:
blue = bar closed above PAC
red = bar closed below PAC
gray = bar closed inside PAC
red line = EMA36 of bar close
Setup and hints:
Set the chart to Heikin Ashi Candles.
Add "Sweetspot Gold10" indicator to the chart as well to help with support and resistance finding and shows where the important "00" and "0" lines are.
When price is above the PAC(blue bars) we are only looking to buy as price comes back to the PAC
When price is below the PAC(red bars), we are only looking to sell when price comes back to the PAC
What we’re looking for when price comes back into the PAC we draw mini Trendlines utilising the Fractals and HH/LL points to guide your TL drawing.
Now look for the trend to pull back and break the drawn TL. That's is when we place the scalp trade.
So we are looking for continuation signals in terms of a strong, momentum driven pullbacks (normally short term 10-20 pips) of the EMA36.
The other EMAs are there to check for other Pullbacks when EMA36 is broken.
Other than the SweetSpot Gold10 indicator, you should not need any other indicator to scalp the pullbacks.
References:
Fractals V8 by RicardoSantos
Price Action Trading System v0.3 by JustUncleL
SweetSpot Gold10 R1 by JustUncleL
www.swing-trade-stocks.com
www.forexstrategiesresources.com

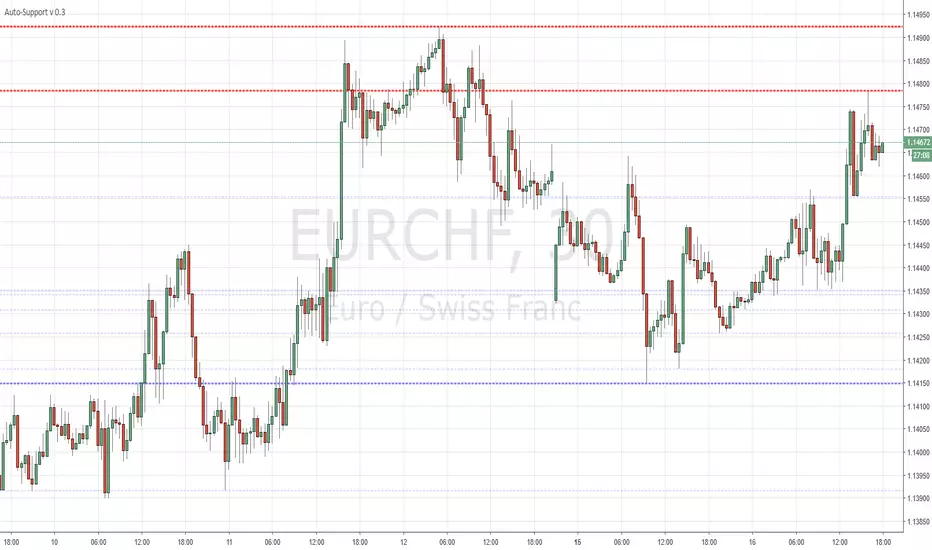
Auto-Support v 0.2Same script as the previous version with a slight twist
Have added (lines) "Transparency" to the settings to avoid having to edit every line individually ...
Cheers
CD_Average Daily Range Zones- highs and lows of the dayUses daily average ranges of 5 and 10 (most used) as buy (support) and highs (resistance) areas - half ranges used in calculations for a more accurate "forecast" of the H and L . Uses open but not close, so it does not repaint - experimental

ET-ATR-Price-OverlayOverlays the Average True Range high/low over Price. Shifts between support and resistance levels (based on ATR-21) according to price trend and breaks.
Average true range: en.wikipedia.org
@EmpoweredTrader

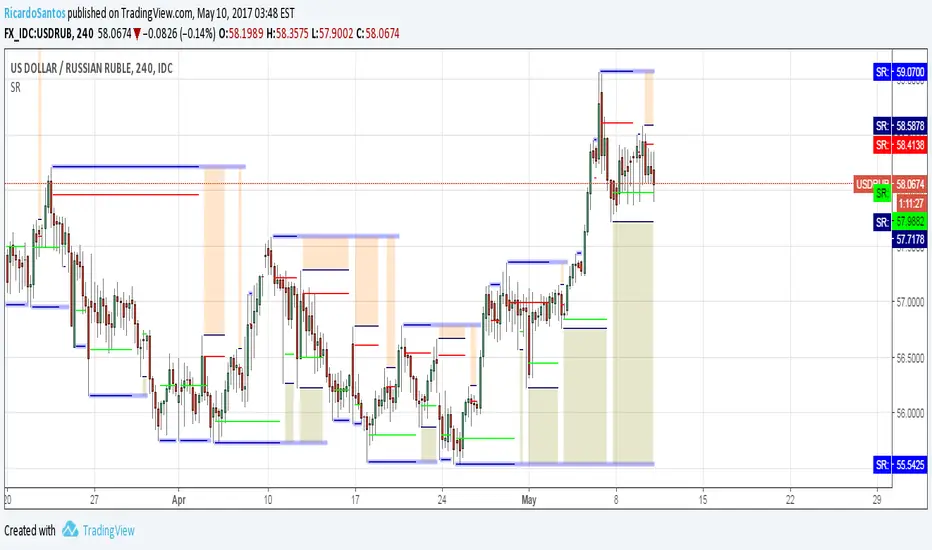
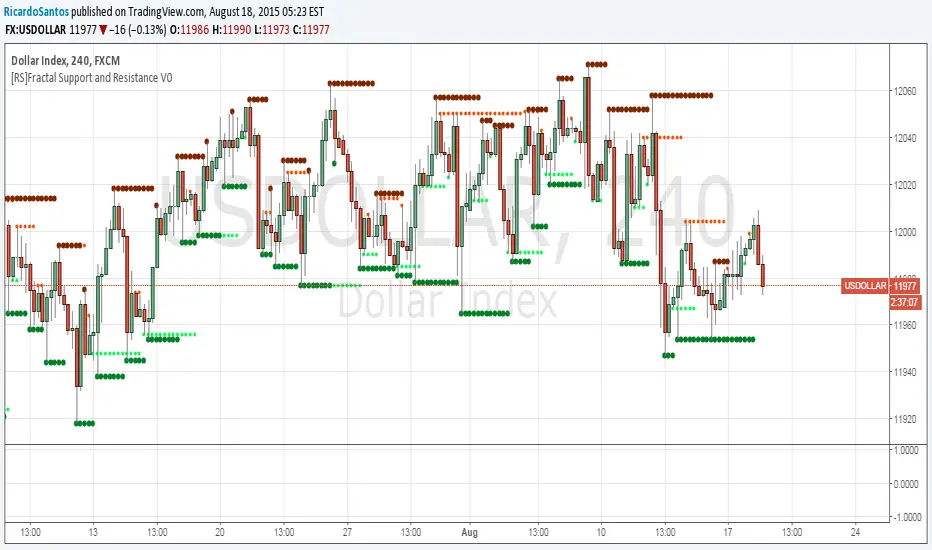
[RS]Fractal Support and Resistance V0Fractal based SR levels:
lime and red are hidden levels based on "/\" lows and "\/" highs.
green and maroon are based on regular fracals "\/" lows and "/\" highs.
Dynamic SUPRES Multi Timeframe UpdateDynamic SUPRES can be interpreted in different ways. Each square marks an area of congestion that could serve as support and resistance.
FLASH UPDATE: Now is possible to choose the timeframe and the bars color on/off.