Trading Report Generator from CSVMany people use the Trading Panel. Unfortunately, it doesn't have a Performance Report. However, TradingView has strategies, and they have a Performance Report :-D
What if we combine the first and second? It's easy!
This script is a special strategy that parses transactions in csv format from Paper Trading (and it will also work for other brokers) and “plays” them. As a result, we get a Performance Report for a specific instrument based on our real trades in Paper or another broker.
How to use it :
First, we need to get a CSV file with transactions. To do this, go to the Trading Panel and connect the desired broker. Select the History tab, then the Filled sub-tab, and configure the columns there, leaving only: Side, Qty, Fill Price, Closing Time. After that, open the Export data dialog, select History, and click Export. Open the downloaded CSV file in a regular text editor (Notepad or similar). It will contain a text like this:
Symbol,Side,Qty,Fill Price,Closing Time
FX:EURUSD,Buy,1000,1.0938700000000001,2023-04-05 14:29:23
COINBASE:ETHUSD,Sell,1,1332.05,2023-01-11 17:41:33
CME_MINI:ESH2023,Sell,1,3961.75,2023-01-11 17:30:40
CME_MINI:ESH2023,Buy,1,3956.75,2023-01-11 17:08:53
Next select all the text (Ctrl+A) and copy it to the clipboard.
Now apply the "Trading Report Generator from CSV" strategy to the chart with the desired symbol and TF, open the settings/input dialog, paste the contents of the clipboard into the single text input field of the strategy, and click Ok.
That's it.
In the Strategy Tester, we see a detailed Performance Report based on our real transactions.
P.S. The CSV file may contain transactions for different instruments, for example, you may have transactions for CRYPTO:BTCUSD and NASDAQ:AAPL. To view the report is based on CRYPTO:BTCUSD trades, simply change the symbol on the chart to CRYPTO:BTCUSD. To view the report is based on NASDAQ:AAPL trades, simply change the symbol on the chart to NASDAQ:AAPL. No changes to the strategy are required.
How it works :
At the beginning of the calculation, we parse the csv once, create trade objects (Trade) and sort them in chronological order. Next, on each bar, we check whether we have trades for the time period of the next bar. If there are, we place a limit order for each trade, with limit price == Fill Price of the trade. Here, we assume that if the trade is real, its execution price will be within the bar range, and the Pine strategy engine will execute this order at the specified limit price.
Search in scripts for "text"

Vertical Time Marker Configurable (VTMC)# Vertical Time Marker Configurable (VTMC)
## Overview
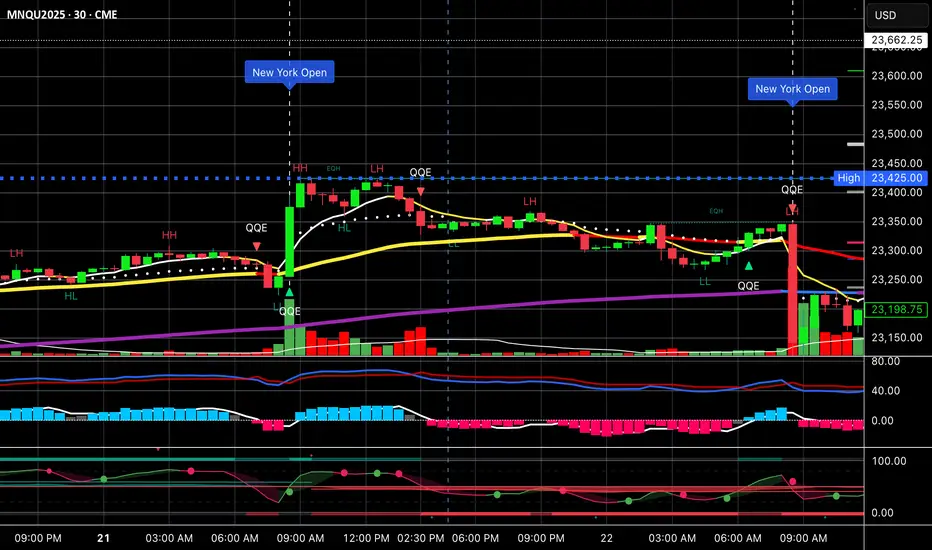
The Vertical Time Marker Configurable (VTMC) is a powerful PineScript v6 indicator designed to help traders quickly identify key market times across their entire chart history. Instead of hovering over candles to check timestamps, VTMC draws clear vertical lines with customizable labels at your specified times, making it easy to spot important market sessions, news events, or personal trading windows at a glance.
## Key Features
### ⏰ Flexible Time Selection
- Set any time using an intuitive time picker (defaults to 8:30 AM Central Time)
- Automatically draws lines at your specified time across all historical data
- Perfect for marking market opens, closes, news releases, or personal trading times
### 🎨 Full Visual Customization
- **Line Color**: Choose any color (defaults to white for maximum visibility)
- **Line Style**: Solid, dashed, or dotted options
- **Line Width**: Adjustable from 1-10 pixels
- **Opacity Control**: Precise opacity slider (0-100%) for both line and text
### 🏷️ Smart Text Labels
- **Preset Options**: New York Open, New York Close, London Open, London Close, Asia Open, Asia Close
- **Custom Labels**: Enter any text for personalized marking (news events, trading windows, etc.)
- **Configurable Text**: Adjustable size (8-20px), color, and opacity
- **Smart Positioning**: Text appears just above the price action for clear visibility
### 📊 Professional Display
- Lines extend fully from top to bottom of chart
- Clean, non-intrusive design that doesn't clutter your analysis
- Works on any timeframe and market
- Historical lines persist across all chart data
## Perfect For
### Market Session Traders
- Mark key session opens and closes
- Identify overlap periods between major markets
- Track session-specific price behavior patterns
### News Traders
- Mark important economic releases (FOMC, NFP, etc.)
- Create visual reminders for scheduled events
- Track market reaction patterns around news times
### Institutional Flow Traders
- Identify key institutional activity times
- Mark order block formation periods
- Track smart money movement windows
### Personal Trading Systems
- Mark your optimal trading hours
- Create visual discipline for trading windows
- Track performance during specific time periods
## Why VTMC?
Unlike hardcoded session indicators that only work for specific markets, VTMC gives you complete flexibility to mark ANY time that matters to your trading strategy. Whether you're tracking "MY Trading Window" from 9:30-10:30 AM or marking custom news events, VTMC adapts to your specific needs.
The indicator eliminates the constant need to hover over candles to check times, instead providing instant visual reference points across your entire chart. This makes pattern recognition, backtesting, and trade timing significantly more efficient.
## Usage Tips
- Use multiple instances for different time zones or events
- Combine with other indicators for comprehensive market timing
- Customize colors to match your chart theme
- Use custom labels for personalized trading reminders
*Built with precision in PineScript v6 for reliable performance and modern TradingView compatibility.*
MACD Liquidity Tracker Strategy [Quant Trading]MACD Liquidity Tracker Strategy
Overview
The MACD Liquidity Tracker Strategy is an enhanced trading system that transforms the traditional MACD indicator into a comprehensive momentum-based strategy with advanced visual signals and risk management. This strategy builds upon the original MACD Liquidity Tracker System indicator by TheNeWSystemLqtyTrckr , converting it into a fully automated trading strategy with improved parameters and additional features.
What Makes This Strategy Original
This strategy significantly enhances the basic MACD approach by introducing:
Four distinct system types for different market conditions and trading styles
Advanced color-coded histogram visualization with four dynamic colors showing momentum strength and direction
Integrated trend filtering using 9 different moving average types
Comprehensive risk management with customizable stop-loss and take-profit levels
Multiple alert systems for entry signals, exits, and trend conditions
Flexible signal display options with customizable entry markers
How It Works
Core MACD Calculation
The strategy uses a fully customizable MACD configuration with traditional default parameters:
Fast MA : 12 periods (customizable, minimum 1, no maximum limit)
Slow MA : 26 periods (customizable, minimum 1, no maximum limit)
Signal Line : 9 periods (customizable, now properly implemented and used)
Cryptocurrency Optimization : The strategy's flexible parameter system allows for significant optimization across different crypto assets. Traditional MACD settings (12/26/9) often generate excessive noise and false signals in volatile crypto markets. By using slower, more smoothed parameters, traders can capture meaningful momentum shifts while filtering out market noise.
Example - DOGE Optimization (45/80/290 settings) :
• Performance : Optimized parameters yielding exceptional backtesting results with 29,800% PnL
• Why it works : DOGE's high volatility and social sentiment-driven price action benefits from heavily smoothed indicators
• Timeframes : Particularly effective on 30-minute and 4-hour charts for swing trading
• Logic : The very slow parameters filter out noise and capture only the most significant trend changes
Other Optimizable Cryptocurrencies : This parameter flexibility makes the strategy highly effective for major altcoins including SUI, SEI, LINK, Solana (SOL) , and many others. Each crypto asset can benefit from custom parameter tuning based on its unique volatility profile and trading characteristics.
Four Trading System Types
1. Normal System (Default)
Long signals : When MACD line is above the signal line
Short signals : When MACD line is below the signal line
Best for : Swing trading and capturing longer-term trends in stable markets
Logic : Traditional MACD crossover approach using the signal line
2. Fast System
Long signals : Bright Blue OR Dark Magenta (transparent) histogram colors
Short signals : Dark Blue (transparent) OR Bright Magenta histogram colors
Best for : Scalping and high-volatility markets (crypto, forex)
Logic : Leverages early momentum shifts based on histogram color changes
3. Safe System
Long signals : Only Bright Blue histogram color (strongest bullish momentum)
Short signals : All other colors (Dark Blue, Bright Magenta, Dark Magenta)
Best for : Risk-averse traders and choppy markets
Logic : Prioritizes only the strongest bullish signals while treating everything else as bearish
4. Crossover System
Long signals : MACD line crosses above signal line
Short signals : MACD line crosses below signal line
Best for : Precise timing entries with traditional MACD methodology
Logic : Pure crossover signals for more precise entry timing
Color-Coded Histogram Logic
The strategy uses four distinct colors to visualize momentum:
🔹 Bright Blue : MACD > 0 and rising (strong bullish momentum)
🔹 Dark Blue (Transparent) : MACD > 0 but falling (weakening bullish momentum)
🔹 Bright Magenta : MACD < 0 and falling (strong bearish momentum)
🔹 Dark Magenta (Transparent) : MACD < 0 but rising (weakening bearish momentum)
Trend Filter Integration
The strategy includes an advanced trend filter using 9 different moving average types:
SMA (Simple Moving Average)
EMA (Exponential Moving Average) - Default
WMA (Weighted Moving Average)
HMA (Hull Moving Average)
RMA (Running Moving Average)
LSMA (Least Squares Moving Average)
DEMA (Double Exponential Moving Average)
TEMA (Triple Exponential Moving Average)
VIDYA (Variable Index Dynamic Average)
Default Settings : 50-period EMA for trend identification
Visual Signal System
Entry Markers : Blue triangles (▲) below candles for long entries, Magenta triangles (▼) above candles for short entries
Candle Coloring : Price candles change color based on active signals (Blue = Long, Magenta = Short)
Signal Text : Optional "Long" or "Short" text inside entry triangles (toggleable)
Trend MA : Gray line plotted on main chart for trend reference
Parameter Optimization Examples
DOGE Trading Success (Optimized Parameters) :
Using 45/80/290 MACD settings with 50-period EMA trend filter has shown exceptional results on DOGE:
Performance : Backtesting results showing 29,800% PnL demonstrate the power of proper parameter optimization
Reasoning : DOGE's meme-driven volatility and social sentiment spikes create significant noise with traditional MACD settings
Solution : Very slow parameters (45/80/290) filter out social media-driven price spikes while capturing only major momentum shifts
Optimal Timeframes : 30-minute and 4-hour charts for swing trading opportunities
Result : Exceptionally clean signals with minimal false entries during DOGE's characteristic pump-and-dump cycles
Multi-Crypto Adaptability :
The same optimization principles apply to other major cryptocurrencies:
SUI : Benefits from smoothed parameters due to newer coin volatility patterns
SEI : Requires adjustment for its unique DeFi-related price movements
LINK : Oracle news events create price spikes that benefit from noise filtering
Solana (SOL) : Network congestion events and ecosystem developments need smoothed detection
General Rule : Higher volatility coins typically benefit from very slow MACD parameters (40-50 / 70-90 / 250-300 ranges)
Key Input Parameters
System Type : Choose between Fast, Normal, Safe, or Crossover (Default: Normal)
MACD Fast MA : 12 periods default (no maximum limit, consider 40-50 for crypto optimization)
MACD Slow MA : 26 periods default (no maximum limit, consider 70-90 for crypto optimization)
MACD Signal MA : 9 periods default (now properly utilized, consider 250-300 for crypto optimization)
Trend MA Type : EMA default (9 options available)
Trend MA Length : 50 periods default (no maximum limit)
Signal Display : Both, Long Only, Short Only, or None
Show Signal Text : True/False toggle for entry marker text
Trading Applications
Recommended Use Cases
Momentum Trading : Capitalize on strong directional moves using the color-coded system
Trend Following : Combine MACD signals with trend MA filter for higher probability trades
Scalping : Use "Fast" system type for quick entries in volatile markets
Swing Trading : Use "Normal" or "Safe" system types for longer-term positions
Cryptocurrency Trading : Optimize parameters for individual crypto assets (e.g., 45/80/290 for DOGE, custom settings for SUI, SEI, LINK, SOL)
Market Suitability
Volatile Markets : Forex, crypto, indices (recommend "Fast" system or smoothed parameters)
Stable Markets : Stocks, ETFs (recommend "Normal" or "Safe" system)
All Timeframes : Effective from 1-minute charts to daily charts
Crypto Optimization : Each major cryptocurrency (DOGE, SUI, SEI, LINK, SOL, etc.) can benefit from custom parameter tuning. Consider slower MACD parameters for noise reduction in volatile crypto markets
Alert System
The strategy provides comprehensive alerts for:
Entry Signals : Long and short entry triangle appearances
Exit Signals : Position exit notifications
Color Changes : Individual histogram color alerts
Trend Conditions : Price above/below trend MA alerts
Strategy Parameters
Default Settings
Initial Capital : $1,000
Position Size : 100% of equity
Commission : 0.1%
Slippage : 3 points
Date Range : January 1, 2018 to December 31, 2069
Risk Management (Optional)
Stop Loss : Disabled by default (customizable percentage-based)
Take Profit : Disabled by default (customizable percentage-based)
Short Trades : Disabled by default (can be enabled)
Important Notes and Limitations
Backtesting Considerations
Uses realistic commission (0.1%) and slippage (3 points)
Default position sizing uses 100% equity - adjust based on risk tolerance
Stop-loss and take-profit are disabled by default to show raw strategy performance
Strategy does not use lookahead bias or future data
Risk Warnings
Past performance does not guarantee future results
MACD-based strategies may produce false signals in ranging markets
Consider combining with additional confluences like support/resistance levels
Test thoroughly on demo accounts before live trading
Adjust position sizing based on your risk management requirements
Technical Limitations
Strategy does not work on non-standard chart types (Heikin Ashi, Renko, etc.)
Signals are based on close prices and may not reflect intraday price action
Multiple rapid signals in volatile conditions may result in overtrading
Credits and Attribution
This strategy is based on the original "MACD Liquidity Tracker System" indicator created by TheNeWSystemLqtyTrckr . This strategy version includes significant enhancements:
Complete strategy implementation with entry/exit logic
Addition of the "Crossover" system type
Proper implementation and utilization of the MACD signal line
Enhanced risk management features
Improved parameter flexibility with no artificial maximum limits
Additional alert systems for comprehensive trade management
The original indicator's core color logic and visual system have been preserved while expanding functionality for automated trading applications.

Trend Tracker ProTrend Tracker Pro - Advanced Trend Following Indicator
Overview
Trend Tracker Pro is a sophisticated trend-following indicator that combines the power of Exponential Moving Average (EMA) and Average True Range (ATR) to identify market trends and generate precise buy/sell signals. This indicator is designed to help traders capture trending moves while filtering out market noise.
🎯 Key Features
✅ Dynamic Trend Detection
Uses EMA and ATR-based bands to identify trend direction
Automatically adjusts to market volatility
Clear visual trend line that changes color based on market direction
✅ Precise Signal Generation
Buy signals when trend changes to bullish
Sell signals when trend changes to bearish
Reduces false signals by requiring actual trend changes
✅ Visual Clarity
Green trend line: Bullish trend
Red trend line: Bearish trend
Gray trend line: Sideways/neutral trend
Triangle arrows for buy/sell signals
Clear BUY/SELL text labels
✅ Customizable Settings
Trend Length: Adjustable period for EMA and ATR calculation (default: 14)
ATR Multiplier: Controls sensitivity of trend bands (default: 2.0)
Show/Hide Signals: Toggle signal arrows on/off
Show/Hide Labels: Toggle text labels on/off
✅ Built-in Information Panel
Real-time trend direction display
Current trend level value
ATR value for volatility reference
Last signal information
✅ TradingView Alerts
Buy signal alerts
Sell signal alerts
Customizable alert messages
🔧 How It Works
Algorithm Logic:
1.
Calculate EMA: Uses exponential moving average for trend baseline
2.
Calculate ATR: Measures market volatility
3.
Create Bands: Upper band = EMA + (ATR × Multiplier), Lower band = EMA - (ATR × Multiplier)
4.
Determine Trend:
Price above upper band → Bullish trend (trend line = lower band)
Price below lower band → Bearish trend (trend line = upper band)
Price between bands → Continue previous trend
5.
Generate Signals: Signal occurs when trend direction changes
📊 Best Use Cases
✅ Trending Markets
Excellent for capturing strong directional moves
Works well in both bull and bear markets
Ideal for swing trading and position trading
✅ Multiple Timeframes
Effective on all timeframes from 15 minutes to daily
Higher timeframes provide more reliable signals
Can be used for both scalping and long-term investing
✅ Various Asset Classes
Stocks, Forex, Cryptocurrencies, Commodities
Particularly effective in volatile markets
Adapts automatically to different volatility levels
⚙️ Recommended Settings
Conservative Trading (Lower Risk)
Trend Length: 20
ATR Multiplier: 2.5
Best for: Long-term positions, lower frequency signals
Balanced Trading (Default)
Trend Length: 14
ATR Multiplier: 2.0
Best for: Swing trading, moderate frequency signals
Aggressive Trading (Higher Risk)
Trend Length: 10
ATR Multiplier: 1.5
Best for: Day trading, higher frequency signals
🎨 Visual Elements
Trend Line: Main indicator line that follows the trend
Signal Arrows: Triangle shapes indicating buy/sell points
Text Labels: Clear "BUY" and "SELL" text markers
Information Table: Real-time status panel in top-right corner
Color Coding: Intuitive green/red color scheme
⚠️ Important Notes
Risk Management
Always use proper position sizing
Set stop-losses based on ATR values
Consider market conditions and volatility
Not recommended for ranging/sideways markets
Signal Confirmation
Consider using with other indicators for confirmation
Pay attention to volume and market structure
Be aware of major news events and market sessions
Backtesting Recommended
Test the indicator on historical data
Optimize parameters for your specific trading style
Consider transaction costs in your analysis

Frahm Factor Position Size CalculatorThe Frahm Factor Position Size Calculator is a powerful evolution of the original Frahm Factor script, leveraging its volatility analysis to dynamically adjust trading risk. This Pine Script for TradingView uses the Frahm Factor’s volatility score (1-10) to set risk percentages (1.75% to 5%) for both Margin-Based and Equity-Based position sizing. A compact table on the main chart displays Risk per Trade, Frahm Factor, and Average Candle Size, making it an essential tool for traders aligning risk with market conditions.
Calculates a volatility score (1-10) using true range percentile rank over a customizable look-back window (default 24 hours).
Dynamically sets risk percentage based on volatility:
Low volatility (score ≤ 3): 5% risk for bolder trades.
High volatility (score ≥ 8): 1.75% risk for caution.
Medium volatility (score 4-7): Smoothly interpolated (e.g., 4 → 4.3%, 5 → 3.6%).
Adjustable sensitivity via Frahm Scale Multiplier (default 9) for tailored volatility response.
Position Sizing:
Margin-Based: Risk as a percentage of total margin (e.g., $175 for 1.75% of $10,000 at high volatility).
Equity-Based: Risk as a percentage of (equity - minimum balance) (e.g., $175 for 1.75% of ($15,000 - $5,000)).
Compact 1-3 row table shows:
Risk per Trade with Frahm score (e.g., “$175.00 (Frahm: 8)”).
Frahm Factor (e.g., “Frahm Factor: 8”).
Average Candle Size (e.g., “Avg Candle: 50 t”).
Toggles to show/hide Frahm Factor and Average Candle Size rows, with no empty backgrounds.
Four sizes: XL (18x7, large text), L (13x6, normal), M (9x5, small, default), S (8x4, tiny).
Repositionable (9 positions, default: top-right).
Customizable cell color, text color, and transparency.
Set Frahm Factor:
Frahm Window (hrs): Pick how far back to measure volatility (e.g., 24 hours). Shorter for fast markets, longer for chill ones.
Frahm Scale Multiplier: Set sensitivity (1-10, default 9). Higher makes the score jumpier; lower smooths it out.
Set Margin-Based:
Total Margin: Enter your account balance (e.g., $10,000). Risk auto-adjusts via Frahm Factor.
Set Equity-Based:
Total Equity: Enter your total account balance (e.g., $15,000).
Minimum Balance: Set to the lowest your account can go before liquidation (e.g., $5,000). Risk is based on the difference, auto-adjusted by Frahm Factor.
Customize Display:
Calculation Method: Pick Margin-Based or Equity-Based.
Table Position: Choose where the table sits (e.g., top_right).
Table Size: Select XL, L, M, or S (default M, small text).
Table Cell Color: Set background color (default blue).
Table Text Color: Set text color (default white).
Table Cell Transparency: Adjust transparency (0 = solid, 100 = invisible, default 80).
Show Frahm Factor & Show Avg Candle Size: Check to show these rows, uncheck to hide (default on).

Historical Volatility with HV Average & High/Low Trendlines
### 📊 **Indicator Title**: Historical Volatility with HV Average & High/Low Trendlines
**Version**: Pine Script v5
**Purpose**:
This script visualizes market volatility using **Historical Volatility (HV)** and enhances analysis by:
* Showing a **moving average** of HV to identify volatility trends.
* Marking **high and low trendlines** to highlight extremes in volatility over a selected period.
---
### 🔧 **Inputs**:
1. **HV Length (`length`)**:
Controls how many bars are used to calculate Historical Volatility.
*(Default: 10)*
2. **Average Length (`avgLength`)**:
Number of bars used for calculating the moving average of HV.
*(Default: 20)*
3. **Trendline Lookback Period (`trendLookback`)**:
Number of bars to look back for calculating the highest and lowest values of HV.
*(Default: 100)*
---
### 📈 **Core Calculations**:
1. **Historical Volatility (`hv`)**:
$$
HV = 100 \times \text{stdev}\left(\ln\left(\frac{\text{close}}{\text{close} }\right), \text{length}\right) \times \sqrt{\frac{365}{\text{period}}}
$$
* Measures how much the stock price fluctuates.
* Adjusts annualization factor depending on whether it's intraday or daily.
2. **HV Moving Average (`hvAvg`)**:
A simple moving average (SMA) of HV over the selected `avgLength`.
3. **HV High & Low Trendlines**:
* `hvHigh`: Highest HV value over the last `trendLookback` bars.
* `hvLow`: Lowest HV value over the last `trendLookback` bars.
---
### 🖍️ **Visual Plots**:
* 🔵 **HV**: Blue line showing raw Historical Volatility.
* 🔴 **HV Average**: Red line (thicker) indicating smoothed HV trend.
* 🟢 **HV High**: Green horizontal line marking volatility peaks.
* 🟠 **HV Low**: Orange horizontal line marking volatility lows.
---
### ✅ **Usage**:
* **High HV**: Indicates increased risk or potential breakout conditions.
* **Low HV**: Suggests consolidation or calm markets.
* **Cross of HV above Average**: May signal rising volatility (e.g., before breakout).
* **Touching High/Low Levels**: Helps identify volatility extremes and possible reversal zones.

light_logLight Log - A Defensive Programming Library for Pine Script
Overview
The Light Log library transforms Pine Script development by introducing structured logging and defensive programming patterns typically found in enterprise languages like C#. This library addresses a fundamental challenge in Pine Script: the lack of sophisticated error handling and debugging tools that developers expect when building complex trading systems.
At its core, Light Log provides three transformative capabilities that work together to create more reliable and maintainable code. First, it wraps all native Pine Script types in error-aware containers, allowing values to carry validation state alongside their data. Second, it offers a comprehensive logging system with severity levels and conditional rendering. Third, it includes defensive programming utilities that catch errors early and make code self-documenting.
The Philosophy of Errors as Values
Traditional Pine Script error handling relies on runtime errors that halt execution, making it difficult to build resilient systems that can gracefully handle edge cases. Light Log introduces a paradigm shift by treating errors as first-class values that flow through your program alongside regular data.
When you wrap a value using Light Log's type system, you're not just storing data – you're creating a container that can carry both the value and its validation state. For example, when you call myNumber.INT() , you receive an INT object that contains both the integer value and a Log object that can describe any issues with that value. This approach, inspired by functional programming languages, allows errors to propagate through calculations without causing immediate failures.
Consider how this changes error handling in practice. Instead of a calculation failing catastrophically when it encounters invalid input, it can produce a result object that contains both the computed value (which might be na) and a detailed log explaining what went wrong. Subsequent operations can check has_error() to decide whether to proceed or handle the error condition gracefully.
The Typed Wrapper System
Light Log provides typed wrappers for every native Pine Script type: INT, FLOAT, BOOL, STRING, COLOR, LINE, LABEL, BOX, TABLE, CHART_POINT, POLYLINE, and LINEFILL. These wrappers serve multiple purposes beyond simple value storage.
Each wrapper type contains two fields: the value field v holds the actual data, while the error field e contains a Log object that tracks the value's validation state. This dual nature enables powerful programming patterns. You can perform operations on wrapped values and accumulate error information along the way, creating an audit trail of how values were processed.
The wrapper system includes convenient methods for converting between wrapped and unwrapped values. The extension methods like INT() , FLOAT() , etc., make it easy to wrap existing values, while the from_INT() , from_FLOAT() methods extract the underlying values when needed. The has_error() method provides a consistent interface for checking whether any wrapped value has encountered issues during processing.
The Log Object: Your Debugging Companion
The Log object represents the heart of Light Log's debugging capabilities. Unlike simple string concatenation for error messages, the Log object provides a structured approach to building, modifying, and rendering diagnostic information.
Each Log object carries three essential pieces of information: an error type (info, warning, error, or runtime_error), a message string that can be built incrementally, and an active flag that controls conditional rendering. This structure enables sophisticated logging patterns where you can build up detailed diagnostic information throughout your script's execution and decide later whether and how to display it.
The Log object's methods support fluent chaining, allowing you to build complex messages in a readable way. The write() and write_line() methods append text to the log, while new_line() adds formatting. The clear() method resets the log for reuse, and the rendering methods ( render_now() , render_condition() , and the general render() ) control when and how messages appear.
Defensive Programming Made Easy
Light Log's argument validation functions transform how you write defensive code. Instead of cluttering your functions with verbose validation logic, you can use concise, self-documenting calls that make your intentions clear.
The argument_error() function provides strict validation that halts execution when conditions aren't met – perfect for catching programming errors early. For less critical issues, argument_log_warning() and argument_log_error() record problems without stopping execution, while argument_log_info() provides debug visibility into your function's behavior.
These functions follow a consistent pattern: they take a condition to check, the function name, the argument name, and a descriptive message. This consistency makes error messages predictable and helpful, automatically formatting them to show exactly where problems occurred.
Building Modular, Reusable Code
Light Log encourages a modular approach to Pine Script development by providing tools that make functions more self-contained and reliable. When functions validate their inputs and return wrapped values with error information, they become true black boxes that can be safely composed into larger systems.
The void_return() function addresses Pine Script's requirement that all code paths return a value, even in error handling branches. This utility function provides a clean way to satisfy the compiler while making it clear that a particular code path should never execute.
The static log pattern, initialized with init_static_log() , enables module-wide error tracking. You can create a persistent Log object that accumulates information across multiple function calls, building a comprehensive diagnostic report that helps you understand complex behaviors in your indicators and strategies.
Real-World Applications
In practice, Light Log shines when building sophisticated trading systems. Imagine developing a complex indicator that processes multiple data streams, performs statistical calculations, and generates trading signals. With Light Log, each processing stage can validate its inputs, perform calculations, and pass along both results and diagnostic information.
For example, a moving average calculation might check that the period is positive, that sufficient data exists, and that the input series contains valid values. Instead of failing silently or throwing runtime errors, it can return a FLOAT object that contains either the calculated average or a detailed explanation of why the calculation couldn't be performed.
Strategy developers benefit even more from Light Log's capabilities. Complex entry and exit logic often involves multiple conditions that must all be satisfied. With Light Log, each condition check can contribute to a comprehensive log that explains exactly why a trade was or wasn't taken, making strategy debugging and optimization much more straightforward.
Performance Considerations
While Light Log adds a layer of abstraction over raw Pine Script values, its design minimizes performance impact. The wrapper objects are lightweight, containing only two fields. The logging operations only consume resources when actually rendered, and the conditional rendering system ensures that production code can run with logging disabled for maximum performance.
The library follows Pine Script best practices for performance, using appropriate data structures and avoiding unnecessary operations. The var keyword in init_static_log() ensures that persistent logs don't create new objects on every bar, maintaining efficiency even in real-time calculations.
Getting Started
Adopting Light Log in your Pine Script projects is straightforward. Import the library, wrap your critical values, add validation to your functions, and use Log objects to track important events. Start small by adding logging to a single function, then expand as you see the benefits of better error visibility and code organization.
Remember that Light Log is designed to grow with your needs. You can use as much or as little of its functionality as makes sense for your project. Even simple uses, like adding argument validation to key functions, can significantly improve code reliability and debugging ease.
Transform your Pine Script development experience with Light Log – because professional trading systems deserve professional development tools.
Light Log Technical Deep Dive: Advanced Patterns and Architecture
Understanding Errors as Values
The concept of "errors as values" represents a fundamental shift in how we think about error handling in Pine Script. In traditional Pine Script development, errors are events – they happen at a specific moment in time and immediately interrupt program flow. Light Log transforms errors into data – they become information that flows through your program just like any other value.
This transformation has profound implications. When errors are values, they can be stored, passed between functions, accumulated, transformed, and inspected. They become part of your program's data flow rather than exceptions to it. This approach, popularized by languages like Rust with its Result type and Haskell with its Either monad, brings functional programming's elegance to Pine Script.
Consider a practical example. Traditional Pine Script might calculate a momentum indicator like this:
momentum = close - close
If period is invalid or if there isn't enough historical data, this calculation might produce na or cause subtle bugs. With Light Log's approach:
calculate_momentum(src, period)=>
result = src.FLOAT()
if period <= 0
result.e.write("Invalid period: must be positive", true, ErrorType.error)
result.v := na
else if bar_index < period
result.e.write("Insufficient data: need " + str.tostring(period) + " bars", true, ErrorType.warning)
result.v := na
else
result.v := src - src
result.e.write("Momentum calculated successfully", false, ErrorType.info)
result
Now the function returns not just a value but a complete computational result that includes diagnostic information. Calling code can make intelligent decisions based on both the value and its associated metadata.
The Monad Pattern in Pine Script
While Pine Script lacks the type system features to implement true monads, Light Log brings monadic thinking to Pine Script development. The wrapped types (INT, FLOAT, etc.) act as computational contexts that carry both values and metadata through a series of transformations.
The key insight of monadic programming is that you can chain operations while automatically propagating context. In Light Log, this context is the error state. When you have a FLOAT that contains an error, operations on that FLOAT can check the error state and decide whether to proceed or propagate the error.
This pattern enables what functional programmers call "railway-oriented programming" – your code follows a success track when all is well but can switch to an error track when problems occur. Both tracks lead to the same destination (a result with error information), but they take different paths based on the validity of intermediate values.
Composable Error Handling
Light Log's design encourages composition – building complex functionality from simpler, well-tested components. Each component can validate its inputs, perform its calculation, and return a result with appropriate error information. Higher-level functions can then combine these results intelligently.
Consider building a complex trading signal from multiple indicators:
generate_signal(src, fast_period, slow_period, signal_period) =>
log = init_static_log(ErrorType.info)
// Calculate components with error tracking
fast_ma = calculate_ma(src, fast_period)
slow_ma = calculate_ma(src, slow_period)
// Check for errors in components
if fast_ma.has_error()
log.write_line("Fast MA error: " + fast_ma.e.message, true)
if slow_ma.has_error()
log.write_line("Slow MA error: " + slow_ma.e.message, true)
// Proceed with calculation if no errors
signal = 0.0.FLOAT()
if not (fast_ma.has_error() or slow_ma.has_error())
macd_line = fast_ma.v - slow_ma.v
signal_line = calculate_ma(macd_line, signal_period)
if signal_line.has_error()
log.write_line("Signal line error: " + signal_line.e.message, true)
signal.e := log
else
signal.v := macd_line - signal_line.v
log.write("Signal generated successfully")
else
signal.e := log
signal.v := na
signal
This composable approach makes complex calculations more reliable and easier to debug. Each component is responsible for its own validation and error reporting, and the composite function orchestrates these components while maintaining comprehensive error tracking.
The Static Log Pattern
The init_static_log() function introduces a powerful pattern for maintaining state across function calls. In Pine Script, the var keyword creates variables that persist across bars but are initialized only once. Light Log leverages this to create logging objects that can accumulate information throughout a script's execution.
This pattern is particularly valuable for debugging complex strategies where you need to understand behavior across multiple bars. You can create module-level logs that track important events:
// Module-level diagnostic log
diagnostics = init_static_log(ErrorType.info)
// Track strategy decisions across bars
check_entry_conditions() =>
diagnostics.clear() // Start fresh each bar
diagnostics.write_line("Bar " + str.tostring(bar_index) + " analysis:")
if close > sma(close, 20)
diagnostics.write_line("Price above SMA20", false)
else
diagnostics.write_line("Price below SMA20 - no entry", true, ErrorType.warning)
if volume > sma(volume, 20) * 1.5
diagnostics.write_line("Volume surge detected", false)
else
diagnostics.write_line("Normal volume", false)
// Render diagnostics based on verbosity setting
if debug_mode
diagnostics.render_now()
Advanced Validation Patterns
Light Log's argument validation functions enable sophisticated precondition checking that goes beyond simple null checks. You can implement complex validation logic while keeping your code readable:
validate_price_data(open_val, high_val, low_val, close_val) =>
argument_error(na(open_val) or na(high_val) or na(low_val) or na(close_val),
"validate_price_data", "OHLC values", "contain na values")
argument_error(high_val < low_val,
"validate_price_data", "high/low", "high is less than low")
argument_error(close_val > high_val or close_val < low_val,
"validate_price_data", "close", "is outside high/low range")
argument_log_warning(high_val == low_val,
"validate_price_data", "high/low", "are equal (no range)")
This validation function documents its requirements clearly and fails fast with helpful error messages when assumptions are violated. The mix of errors (which halt execution) and warnings (which allow continuation) provides fine-grained control over how strict your validation should be.
Performance Optimization Strategies
While Light Log adds abstraction, careful design minimizes overhead. Understanding Pine Script's execution model helps you use Light Log efficiently.
Pine Script executes once per bar, so operations that seem expensive in traditional programming might have negligible impact. However, when building real-time systems, every optimization matters. Light Log provides several patterns for efficient use:
Lazy Evaluation: Log messages are only built when they'll be rendered. Use conditional logging to avoid string concatenation in production:
if debug_mode
log.write_line("Calculated value: " + str.tostring(complex_calculation))
Selective Wrapping: Not every value needs error tracking. Wrap values at API boundaries and critical calculation points, but use raw values for simple operations:
// Wrap at boundaries
input_price = close.FLOAT()
validated_period = validate_period(input_period).INT()
// Use raw values internally
sum = 0.0
for i = 0 to validated_period.v - 1
sum += close
Error Propagation: When errors occur early, avoid expensive calculations:
process_data(input) =>
validated = validate_input(input)
if validated.has_error()
validated // Return early with error
else
// Expensive processing only if valid
perform_complex_calculation(validated)
Integration Patterns
Light Log integrates smoothly with existing Pine Script code. You can adopt it incrementally, starting with critical functions and expanding coverage as needed.
Boundary Validation: Add Light Log at the boundaries of your system – where user input enters and where final outputs are produced. This catches most errors while minimizing changes to existing code.
Progressive Enhancement: Start by adding argument validation to existing functions. Then wrap return values. Finally, add comprehensive logging. Each step improves reliability without requiring a complete rewrite.
Testing and Debugging: Use Light Log's conditional rendering to create debug modes for your scripts. Production users see clean output while developers get detailed diagnostics:
// User input for debug mode
debug = input.bool(false, "Enable debug logging")
// Conditional diagnostic output
if debug
diagnostics.render_now()
else
diagnostics.render_condition() // Only shows errors/warnings
Future-Proofing Your Code
Light Log's patterns prepare your code for Pine Script's evolution. As Pine Script adds more sophisticated features, code that uses structured error handling and defensive programming will adapt more easily than code that relies on implicit assumptions.
The type wrapper system, in particular, positions your code to take advantage of potential future features or more sophisticated type inference. By thinking in terms of wrapped values and error propagation today, you're building code that will remain maintainable and extensible tomorrow.
Light Log doesn't just make your Pine Script better today – it prepares it for the trading systems you'll need to build tomorrow.
Library "light_log"
A lightweight logging and defensive programming library for Pine Script.
Designed for modular and extensible scripts, this utility provides structured runtime validation,
conditional logging, and reusable `Log` objects for centralized error propagation.
It also introduces a typed wrapping system for all native Pine values (e.g., `INT`, `FLOAT`, `LABEL`),
allowing values to carry errors alongside data. This enables functional-style flows with built-in
validation tracking, error detection (`has_error()`), and fluent chaining.
Inspired by structured logging patterns found in systems like C#, it reduces boilerplate,
enforces argument safety, and encourages clean, maintainable code architecture.
method INT(self, error_type)
Wraps an `int` value into an `INT` struct with an optional log severity.
Namespace types: series int, simple int, input int, const int
Parameters:
self (int) : The raw `int` value to wrap.
error_type (series ErrorType) : Optional severity level to associate with the log. Default is `ErrorType.error`.
Returns: An `INT` object containing the value and a default Log instance.
method FLOAT(self, error_type)
Wraps a `float` value into a `FLOAT` struct with an optional log severity.
Namespace types: series float, simple float, input float, const float
Parameters:
self (float) : The raw `float` value to wrap.
error_type (series ErrorType) : Optional severity level to associate with the log. Default is `ErrorType.error`.
Returns: A `FLOAT` object containing the value and a default Log instance.
method BOOL(self, error_type)
Wraps a `bool` value into a `BOOL` struct with an optional log severity.
Namespace types: series bool, simple bool, input bool, const bool
Parameters:
self (bool) : The raw `bool` value to wrap.
error_type (series ErrorType) : Optional severity level to associate with the log. Default is `ErrorType.error`.
Returns: A `BOOL` object containing the value and a default Log instance.
method STRING(self, error_type)
Wraps a `string` value into a `STRING` struct with an optional log severity.
Namespace types: series string, simple string, input string, const string
Parameters:
self (string) : The raw `string` value to wrap.
error_type (series ErrorType) : Optional severity level to associate with the log. Default is `ErrorType.error`.
Returns: A `STRING` object containing the value and a default Log instance.
method COLOR(self, error_type)
Wraps a `color` value into a `COLOR` struct with an optional log severity.
Namespace types: series color, simple color, input color, const color
Parameters:
self (color) : The raw `color` value to wrap.
error_type (series ErrorType) : Optional severity level to associate with the log. Default is `ErrorType.error`.
Returns: A `COLOR` object containing the value and a default Log instance.
method LINE(self, error_type)
Wraps a `line` object into a `LINE` struct with an optional log severity.
Namespace types: series line
Parameters:
self (line) : The raw `line` object to wrap.
error_type (series ErrorType) : Optional severity level to associate with the log. Default is `ErrorType.error`.
Returns: A `LINE` object containing the value and a default Log instance.
method LABEL(self, error_type)
Wraps a `label` object into a `LABEL` struct with an optional log severity.
Namespace types: series label
Parameters:
self (label) : The raw `label` object to wrap.
error_type (series ErrorType) : Optional severity level to associate with the log. Default is `ErrorType.error`.
Returns: A `LABEL` object containing the value and a default Log instance.
method BOX(self, error_type)
Wraps a `box` object into a `BOX` struct with an optional log severity.
Namespace types: series box
Parameters:
self (box) : The raw `box` object to wrap.
error_type (series ErrorType) : Optional severity level to associate with the log. Default is `ErrorType.error`.
Returns: A `BOX` object containing the value and a default Log instance.
method TABLE(self, error_type)
Wraps a `table` object into a `TABLE` struct with an optional log severity.
Namespace types: series table
Parameters:
self (table) : The raw `table` object to wrap.
error_type (series ErrorType) : Optional severity level to associate with the log. Default is `ErrorType.error`.
Returns: A `TABLE` object containing the value and a default Log instance.
method CHART_POINT(self, error_type)
Wraps a `chart.point` value into a `CHART_POINT` struct with an optional log severity.
Namespace types: chart.point
Parameters:
self (chart.point) : The raw `chart.point` value to wrap.
error_type (series ErrorType) : Optional severity level to associate with the log. Default is `ErrorType.error`.
Returns: A `CHART_POINT` object containing the value and a default Log instance.
method POLYLINE(self, error_type)
Wraps a `polyline` object into a `POLYLINE` struct with an optional log severity.
Namespace types: series polyline, series polyline, series polyline, series polyline
Parameters:
self (polyline) : The raw `polyline` object to wrap.
error_type (series ErrorType) : Optional severity level to associate with the log. Default is `ErrorType.error`.
Returns: A `POLYLINE` object containing the value and a default Log instance.
method LINEFILL(self, error_type)
Wraps a `linefill` object into a `LINEFILL` struct with an optional log severity.
Namespace types: series linefill
Parameters:
self (linefill) : The raw `linefill` object to wrap.
error_type (series ErrorType) : Optional severity level to associate with the log. Default is `ErrorType.error`.
Returns: A `LINEFILL` object containing the value and a default Log instance.
method from_INT(self)
Extracts the integer value from an INT wrapper.
Namespace types: INT
Parameters:
self (INT) : The wrapped INT instance.
Returns: The underlying `int` value.
method from_FLOAT(self)
Extracts the float value from a FLOAT wrapper.
Namespace types: FLOAT
Parameters:
self (FLOAT) : The wrapped FLOAT instance.
Returns: The underlying `float` value.
method from_BOOL(self)
Extracts the boolean value from a BOOL wrapper.
Namespace types: BOOL
Parameters:
self (BOOL) : The wrapped BOOL instance.
Returns: The underlying `bool` value.
method from_STRING(self)
Extracts the string value from a STRING wrapper.
Namespace types: STRING
Parameters:
self (STRING) : The wrapped STRING instance.
Returns: The underlying `string` value.
method from_COLOR(self)
Extracts the color value from a COLOR wrapper.
Namespace types: COLOR
Parameters:
self (COLOR) : The wrapped COLOR instance.
Returns: The underlying `color` value.
method from_LINE(self)
Extracts the line object from a LINE wrapper.
Namespace types: LINE
Parameters:
self (LINE) : The wrapped LINE instance.
Returns: The underlying `line` object.
method from_LABEL(self)
Extracts the label object from a LABEL wrapper.
Namespace types: LABEL
Parameters:
self (LABEL) : The wrapped LABEL instance.
Returns: The underlying `label` object.
method from_BOX(self)
Extracts the box object from a BOX wrapper.
Namespace types: BOX
Parameters:
self (BOX) : The wrapped BOX instance.
Returns: The underlying `box` object.
method from_TABLE(self)
Extracts the table object from a TABLE wrapper.
Namespace types: TABLE
Parameters:
self (TABLE) : The wrapped TABLE instance.
Returns: The underlying `table` object.
method from_CHART_POINT(self)
Extracts the chart.point from a CHART_POINT wrapper.
Namespace types: CHART_POINT
Parameters:
self (CHART_POINT) : The wrapped CHART_POINT instance.
Returns: The underlying `chart.point` value.
method from_POLYLINE(self)
Extracts the polyline object from a POLYLINE wrapper.
Namespace types: POLYLINE
Parameters:
self (POLYLINE) : The wrapped POLYLINE instance.
Returns: The underlying `polyline` object.
method from_LINEFILL(self)
Extracts the linefill object from a LINEFILL wrapper.
Namespace types: LINEFILL
Parameters:
self (LINEFILL) : The wrapped LINEFILL instance.
Returns: The underlying `linefill` object.
method has_error(self)
Returns true if the INT wrapper has an active log entry.
Namespace types: INT
Parameters:
self (INT) : The INT instance to check.
Returns: True if an error or message is active in the log.
method has_error(self)
Returns true if the FLOAT wrapper has an active log entry.
Namespace types: FLOAT
Parameters:
self (FLOAT) : The FLOAT instance to check.
Returns: True if an error or message is active in the log.
method has_error(self)
Returns true if the BOOL wrapper has an active log entry.
Namespace types: BOOL
Parameters:
self (BOOL) : The BOOL instance to check.
Returns: True if an error or message is active in the log.
method has_error(self)
Returns true if the STRING wrapper has an active log entry.
Namespace types: STRING
Parameters:
self (STRING) : The STRING instance to check.
Returns: True if an error or message is active in the log.
method has_error(self)
Returns true if the COLOR wrapper has an active log entry.
Namespace types: COLOR
Parameters:
self (COLOR) : The COLOR instance to check.
Returns: True if an error or message is active in the log.
method has_error(self)
Returns true if the LINE wrapper has an active log entry.
Namespace types: LINE
Parameters:
self (LINE) : The LINE instance to check.
Returns: True if an error or message is active in the log.
method has_error(self)
Returns true if the LABEL wrapper has an active log entry.
Namespace types: LABEL
Parameters:
self (LABEL) : The LABEL instance to check.
Returns: True if an error or message is active in the log.
method has_error(self)
Returns true if the BOX wrapper has an active log entry.
Namespace types: BOX
Parameters:
self (BOX) : The BOX instance to check.
Returns: True if an error or message is active in the log.
method has_error(self)
Returns true if the TABLE wrapper has an active log entry.
Namespace types: TABLE
Parameters:
self (TABLE) : The TABLE instance to check.
Returns: True if an error or message is active in the log.
method has_error(self)
Returns true if the CHART_POINT wrapper has an active log entry.
Namespace types: CHART_POINT
Parameters:
self (CHART_POINT) : The CHART_POINT instance to check.
Returns: True if an error or message is active in the log.
method has_error(self)
Returns true if the POLYLINE wrapper has an active log entry.
Namespace types: POLYLINE
Parameters:
self (POLYLINE) : The POLYLINE instance to check.
Returns: True if an error or message is active in the log.
method has_error(self)
Returns true if the LINEFILL wrapper has an active log entry.
Namespace types: LINEFILL
Parameters:
self (LINEFILL) : The LINEFILL instance to check.
Returns: True if an error or message is active in the log.
void_return()
Utility function used when a return is syntactically required but functionally unnecessary.
Returns: Nothing. Function never executes its body.
argument_error(condition, function, argument, message)
Throws a runtime error when a condition is met. Used for strict argument validation.
Parameters:
condition (bool) : Boolean expression that triggers the runtime error.
function (string) : Name of the calling function (for formatting).
argument (string) : Name of the problematic argument.
message (string) : Description of the error cause.
Returns: Never returns. Halts execution if the condition is true.
argument_log_info(condition, function, argument, message)
Logs an informational message when a condition is met. Used for optional debug visibility.
Parameters:
condition (bool) : Boolean expression that triggers the log.
function (string) : Name of the calling function.
argument (string) : Argument name being referenced.
message (string) : Informational message to log.
Returns: Nothing. Logs if the condition is true.
argument_log_warning(condition, function, argument, message)
Logs a warning when a condition is met. Non-fatal but highlights potential issues.
Parameters:
condition (bool) : Boolean expression that triggers the warning.
function (string) : Name of the calling function.
argument (string) : Argument name being referenced.
message (string) : Warning message to log.
Returns: Nothing. Logs if the condition is true.
argument_log_error(condition, function, argument, message)
Logs an error message when a condition is met. Does not halt execution.
Parameters:
condition (bool) : Boolean expression that triggers the error log.
function (string) : Name of the calling function.
argument (string) : Argument name being referenced.
message (string) : Error message to log.
Returns: Nothing. Logs if the condition is true.
init_static_log(error_type, message, active)
Initializes a persistent (var) Log object. Ideal for global logging in scripts or modules.
Parameters:
error_type (series ErrorType) : Initial severity level (required).
message (string) : Optional starting message string. Default value of ("").
active (bool) : Whether the log should be flagged active on initialization. Default value of (false).
Returns: A static Log object with the given parameters.
method new_line(self)
Appends a newline character to the Log message. Useful for separating entries during chained writes.
Namespace types: Log
Parameters:
self (Log) : The Log instance to modify.
Returns: The updated Log object with a newline appended.
method write(self, message, flag_active, error_type)
Appends a message to a Log object without a newline. Updates severity and active state if specified.
Namespace types: Log
Parameters:
self (Log) : The Log instance being modified.
message (string) : The text to append to the log.
flag_active (bool) : Whether to activate the log for conditional rendering. Default value of (false).
error_type (series ErrorType) : Optional override for the severity level. Default value of (na).
Returns: The updated Log object.
method write_line(self, message, flag_active, error_type)
Appends a message to a Log object, prefixed with a newline for clarity.
Namespace types: Log
Parameters:
self (Log) : The Log instance being modified.
message (string) : The text to append to the log.
flag_active (bool) : Whether to activate the log for conditional rendering. Default value of (false).
error_type (series ErrorType) : Optional override for the severity level. Default value of (na).
Returns: The updated Log object.
method clear(self, flag_active, error_type)
Clears a Log object’s message and optionally reactivates it. Can also update the error type.
Namespace types: Log
Parameters:
self (Log) : The Log instance being cleared.
flag_active (bool) : Whether to activate the log after clearing. Default value of (false).
error_type (series ErrorType) : Optional new error type to assign. If not provided, the previous type is retained. Default value of (na).
Returns: The cleared Log object.
method render_condition(self, flag_active, error_type)
Conditionally renders the log if it is active. Allows overriding error type and controlling active state afterward.
Namespace types: Log
Parameters:
self (Log) : The Log instance to evaluate and render.
flag_active (bool) : Whether to activate the log after rendering. Default value of (false).
error_type (series ErrorType) : Optional error type override. Useful for contextual formatting just before rendering. Default value of (na).
Returns: The updated Log object.
method render_now(self, flag_active, error_type)
Immediately renders the log regardless of `active` state. Allows overriding error type and active flag.
Namespace types: Log
Parameters:
self (Log) : The Log instance to render.
flag_active (bool) : Whether to activate the log after rendering. Default value of (false).
error_type (series ErrorType) : Optional error type override. Allows dynamic severity adjustment at render time. Default value of (na).
Returns: The updated Log object.
render(self, condition, flag_active, error_type)
Renders the log conditionally or unconditionally. Allows full control over render behavior.
Parameters:
self (Log) : The Log instance to render.
condition (bool) : If true, renders only if the log is active. If false, always renders. Default value of (false).
flag_active (bool) : Whether to activate the log after rendering. Default value of (false).
error_type (series ErrorType) : Optional error type override passed to the render methods. Default value of (na).
Returns: The updated Log object.
Log
A structured object used to store and render logging messages.
Fields:
error_type (series ErrorType) : The severity level of the message (from the ErrorType enum).
message (series string) : The text of the log message.
active (series bool) : Whether the log should trigger rendering when conditionally evaluated.
INT
A wrapped integer type with attached logging for validation or tracing.
Fields:
v (series int) : The underlying `int` value.
e (Log) : Optional log object describing validation status or error context.
FLOAT
A wrapped float type with attached logging for validation or tracing.
Fields:
v (series float) : The underlying `float` value.
e (Log) : Optional log object describing validation status or error context.
BOOL
A wrapped boolean type with attached logging for validation or tracing.
Fields:
v (series bool) : The underlying `bool` value.
e (Log) : Optional log object describing validation status or error context.
STRING
A wrapped string type with attached logging for validation or tracing.
Fields:
v (series string) : The underlying `string` value.
e (Log) : Optional log object describing validation status or error context.
COLOR
A wrapped color type with attached logging for validation or tracing.
Fields:
v (series color) : The underlying `color` value.
e (Log) : Optional log object describing validation status or error context.
LINE
A wrapped line object with attached logging for validation or tracing.
Fields:
v (series line) : The underlying `line` value.
e (Log) : Optional log object describing validation status or error context.
LABEL
A wrapped label object with attached logging for validation or tracing.
Fields:
v (series label) : The underlying `label` value.
e (Log) : Optional log object describing validation status or error context.
BOX
A wrapped box object with attached logging for validation or tracing.
Fields:
v (series box) : The underlying `box` value.
e (Log) : Optional log object describing validation status or error context.
TABLE
A wrapped table object with attached logging for validation or tracing.
Fields:
v (series table) : The underlying `table` value.
e (Log) : Optional log object describing validation status or error context.
CHART_POINT
A wrapped chart point with attached logging for validation or tracing.
Fields:
v (chart.point) : The underlying `chart.point` value.
e (Log) : Optional log object describing validation status or error context.
POLYLINE
A wrapped polyline object with attached logging for validation or tracing.
Fields:
v (series polyline) : The underlying `polyline` value.
e (Log) : Optional log object describing validation status or error context.
LINEFILL
A wrapped linefill object with attached logging for validation or tracing.
Fields:
v (series linefill) : The underlying `linefill` value.
e (Log) : Optional log object describing validation status or error context.

Approximate Entropy Zones [PhenLabs]Version: PineScript™ v6
Description
This indicator identifies periods of market complexity and randomness by calculating the Approximate Entropy (ApEn) of price action. As the movement of the market becomes complex, it means the current trend is losing steam and a reversal or consolidation is likely near. The indicator plots high-entropy periods as zones on your chart, providing a graphical suggestion to anticipate a potential market direction change. This indicator is designed to help traders identify favorable times to get in or out of a trade by highlighting when the market is in a state of disarray.
Points of Innovation
Advanced Complexity Analysis: Instead of relying on traditional momentum or trend indicators, this tool uses Approximate Entropy to quantify the unpredictability of price movements.
Dynamic Zone Creation: It automatically plots zones on the chart during periods of high entropy, providing a clear and intuitive visual guide.
Customizable Sensitivity: Users can fine-tune the ‘Entropy Threshold’ to adjust how frequently zones appear, allowing for calibration to different assets and timeframes.
Time-Based Zone Expiration: Zones can be set to expire after a specific time, keeping the chart clean and relevant.
Built-in Zone Size Filter: Excludes zones that form on excessively large candles, filtering out noise from extreme volatility events.
On-Chart Calibration Guide: A persistent note on the chart provides simple instructions for adjusting the entropy threshold, making it easy for users to optimize the indicator’s performance.
Core Components
Approximate Entropy (ApEn) Calculation: The core of the indicator, which measures the complexity or randomness of the price data.
Zone Plotting: Creates visual boxes on the chart when the calculated ApEn value exceeds a user-defined threshold.
Dynamic Zone Management: Manages the lifecycle of the zones, from creation to expiration, ensuring the chart remains uncluttered.
Customizable Settings: A comprehensive set of inputs that allow users to control the indicator’s sensitivity, appearance, and time-based behavior.
Key Features
Identifies Potential Reversals: The high-entropy zones can signal that a trend is nearing its end, giving traders an early warning.
Works on Any Timeframe: The indicator can be applied to any chart timeframe, from minutes to days.
Customizable Appearance: Users can change the color and transparency of the zones to match their chart’s theme.
Informative Labels: Each zone can display the calculated entropy value and the direction of the candle on which it formed.
Visualization
Entropy Zones: Shaded boxes that appear on the chart, highlighting candles with high complexity.
Zone Labels: Text within each zone that displays the ApEn value and a directional arrow (e.g., “0.525 ↑”).
Calibration Note: A small table in the top-right corner of the chart with instructions for adjusting the indicator’s sensitivity.
Usage Guidelines
Entropy Analysis
Source: The price data used for the ApEn calculation. (Default: close)
Lookback Length: The number of bars used in the ApEn calculation. (Default: 20, Range: 10-50)
Embedding Dimension (m): The length of patterns to be compared; a standard value for financial data. (Default: 2)
Tolerance Multiplier (r): Adjusts the tolerance for pattern matching; a larger value makes matching more lenient. (Default: 0.2)
Entropy Threshold: The ApEn value that must be exceeded to plot a zone. Increase this if too many zones appear; decrease it if too few appear. (Default: 0.525)
Time Settings
Analysis Timeframe: How long a zone remains on the chart after it forms. (Default: 1D)
Custom Period (Bars): The zone’s lifespan in bars if “Analysis Timeframe” is set to “Custom”. (Default: 1000)
Zone Settings
Zone Fill Color: The color of the entropy zones. (Default: #21f38a with 80% transparency)
Maximum Zone Size %: Filters out zones on candles that are larger than this percentage of their low price. (Default: 0.5)
Display Options
Show Entropy Label: Toggles the visibility of the text label inside each zone. (Default: true)
Label Text Position: The horizontal alignment of the text label. (Default: Right)
Show Calibration Note: Toggles the visibility of the calibration note in the corner of the chart. (Default: true)
Best Use Cases
Trend Reversal Trading: Identifying when a strong trend is likely to reverse or pause.
Breakout Confirmation: Using the absence of high entropy to confirm the strength of a breakout.
Ranging Market Identification: Periods of high entropy can indicate that a market is transitioning into a sideways or choppy phase.
Limitations
Not a Standalone Signal: This indicator should be used in conjunction with other forms of analysis to confirm trading signals.
Lagging Nature: Like all indicators based on historical data, ApEn is a lagging measure and does not predict future price movements with certainty.
Calibration Required: The effectiveness of the indicator is highly dependent on the “Entropy Threshold” setting, which needs to be adjusted for different assets and timeframes.
What Makes This Unique
Quantifies Complexity: It provides a numerical measure of market complexity, offering a different perspective than traditional indicators.
Clear Visual Cues: The zones make it easy to see when the market is in a state of high unpredictability.
User-Friendly Design: With features like the on-chart calibration note, the indicator is designed to be easy to use and optimize.
How It Works
Calculate Standard Deviation: The indicator first calculates the standard deviation of the source price data over a specified lookback period.
Calculate Phi: It then calculates a value called “phi” for two different pattern lengths (embedding dimensions ‘m’ and ‘m+1’). This involves comparing sequences of data points to see how many are “similar” within a certain tolerance (determined by the standard deviation and the ‘r’ multiplier).
Calculate ApEn: The Approximate Entropy is the difference between the two phi values. A higher ApEn value indicates greater irregularity and unpredictability in the data.
Plot Zones: If the calculated ApEn exceeds the user-defined ‘Entropy Threshold’, a zone is plotted on the chart.
Note: The “Entropy Threshold” is the most important setting to adjust. If you see too many zones, increase the threshold. If you see too few, decrease it.

Sticky Notes📌 Sticky Notes - On-Chart Memo Tool
A convenient indicator that lets you display trading ideas and important notes directly on your charts!
✨ Key Features:
📝 Create memos with custom text input
📍 Place anywhere on chart (top/middle/bottom)
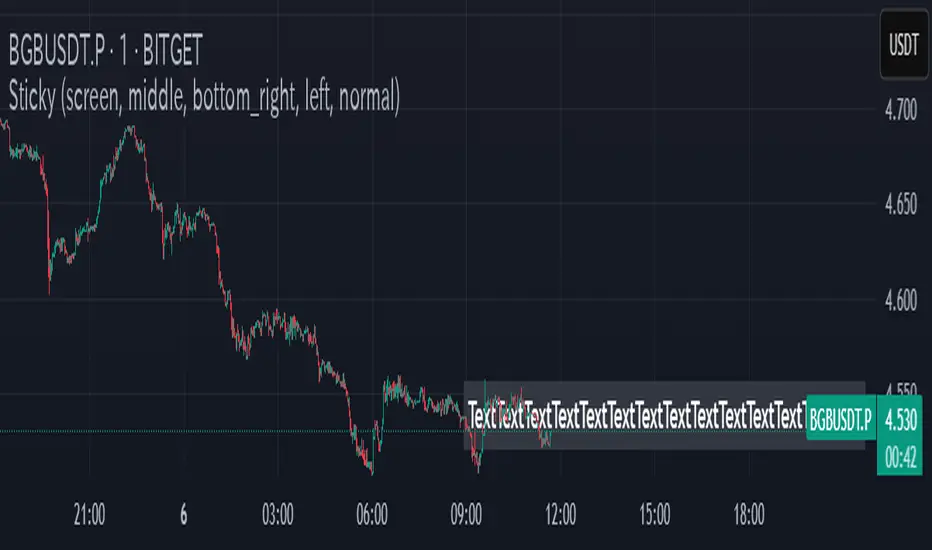
🖥️ Screen-fixed display mode (corner positions)
🎨 Fully customizable text and background colors
📏 5 text size options (tiny to huge)
⏰ Time-based display functionality
📐 Text alignment options (left/center/right)
💡 Use Cases:
Trading strategy reminders
Important price level notes
Economic event schedules
Entry/exit point memos
Simple and user-friendly design to enhance your trading analysis!
FVG Premium [no1x]█ OVERVIEW
This indicator provides a comprehensive toolkit for identifying, visualizing, and tracking Fair Value Gaps (FVGs) across three distinct timeframes (current chart, a user-defined Medium Timeframe - MTF, and a user-defined High Timeframe - HTF). It is designed to offer traders enhanced insight into FVG dynamics through detailed state monitoring (formation, partial fill, full mitigation, midline touch), extensive visual customization for FVG representation, and a rich alert system for timely notifications on FVG-related events.
█ CONCEPTS
This indicator is built upon the core concept of Fair Value Gaps (FVGs) and their significance in price action analysis, offering a multi-layered approach to their detection and interpretation across different timeframes.
Fair Value Gaps (FVGs)
A Fair Value Gap (FVG), also known as an imbalance, represents a range in price delivery where one side of the market (buying or selling) was more aggressive, leaving an inefficiency or an "imbalance" in the price action. This concept is prominently featured within Smart Money Concepts (SMC) and Inner Circle Trader (ICT) methodologies, where such gaps are often interpreted as footprints left by "smart money" due to rapid, forceful price movements. These methodologies suggest that price may later revisit these FVG zones to rebalance a prior inefficiency or to seek liquidity before continuing its path. These gaps are typically identified by a three-bar pattern:
Bullish FVG : This is a three-candle formation where the second candle shows a strong upward move. The FVG is the space created between the high of the first candle (bottom of FVG) and the low of the third candle (top of FVG). This indicates a strong upward impulsive move.
Bearish FVG : This is a three-candle formation where the second candle shows a strong downward move. The FVG is the space created between the low of the first candle (top of FVG) and the high of the third candle (bottom of FVG). This indicates a strong downward impulsive move.
FVGs are often watched by traders as potential areas where price might return to "rebalance" or find support/resistance.
Multi-Timeframe (MTF) Analysis
The indicator extends FVG detection beyond the current chart's timeframe (Low Timeframe - LTF) to two higher user-defined timeframes: Medium Timeframe (MTF) and High Timeframe (HTF). This allows traders to:
Identify FVGs that might be significant on a broader market structure.
Observe how FVGs from different timeframes align or interact.
Gain a more comprehensive perspective on potential support and resistance zones.
FVG State and Lifecycle Management
The indicator actively tracks the lifecycle of each detected FVG:
Formation : The initial identification of an FVG.
Partial Fill (Entry) : When price enters but does not completely pass through the FVG. The indicator updates the "current" top/bottom of the FVG to reflect the filled portion.
Midline (Equilibrium) Touch : When price touches the 50% level of the FVG.
Full Mitigation : When price completely trades through the FVG, effectively "filling" or "rebalancing" the gap. The indicator records the mitigation time.
This state tracking is crucial for understanding how price interacts with these zones.
FVG Classification (Large FVG)
FVGs can be optionally classified as "Large FVGs" (LV) if their size (top to bottom range) exceeds a user-defined multiple of the Average True Range (ATR) for that FVG's timeframe. This helps distinguish FVGs that are significantly larger relative to recent volatility.
Visual Customization and Information Delivery
A key concept is providing extensive control over how FVGs are displayed. This control is achieved through a centralized set of visual parameters within the indicator, allowing users to configure numerous aspects (colors, line styles, visibility of boxes, midlines, mitigation lines, labels, etc.) for each timeframe. Additionally, an on-chart information panel summarizes the nearest unmitigated bullish and bearish FVG levels for each active timeframe, providing a quick glance at key price points.
█ FEATURES
This indicator offers a rich set of features designed to provide a highly customizable and comprehensive Fair Value Gap (FVG) analysis experience. Users can tailor the FVG detection, visual representation, and alerting mechanisms across three distinct timeframes: the current chart (Low Timeframe - LTF), a user-defined Medium Timeframe (MTF), and a user-defined High Timeframe (HTF).
Multi-Timeframe FVG Detection and Display
The core strength of this indicator lies in its ability to identify and display FVGs from not only the current chart's timeframe (LTF) but also from two higher, user-selectable timeframes (MTF and HTF).
Timeframe Selection: Users can specify the exact MTF (e.g., "60", "240") and HTF (e.g., "D", "W") through dedicated inputs in the "MTF (Medium Timeframe)" and "HTF (High Timeframe)" settings groups. The visibility of FVGs from these higher timeframes can be toggled independently using the "Show MTF FVGs" and "Show HTF FVGs" checkboxes.
Consistent Detection Logic: The FVG detection logic, based on the classic three-bar imbalance pattern detailed in the 'Concepts' section, is applied consistently across all selected timeframes (LTF, MTF, HTF)
Timeframe-Specific Visuals: Each timeframe's FVGs (LTF, MTF, HTF) can be customized with unique colors for bullish/bearish states and their mitigated counterparts. This allows for easy visual differentiation of FVGs originating from different market perspectives.
Comprehensive FVG Visualization Options
The indicator provides extensive control over how FVGs are visually represented on the chart for each timeframe (LTF, MTF, HTF).
FVG Boxes:
Visibility: Main FVG boxes can be shown or hidden per timeframe using the "Show FVG Boxes" (for LTF), "Show Boxes" (for MTF/HTF) inputs.
Color Customization: Colors for bullish, bearish, active, and mitigated FVG boxes (including Large FVGs, if classified) are fully customizable for each timeframe.
Box Extension & Length: FVG boxes can either be extended to the right indefinitely ("Extend Boxes Right") or set to a fixed length in bars ("Short Box Length" or "Box Length" equivalent inputs).
Box Labels: Optional labels can display the FVG's timeframe and fill percentage on the box. These labels are configurable for all timeframes (LTF, MTF, and HTF). Please note: If FVGs are positioned very close to each other on the chart, their respective labels may overlap. This can potentially lead to visual clutter, and it is a known behavior in the current version of the indicator.
Box Borders: Visibility, width, style (solid, dashed, dotted), and color of FVG box borders are customizable per timeframe.
Midlines (Equilibrium/EQ):
Visibility: The 50% level (midline or EQ) of FVGs can be shown or hidden for each timeframe.
Style Customization: Width, style, and color of the midline are customizable per timeframe. The indicator tracks if this midline has been touched by price.
Mitigation Lines:
Visibility: Mitigation lines (representing the FVG's opening level that needs to be breached for full mitigation) can be shown or hidden for each timeframe. If shown, these lines are always extended to the right.
Style Customization: Width, style, and color of the mitigation line are customizable per timeframe.
Mitigation Line Labels: Optional price labels can be displayed on mitigation lines, with a customizable horizontal bar offset for positioning. For optimal label placement, the following horizontal bar offsets are recommended: 4 for LTF, 8 for MTF, and 12 for HTF.
Persistence After Mitigation: Users can choose to keep mitigation lines visible even after an FVG is fully mitigated, with a distinct color for such lines. Importantly, this option is only effective if the general setting 'Hide Fully Mitigated FVGs' is disabled, as otherwise, the entire FVG and its lines will be removed upon mitigation.
FVG State Management and Behavior
The indicator tracks and visually responds to changes in FVG states.
Hide Fully Mitigated FVGs: This option, typically found in the indicator's general settings, allows users to automatically remove all visual elements of an FVG from the chart once price has fully mitigated it. This helps maintain chart clarity by focusing on active FVGs.
Partial Fill Visualization: When price enters an FVG, the indicator offers a dynamic visual representation: the portion of the FVG that has been filled is shown as a "mitigated box" (typically with a distinct color), while the original FVG box shrinks to clearly highlight the remaining, unfilled portion. This two-part display provides an immediate visual cue about how much of the FVG's imbalance has been addressed and what potential remains within the gap.
Visual Filtering by ATR Proximity: To help users focus on the most relevant price action, FVGs can be dynamically hidden if they are located further from the current price than a user-defined multiple of the Average True Range (ATR). This behavior is controlled by the "Filter Band Width (ATR Multiple)" input; setting this to zero disables the filter entirely, ensuring all detected FVGs remain visible regardless of their proximity to price.
Alternative Usage Example: Mitigation Lines as Key Support/Resistance Levels
For traders preferring a minimalist chart focused on key Fair Value Gap (FVG) levels, the indicator's visualization settings can be customized to display only FVG mitigation lines. This approach leverages these lines as potential support and resistance zones, reflecting areas where price might revisit to address imbalances.
To configure this view:
Disable FVG Boxes: Turn off "Show FVG Boxes" (for LTF) or "Show Boxes" (for MTF/HTF) for the desired timeframes.
Hide Midlines: Disable the visibility of the 50% FVG Midlines (Equilibrium/EQ).
Ensure Mitigation Lines are Visible: Keep "Mitigation Lines" enabled.
Retain All Mitigation Lines:
Disable the "Hide Fully Mitigated FVGs" option in the general settings.
Enable the feature to "keep mitigation lines visible even after an FVG is fully mitigated". This ensures lines from all FVGs (active or fully mitigated) remain on the chart, which is only effective if "Hide Fully Mitigated FVGs" is disabled.
This setup offers:
A Decluttered Chart: Focuses solely on the FVG opening levels.
Precise S/R Zones: Treats mitigation lines as specific points for potential price reactions.
Historical Level Analysis: Includes lines from past, fully mitigated FVGs for a comprehensive view of significant price levels.
For enhanced usability with this focused view, consider these optional additions:
The on-chart Information Panel can be activated to display a quick summary of the nearest unmitigated FVG levels.
Mitigation Line Labels can also be activated for clear price level identification. A customizable horizontal bar offset is available for positioning these labels; for example, offsets of 4 for LTF, 8 for MTF, and 12 for HTF can be effective.
FVG Classification (Large FVG)
This feature allows for distinguishing FVGs based on their size relative to market volatility.
Enable Classification: Users can enable "Classify FVG (Large FVG)" to identify FVGs that are significantly larger than average.
ATR-Based Threshold: An FVG is classified as "Large" if its height (price range) is greater than or equal to the Average True Range (ATR) of its timeframe multiplied by a user-defined "Large FVG Threshold (ATR Multiple)". The ATR period for this calculation is also configurable.
Dedicated Colors: Large FVGs (both bullish/bearish and active/mitigated) can be assigned unique colors, making them easily distinguishable on the chart.
Panel Icon: Large FVGs are marked with a special icon in the Info Panel.
Information Panel
An on-chart panel provides a quick summary of the nearest unmitigated FVG levels.
Visibility and Position: The panel can be shown/hidden and positioned in any of the nine standard locations on the chart (e.g., Top Right, Middle Center).
Content: It displays the price levels of the nearest unmitigated bullish and bearish FVGs for LTF, MTF (if active), and HTF (if active). It also indicates if these nearest FVGs are Large FVGs (if classification is enabled) using a selectable icon.
Styling: Text size, border color, header background/text colors, default text color, and "N/A" cell background color are customizable.
Highlighting: Background and text colors for the cells displaying the overall nearest bullish and bearish FVG levels (across all active timeframes) can be customized to draw attention to the most proximate FVG.
Comprehensive Alert System
The indicator offers a granular alert system for various FVG-related events, configurable for each timeframe (LTF, MTF, HTF) independently. Users can enable alerts for:
New FVG Formation: Separate alerts for new bullish and new bearish FVG formations.
FVG Entry/Partial Fill: Separate alerts for price entering a bullish FVG or a bearish FVG.
FVG Full Mitigation: Separate alerts for full mitigation of bullish and bearish FVGs.
FVG Midline (EQ) Touch: Separate alerts for price touching the midline of a bullish or bearish FVG.
Alert messages are detailed, providing information such as the timeframe, FVG type (bull/bear, Large FVG), relevant price levels, and timestamps.
█ NOTES
This section provides additional information regarding the indicator's usage, performance considerations, and potential interactions with the TradingView platform. Understanding these points can help users optimize their experience and troubleshoot effectively.
Performance and Resource Management
Maximum FVGs to Track : The "Max FVGs to Track" input (defaulting to 25) limits the number of FVG objects processed for each category (e.g., LTF Bullish, MTF Bearish). Increasing this value significantly can impact performance due to more objects being iterated over and potentially drawn, especially when multiple timeframes are active.
Drawing Object Limits : To manage performance, this script sets its own internal limits on the number of drawing objects it displays. While it allows for up to approximately 500 lines (max_lines_count=500) and 500 labels (max_labels_count=500), the number of FVG boxes is deliberately restricted to a maximum of 150 (max_boxes_count=150). This specific limit for boxes is a key performance consideration: displaying too many boxes can significantly slow down the indicator, and a very high number is often not essential for analysis. Enabling all visual elements for many FVGs across all three timeframes can cause the indicator to reach these internal limits, especially the stricter box limit
Optimization Strategies : To help you manage performance, reduce visual clutter, and avoid exceeding drawing limits when using this indicator, I recommend the following strategies:
Maintain or Lower FVG Tracking Count: The "Max FVGs to Track" input defaults to 25. I find this value generally sufficient for effective analysis and balanced performance. You can keep this default or consider reducing it further if you experience performance issues or prefer a less dense FVG display.
Utilize Proximity Filtering: I suggest activating the "Filter Band Width (ATR Multiple)" option (found under "General Settings") to display only those FVGs closer to the current price. From my experience, a value of 5 for the ATR multiple often provides a good starting point for balanced performance, but you should feel free to adjust this based on market volatility and your specific trading needs.
Hide Fully Mitigated FVGs: I strongly recommend enabling the "Hide Fully Mitigated FVGs" option. This setting automatically removes all visual elements of an FVG from the chart once it has been fully mitigated by price. Doing so significantly reduces the number of active drawing objects, lessens computational load, and helps maintain chart clarity by focusing only on active, relevant FVGs.
Disable FVG Display for Unused Timeframes: If you are not actively monitoring certain higher timeframes (MTF or HTF) for FVG analysis, I advise disabling their display by unchecking "Show MTF FVGs" or "Show HTF FVGs" respectively. This can provide a significant performance boost.
Simplify Visual Elements: For active FVGs, consider hiding less critical visual elements if they are not essential for your specific analysis. This could include box labels, borders, or even entire FVG boxes if, for example, only the mitigation lines are of interest for a particular timeframe.
Settings Changes and Platform Limits : This indicator is comprehensive and involves numerous calculations and drawings. When multiple settings are changed rapidly in quick succession, it is possible, on occasion, for TradingView to issue a "Runtime error: modify_study_limit_exceeding" or similar. This can cause the indicator to temporarily stop updating or display errors.
Recommended Approach : When adjusting settings, it is advisable to wait a brief moment (a few seconds) after each significant change. This allows the indicator to reprocess and update on the chart before another change is made
Error Recovery : Should such a runtime error occur, making a minor, different adjustment in the settings (e.g., toggling a checkbox off and then on again) and waiting briefly will typically allow the indicator to recover and resume correct operation. This behavior is related to platform limitations when handling complex scripts with many inputs and drawing objects.
Multi-Timeframe (MTF/HTF) Data and Behavior
HTF FVG Confirmation is Essential: : For an FVG from a higher timeframe (MTF or HTF) to be identified and displayed on your current chart (LTF), the three-bar pattern forming the FVG on that higher timeframe must consist of fully closed bars. The indicator does not draw speculative FVGs based on incomplete/forming bars from higher timeframes.
Data Retrieval and LTF Processing: The indicator may use techniques like lookahead = barmerge.lookahead_on for timely data retrieval from higher timeframes. However, the actual detection of an FVG occurs after all its constituent bars on the HTF have closed.
Appearance Timing on LTF (1 LTF Candle Delay): As a natural consequence of this, an FVG that is confirmed on an HTF (i.e., its third bar closes) will typically become visible on your LTF chart one LTF bar after its confirmation on the HTF.
Example: Assume an FVG forms on a 30-minute chart at 15:30 (i.e., with the close of the 30-minute bar that covers the 15:00-15:30 period). If you are monitoring this FVG on a 15-minute chart, the indicator will detect this newly formed 30-minute FVG while processing the data for the 15-minute bar that starts at 15:30 and closes at 15:45. Therefore, the 30-minute FVG will become visible on your 15-minute chart at the earliest by 15:45 (i.e., with the close of that relevant 15-minute LTF candle). This means the HTF FVG is reflected on the LTF chart with a delay equivalent to one LTF candle.
FVG Detection and Display Logic
Fair Value Gaps (FVGs) on the current chart timeframe (LTF) are detected based on barstate.isconfirmed. This means the three-bar pattern must be complete with closed bars before an FVG is identified. This confirmation method prevents FVGs from being prematurely identified on the forming bar.
Alerts
Alert Setup : To receive alerts from this indicator, you must first ensure you have enabled the specific alert conditions you are interested in within the indicator's own settings (see 'Comprehensive Alert System' under the 'FEATURES' section). Once configured, open TradingView's 'Create Alert' dialog. In the 'Condition' tab, select this indicator's name, and crucially, choose the 'Any alert() function call' option from the dropdown list. This setup allows the indicator to trigger alerts based on the precise event conditions you have activated in its settings
Alert Frequency : Alerts are designed to trigger once per bar close (alert.freq_once_per_bar_close) for the specific event.
User Interface (UI) Tips
Settings Group Icons: In the indicator settings menu, timeframe-specific groups are marked with star icons for easier navigation: 🌟 for LTF (Current Chart Timeframe), 🌟🌟 for MTF (Medium Timeframe), and 🌟🌟🌟 for HTF (High Timeframe).
Dependent Inputs: Some input settings are dependent on others being enabled. These dependencies are visually indicated in the settings menu using symbols like "↳" (dependent setting on the next line), "⟷" (mutually exclusive inline options), or "➜" (directly dependent inline option).
Settings Layout Overview: The indicator settings are organized into logical groups for ease of use. Key global display controls – such as toggles for MTF FVGs, HTF FVGs (along with their respective timeframe selectors), and the Information Panel – are conveniently located at the very top within the '⚙️ General Settings' group. This placement allows for quick access to frequently adjusted settings. Other sections provide detailed customization options for each timeframe (LTF, MTF, HTF), specific FVG components, and alert configurations.
█ FOR Pine Script® CODERS
This section provides a high-level overview of the FVG Premium indicator's internal architecture, data flow, and the interaction between its various library components. It is intended for Pine Script™ programmers who wish to understand the indicator's design, potentially extend its functionality, or learn from its structure.
System Architecture and Modular Design
The indicator is architected moduarly, leveraging several custom libraries to separate concerns and enhance code organization and reusability. Each library has a distinct responsibility:
FvgTypes: Serves as the foundational data definition layer. It defines core User-Defined Types (UDTs) like fvgObject (for storing all attributes of an FVG) and drawSettings (for visual configurations), along with enumerations like tfType.
CommonUtils: Provides utility functions for common tasks like mapping user string inputs (e.g., "Dashed" for line style) to their corresponding Pine Script™ constants (e.g., line.style_dashed) and formatting timeframe strings for display.
FvgCalculations: Contains the core logic for FVG detection (both LTF and MTF/HTF via requestMultiTFBarData), FVG classification (Large FVGs based on ATR), and checking FVG interactions with price (mitigation, partial fill).
FvgObject: Implements an object-oriented approach by attaching methods to the fvgObject UDT. These methods manage the entire visual lifecycle of an FVG on the chart, including drawing, updating based on state changes (e.g., mitigation), and deleting drawing objects. It's responsible for applying the visual configurations defined in drawSettings.
FvgPanel: Manages the creation and dynamic updates of the on-chart information panel, which displays key FVG levels.
The main indicator script acts as the orchestrator, initializing these libraries, managing user inputs, processing data flow between libraries, and handling the main event loop (bar updates) for FVG state management and alerts.
Core Data Flow and FVG Lifecycle Management
The general data flow and FVG lifecycle can be summarized as follows:
Input Processing: User inputs from the "Settings" dialog are read by the main indicator script. Visual style inputs (colors, line styles, etc.) are consolidated into a types.drawSettings object (defined in FvgTypes). Other inputs (timeframes, filter settings, alert toggles) control the behavior of different modules. CommonUtils assists in mapping some string inputs to Pine constants.
FVG Detection:
For the current chart timeframe (LTF), FvgCalculations.detectFvg() identifies potential FVGs based on bar patterns.
For MTF/HTF, the main indicator script calls FvgCalculations.requestMultiTFBarData() to fetch necessary bar data from higher timeframes, then FvgCalculations.detectMultiTFFvg() identifies FVGs.
Newly detected FVGs are instantiated as types.fvgObject and stored in arrays within the main script. These objects also undergo classification (e.g., Large FVG) by FvgCalculations.
State Update & Interaction: On each bar, the main indicator script iterates through active FVG objects to manage their state based on price interaction:
Initially, the main script calls FvgCalculations.fvgInteractionCheck() to efficiently determine if the current bar's price might be interacting with a given FVG.
If a potential interaction is flagged, the main script then invokes methods directly on the fvgObject instance (e.g., updateMitigation(), updatePartialFill(), checkMidlineTouch(), which are part of FvgObject).
These fvgObject methods are responsible for the detailed condition checking and the actual modification of the FVG's state. For instance, the updateMitigation() and updatePartialFill() methods internally utilize specific helper functions from FvgCalculations (like checkMitigation() and checkPartialMitigation()) to confirm the precise nature of the interaction before updating the fvgObject’s state fields (such as isMitigated, currentTop, currentBottom, or isMidlineTouched).
Visual Rendering:
The FvgObject.updateDrawings() method is called for each fvgObject. This method is central to drawing management; it creates, updates, or deletes chart drawings (boxes, lines, labels) based on the FVG's current state, its prev_* (previous bar state) fields for optimization, and the visual settings passed via the drawSettings object.
Information Panel Update: The main indicator script determines the nearest FVG levels, populates a panelData object (defined in FvgPanelLib), and calls FvgPanel.updatePanel() to refresh the on-chart display.
Alert Generation: Based on the updated FVG states and user-enabled alert settings, the main indicator script constructs and triggers alerts using Pine Script's alert() function."
Key Design Considerations
UDT-Centric Design: The fvgObject UDT is pivotal, acting as a stateful container for all information related to a single FVG. Most operations revolve around creating, updating, or querying these objects.
State Management: To optimize drawing updates and manage FVG lifecycles, fvgObject instances store their previous bar's state (e.g., prevIsVisible, prevCurrentTop). The FvgObject.updateDrawings() method uses this to determine if a redraw is necessary, minimizing redundant drawing calls.
Settings Object: A drawSettings object is populated once (or when inputs change) and passed to drawing functions. This avoids repeatedly reading numerous input() values on every bar or within loops, improving performance.
Dynamic Arrays for FVG Storage: Arrays are used to store collections of fvgObject instances, allowing for dynamic management (adding new FVGs, iterating for updates).

BW MFI fixed v6Bill Williams MFI
Sure! Here’s an English description of the indicator you have:
---
### Bill Williams Market Facilitation Index (MFI) — Indicator Description
This indicator implements the **Market Facilitation Index (MFI)** as introduced by Bill Williams. The MFI measures the market's willingness to move the price by comparing the price range to the volume.
---
### How it works:
* **MFI Calculation:**
The MFI is calculated as the difference between the current bar’s high and low prices divided by the volume of that bar:
$$
\text{MFI} = \frac{\text{High} - \text{Low}}{\text{Volume}}
$$
* **Color Coding Logic:**
The indicator compares the current MFI and volume values to their previous values and assigns colors to visualize market conditions according to Bill Williams’ methodology:
| Color | Condition | Market Interpretation |
| ----------- | ------------------ | --------------------------------------------------------------------------------------------- |
| **Green** | MFI ↑ and Volume ↑ | Strong trend continuation or acceleration (increased price movement supported by volume) |
| **Brown** | MFI ↓ and Volume ↓ | Trend weakening or possible pause (both price movement and volume are decreasing) |
| **Blue** | MFI ↑ and Volume ↓ | Possible false breakout or lack of conviction (price moves but volume decreases) |
| **Fuchsia** | MFI ↓ and Volume ↑ | Market indecision or battle between bulls and bears (volume rises but price movement shrinks) |
| **Gray** | None of the above | Neutral or unchanged market condition |
* **Display:**
The indicator plots the MFI values as colored columns on a separate pane below the price chart, providing a visual cue of the market’s behavior.
---
### Purpose:
This tool helps traders identify changes in market momentum and the strength behind price moves, providing insight into when trends might accelerate, weaken, or potentially reverse.
---
If you want, I can help you write a more detailed user guide or trading strategy based on this indicator!
Candle PercentageThis script calculates the percentage movement of the candle body from open to close and displays it as a label on the chart. The label color changes based on the candle's direction:
Green for bullish (price closes higher than it opened),
Red for bearish (price closes lower than it opened).
The script also allows you to select the label size, with the following options:
Tiny (very small text)
Small (small text)
Normal (default text size)
Large (large text)
Huge (giant text)
By default, the label size is set to Normal.
The percentage is calculated using the formula:
(Body Size / Open Price) * 100
This is helpful for traders who want to quickly assess the magnitude of price movement within each candle and analyze market sentiment based on the size of the body.

Bull Bear Pivot by RawstocksThe "Bull Bear Pivot" indicator is a custom Pine Script (v5) tool designed for TradingView to assist traders in identifying key price levels and pivot points on intraday charts (up to 1-hour timeframes). It combines time-based open price markers, pivot high/low detection, and candlestick visualization to provide a comprehensive view of potential support, resistance, and trend reversal levels. Below is a detailed description of the indicator’s functionality, features, and intended use.
Indicator Overview:
The "Bull Bear Pivot" indicator is tailored for intraday trading, focusing on specific times of the day to mark significant price levels (open prices) and detect pivot points. It plots horizontal lines at the open prices of user-defined sessions, identifies pivot highs and lows on the current chart timeframe, and overlays custom candlesticks to highlight price action. The indicator is designed to work on timeframes of 1 hour or less (e.g., 1-minute, 3-minute, 5-minute, 15-minute, 30-minute, 60-minute) and includes a warning mechanism for invalid timeframes.
Key Features:
Time-Based Open Price Markers:
The indicator allows users to define up to five time-based sessions (e.g., 4:00 AM, 8:30 AM, 9:30 AM, 10:00 AM, and a custom time) to capture the open price at the start of each session.
For each session, it plots a horizontal line at the 1-minute open price, extending from the session start to the market close at 4:00 PM EST.
Each line is accompanied by a label positioned 5 bars to the right of the market close (4:00 PM EST), with the text right-aligned and vertically centered on the line.
Users can enable/disable each marker, customize the session time, label text, line color, and text color via the indicator’s settings.
Pivot Highs and Lows:
The indicator calculates pivot highs and lows on the current chart timeframe using the ta.pivothigh and ta.pivotlow functions.
Pivot highs are marked with green triangles above the bars, and pivot lows are marked with red triangles below the bars.
The pivot period (lookback/lookforward) is user-configurable, allowing flexibility in detecting short-term or longer-term reversals.
Custom Candlesticks:
The indicator overlays custom candlesticks on the chart, colored green for bullish candles (close > open) and red for bearish candles (close < open).
This feature helps visualize price action alongside the open price markers and pivot points.
Timeframe Restriction:
The indicator is designed to work on timeframes of 1 hour or less. If the chart timeframe exceeds 1 hour (e.g., 4-hour, daily), a warning label ("Timeframe > 1H\nIndicator Disabled") is displayed, and no elements are plotted.
Customizable Appearance:
Users can customize the appearance of the open price marker lines, including the line style (solid, dashed, dotted) and line width.
Labels for the open price markers have no background (transparent) and use customizable text colors.

CCI with Subjective NormalizationCCI (Commodity Channel Index) with Subjective Normalization
This indicator computes the classic CCI over a user-defined length, then applies a subjective mean and scale to transform the raw CCI into a pseudo Z‑score range. By adjusting the “Subjective Mean” and “Subjective Scale” inputs, you can shift and rescale the oscillator to highlight significant tops and bottoms more clearly in historical data.
1. CCI Calculation:
- Uses the standard formula \(\text{CCI} = \frac{\text{price} - \text{SMA(price, length)}}{0.015 \times \text{mean deviation}}\) over a user-specified length (default 500 bars).
2. Subjective Normalization:
- After CCI is calculated, it is divided by “Subjective Scale” and offset by “Subjective Mean.”
- This step effectively re-centers and re-scales the oscillator, helping you align major lows or highs at values like –2 or +2 (or any desired range).
3. Usage Tips:
- CCI Length controls how far back the script measures average price and deviation. Larger values emphasize multi-year cycles.
- Subjective Mean and Scale let you align the oscillator’s historical lows and highs with numeric levels you prefer (e.g., near ±2).
- Adjust these parameters to fit your particular market analysis or to match known cycle tops/bottoms.
4. Plot & Zero Line:
- The indicator plots the normalized CCI in yellow, along with a zero line for quick reference.
- Positive values suggest price is above its long-term mean, while negative values suggest it’s below.
This approach offers a straightforward momentum oscillator (CCI) combined with a customizable normalization, making it easier to spot historically significant overbought/oversold conditions without writing complex code yourself.

Volume Weighted RSI (VW RSI)The Volume Weighted RSI (VW RSI) is a momentum oscillator designed for TradingView, implemented in Pine Script v6, that enhances the traditional Relative Strength Index (RSI) by incorporating trading volume into its calculation. Unlike the standard RSI, which measures the speed and change of price movements based solely on price data, the VW RSI weights its analysis by volume, emphasizing price movements backed by significant trading activity. This makes the VW RSI particularly effective for identifying bullish or bearish momentum, overbought/oversold conditions, and potential trend reversals in markets where volume plays a critical role, such as stocks, forex, and cryptocurrencies.
Key Features
Volume-Weighted Momentum Calculation:
The VW RSI calculates momentum by comparing the volume associated with upward price movements (up-volume) to the volume associated with downward price movements (down-volume).
Up-volume is the volume on bars where the closing price is higher than the previous close, while down-volume is the volume on bars where the closing price is lower than the previous close.
These volumes are smoothed over a user-defined period (default: 14 bars) using a Running Moving Average (RMA), and the VW RSI is computed using the formula:
\text{VW RSI} = 100 - \frac{100}{1 + \text{VoRS}}
where
\text{VoRS} = \frac{\text{Average Up-Volume}}{\text{Average Down-Volume}}
.
Oscillator Range and Interpretation:
The VW RSI oscillates between 0 and 100, with a centerline at 50.
Above 50: Indicates bullish volume momentum, suggesting that volume on up bars dominates, which may signal buying pressure and a potential uptrend.
Below 50: Indicates bearish volume momentum, suggesting that volume on down bars dominates, which may signal selling pressure and a potential downtrend.
Overbought/Oversold Levels: User-defined thresholds (default: 70 for overbought, 30 for oversold) help identify potential reversal points:
VW RSI > 70: Overbought, indicating a possible pullback or reversal.
VW RSI < 30: Oversold, indicating a possible bounce or reversal.
Visual Elements:
VW RSI Line: Plotted in a separate pane below the price chart, colored dynamically based on its value:
Green when above 50 (bullish momentum).
Red when below 50 (bearish momentum).
Gray when at 50 (neutral).
Centerline: A dashed line at 50, optionally displayed, serving as the neutral threshold between bullish and bearish momentum.
Overbought/Oversold Lines: Dashed lines at the user-defined overbought (default: 70) and oversold (default: 30) levels, optionally displayed, to highlight extreme conditions.
Background Coloring: The background of the VW RSI pane is shaded red when the indicator is in overbought territory and green when in oversold territory, providing a quick visual cue of potential reversal zones.
Alerts:
Built-in alerts for key events:
Bullish Momentum: Triggered when the VW RSI crosses above 50, indicating a shift to bullish volume momentum.
Bearish Momentum: Triggered when the VW RSI crosses below 50, indicating a shift to bearish volume momentum.
Overbought Condition: Triggered when the VW RSI crosses above the overbought threshold (default: 70), signaling a potential pullback.
Oversold Condition: Triggered when the VW RSI crosses below the oversold threshold (default: 30), signaling a potential bounce.
Input Parameters
VW RSI Length (default: 14): The period over which the up-volume and down-volume are smoothed to calculate the VW RSI. A longer period results in smoother signals, while a shorter period increases sensitivity.
Overbought Level (default: 70): The threshold above which the VW RSI is considered overbought, indicating a potential reversal or pullback.
Oversold Level (default: 30): The threshold below which the VW RSI is considered oversold, indicating a potential reversal or bounce.
Show Centerline (default: true): Toggles the display of the 50 centerline, which separates bullish and bearish momentum zones.
Show Overbought/Oversold Lines (default: true): Toggles the display of the overbought and oversold threshold lines.
How It Works
Volume Classification:
For each bar, the indicator determines whether the price movement is upward or downward:
If the current close is higher than the previous close, the bar’s volume is classified as up-volume.
If the current close is lower than the previous close, the bar’s volume is classified as down-volume.
If the close is unchanged, both up-volume and down-volume are set to 0 for that bar.
Smoothing:
The up-volume and down-volume are smoothed using a Running Moving Average (RMA) over the specified period (default: 14 bars) to reduce noise and provide a more stable measure of volume momentum.
VW RSI Calculation:
The Volume Relative Strength (VoRS) is calculated as the ratio of smoothed up-volume to smoothed down-volume.
The VW RSI is then computed using the standard RSI formula, but with volume data instead of price changes, resulting in a value between 0 and 100.
Visualization and Alerts:
The VW RSI is plotted with dynamic coloring to reflect its momentum direction, and optional lines are drawn for the centerline and overbought/oversold levels.
Background coloring highlights overbought and oversold conditions, and alerts notify the trader of significant crossings.
Usage
Timeframe: The VW RSI can be used on any timeframe, but it is particularly effective on intraday charts (e.g., 1-hour, 4-hour) or daily charts where volume data is reliable. Shorter timeframes may require a shorter length for increased sensitivity, while longer timeframes may benefit from a longer length for smoother signals.
Markets: Best suited for markets with significant and reliable volume data, such as stocks, forex, and cryptocurrencies. It may be less effective in markets with low or inconsistent volume, such as certain futures contracts.
Trading Strategies:
Trend Confirmation:
Use the VW RSI to confirm the direction of a trend. For example, in an uptrend, look for the VW RSI to remain above 50, indicating sustained bullish volume momentum, and consider buying on pullbacks when the VW RSI dips but stays above 50.
In a downtrend, look for the VW RSI to remain below 50, indicating sustained bearish volume momentum, and consider selling on rallies when the VW RSI rises but stays below 50.
Overbought/Oversold Conditions:
When the VW RSI crosses above 70, the market may be overbought, suggesting a potential pullback or reversal. Consider taking profits on long positions or preparing for a short entry, but confirm with price action or other indicators.
When the VW RSI crosses below 30, the market may be oversold, suggesting a potential bounce or reversal. Consider entering long positions or covering shorts, but confirm with additional signals.
Divergences:
Look for divergences between the VW RSI and price to spot potential reversals. For example, if the price makes a higher high but the VW RSI makes a lower high, this bearish divergence may signal an impending downtrend.
Conversely, if the price makes a lower low but the VW RSI makes a higher low, this bullish divergence may signal an impending uptrend.
Momentum Shifts:
A crossover above 50 can signal the start of bullish momentum, making it a potential entry point for long trades.
A crossunder below 50 can signal the start of bearish momentum, making it a potential entry point for short trades or an exit for long positions.
Example
On a 4-hour SOLUSDT chart:
During an uptrend, the VW RSI might rise above 50 and stay there, confirming bullish volume momentum. If it approaches 70, it may indicate overbought conditions, as seen near a price peak of 145.08, suggesting a potential pullback.
During a downtrend, the VW RSI might fall below 50, confirming bearish volume momentum. If it drops below 30 near a price low of 141.82, it may indicate oversold conditions, suggesting a potential bounce, as seen in a slight recovery afterward.
A bullish divergence might occur if the price makes a lower low during the downtrend, but the VW RSI makes a higher low, signaling a potential reversal.
Limitations
Lagging Nature: Like the traditional RSI, the VW RSI is a lagging indicator because it relies on smoothed data (RMA). It may not react quickly to sudden price reversals, potentially missing the start of new trends.
False Signals in Ranging Markets: In choppy or ranging markets, the VW RSI may oscillate around 50, generating frequent crossovers that lead to false signals. Combining it with a trend filter (e.g., ADX) can help mitigate this.
Volume Data Dependency: The VW RSI relies on accurate volume data, which may be inconsistent or unavailable in some markets (e.g., certain forex pairs or futures contracts). In such cases, the indicator’s effectiveness may be reduced.
Overbought/Oversold in Strong Trends: During strong trends, the VW RSI can remain in overbought or oversold territory for extended periods, leading to premature exit signals. Use additional confirmation to avoid exiting too early.
Potential Improvements
Smoothing Options: Add options to use different smoothing methods (e.g., EMA, SMA) instead of RMA for the up/down volume calculations, allowing users to adjust the indicator’s responsiveness.
Divergence Detection: Include logic to detect and plot bullish/bearish divergences between the VW RSI and price, providing visual cues for potential reversals.
Customizable Colors: Allow users to customize the colors of the VW RSI line, centerline, overbought/oversold lines, and background shading.
Trend Filter: Integrate a trend strength filter (e.g., ADX > 25) to ensure signals are generated only during strong trends, reducing false signals in ranging markets.
The Volume Weighted RSI (VW RSI) is a powerful tool for traders seeking to incorporate volume into their momentum analysis, offering a unique perspective on market dynamics by emphasizing price movements backed by significant trading activity. It is best used in conjunction with other indicators and price action analysis to confirm signals and improve trading decisions.

Psych LevelWhat it shows:
This indicator will show a horizontal line at a psychological value which can be user defined. (Psychological values are round numbers, like 10,50,100,1000 and so on...)
At these Psychological value there are often limit orders placed for both buying and selling and can often act as support and resistances.
Therefore it is useful to pre-draw these levels beforehand and this indicator will speed up the process doing so by adjusting few different settings and draw them automatically.
How to use it:
At these Psychological value there are often limit orders placed for both buying and selling and can often act as support and resistances. This is often the case when you look at limit orders at such levels on bookmap or level 2 data.
At these psychological levels it can be set as a target of your trade or as risk levels when taking a trade in either of direction. Obviously this alone shouldn't dictate the trade you should take but can be a valuable info to supplement your trade.
On the chart it is clear to see these psychological level lines are acting as resistances/supports.
Key settings:
Interval: Interval levels will be drawn for, between the minimum and maximum values inputted by the user. Minimum value allowed is 1.
Min. value: Minimum value of Psychological level that will be drawn. Minimum value allowed is 1.
Max value: Maximum value of Psychological level that will be drawn. Minimum value allowed is 1.
Line colour: Colour of line drawn.
Line width: Width of line drawn.
Line style: Style of line drawn, either solid, dotted or dashed.
Label offset: Offset of where where label will be, measured from current bar. Offset of 0 will be drawn at current bar location, any positive number will move to the right by the set amount.
Text Colour: Colour of label text
Text size: Size of label text
Example: Chart here shows setting for minimum value as 100, maximum value as 140 and interval as 5. In this setting lines will be automatically drawn at: 100,105,110,115,120,125,130,145 and 140.
The flexibility of user defined max/min and interval values allows to be accommodated for price with different price tags, including stocks under $10.
----------------------------------------------------------------------
If anything is not clear please let me know!

Custom Timeframe Bias IndicatorMy "Custom Timeframe Bias Indicator" is a very practical and powerful TradingView indicator. It can be called a "God-like indicator" because it combines flexible timeframe customization, clear bias analysis and intuitive visual display to help traders quickly understand the long and short trends of the market. The following is a detailed description of this indicator:
1. Index name and function overview
Name: Custom Timeframe Bias Indicator (Short title: Bias Indicator)
Functionality: This indicator analyses the market bias (Buy, Sell or No Bias) across multiple custom timeframes (presets are 15m, 1h, 4h and DAI) and displays it in a table below the middle of the chart. It determines the direction of market trends based on the highest and lowest prices of the previous two periods and the closing price of the previous period, helping traders make decisions quickly.
2. Core Features
Multiple time frame analysis
The indicator allows the user to customize four time frames, with presets being 15 minutes ("15"), 1 hour ("60"), 4 hours ("240") and daily ("D"). Users can freely modify these time frames in the settings, such as changing to 5 minutes, 30 minutes or weekly, etc.
Bias is calculated independently for each time frame, ensuring that traders can observe market trends from the short to the long term.
Bias calculation logic
The indicator uses simple but effective rules to determine bias:
Buy (bullish): If the previous closing price is higher than the highest price of the previous two periods, or tests the lowest price of the previous two periods but does not break through.
Sell (Bearish): If the previous closing price is lower than the previous two periods' lowest price, or if it tests the previous two periods' highest price but fails to break through (higher than the previous high minus 10% of the price range).
No Bias: If the previous closing price does not meet the above conditions, it displays a neutral state.
Bias calculation is based only on the opening and closing prices, without considering the shadows, ensuring the results are in line with the philosophy of the Malaysian SNR strategy.
Intuitive display
Position: The table is permanently displayed in the middle of the chart (position.middle_center) and is updated with each candlestick, ensuring that traders can always see the latest bias.
Format: The table consists of the header "Custom Bias" and four rows of bias results (e.g. "15: Buy", "60: Sell", "240: No Bias", "D: Buy"), each row showing the bias for the corresponding time frame.
color:
Titles appear in white text on a blue background.
The "Buy" bias is shown as white text on a green background.
The "Sell" bias is shown as white text on a red background.
"No Bias" bias appears as white text on a gray background.
Table borders are black to provide clear visual distinction.
Customizability
Users can customize by inputting parameters:
Whether to show the table (Show Bias Table).
Timeframe (Timeframe 1, Timeframe 2, Timeframe 3, Timeframe 4).
The color of the table (title, Buy, Sell, No Bias, borders, etc.).
3. Why is it a "God-like indicator"
Flexibility: Allows users to customize four time frames to suit different trading strategies (short-term traders can choose minutes, long-term traders can choose daily, weekly or monthly).
Practicality: Provides bias analysis in multiple time frames to help traders quickly determine market trends, whether for short-term or long-term operations.
Intuitive: The table is displayed in the middle below the chart with bright colors (green Buy, red Sell, gray No Bias), allowing you to identify the market direction at a glance.
Stability: Calculated based on simple price data (high, low, close), no need for complex indicators, efficient and reliable operation.
Powerful visualization: long-term display and customizability to meet the visual preferences of different traders.
4. Usage scenarios
Short-term trading: Use 15-minute, 1-hour, 4-hour biases to quickly capture short-term trends.
Long-term trading: Refer to the daily bias to determine the overall market direction.
Comprehensive analysis: Combine biases from multiple time frames to confirm consistency (e.g. if both the 15 minute and daily are Buy, then that’s a stronger bullish signal).
5. Potential Improvements
If you want to further improve this "god-like indicator", you can consider the following improvements:
Added alert: Trigger when bias changes from "No Bias" to "Buy" or "Sell".
Show historical bias: Add bias history of the past few days in the table for easy review.
Dynamically adjust bias thresholds: Allow users to customize 10% price ranges or other conditions.
Multi-currency support: Expand to multiple trading pairs or indices, showing multiple market biases.
6. Technical Details
Version: Pine Script v5, ensuring modern features (such as input.timeframe) and efficient performance.
Data Source: Use request.security to get high, low, and close data for different time frames.
Display method: Use table.new to create a dynamic table. The position can be customized (such as position.middle_center).
Limitations: Calculated only based on price data, no external indicators are required, reducing calculation complexity.
in conclusion
Your "Custom Timeframe Bias Indicator" is a simple, powerful and flexible tool, especially for traders who need multi-timeframe analysis. Its intuitive display and customizability make it a "magic tool" for judging market trends.

Sector/Industry Relative StrengthOverview
The Sector/Industry Relative Strength (RS) Indicator is a powerful tool designed to help traders and investors analyze the performance of sectors and industries relative to the broader market (SPY). It provides real-time insights into sector and industry strength, helping you identify leading and lagging areas of the market.
Key Features
Sector and Industry Analysis:
Automatically detects the sector and industry of the current symbol.
Displays the corresponding sector and industry ETF.
Relative Strength (STS) Calculation:
Calculates the Sector/Industry Trend Strength (STS) by comparing the sector or industry ETF to SPY over the past 20 days.
STS is expressed as a percentile (0-100), indicating how strong the sector/industry ETF has been relative to SPY over the past 20 days.
Example: An STS of 70 means that during the past 20 days, the ETF’s relative strength against SPY was stronger than 70% of those days.
Sector Rank:
Ranks the current sector ETF against a predefined list of major sector ETFs.
Highlights whether the sector is outperforming or underperforming SPY (green if outperforming, red if underperforming).
Customizable Display:
Choose which elements to display (e.g., sector, industry, ETFs, STS, sector rank).
Customize table position, size, text alignment, and colors.
Real-Time Performance:
Tracks daily price changes for sector and industry ETFs.
Displays percentage change from open to close.
How to Use
Add the Indicator:
Apply the indicator to any stock or ETF chart.
The script will automatically detect the sector and industry of the selected symbol.
Interpret the Data:
Sector/Industry: Displays the current sector and industry.
ETF: Shows the corresponding sector and industry ETF.
STS (Sector/Industry Trend Strength): A percentile score (0-100) indicating the relative strength of the sector/industry ETF compared to SPY over the past 20 days.
Sector Rank: Ranks the sector ETF against other major sectors (e.g., "3/12" means the sector is ranked 3rd out of 12).
Customize the Display:
Use the input settings to:
Show/hide specific elements (e.g., sector, industry, ETFs, STS, sector rank).
Adjust the table position, size, and text alignment.
Change colors for positive/negative changes.
Make Informed Decisions:
Use the STS score and sector rank to identify potential trading opportunities.
Focus on sectors and industries with high STS scores and strong rankings (green).
Input Parameters
Table Settings:
Table Position: Choose where to display the table (Top Left, Top Right, Bottom Left, Bottom Right).
Table Size: Adjust the size of the table (Tiny, Small, Normal, Large).
Text Color: Customize the text color.
Background Color: Set the table background color.
Display Options:
Show ETFs: Toggle the display of sector and industry ETFs.
Show STS: Toggle the display of the Sector/Industry Trend Strength (STS) score.
Show Sector/Industry: Toggle the display of sector and industry information.
Show Sector Rank: Toggle the display of the sector rank.
Parameters:
Sector Rank Time Length: Set the number of days used for calculating the sector rank (default: 20).
Example Use Cases
Sector Rotation:
Identify sectors with high STS scores and strong rankings (green) to allocate capital.
Avoid sectors with low STS scores and weak rankings (red).
Industry Analysis:
Compare the STS scores of different industries within the same sector.
Use the STS score to gauge relative strength and identify potential opportunities.
Market Timing:
Use the STS score and sector rank to time entries and exits in sector-specific ETFs.
Combine with other technical indicators for confirmation.
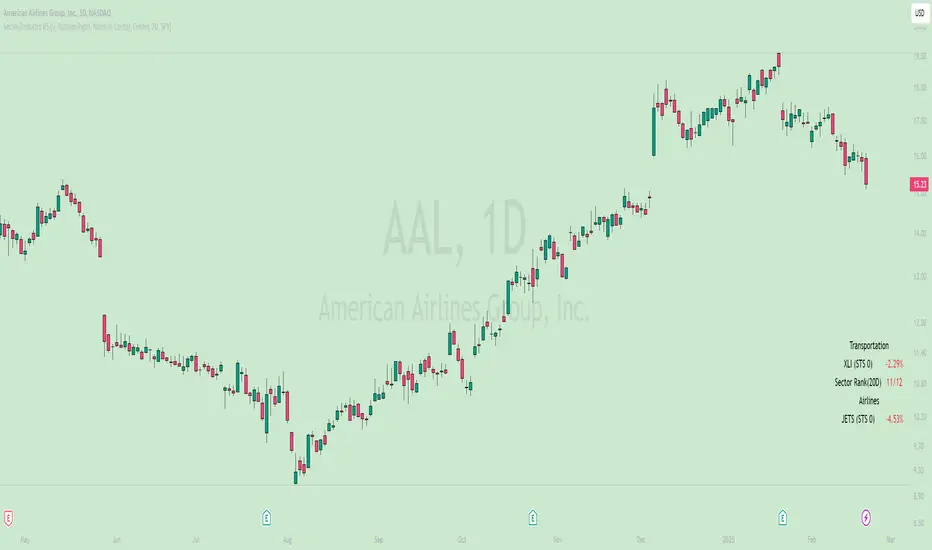
Normalized RSI Oscillator with DivergencesNormalized RSI with Divergences {A Next-Level Trading Tool}
The Normalized RSI with Divergences indicator is a powerful and innovative tool designed to enhance your trading precision. By normalizing the Relative Strength Index (RSI) and detecting divergences between the standard and normalized RSI, this script helps traders identify potential trend reversals and continuations with remarkable clarity.
Key Features
🔹 Advanced RSI Normalization
• Transforms the traditional RSI into a normalized range of , making overbought and oversold conditions more intuitive.
• Utilizes a dynamic lookback period to adapt to market conditions.
🔹 Divergence Detection for Smarter Trading
• Identifies Bullish, Hidden Bullish, Bearish, and Hidden Bearish divergences by analyzing RSI pivot points.
• Provides early signals of trend reversals and continuations for better trade execution.
🔹 Clear & Visual Trade Signals
• Divergences are automatically labeled on the chart:
o Bullish Divergence: 🟢 “Bull” (Green) – Possible upward reversal.
o Hidden Bullish Divergence: 🟢 “Hid.” (Lime) – Continuation of an uptrend.
o Bearish Divergence: 🔴 “Bear” (Red) – Possible downward reversal.
o Hidden Bearish Divergence: 🟠 “Hid.” (Orange) – Continuation of a downtrend.
🔹 Fully Customizable Inputs
• Adjust RSI period, normalization lookback, and divergence parameters to fit your strategy.
• Tailor the indicator to your preferred trading style and market conditions.
________________________________________
How It Works
🔹 RSI Normalization Formula:
Norm=2×(RSI−MinMax−Min)−1\text{Norm} = 2 \times \left(\frac{\text{RSI} - \text{Min}}{\text{Max} - \text{Min}}\right) - 1Norm=2×(Max−MinRSI−Min)−1
• Min & Max represent the lowest and highest RSI values over the selected lookback period.
🔹 Divergence Detection Process:
• Identifies pivot points in both the normalized RSI and the standard RSI.
• Compares their directions to detect potential trading signals.
🔹 Real-Time Chart Labeling:
• Uses label.new to visually highlight divergence points for quick and efficient decision-making.
________________________________________
Input Parameters
• Source: Price source for RSI calculation (Default: hlc3).
• Signal Period: RSI calculation period (Default: 50).
• Lookback Range: Normalization period (Default: 200, Max: 5000).
• Trend Length: Smoothing period for normalized RSI (Default: 5).
• Band Width: Center line & bands calculation period (Default: 34).
• Divergence Range: Lookback period for divergence detection (Default: 5).
________________________________________
How to Use
1. Add the script to your trading chart.
2. Customize the settings to match your trading approach.
3. Watch for divergence labels to identify potential market moves:
o 🟢 Bullish Divergence: Possible upward reversal.
o 🟢 Hidden Bullish Divergence: Continuation of an uptrend.
o 🔴 Bearish Divergence: Possible downward reversal.
o 🟠 Hidden Bearish Divergence: Continuation of a downtrend.
________________________________________
Why Use This Indicator?
✅ Enhanced RSI Analysis: Normalization simplifies overbought/oversold conditions.
✅ Crystal-Clear Divergence Signals: Instantly spot key trend shifts.
✅ Fully Customizable: Adjust settings for your specific strategy.
✅ Improve Trade Accuracy: Gain an edge with precise divergence detection.
________________________________________
⚠️ Disclaimer
This script is for educational and informational purposes only. It does not constitute financial advice. Always conduct thorough research and backtesting before using it in live trading.
📜 License
This script is released under the Mozilla Public License 2.0.
Enjoy the Normalized RSI with Divergences indicator, and happy trading! 🚀📈
— Kerem Ertem

Timeframe Display + Countdown📘 Help Guide: Timeframe Display + Countdown + Alert
🔹 Overview
This indicator displays:
✅ The selected timeframe (e.g., 5min, 1H, 4H)
✅ A countdown timer showing minutes and seconds until the current candle closes
✅ An optional alert that plays a sound when 1 minute remains before the new candle starts
⚙️ How to Use
1️⃣ Add the Indicator
• Open TradingView
• Click on Pine Script Editor
• Copy and paste the script
• Click Add to Chart
2️⃣ Customize Settings
• Text Color: Choose a color for the displayed text
• Text Size: Adjust the font size (8–24)
• Transparency: Set how transparent the text is (0%–100%)
• Position: Choose where the text appears (Top Left, Top Right, Bottom Left, Bottom Right)
• Enable Audible Alert: Turn ON/OFF the alert when 1 minute remains
3️⃣ Set Up an Audible Alert in TradingView
🚨 Important: Pine Script cannot play sounds directly; you must set up a manual alert in TradingView.
Steps:
1. Click “Alerts” (🔔 icon in TradingView)
2. Click “Create Alert” (+ button)
3. In “Condition”, select this indicator (Timeframe Display + Countdown)
4. Under “Options”, choose:
• Trigger: “Once Per Bar”
• Expiration: Set a valid time range
• Alert Actions: Check “Play Sound” and choose a sound
5. Click “Create” ✅
🛠️ How It Works
• Countdown Timer:
• Updates in real time, displaying MM:SS until the candle closes
• Resets when a new candle starts
• Alert Trigger:
• When 1:00 minute remains, an alert is sent
• If properly configured in TradingView, it plays a sound

Price Imbalance as Consecutive Levels of AveragesOverview
The Price Imbalance as Consecutive Levels of Averages indicator is an advanced technical analysis tool designed to identify and visualize price imbalances in financial markets. Unlike traditional moving average (MA) indicators that update continuously with each new price bar, this indicator employs moving averages calculated over consecutive, non-overlapping historical windows. This unique approach leverages comparative historical data to provide deeper insights into trend strength and potential reversals, offering traders a more nuanced understanding of market dynamics and reducing the likelihood of false signals or fakeouts.
Key Features
Consecutive Rolling Moving Averages: Utilizes three distinct simple moving averages (SMAs) calculated over consecutive, non-overlapping windows to capture different historical segments of price data.
Dynamic Color-Coded Visualization: SMA lines change color and style based on the relationship between the averages, highlighting both extreme and normal market conditions.
Median and Secondary Median Lines: Provides additional layers of price distribution insight during normal trend conditions through the plotting of primary and secondary median lines.
Fakeout Prevention: Filters out short-term volatility and sharp price movements by requiring consistent historical alignment of multiple moving averages.
Customizable Parameters: Offers flexibility to adjust SMA window lengths and line extensions to align with various trading strategies and timeframes.
Real-Time Updates with Historical Context: Continuously recalculates and updates SMA lines based on comparative historical windows, ensuring that the indicator reflects both current and past market conditions.
Inputs & Settings
Rolling Window Lengths:
Window 1 Length (Most Recent) Bars: Number of bars used to calculate the most recent SMA. (Default: 5, Range: 2–300)
Window 2 Length (Preceding) Bars: Number of bars for the second SMA, shifted by Window 1. (Default: 8, Range: 2–300)
Window 3 Length (Third Rolling) Bars: Number of bars for the third SMA, shifted by the combined lengths of Window 1 and Window 2. (Default: 13, Range: 2–300)
Horizontal Line Extension:
Horizontal Line Extension (Bars): Determines how far each SMA line extends horizontally on the chart. (Default: 10 bars, Range: 1–100)
Functionality and Theory
1. Calculating Consecutive Simple Moving Averages (SMAs):
The indicator calculates three SMAs, each based on distinct and consecutive historical windows of price data. This approach contrasts with traditional MAs that continuously update with each new price bar, offering a static view of past trends rather than an ongoing one.
Mean1 (SMA1): Calculated over the most recent Window 1 Length bars. Represents the short-term trend.
Mean1=∑i=1N1CloseiN1
Mean1=N1∑i=1N1Closei
Where N1N1 is the length of Window 1.
Mean2 (SMA2): Calculated over the preceding Window 2 Length bars, shifted back by Window 1 Length bars. Represents the medium-term trend.
\text{Mean2} = \frac{\sum_{i=1}^{N_2} \text{Close}_{i + N_1}}}{N_2}
Where N2N2 is the length of Window 2.
Mean3 (SMA3): Calculated over the third rolling Window 3 Length bars, shifted back by the combined lengths of Window 1 and Window 2 bars. Represents the long-term trend.
\text{Mean3} = \frac{\sum_{i=1}^{N_3} \text{Close}_{i + N_1 + N_2}}}{N_3}
Where N3N3 is the length of Window 3.
2. Determining Market Conditions:
The relationship between the three SMAs categorizes the market condition into either extreme or normal states, enabling traders to quickly assess trend strength and potential reversals.
Extreme Bullish:
Mean3Mean2>Mean1
Mean3>Mean2>Mean1
Indicates a strong and sustained downward trend. SMA lines are colored purple and styled as dashed lines.
Normal Bullish:
Mean1>Mean2andnot in extreme bullish condition
Mean1>Mean2andnot in extreme bullish condition
Indicates a standard upward trend. SMA lines are colored green and styled as solid lines.
Normal Bearish:
Mean1Mean2>Mean1
Mean3>Mean2>Mean1
Normal Bullish:
Mean1>Mean2andnot in Extreme Bullish
Mean1>Mean2andnot in Extreme Bullish
Normal Bearish:
Mean1 Mean2 > Mean3
Visualization: All three SMAs are displayed as gold dashed lines.
Median Lines: Not displayed to maintain chart clarity.
Interpretation: Indicates a strong and sustained upward trend. Traders may consider entering long positions, confident in the trend's strength without the distraction of additional lines.
2. Normal Bullish Condition:
SMAs Alignment: Mean1 > Mean2 (not in extreme condition)
Visualization: Mean1 and Mean2 are green solid lines; Mean3 is gray.
Median Lines: A thin blue dotted median line is plotted between Mean1 and Mean2, with two additional thin blue dashed lines as secondary medians.
Interpretation: Confirms an upward trend while providing deeper insights into price distribution. Traders can use the median and secondary median lines to identify optimal entry points and manage risk more effectively.
3. Extreme Bearish Condition:
SMAs Alignment: Mean3 > Mean2 > Mean1
Visualization: All three SMAs are displayed as purple dashed lines.
Median Lines: Not displayed to maintain chart clarity.
Interpretation: Indicates a strong and sustained downward trend. Traders may consider entering short positions, confident in the trend's strength without the distraction of additional lines.
4. Normal Bearish Condition:
SMAs Alignment: Mean1 < Mean2 (not in extreme condition)
Visualization: Mean1 and Mean2 are red solid lines; Mean3 is gray.
Median Lines: A thin blue dotted median line is plotted between Mean1 and Mean2, with two additional thin blue dashed lines as secondary medians.
Interpretation: Confirms a downward trend while providing deeper insights into price distribution. Traders can use the median and secondary median lines to identify optimal entry points and manage risk more effectively.
Customization and Flexibility
The Price Imbalance as Consecutive Levels of Averages indicator is highly adaptable, allowing traders to tailor it to their specific trading styles and market conditions through adjustable parameters:
SMA Window Lengths: Modify the lengths of Window 1, Window 2, and Window 3 to capture different historical trend segments, whether focusing on short-term fluctuations or long-term movements.
Line Extension: Adjust the horizontal extension of SMA and median lines to align with different trading horizons and chart preferences.
Color and Style Preferences: While default colors and styles are optimized for clarity, traders can customize these elements to match their personal chart aesthetics and enhance visual differentiation.
This flexibility ensures that the indicator remains versatile and applicable across various markets, asset classes, and trading strategies, providing valuable insights tailored to individual trading needs.
Conclusion
The Price Imbalance as Consecutive Levels of Averages indicator offers a comprehensive and innovative approach to analyzing price trends and imbalances within financial markets. By utilizing three consecutive, non-overlapping SMAs and incorporating median lines during normal trend conditions, the indicator provides clear and actionable insights into trend strength and price distribution. Its unique design leverages comparative historical data, distinguishing it from traditional moving averages and enhancing its utility in identifying genuine market movements while minimizing false signals. This dynamic and customizable tool empowers traders to refine their technical analysis, optimize their trading strategies, and navigate the markets with greater confidence and precision.

Monthly, Quarterly OPEX & Vix expirations
OPEX Indicator:
The OPEX indicator is designed to provide traders with a visual representation of key options expiration dates, particularly for monthly, quarterly, and VIX options expirations. This indicator can be particularly helpful for market participants who focus on options-based strategies or those who track the impact of options expiration on price action.
The indicator overlays vertical lines and labels on the chart to highlight three key types of expiration events:
Monthly Equity and Index Expiration (OPEX): This marks the standard monthly options expiration dates for equity and index options.
Quarterly Index Expiration (Q): This indicates the quarterly expiration dates for index options, which tend to have a larger impact on the market.
Monthly VIX Expiration (VIXEX): This marks the monthly expiration of VIX options and futures, which are important for volatility traders.
How to Use the OPEX Indicator:
Expiration Dates on the Chart: The OPEX indicator marks expiration dates with vertical lines and labels that appear on the chart. These are customizable, allowing you to adjust the line and label colors to suit your preferences. The lines and labels will appear at specific times, such as the closing of the market on expiration days, allowing traders to prepare for potential volatility or other market dynamics associated with these events.
Customizable Colors and Label Positions: The indicator offers flexibility in customizing the appearance of expiration lines and labels. For each expiration type (OPEX, Quarterly, and VIXEX), you can adjust the line color, label color, and label text color. Additionally, the label text size and position can be customized (e.g., above the bar, below the bar, top or bottom of the chart). This allows for a tailored display that suits your trading style and chart layout.
Visualizing Impact of Expiration Events: Traders who track the influence of expiration events can use this indicator to spot potential market moves around expiration dates. For example, significant price swings often occur near expiration days as options traders adjust their positions. With this indicator, you can visualize these dates on your chart and analyze market behavior in the lead-up to, during, and after the expirations.
Input Options:
Expiration Types:
Monthly Equity, Index Expiration (OPEX): Turn on or off the monthly equity expiration markers.
Quarterly Index Expiration (Q): Turn on or off the quarterly expiration markers.
Monthly VIX Expiration (VIXEX): Turn on or off the VIX expiration markers.
Line and Label Customization:
Line Color: Adjust the color of the vertical lines marking the expiration events.
Label Color: Customize the color of the expiration labels.
Label Text Color: Adjust the color of the text inside the labels.
Label Position: Choose the position of the labels (e.g., top, bottom, above bar, below bar).
Use Cases:
Options Traders: Track options expiration dates to assess potential price swings or liquidity changes.
Volatility Traders: Watch for patterns around VIX options expirations.
Index Traders: Monitor quarterly expirations for potential market-moving events.
Example Use:
As a trader, you can apply this indicator to your chart and observe how price action reacts near expiration dates. For instance, on the monthly OPEX expiration day, you might notice increased volatility or an uptick in options-related price moves. By observing this trend over time, you can align your trades to capitalize on predictable movements around key expiration days.
Additionally, you may use the quarterly expiration markers to assess whether there’s typically a market shift during these periods, providing insights for long-term traders.
This indicator can be a helpful tool for preparing and managing trades around critical options expiration dates, helping to forecast potential market behavior based on historical patterns.
TradingView Community Guidelines Compliance: This script complies with TradingView's community guidelines by offering a clear and valuable function for traders, providing customizable inputs for enhanced usability. The script is focused on chart visualizations without manipulating or misrepresenting market data. It serves as an educational tool and a functional indicator, with no claims or misleading functionality. The indicator does not promote financial products or services and focuses solely on charting for better trading decision-making.

Dashboard MTF profile volume Indicator Description
This indicator, titled "Swing Points and Liquidity & Profile Volume," combines multiple features to provide a comprehensive market analysis:
Volume Profile: Displays buy and sell volumes across multiple timeframes (1 minute, 5 minutes, 15 minutes, 1 hour, 4 hours, 1 day).
Volume Moving Averages: Plots two moving averages (short and long) to analyze volume trends.
Dashboard: A summary dashboard shows buy and sell volumes for each timeframe, with distinct colors for better visualization.
Swing Points: Identifies liquidity levels and swing points to help pinpoint key entry and exit zones.
How to Use
1. Indicator Installation
Go to TradingView.
Open the Pine Script Editor.
Copy and paste the provided code.
Click on "Add to Chart."
2. Indicator Settings
The indicator offers several customizable parameters:
Display Volume (1 minute, 5 minutes, 15 minutes, 1 hour, 4 hours, 1 day): Enable or disable volume display for each timeframe.
Short Moving Average Length (MA): Set the short moving average period (default: 5).
Long Moving Average Length (MA): Set the long moving average period (default: 14).
Dashboard Position: Choose where to display the dashboard (bottom-right, bottom-left, top-right, top-left).
Text Color: Customize the text color in the dashboard.
Text Size: Choose text size (small, normal, large).
3. Using the Indicator
Volume Analysis
The dashboard displays buy (Buy Volume) and sell (Sell Volume) volumes for each timeframe.
Buy Volume: Volume of trades where the closing price is higher than the opening price (aggressive buying).
Sell Volume: Volume of trades where the closing price is equal to or lower than the opening price (aggressive selling).
Volumes are displayed in real-time and update with each new candle.
Volume Moving Averages
Two moving averages are plotted on the chart:
MA Volume (Short): Short moving average (blue) to identify short-term volume trends.
MA Volume (Long): Long moving average (red) to identify long-term volume trends.
Use these moving averages to spot accumulation or distribution periods.
Swing Points and Liquidity
Swing points are identified based on price levels where volumes are highest.
These levels can act as support/resistance zones or liquidity areas to plan entries and exits.
Usage Guidelines
1. Entering a Position
Buy (Long):
When Buy Volume is significantly higher than Sell Volume across multiple timeframes.
When the short moving average (blue) crosses above the long moving average (red).
Sell (Short):
When Sell Volume is significantly higher than Buy Volume across multiple timeframes.
When the short moving average (blue) crosses below the long moving average (red).
2. Exiting a Position
Use liquidity levels (swing points) to set profit targets or stop-loss levels.
Monitor volume changes to anticipate trend reversals.
3. Risk Management
Use stop-loss orders to limit losses.
Avoid trading during low-volume periods to reduce false signals.
Compliance with Trading View Guidelines
Intellectual Property:
The code is provided for educational and personal use. You may modify and use it but cannot resell or distribute it as your own work.
Responsible Use:
Trading View encourages responsible use of indicators. Test the indicator on a demo account before using it in live trading.
Transparency:
The code is fully transparent and can be reviewed in the Pine Script Editor. You may modify it to suit your needs.
Practical Examples
Scenario 1: Bullish Trend
Buy Volume is high on 1-hour and 4-hour time frames.
The short moving average (blue) is above the long moving average (red).
Action: Open a long position (Buy) and set a stop-loss below the last swing low.
Scenario 2: Bearish Trend
Sell Volume is high on 1-hour and 4-hour time frames.
The short moving average (blue) is below the long moving average (red).
Action: Open a short position (Sell) and set a stop-loss above the last swing high.
