Multi-Timeframe Stochastic Alert [tradeviZion]# Multi-Timeframe Stochastic Alert : Complete User Guide
## 1. Introduction
### What is the Multi-Timeframe Stochastic Alert?
The Multi-Timeframe Stochastic Alert is an advanced technical analysis tool that helps traders identify potential trading opportunities by analyzing momentum across multiple timeframes. It combines the power of the stochastic oscillator with multi-timeframe analysis to provide more reliable trading signals.
### Key Features and Benefits
- Simultaneous analysis of 6 different timeframes
- Advanced alert system with customizable conditions
- Real-time visual feedback with color-coded signals
- Comprehensive data table with instant market insights
- Motivational trading messages for psychological support
- Flexible theme support for comfortable viewing
### How it Can Help Your Trading
- Identify stronger trends by confirming momentum across multiple timeframes
- Reduce false signals through multi-timeframe confirmation
- Stay informed of market changes with customizable alerts
- Make more informed decisions with comprehensive market data
- Maintain trading discipline with clear visual signals
## 2. Understanding the Display
### The Stochastic Chart
The main chart displays three key components:
1. ** K-Line (Fast) **: The primary stochastic line (default color: green)
2. ** D-Line (Slow) **: The signal line (default color: red)
3. ** Reference Lines **:
- Overbought Level (80): Upper dashed line
- Middle Line (50): Center dashed line
- Oversold Level (20): Lower dashed line
### The Information Table
The table provides a comprehensive view of stochastic readings across all timeframes. Here's what each column means:
#### Column Explanations:
1. ** Timeframe **
- Shows the time period for each row
- Example: "5" = 5 minutes, "15" = 15 minutes, etc.
2. ** K Value **
- The fast stochastic line value (0-100)
- Higher values indicate stronger upward momentum
- Lower values indicate stronger downward momentum
3. ** D Value **
- The slow stochastic line value (0-100)
- Helps confirm momentum direction
- Crossovers with K-line can signal potential trades
4. ** Status **
- Shows current momentum with symbols:
- ▲ = Increasing (bullish)
- ▼ = Decreasing (bearish)
- Color matches the trend direction
5. ** Trend **
- Shows the current market condition:
- "Overbought" (above 80)
- "Bullish" (above 50)
- "Bearish" (below 50)
- "Oversold" (below 20)
#### Row Explanations:
1. ** Title Row **
- Shows "🎯 Multi-Timeframe Stochastic"
- Indicates the indicator is active
2. ** Header Row **
- Contains column titles
- Dark blue background for easy reading
3. ** Timeframe Rows **
- Six rows showing different timeframe analyses
- Each row updates independently
- Color-coded for easy trend identification
4. **Message Row**
- Shows rotating motivational messages
- Updates every 5 bars
- Helps maintain trading discipline
### Visual Indicators and Colors
- ** Green Background **: Indicates bullish conditions
- ** Red Background **: Indicates bearish conditions
- ** Color Intensity **: Shows strength of the signal
- ** Background Highlights **: Appear when alert conditions are met
## 3. Core Settings Groups
### Stochastic Settings
These settings control the core calculation of the stochastic oscillator.
1. ** Length (Default: 14) **
- What it does: Determines the lookback period for calculations
- Higher values (e.g., 21): More stable, fewer signals
- Lower values (e.g., 8): More sensitive, more signals
- Recommended:
* Day Trading: 8-14
* Swing Trading: 14-21
* Position Trading: 21-30
2. ** Smooth K (Default: 3) **
- What it does: Smooths the main stochastic line
- Higher values: Smoother line, fewer false signals
- Lower values: More responsive, but more noise
- Recommended:
* Day Trading: 2-3
* Swing Trading: 3-5
* Position Trading: 5-7
3. ** Smooth D (Default: 3) **
- What it does: Smooths the signal line
- Works in conjunction with Smooth K
- Usually kept equal to or slightly higher than Smooth K
- Recommended: Keep same as Smooth K for consistency
4. ** Source (Default: Close) **
- What it does: Determines price data for calculations
- Options: Close, Open, High, Low, HL2, HLC3, OHLC4
- Recommended: Stick with Close for most reliable signals
### Timeframe Settings
Controls the multiple timeframes analyzed by the indicator.
1. ** Main Timeframes (TF1-TF6) **
- TF1 (Default: 10): Shortest timeframe for quick signals
- TF2 (Default: 15): Short-term trend confirmation
- TF3 (Default: 30): Medium-term trend analysis
- TF4 (Default: 30): Additional medium-term confirmation
- TF5 (Default: 60): Longer-term trend analysis
- TF6 (Default: 240): Major trend confirmation
Recommended Combinations:
* Scalping: 1, 3, 5, 15, 30, 60
* Day Trading: 5, 15, 30, 60, 240, D
* Swing Trading: 15, 60, 240, D, W, M
2. ** Wait for Bar Close (Default: true) **
- What it does: Controls when calculations update
- True: More reliable but slightly delayed signals
- False: Faster signals but may change before bar closes
- Recommended: Keep True for more reliable signals
### Alert Settings
#### Main Alert Settings
1. ** Enable Alerts (Default: true) **
- Master switch for all alert notifications
- Toggle this off when you don't want any alerts
- Useful during testing or when you want to focus on visual signals only
2. ** Alert Condition (Options) **
- "Above Middle": Bullish momentum alerts only
- "Below Middle": Bearish momentum alerts only
- "Both": Alerts for both directions
- Recommended:
* Trending Markets: Choose direction matching the trend
* Ranging Markets: Use "Both" to catch reversals
* New Traders: Start with "Both" until you develop a specific strategy
3. ** Alert Frequency **
- "Once Per Bar": Immediate alerts during the bar
- "Once Per Bar Close": Alerts only after bar closes
- Recommended:
* Day Trading: "Once Per Bar" for quick reactions
* Swing Trading: "Once Per Bar Close" for confirmed signals
* Beginners: "Once Per Bar Close" to reduce false signals
#### Timeframe Check Settings
1. ** First Check (TF1) **
- Purpose: Confirms basic trend direction
- Alert Triggers When:
* For Bullish: Stochastic is above middle line (50)
* For Bearish: Stochastic is below middle line (50)
* For Both: Triggers in either direction based on position relative to middle line
- Settings:
* Enable/Disable: Turn first check on/off
* Timeframe: Default 5 minutes
- Best Used For:
* Quick trend confirmation
* Entry timing
* Scalping setups
2. ** Second Check (TF2) **
- Purpose: Confirms both position and momentum
- Alert Triggers When:
* For Bullish: Stochastic is above middle line AND both K&D lines are increasing
* For Bearish: Stochastic is below middle line AND both K&D lines are decreasing
* For Both: Triggers based on position and direction matching current condition
- Settings:
* Enable/Disable: Turn second check on/off
* Timeframe: Default 15 minutes
- Best Used For:
* Trend strength confirmation
* Avoiding false breakouts
* Day trading setups
3. ** Third Check (TF3) **
- Purpose: Confirms overall momentum direction
- Alert Triggers When:
* For Bullish: Both K&D lines are increasing (momentum confirmation)
* For Bearish: Both K&D lines are decreasing (momentum confirmation)
* For Both: Triggers based on matching momentum direction
- Settings:
* Enable/Disable: Turn third check on/off
* Timeframe: Default 30 minutes
- Best Used For:
* Major trend confirmation
* Swing trading setups
* Avoiding trades against the main trend
Note: All three conditions must be met simultaneously for the alert to trigger. This multi-timeframe confirmation helps reduce false signals and provides stronger trade setups.
#### Alert Combinations Examples
1. ** Conservative Setup **
- Enable all three checks
- Use "Once Per Bar Close"
- Timeframe Selection Example:
* First Check: 15 minutes
* Second Check: 1 hour (60 minutes)
* Third Check: 4 hours (240 minutes)
- Wider gaps between timeframes reduce noise and false signals
- Best for: Swing trading, beginners
2. ** Aggressive Setup **
- Enable first two checks only
- Use "Once Per Bar"
- Timeframe Selection Example:
* First Check: 5 minutes
* Second Check: 15 minutes
- Closer timeframes for quicker signals
- Best for: Day trading, experienced traders
3. ** Balanced Setup **
- Enable all checks
- Use "Once Per Bar"
- Timeframe Selection Example:
* First Check: 5 minutes
* Second Check: 15 minutes
* Third Check: 1 hour (60 minutes)
- Balanced spacing between timeframes
- Best for: All-around trading
### Visual Settings
#### Alert Visual Settings
1. ** Show Background Color (Default: true) **
- What it does: Highlights chart background when alerts trigger
- Benefits:
* Makes signals more visible
* Helps spot opportunities quickly
* Provides visual confirmation of alerts
- When to disable:
* If using multiple indicators
* When preferring a cleaner chart
* During manual backtesting
2. ** Background Transparency (Default: 90) **
- Range: 0 (solid) to 100 (invisible)
- Recommended Settings:
* Clean Charts: 90-95
* Multiple Indicators: 85-90
* Single Indicator: 80-85
- Tip: Adjust based on your chart's overall visibility
3. ** Background Colors **
- Bullish Background:
* Default: Green
* Indicates upward momentum
* Customizable to match your theme
- Bearish Background:
* Default: Red
* Indicates downward momentum
* Customizable to match your theme
#### Level Settings
1. ** Oversold Level (Default: 20) **
- Traditional Setting: 20
- Adjustable Range: 0-100
- Usage:
* Lower values (e.g., 10): More conservative
* Higher values (e.g., 30): More aggressive
- Trading Applications:
* Potential bullish reversal zone
* Support level in uptrends
* Entry point for long positions
2. ** Overbought Level (Default: 80) **
- Traditional Setting: 80
- Adjustable Range: 0-100
- Usage:
* Lower values (e.g., 70): More aggressive
* Higher values (e.g., 90): More conservative
- Trading Applications:
* Potential bearish reversal zone
* Resistance level in downtrends
* Exit point for long positions
3. ** Middle Line (Default: 50) **
- Purpose: Trend direction separator
- Applications:
* Above 50: Bullish territory
* Below 50: Bearish territory
* Crossing 50: Potential trend change
- Trading Uses:
* Trend confirmation
* Entry/exit trigger
* Risk management level
#### Color Settings
1. ** Bullish Color (Default: Green) **
- Used for:
* K-Line (Main stochastic line)
* Status symbols when trending up
* Trend labels for bullish conditions
- Customization:
* Choose colors that stand out
* Match your trading platform theme
* Consider color blindness accessibility
2. ** Bearish Color (Default: Red) **
- Used for:
* D-Line (Signal line)
* Status symbols when trending down
* Trend labels for bearish conditions
- Customization:
* Choose contrasting colors
* Ensure visibility on your chart
* Consider monitor settings
3. ** Neutral Color (Default: Gray) **
- Used for:
* Middle line (50 level)
- Customization:
* Should be less prominent
* Easy on the eyes
* Good background contrast
### Theme Settings
1. **Color Theme Options**
- Dark Theme (Default):
* Dark background with white text
* Optimized for dark chart backgrounds
* Reduces eye strain in low light
- Light Theme:
* Light background with black text
* Better visibility in bright conditions
- Custom Theme:
* Use your own color preferences
2. ** Available Theme Colors **
- Table Background
- Table Text
- Table Headers
Note: The theme affects only the table display colors. The stochastic lines and alert backgrounds use their own color settings.
### Table Settings
#### Position and Size
1. ** Table Position **
- Options:
* Top Right (Default)
* Middle Right
* Bottom Right
* Top Left
* Middle Left
* Bottom Left
- Considerations:
* Chart space utilization
* Personal preference
* Multiple monitor setups
2. ** Text Sizes **
- Title Size Options:
* Tiny: Minimal space usage
* Small: Compact but readable
* Normal (Default): Standard visibility
* Large: Enhanced readability
* Huge: Maximum visibility
- Data Size Options:
* Recommended: One size smaller than title
* Adjust based on screen resolution
* Consider viewing distance
3. ** Empowering Messages **
- Purpose:
* Maintain trading discipline
* Provide psychological support
* Remind of best practices
- Rotation:
* Changes every 5 bars
* Categories include:
- Market Wisdom
- Strategy & Discipline
- Mindset & Growth
- Technical Mastery
- Market Philosophy
## 4. Setting Up for Different Trading Styles
### Day Trading Setup
1. **Timeframes**
- Primary: 5, 15, 30 minutes
- Secondary: 1H, 4H
- Alert Settings: "Once Per Bar"
2. ** Stochastic Settings **
- Length: 8-14
- Smooth K/D: 2-3
- Alert Condition: Match market trend
3. ** Visual Settings **
- Background: Enabled
- Transparency: 85-90
- Theme: Based on trading hours
### Swing Trading Setup
1. ** Timeframes **
- Primary: 1H, 4H, Daily
- Secondary: Weekly
- Alert Settings: "Once Per Bar Close"
2. ** Stochastic Settings **
- Length: 14-21
- Smooth K/D: 3-5
- Alert Condition: "Both"
3. ** Visual Settings **
- Background: Optional
- Transparency: 90-95
- Theme: Personal preference
### Position Trading Setup
1. ** Timeframes **
- Primary: Daily, Weekly
- Secondary: Monthly
- Alert Settings: "Once Per Bar Close"
2. ** Stochastic Settings **
- Length: 21-30
- Smooth K/D: 5-7
- Alert Condition: "Both"
3. ** Visual Settings **
- Background: Disabled
- Focus on table data
- Theme: High contrast
## 5. Troubleshooting Guide
### Common Issues and Solutions
1. ** Too Many Alerts **
- Cause: Settings too sensitive
- Solutions:
* Increase timeframe intervals
* Use "Once Per Bar Close"
* Enable fewer timeframe checks
* Adjust stochastic length higher
2. ** Missed Signals **
- Cause: Settings too conservative
- Solutions:
* Decrease timeframe intervals
* Use "Once Per Bar"
* Enable more timeframe checks
* Adjust stochastic length lower
3. ** False Signals **
- Cause: Insufficient confirmation
- Solutions:
* Enable all three timeframe checks
* Use larger timeframe gaps
* Wait for bar close
* Confirm with price action
4. ** Visual Clarity Issues **
- Cause: Poor contrast or overlap
- Solutions:
* Adjust transparency
* Change theme settings
* Reposition table
* Modify color scheme
### Best Practices
1. ** Getting Started **
- Start with default settings
- Use "Both" alert condition
- Enable all timeframe checks
- Wait for bar close
- Monitor for a few days
2. ** Fine-Tuning **
- Adjust one setting at a time
- Document changes and results
- Test in different market conditions
- Find your optimal timeframe combination
- Balance sensitivity with reliability
3. ** Risk Management **
- Don't trade against major trends
- Confirm signals with price action
- Use appropriate position sizing
- Set clear stop losses
- Follow your trading plan
4. ** Regular Maintenance **
- Review settings weekly
- Adjust for market conditions
- Update color scheme for visibility
- Clean up chart regularly
- Maintain trading journal
## 6. Tips for Success
1. ** Entry Strategies **
- Wait for all timeframes to align
- Confirm with price action
- Use proper position sizing
- Consider market conditions
2. ** Exit Strategies **
- Trail stops using indicator levels
- Take partial profits at targets
- Honor your stop losses
- Don't fight the trend
3. ** Psychology **
- Stay disciplined with settings
- Don't override system signals
- Keep emotions in check
- Learn from each trade
4. ** Continuous Improvement **
- Record your trades
- Review performance regularly
- Adjust settings gradually
- Stay educated on markets
Search in scripts for "text"

Ensemble Alerts█ OVERVIEW
This indicator creates highly customizable alert conditions and messages by combining several technical conditions into groups , which users can specify directly from the "Settings/Inputs" tab. It offers a flexible framework for building and testing complex alert conditions without requiring code modifications for each adjustment.
█ CONCEPTS
Ensemble analysis
Ensemble analysis is a form of data analysis that combines several "weaker" models to produce a potentially more robust model. In a trading context, one of the most prevalent forms of ensemble analysis is the aggregation (grouping) of several indicators to derive market insights and reinforce trading decisions. With this analysis, traders typically inspect multiple indicators, signaling trade actions when specific conditions or groups of conditions align.
Simplifying ensemble creation
Combining indicators into one or more ensembles can be challenging, especially for users without programming knowledge. It usually involves writing custom scripts to aggregate the indicators and trigger trading alerts based on the confluence of specific conditions. Making such scripts customizable via inputs poses an additional challenge, as it often involves complicated input menus and conditional logic.
This indicator addresses these challenges by providing a simple, flexible input menu where users can easily define alert criteria by listing groups of conditions from various technical indicators in simple text boxes . With this script, you can create complex alert conditions intuitively from the "Settings/Inputs" tab without ever writing or modifying a single line of code. This framework makes advanced alert setups more accessible to non-coders. Additionally, it can help Pine programmers save time and effort when testing various condition combinations.
█ FEATURES
Configurable alert direction
The "Direction" dropdown at the top of the "Settings/Inputs" tab specifies the allowed direction for the alert conditions. There are four possible options:
• Up only : The indicator only evaluates upward conditions.
• Down only : The indicator only evaluates downward conditions.
• Up and down (default): The indicator evaluates upward and downward conditions, creating alert triggers for both.
• Alternating : The indicator prevents alert triggers for consecutive conditions in the same direction. An upward condition must be the first occurrence after a downward condition to trigger an alert, and vice versa for downward conditions.
Flexible condition groups
This script features six text inputs where users can define distinct condition groups (ensembles) for their alerts. An alert trigger occurs if all the conditions in at least one group occur.
Each input accepts a comma-separated list of numbers with optional spaces (e.g., "1, 4, 8"). Each listed number, from 1 to 35, corresponds to a specific individual condition. Below are the conditions that the numbers represent:
1 — RSI above/below threshold
2 — RSI below/above threshold
3 — Stoch above/below threshold
4 — Stoch below/above threshold
5 — Stoch K over/under D
6 — Stoch K under/over D
7 — AO above/below threshold
8 — AO below/above threshold
9 — AO rising/falling
10 — AO falling/rising
11 — Supertrend up/down
12 — Supertrend down/up
13 — Close above/below MA
14 — Close below/above MA
15 — Close above/below open
16 — Close below/above open
17 — Close increase/decrease
18 — Close decrease/increase
19 — Close near Donchian top/bottom (Close > (Mid + HH) / 2)
20 — Close near Donchian bottom/top (Close < (Mid + LL) / 2)
21 — New Donchian high/low
22 — New Donchian low/high
23 — Rising volume
24 — Falling volume
25 — Volume above average (Volume > SMA(Volume, 20))
26 — Volume below average (Volume < SMA(Volume, 20))
27 — High body to range ratio (Abs(Close - Open) / (High - Low) > 0.5)
28 — Low body to range ratio (Abs(Close - Open) / (High - Low) < 0.5)
29 — High relative volatility (ATR(7) > ATR(40))
30 — Low relative volatility (ATR(7) < ATR(40))
31 — External condition 1
32 — External condition 2
33 — External condition 3
34 — External condition 4
35 — External condition 5
These constituent conditions fall into three distinct categories:
• Directional pairs : The numbers 1-22 correspond to pairs of opposing upward and downward conditions. For example, if one of the inputs includes "1" in the comma-separated list, that group uses the "RSI above/below threshold" condition pair. In this case, the RSI must be above a high threshold for the group to trigger an upward alert, and the RSI must be below a defined low threshold to trigger a downward alert.
• Non-directional filters : The numbers 23-30 correspond to conditions that do not represent directional information. These conditions act as filters for both upward and downward alerts. Traders often use non-directional conditions to refine trending or mean reversion signals. For instance, if one of the input lists includes "30", that group uses the "Low relative volatility" condition. The group can trigger an upward or downward alert only if the 7-period Average True Range (ATR) is below the 40-period ATR.
• External conditions : The numbers 31-35 correspond to external conditions based on the plots from other indicators on the chart. To set these conditions, use the source inputs in the "External conditions" section near the bottom of the "Settings/Inputs" tab. The external value can represent an upward, downward, or non-directional condition based on the following logic:
▫ Any value above 0 represents an upward condition.
▫ Any value below 0 represents a downward condition.
▫ If the checkbox next to the source input is selected, the condition becomes non-directional . Any group that uses the condition can trigger upward or downward alerts only if the source value is not 0.
To learn more about using plotted values from other indicators, see this article in our Help Center and the Source input section of our Pine Script™ User Manual.
Group markers
Each comma-separated list represents a distinct group , where all the listed conditions must occur to trigger an alert. This script assigns preset markers (names) to each condition group to make the active ensembles easily identifiable in the generated alert messages and labels. The markers assigned to each group use the format "M", where "M" is short for "Marker" and "x" is the group number. The titles of the inputs at the top of the "Settings/Inputs" tab show these markers for convenience.
For upward conditions, the labels and alert messages show group markers with upward triangles (e.g., "M1▲"). For downward conditions, they show markers with downward triangles (e.g., "M1▼").
NOTE: By default, this script populates the "M1" field with a pre-configured list for a mean reversion group ("2,18,24,28"). The other fields are empty. If any "M*" input does not contain a value, the indicator ignores it in the alert calculations.
Custom alert messages
By default, the indicator's alert message text contains the activated markers and their direction as a comma-separated list. Users can override this message for upward or downward alerts with the two text fields at the bottom of the "Settings/Inputs" tab. When the fields are not empty , the alerts use that text instead of the default marker list.
NOTE: This script generates alert triggers, not the alerts themselves. To set up an alert based on this script's conditions, open the "Create Alert" dialog box, then select the "Ensemble Alerts" and "Any alert() function call" options in the "Condition" tabs. See the Alerts FAQ in our Pine Script™ User Manual for more information.
Condition visualization
This script offers organized visualizations of its conditions, allowing users to inspect the behaviors of each condition alongside the specified groups. The key visual features include:
1) Conditional plots
• The indicator plots the history of each individual condition, excluding the external conditions, as circles at different levels. Opposite conditions appear at positive and negative levels with the same absolute value. The plots for each condition show values only on the bars where they occur.
• Each condition's plot is color-coded based on its type. Aqua and orange plots represent opposing directional conditions, and purple plots represent non-directional conditions. The titles of the plots also contain the condition numbers to which they apply.
• The plots in the separate pane can be turned on or off with the "Show plots in pane" checkbox near the top of the "Settings/Inputs" tab. This input only toggles the color-coded circles, which reduces the graphical load. If you deactivate these visuals, you can still inspect each condition from the script's status line and the Data Window.
• As a bonus, the indicator includes "Up alert" and "Down alert" plots in the Data Window, representing the combined upward and downward ensemble alert conditions. These plots are also usable in additional indicator-on-indicator calculations.
2) Dynamic labels
• The indicator draws a label on the main chart pane displaying the activated group markers (e.g., "M1▲") each time an alert condition occurs.
• The labels for upward alerts appear below chart bars. The labels for downward alerts appear above the bars.
NOTE: This indicator can display up to 500 labels because that is the maximum allowed for a single Pine script.
3) Background highlighting
• The indicator can highlight the main chart's background on bars where upward or downward condition groups activate. Use the "Highlight background" inputs in the "Settings/Inputs" tab to enable these highlights and customize their colors.
• Unlike the dynamic labels, these background highlights are available for all chart bars, irrespective of the number of condition occurrences.
█ NOTES
• This script uses Pine Script™ v6, the latest version of TradingView's programming language. See the Release notes and Migration guide to learn what's new in v6 and how to convert your scripts to this version.
• This script imports our new Alerts library, which features functions that provide high-level simplicity for working with complex compound conditions and alerts. We used the library's `compoundAlertMessage()` function in this indicator. It evaluates items from "bool" arrays in groups specified by an array of strings containing comma-separated index lists , returning a tuple of "string" values containing the marker of each activated group.
• The script imports the latest version of the ta library to calculate several technical indicators not included in the built-in `ta.*` namespace, including Double Exponential Moving Average (DEMA), Triple Exponential Moving Average (TEMA), Fractal Adaptive Moving Average (FRAMA), Tilson T3, Awesome Oscillator (AO), Full Stochastic (%K and %D), SuperTrend, and Donchian Channels.
• The script uses the `force_overlay` parameter in the label.new() and bgcolor() calls to display the drawings and background colors in the main chart pane.
• The plots and hlines use the available `display.*` constants to determine whether the visuals appear in the separate pane.
Look first. Then leap.

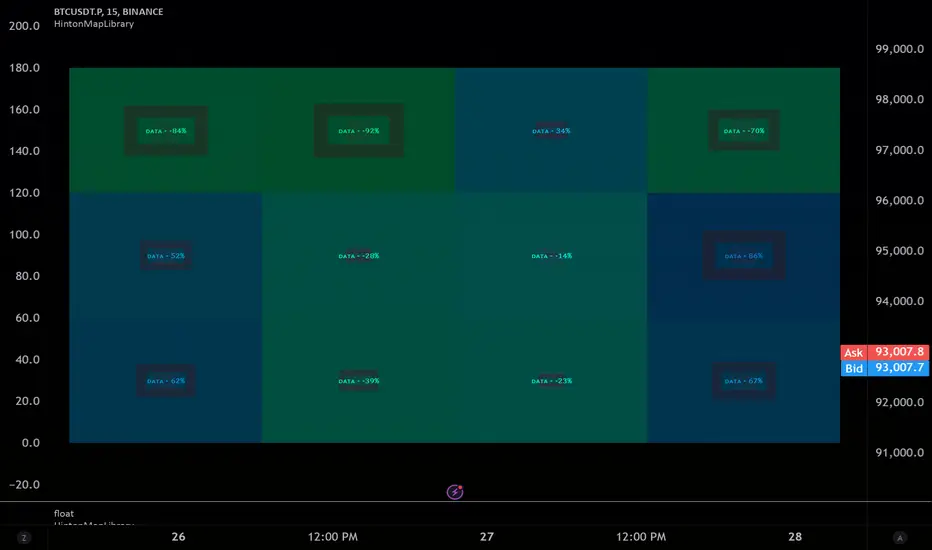
hinton_map█ HINTON MAP
This library provides functions to create and display a Hinton Map visualization. A Hinton map uses squares to represent the magnitude and direction of values in a matrix. This library allows you to display multiple ticker/timeframe/indicator combinations on a single chart, using color/boxsize/bnordersize to represent the values used. The values must be from -1.0 to 1.0 in value. 3 different values can be input per square.
Example Usage:
The example below demonstrates how to create a Hinton Map for two symbols (AAPL and MSFT) across three timeframes (1 minute, 5 minutes, and 1 day).
var hintonData = hinton_map.initHintonData(2, 3)
tickers = array.from("AAPL", "MSFT")
timeframes = array.from("1", "5", "1D")
for i = 0 to array.size(tickers) - 1
for j = 0 to array.size(timeframes) - 1
ticker = array.get(tickers, i)
timeframe = array.get(timeframes, j)
= request.security(ticker, timeframe, [close, close , ta.rsi(close, 14)], lookahead = barmerge.lookahead_on)
percent_change = (close_current - close_previous) / close_previous * 100
rsi_deviation = rsi_current - 50
hintonData.unitMatrix.set(i, j, hinton_map.createHintonUnit(
fillValue = percent_change,
borderValue = rsi_deviation,
innerValue = percent_change * rsi_deviation,
boxText = dv.from_string(str.tostring(math.round(percent_change, 2)) + "%"),
tooltipText = dv.from_string(syminfo.ticker + ", " + timeframe + ": " + str.tostring(math.round(percent_change, 2)) + "%, RSI: " + str.tostring(math.round(rsi_current, 2)))
))
hinton_map.drawHintonMap(hintonData)
█ createHintonUnit
Creates a Hinton unit.
• fillValue
Value to determine the fill color hue.
Type: float
Default Value: 0.0
• borderValue
Value to determine the border color hue and width.
Type: float
Default Value: 0.0
• innerValue
Value to determine the inner box color hue.
Type: float
Default Value: 0.0
• boxText
Text to display in the inner box.
Type: dv.DisplayValue
Default Value: na
• tooltipText
Tooltip text for the inner box.
Type: dv.DisplayValue
Default Value: na
Returns: HintonUnit
█ initHintonData
Initializes Hinton map data structure.
• rows
Number of rows.
Type: int
• columns
Number of columns.
Type: int
Returns: HintonData
█ drawHintonMap
Draws a Hinton map.
• hintonData
Hinton map data.
Type: HintonData
• unitSize
Size of each unit in bars.
Type: int
Default Value: 10
• borderWidth
Base width of the inner box border.
Type: int
Default Value: 5
• plusHue
Hue value for positive values (0-360).
Type: float
Default Value: 180
• minusHue
Hue value for negative values (0-360).
Type: float
Default Value: -30
█ HintonUnit
Data for a Hinton unit.
• fillValue
Value to determine the fill color hue.
Type: float
• borderValue
Value to determine the border color hue and width.
Type: float
• innerValue
Value to determine the inner box color hue.
Type: float
• boxText
Text to display in the inner box.
Type: dv.DisplayValue
• tooltipText
Tooltip text for the inner box.
Type: dv.DisplayValue
█ HintonData
Structure to store Hinton map data.
• unitMatrix
Matrix of Hinton units.
Type: matrix
• lineMatrix
Matrix of lines.
Type: matrix
• labelMatrix
Matrix of labels.
Type: matrix
• boxMatrix
Matrix of boxes.
Type: matrix
• fillMatrix
Matrix of line fills.
Type: matrix
Customizable Multi-Timeframe Doji with Ray and Editable LabelScript Overview
Script Name: Customizable Multi-Timeframe Doji Candle Levels with Ray and Editable Label
Purpose: This script helps traders identify significant price levels based on high timeframe Doji candles, allowing them to visualize key areas of support, resistance, entry, and exit. By plotting real-time Doji levels from higher timeframes directly on the current chart, traders can easily spot areas where market indecision or potential trend reversals have previously occurred, making these levels highly relevant for future price action.
How the Script Works
This script detects Doji candles on a selected higher timeframe (e.g., daily, weekly, monthly) and plots a ray at the Doji’s closing level on the current chart. The Doji candle formation, characterized by an open and close that are very close or equal, is often an indicator of market indecision. By identifying these Doji levels from high timeframes, the script provides traders with insight into where strong support and resistance zones may form.
The script continuously monitors and updates the Doji level based on the selected timeframe, ensuring that only the latest detected Doji candle is displayed on the chart, helping traders avoid clutter and focus on the most recent data.
Core Components and Calculations
1 Doji Detection Logic:
-The script calculates the Doji candle formation based on a small body percentage (defined by the C_DojiBodyPercent parameter) and relative symmetry in upper and lower shadows (defined by C_ShadowPercent and C_ShadowEqualsPercent).
-A Doji is considered valid when the open and close prices are nearly equal, and the shadows are symmetric within the defined parameters, indicating indecision.
2 Multi-Timeframe Data Retrieval:
-Using the request.security() function, the script fetches open, high, low, and close prices from the specified higher timeframe. It applies Doji detection logic to this higher timeframe data.
-barmerge.lookahead_on and barmerge.gaps_on ensure real-time updates, so the Doji level is immediately reflected on the chart when detected.
3 Ray and Label Plotting:
-When a Doji candle is detected on the selected timeframe, the script plots a ray at the Doji's close price, extending forward on the chart.
-Customizable options for the ray, including color, width, and style (solid, dotted, or dashed), help traders visually differentiate the Doji levels from other chart elements.
-An editable label can be positioned alongside the ray to denote the Doji level, with customizable text, color, background, and size to provide additional context.
4 Automatic Line and Label Management:
-The script dynamically deletes any previous ray and label when a new Doji is detected. This approach minimizes chart clutter and ensures that only the most recent Doji level from the higher timeframe is displayed.
Customization Options
1 Timeframe Selection:
Users can choose any timeframe (e.g., hourly, daily, weekly, monthly) to display Doji levels based on their specific trading strategy.
2 Ray and Label Appearance:
Ray: Customize color, width, and line style (solid, dotted, dashed) for better visibility and integration with the chart’s theme.
Label: Customize the label text, background color, text color, text size, and position (above, below, left, or right of the ray) for a personalized view.
How to Use This Script
1 Select the Target Timeframe for Doji Detection: Choose a high timeframe (such as daily or weekly) to view Doji-based support/resistance levels.
2 Set Custom Ray and Label Parameters : Adjust the visual aspects of the ray and label to align with your chart setup and make the Doji level stand out.
3 Interpretation of Doji Levels: Use the plotted Doji levels as potential support or resistance zones. Since Doji candles reflect market indecision, they often precede significant price reversals or strong continuation moves. By analyzing these levels, traders can:
- Identify key support/resistance zones based on historical market indecision.
- Set entry and exit levels around these zones to capitalize on potential reversals or
continuations.
-Spot confluence areas where the Doji level aligns with other indicators or technical patterns.
Recommended Chart Setup
For optimal clarity, use this script on a clean chart, free from overlapping indicators. This script is designed to work independently, so avoid layering multiple support/resistance scripts unless essential to avoid clutter. A clean chart helps ensure that Doji levels are readily visible, enabling a clear focus on significant levels relevant to your trading strategy.

Enhanced Pressure MTF ScreenerEnhanced Pressure Multi-Timeframe (MTF) Screener Indicator
Overview
The Enhanced Pressure MTF Screener is an add-on that extends the capabilities of the Enhanced Buy/Sell Pressure, Volume, and Trend Bar Analysis . It provides a clear and consolidated view of buy/sell pressure across multiple timeframes. This indicator allows traders to determine when different timeframes are synchronized in the same trend direction, which is particularly useful for making high-confidence trading decisions.
Image below: is the Enhanced Buy/Sell Pressure, Volume, and Trend Bar Analysis with the Enhanced Pressure MTF Screener indicator both active together.
Key Features
1.Multi-Timeframe Analysis
The indicator screens various predefined timeframes (from 1 week down to 10 minutes).
It offers a table view that shows buy or sell ratings for each timeframe, making it easy to see which timeframes are aligned.
Traders can choose which timeframes to include based on their trading strategies (e.g., higher timeframes for position trading, lower timeframes for scalping).
2.Pressure and Trend Calculation
Uses Buy and Sell Pressure calculations from the Enhanced Buy/Sell Pressure indicator to determine whether buying or selling is dominant in each timeframe.
By analyzing pressures on multiple timeframes, the indicator gives a comprehensive perspective of the current market sentiment.
The indicator calculates whether a move is strong based on user-defined thresholds, which are displayed in the form of additional signals.
3.Heikin Ashi Option
The Heikin Ashi candle type can be toggled on or off. Using Heikin Ashi helps smooth out market noise and provides a clearer indication of trend direction.
This is particularly helpful for traders who want to filter out market noise and focus on the primary trend.
4.Table Customization
Table Positioning: The table showing timeframe data can be positioned at different locations on the chart—top, middle, or bottom.
Text and Alignment: The alignment and text size of the table can be customized for better visual clarity.
Color Settings: Users can choose specific colors to indicate buying and selling pressure across timeframes, making it easy to interpret.
5.Strong Movement Indicators
The screener provides an additional visual cue (🔥) for timeframes where the movement is deemed strong, based on a user-defined threshold.
This helps highlight timeframes where significant buying or selling pressure is present, which could signal potential trading opportunities.
How the Screener Works
1.Pressure Calculation
For each selected timeframe, the indicator retrieves the Open, High, Low, and Close (OHLC) values.
It calculates buy pressure (the range between high and low when the closing price is higher than the opening) and sell pressure (the range between high and low when the closing price is equal to or lower than the opening).
The screener computes the pressure ratio, which represents the difference between buying and selling pressure, to determine which side is dominant.
2.Trend Rating and Signal Generation
Based on the calculated pressure, the screener determines a trend rating for each timeframe: "Buy," "Sell," or "Neutral." (▲ ,▼ or •)
Additionally, it generates a signal (▲ or ▼) to indicate the current trend direction and whether the move is strong (based on the user-defined threshold).
If the movement is strong, a fire icon (🔥) is added to indicate that there is significant pressure on that timeframe, signaling a higher confidence in the trend.
3.Customizable Strong Move Thresholds
Strong Move Threshold: The screener uses this value to decide whether a trend is significantly strong. A higher value makes it more selective in determining strong moves.
Strong Movement Threshold: Helps determine when an additional strong signal should be displayed, offering further insight into the strength of market movement.
Inputs and Customization
The Enhanced Pressure MTF Screener is highly customizable to fit the needs of individual traders:
General Settings:
Use Heikin Ashi: Toggle this setting to use Heikin Ashi for a smoother trend representation.
Strong Move Threshold: Defines how strong a move should be to be considered significant.
Strong Movement Threshold: Specifies the level of pressure required to highlight a move with the fire icon.
Table Settings:
Position: Choose the vertical position of the screener table (top, middle, or bottom of the chart).
Alignment: Align the table (left, center, or right) to best suit your chart layout.
Text Size: Adjust the text size in the table for better readability.
Table Color Settings:
Users can set different colors to represent buying and selling signals for better visual clarity, particularly when scanning multiple timeframes.
Timeframe Settings:
The screener provides options to include up to ten different timeframes. Traders can select and customize each timeframe to match their strategy.
Examples of available timeframes include 1 Week, 1 Day, 12 Hours, down to 10 Minutes, allowing for both broad and detailed analysis.
Practical Use Case
Identifying Trend Alignment Across Timeframes:
Imagine you are about to take a long trade but want to make sure that the trend direction is aligned across multiple timeframes.
The screener displays "Buy" ratings across the 4H, 1H, 30M, and 10M timeframes, while higher timeframes (like 1W and 1D) also show "Buy" with strong signals (🔥). This indicates that buying pressure is strong across the board, adding confidence to your trade.
Spotting Reversal Opportunities:
If a downtrend is evident across most timeframes but suddenly a higher timeframe, such as 12H, changes to "Buy" while showing a strong move (🔥), this could indicate a potential reversal.
The screener allows you to spot these discrepancies and consider taking early action.
Benefits for Traders
1.Synchronization Across Timeframes:
One of the main strengths of this screener is its ability to show synchronized buy/sell signals across different timeframes. This makes it easy to confirm the strength and consistency of a trend.
For example, if you see that all the selected timeframes display "Buy," this implies that both short-term and long-term traders are favoring the upside, giving additional confidence to go long.
2.Quick and Visual Trend Overview:
The table offers an at-a-glance summary, reducing the time required to manually inspect each timeframe.
This makes it particularly useful for traders who want to make quick decisions, such as day traders or scalpers.
3.Strong Move Indicator:
The use of fire icons (🔥) provides an easy way to identify significant movements. This is particularly helpful for traders looking for breakouts or strong market conditions that could lead to high probability trades.
To put it short or to summarize
The Enhanced Pressure MTF Screener is a powerful add-on for traders looking to understand how buy and sell pressure aligns across multiple timeframes. It offers:
A clear summary of buying or selling pressure across different timeframes.
Heikin Ashi smoothing, providing an option to reduce market noise.
Strong movement signals to highlight significant trading opportunities.
Customizable settings to fit any trading strategy or style.
The screener and the main indicator are best used together, as the screener provides the multi-timeframe overview, while the main indicator provides an in-depth look at each individual bar and trend.
I hope my indicator helps with your trading, if you guys have any ideas or questions there is the comment section :D

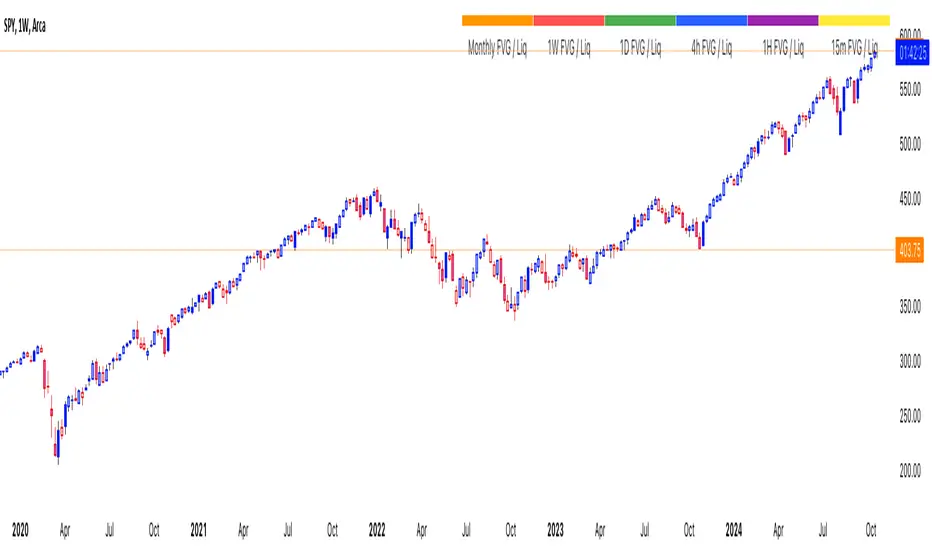
thinkCNE - Key with Multiple ColoursCustomisable Key with Multi-Coloured Highlights for Chart Annotations
Overview:
This Customizable Key indicator is designed to provide traders with a clear and visually customizable legend that can be displayed on their chart. It allows users to annotate their charts with up to 10 distinct labels, each paired with a unique color-coded square. This feature is especially useful when you need to visually differentiate between various technical elements on your chart, such as support/resistance levels, Fair Value Gaps (FVGs), or important pivot points.
Key Features:
Customizable Labels and Colors: Each row in the table can be customized with unique text and background colors. This flexibility allows traders to create a personalized key that reflects the specific elements they are tracking, such as monthly FVGs, daily supports, volume-based zones, or any other custom annotations.
Flexible Number of Rows: The user can enable or disable rows as needed, which ensures that the table only shows relevant information. If fewer than 10 rows are required, the unused rows can be hidden from view, maintaining a clean and uncluttered chart.
Dynamic Table Placement: The key can be placed at different positions on the chart (top-right, middle-right, or bottom-right), giving users control over where the key appears to avoid covering important parts of their technical analysis.
Adjustable Size and Text Format: Users can customize the size of the color squares, the text, and even the overall appearance of the table. The text size can range from small to huge, making the labels easy to read based on personal preferences.
Use Cases:
Annotating Key Technical Zones: The indicator is perfect for annotating multiple technical zones or levels that require consistent attention. For example, traders can label areas like "Monthly FVG," "Daily Support," "Key Resistance," or even "Volume Spike," and color-code them accordingly for quick reference.
Drawing Clarity: A well-organized chart is essential for clear decision-making. This indicator enhances clarity by visually categorizing different chart features, making it easier to quickly interpret the chart without confusion. The customizable color squares ensure that users can quickly identify which technical element corresponds to which label on the chart.
Visual Aid for Strategy Execution: For traders using strategies involving multiple indicators, support and resistance lines, or patterns, this key helps keep track of all the elements, especially when several overlapping annotations might clutter the chart. It allows users to draw specific attention to key areas of interest and explain the rationale for each one.
Educational & Presentational Tool: If you're conducting trading education sessions or presentations, this indicator can serve as a powerful tool to explain concepts in real-time. You can present your chart with clearly marked zones or levels, where each color and label explains the reasoning behind your analysis. It’s a professional tool for walkthroughs or strategy breakdowns.
Benefits:
Enhanced Visual Organization: The color-coded squares and corresponding labels make it easier to maintain organization within a busy chart. Traders can distinguish between multiple chart elements at a glance, which enhances their focus on critical zones or setups.
Improved Decision-Making: By clearly labeling and color-coding areas of importance, traders can reduce the time it takes to assess the chart and make decisions, as the key provides a concise reference.
Customizable to Individual Needs: Traders can adapt the indicator to their specific trading style and chart elements, whether they're swing traders marking longer-term zones or day traders focusing on short-term levels.
Clarity on Complex Charts: For traders using charts with several indicators and drawings, the ability to clearly define what each color and label represents ensures that the chart remains understandable, even with multiple overlays.
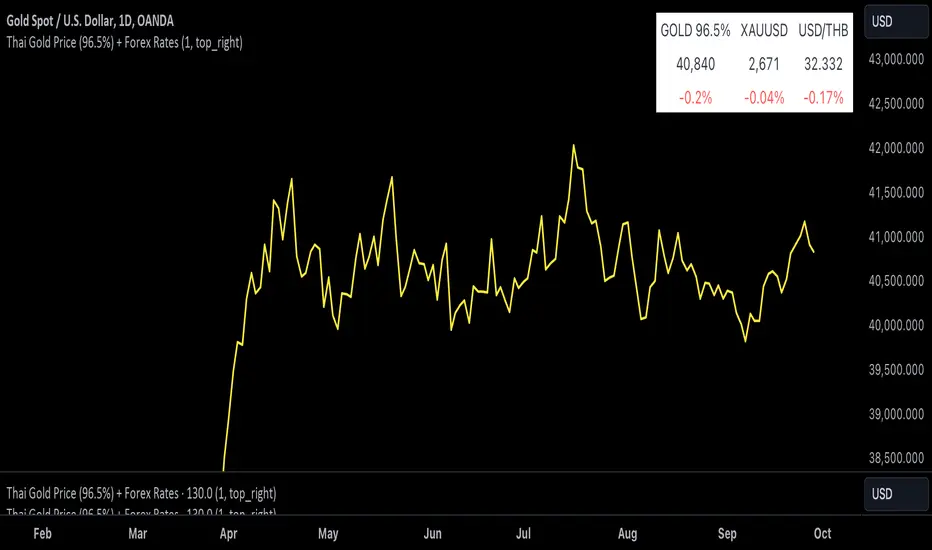
Thai Gold 96.5%Gold 96.5% Price Display (Test Version)
This Pine Script indicator is a test version designed to display the current price of Thai gold (96.5%) in a customizable table on your TradingView chart. The script calculates the gold price using the latest values for XAU/USD and USD/THB, reflecting the price of gold in Thai Baht (THB) with a purity adjustment.
Features:
- Price Calculation: Computes the Thai gold price by multiplying the XAU/USD price with USD/THB and adjusting for gold purity (0.49 * 0.965).
- Customizable Display: Adjust text size, text color, background color, and table position (Top Right, Top Left, Bottom Right, Bottom Left).
- Formatted Output: Gold price is formatted with commas for better readability.
Inputs:
- Text Size: Choose from tiny, small, normal, large, or huge.
- Text Color: Customize the text color.
- Background Color: Select a background color for the table.
- Table Position: Choose the table position on the chart.
Usage:
Add this test script to your TradingView chart to see the current Thai gold price displayed in a table format. This version is for testing purposes and may be updated based on feedback.
Feel free to test and customize the script further!
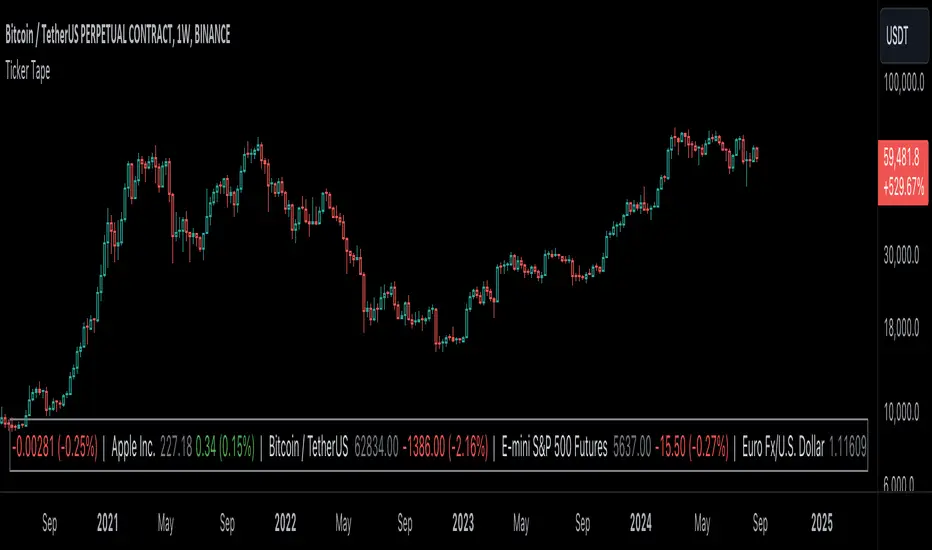
Ticker Tape█ OVERVIEW
This indicator creates a dynamic, scrolling display of multiple securities' latest prices and daily changes, similar to the ticker tapes on financial news channels and the Ticker Tape Widget . It shows realtime market information for a user-specified list of symbols along the bottom of the main chart pane.
█ CONCEPTS
Ticker tape
Traditionally, a ticker tape was a continuous, narrow strip of paper that displayed stock prices, trade volumes, and other financial and security information. Invented by Edward A. Calahan in 1867, ticker tapes were the earliest method for electronically transmitting live stock market data.
A machine known as a "stock ticker" received stock information via telegraph, printing abbreviated company names, transaction prices, and other information in a linear sequence on the paper as new data came in. The term "ticker" in the name comes from the "tick" sound the machine made as it printed stock information. The printed tape provided a running record of trading activity, allowing market participants to stay informed on recent market conditions without needing to be on the exchange floor.
In modern times, electronic displays have replaced physical ticker tapes. However, the term "ticker" remains persistent in today's financial lexicon. Nowadays, ticker symbols and digital tickers appear on financial news networks, trading platforms, and brokerage/exchange websites, offering live updates on market information. Modern electronic displays, thankfully, do not rely on telegraph updates to operate.
█ FEATURES
Requesting a list of securities
The "Symbol list" text box in the indicator's "Settings/Inputs" tab allows users to list up to 40 symbols or ticker Identifiers. The indicator dynamically requests and displays information for each one. To add symbols to the list, enter their names separated by commas . For example: "BITSTAMP:BTCUSD, TSLA, MSFT".
Each item in the comma-separated list must represent a valid symbol or ticker ID. If the list includes an invalid symbol, the script will raise a runtime error.
To specify a broker/exchange for a symbol, include its name as a prefix with a colon in the "EXCHANGE:SYMBOL" format. If a symbol in the list does not specify an exchange prefix, the indicator selects the most commonly used exchange when requesting the data.
Realtime updates
This indicator requests symbol descriptions, current market prices, daily price changes, and daily change percentages for each ticker from the user-specified list of symbols or ticker identifiers. It receives updated information for each security after new realtime ticks on the current chart.
After a new realtime price update, the indicator updates the values shown in the tape display and their colors.
The color of the percentages in the tape depends on the change in price from the previous day . The text is green when the daily change is positive, red when the value is negative, and gray when the value is 0.
The color of each displayed price depends on the change in value from the last recorded update, not the change over a daily period. For example, if a security's price increases in the latest update, the ticker tape shows that price with green text, even if the current price is below the previous day's closing price. This behavior allows users to monitor realtime directional changes in the requested securities.
NOTE: Pine scripts execute on realtime bars when new ticks are available in the chart's data feed. If no new updates are available from the chart's realtime feed, it may cause a delay in the data the indicator receives.
Ticker motion
This indicator's tape display shows a list of security information that incrementally scrolls horizontally from right to left after new chart updates, providing a dynamic visual stream of current market data. The scrolling effect works by using a counter that increments across successive intervals after realtime ticks to control the offset of each listed security. Users can set the initial scroll offset with the "Offset" input in the "Settings/Inputs" tab.
The scrolling rate of the ticker tape display depends on the realtime ticks available from the chart's data feed. Using the indicator on a chart with frequent realtime updates results in smoother scrolling. If no new realtime ticks are available in the chart's feed, the ticker tape does not move. Users can also deactivate the scrolling feature by toggling the "Running" input in the indicator's settings.
█ FOR Pine Script™ CODERS
• This script utilizes dynamic requests to iteratively fetch information from multiple contexts using a single request.security() instance in the code. Previously, `request.*()` functions were not allowed within the local scopes of loops or conditional structures, and most `request.*()` function parameters, excluding `expression`, required arguments of a simple or weaker qualified type. The new `dynamic_requests` parameter in script declaration statements enables more flexibility in how scripts can use `request.*()` calls. When its value is `true`, all `request.*()` functions can accept series arguments for the parameters that define their requested contexts, and `request.*()` functions can execute within local scopes. See the Dynamic requests section of the Pine Script™ User Manual to learn more.
• Scripts can execute up to 40 unique `request.*()` function calls. A `request.*()` call is unique only if the script does not already call the same function with the same arguments. See this section of the User Manual's Limitations page for more information.
• This script converts a comma-separated "string" list of symbols or ticker IDs into an array . It then loops through this array, dynamically requesting data from each symbol's context and storing the results within a collection of custom `Tape` objects . Each `Tape` instance holds information about a symbol, which the script uses to populate the table that displays the ticker tape.
• This script uses the varip keyword to declare variables and `Tape` fields that update across ticks on unconfirmed bars without rolling back. This behavior allows the script to color the tape's text based on the latest price movements and change the locations of the table cells after realtime updates without reverting. See the `varip` section of the User Manual to learn more about using this keyword.
• Typically, when requesting higher-timeframe data with request.security() using barmerge.lookahead_on as the `lookahead` argument, the `expression` argument should use the history-referencing operator to offset the series, preventing lookahead bias on historical bars. However, the request.security() call in this script uses barmerge.lookahead_on without offsetting the `expression` because the script only displays results for the latest historical bar and all realtime bars, where there is no future information to leak into the past. Instead, using this call on those bars ensures each request fetches the most recent data available from each context.
• The request.security() instance in this script includes a `calc_bars_count` argument to specify that each request retrieves only a minimal number of bars from the end of each symbol's historical data feed. The script does not need to request all the historical data for each symbol because it only shows results on the last chart bar that do not depend on the entire time series. In this case, reducing the retrieved bars in each request helps minimize resource usage without impacting the calculated results.
Look first. Then leap.
ICT Watermark | FluxxDescription:
The watermark indicator is designed to enhance the visual presentation of your trading charts by adding customizable watermarks. This tool allows you to overlay essential information, such as ticker symbols, timeframes, dates, and custom text, directly onto your charts. While providing larger text options then all other watermarks currently available.
Key Features:
Customizable Watermarks: Users can enable up to two watermarks with adjustable text content, color, size, and position.
Dynamic Information Display: Option to display real-time symbol and timeframe details, as well as the current date.
Flexible Placement: Watermarks can be positioned at the top, middle, or bottom of the chart, and aligned to the left, center, or right.
Multiple Size Options: Includes a variety of text sizes, making the text larger than any other watermark out there!
Use Cases:
Branding: Add your name or brand to your charts for a personalized touch.
Clarity: Overlay important chart details without obstructing the main content, helping in presentations or shared analysis.
This indicator is original and valuable for traders who seek to enhance the clarity and professionalism of their charts. It is particularly useful for those who create educational content or wish to maintain consistent chart branding.
Uptrick: FVG Market Zones**Uptrick: FVG Market Zones**
---
### Introduction
**Uptrick: FVG Market Zones** is a cutting-edge technical analysis tool designed to identify and visualize Fair Value Gaps (FVGs) within financial markets. This indicator focuses on pinpointing critical price levels where significant gaps occur, which can act as potential support and resistance zones. By integrating advanced volatility analysis and user-configurable parameters, the **Uptrick: FVG Market Zones** provides traders with a robust framework for understanding market dynamics and making informed trading decisions.
### Purpose and Functionality
The primary purpose of the **Uptrick: FVG Market Zones** indicator is to detect and highlight Fair Value Gaps, which are areas on a price chart where there is a significant price movement without any trading activity in between. These gaps can provide critical insights into market behavior, as they often indicate areas where the market has not fully accounted for the supply and demand dynamics. Traders use these zones to anticipate potential reversals, breakouts, or consolidations, making this tool highly valuable for both short-term and long-term trading strategies.
### Unique Features and Originality
The **Uptrick: FVG Market Zones** indicator is distinguished by its focus on FVGs and its ability to integrate this concept into a broader market analysis framework. Unlike other indicators that may offer generalized support and resistance levels, this tool specifically identifies and visualizes gaps based on volatility-adjusted criteria. This precision allows traders to focus on the most relevant market zones, improving their ability to anticipate market movements.
One of the standout features of this indicator is its user-configurable settings, which provide a high degree of customization. This flexibility ensures that traders can tailor the indicator to suit their specific trading style and the particular market they are analyzing. Additionally, the indicator's visualization capabilities are enhanced with customizable colors and gap-filling options, making it easier for traders to interpret and act on the information presented.
### Inputs and Configurations
**Uptrick: FVG Market Zones** comes with several user inputs that allow traders to customize the indicator's behavior and appearance. Each input plays a crucial role in determining how the indicator identifies and visualizes FVGs on the chart. Here’s a detailed breakdown of each input:
1. **FVG Analysis Period (fvgPeriod):**
- **Description:** This input determines the period over which the indicator analyzes the chart for identifying FVGs. By adjusting this value, traders can control how far back in time the indicator looks to detect significant gaps.
- **Default Value:** 25
- **Purpose:** A shorter period may focus on more recent market activity, making the indicator more sensitive to recent price movements. In contrast, a longer period allows the indicator to identify gaps that have remained unfilled for an extended time, potentially acting as stronger support or resistance levels.
2. **Analysis Mode (mode):**
- **Description:** The Analysis Mode input allows traders to choose between different methods of analyzing the chart for FVGs.
- **Options:** "Recent Gaps" and "Extended View"
- **Default Option:** "Recent Gaps"
- **Purpose:**
- **Recent Gaps:** Focuses on the latest significant gaps, providing traders with up-to-date information on the most relevant market zones.
- **Extended View:** Considers a broader range of gap patterns, which can be useful in markets where historical gaps may still influence current price action.
3. **Volatility Sensitivity (volatilityFactor):**
- **Description:** This input adjusts the sensitivity of the indicator to market volatility. It is used in calculating the threshold for identifying FVGs.
- **Default Value:** 0.3
- **Step Size:** 0.1
- **Purpose:** A higher sensitivity will cause the indicator to detect smaller gaps, which might be more frequent but less significant. Lower sensitivity focuses on larger, more impactful gaps, which are less frequent but potentially more powerful in predicting market behavior.
4. **Highlight Market Gaps (showGaps):**
- **Description:** A boolean input that determines whether the identified FVGs should be highlighted on the chart.
- **Default Value:** True
- **Purpose:** This input allows traders to toggle the visualization of FVGs. When enabled, the indicator highlights gaps using colored boxes, making them visually prominent on the chart.
5. **Bullish Highlight Color (bullColor):**
- **Description:** Sets the color used to highlight bullish FVGs (gaps that may indicate support).
- **Default Value:** #00FF7F (a shade of green)
- **Purpose:** The color choice is crucial for quickly distinguishing bullish zones from bearish ones. Green is typically associated with upward price movement, making it intuitive for traders to identify potential support areas.
6. **Bearish Highlight Color (bearColor):**
- **Description:** Sets the color used to highlight bearish FVGs (gaps that may indicate resistance).
- **Default Value:** #FF4500 (a shade of red)
- **Purpose:** Red is commonly associated with downward price movement, making it easy for traders to identify potential resistance areas. This color coding helps in quickly assessing the chart.
7. **Fill Gap Areas (fillGaps):**
- **Description:** A boolean input that determines whether the FVGs should be filled with a color on the chart.
- **Default Value:** True
- **Purpose:** Filling the gap areas provides a more solid visual cue for traders. It enhances the visibility of the gaps, making it easier to spot these zones during fast-paced trading sessions.
8. **Hidden Color (hidden):**
- **Description:** A color input that is used when certain elements should be hidden from the chart.
- **Default Value:** color.rgb(0,0,0,100) (a semi-transparent black)
- **Purpose:** This input is useful for controlling the visibility of certain plots or elements on the chart, ensuring that the indicator remains clean and uncluttered.
### Market Gap Detection
The core functionality of the **Uptrick: FVG Market Zones** indicator lies in its ability to detect Fair Value Gaps. These gaps occur when the price makes a significant jump from one level to another without any trading activity in between. The indicator uses a combination of price action analysis and volatility thresholds to identify these gaps.
- **Volatility Measurement:** The indicator begins by measuring market volatility using the Average True Range (ATR). This volatility measurement is then adjusted by the user-defined sensitivity factor, which determines the threshold for identifying significant gaps.
- **Gap Identification:** The indicator checks for instances where the current low is higher than the high two bars ago (bullish gap) or where the current high is lower than the low two bars ago (bearish gap). These conditions signify a potential FVG.
- **Gap Storage and Management:** Once a gap is identified, it is stored in an array. The indicator also manages the size of these arrays based on the selected analysis mode, ensuring that only the most relevant gaps are considered in the analysis.
### Visualization
Visualization is a key component of the **Uptrick: FVG Market Zones** indicator. By providing clear and customizable visual cues, the indicator ensures that traders can quickly and easily interpret the information it provides.
- **Gap Highlighting:** When enabled, the indicator highlights the identified FVGs on the chart using colored boxes. Bullish gaps are highlighted in green, while bearish gaps are highlighted in red. This color coding helps traders instantly recognize potential support and resistance zones.
- **Gap Filling:** The indicator can also fill the identified gaps with a semi-transparent color. This option enhances the visibility of the gaps, making them more prominent on the chart. Filled gaps are particularly useful for traders who want to keep track of these zones over multiple trading sessions.
- **Gap Averages:** The indicator calculates the average level of the identified gaps and plots these averages as lines on the chart. These lines represent the general area of support or resistance based on the detected gaps, providing traders with a reference point for setting their stop losses or profit targets.
- **Text Labels:** The indicator also labels each FVG with the text "FVG" inside the highlighted area. This feature ensures that traders can easily identify these zones even in charts with dense price action.
### Practical Applications
The **Uptrick: FVG Market Zones** indicator is versatile and can be applied to a wide range of trading strategies across different markets and timeframes. Here are a few examples of how this indicator can be used in practice:
1. **Support and Resistance Trading:**
- Traders can use the identified FVGs as dynamic support and resistance levels. By placing their trades based on these levels, they can take advantage of potential reversals or continuations at key market zones.
2. **Gap Filling Strategy:**
- Some traders focus on the concept of gap filling, where the market eventually returns to "fill" the gap created by rapid price movements. The **Uptrick: FVG Market Zones** indicator can
help identify such gaps and anticipate when the market might return to these levels.
3. **Breakout Trading:**
- The indicator can be used to identify breakouts from significant gaps. When the price moves beyond the identified FVGs, it may signal a strong trend continuation, providing an opportunity for breakout traders.
4. **Reversal Trading:**
- By monitoring the signals generated by the indicator, traders can identify potential market reversals. A sell signal after a prolonged uptrend or a buy signal after a downtrend may indicate a reversal, allowing traders to position themselves accordingly.
5. **Risk Management:**
- The average levels of the FVGs can be used to set stop-loss and take-profit levels. By aligning these levels with the FVG zones, traders can improve their risk management practices and enhance their trading discipline.
### Customization and Flexibility
One of the standout features of the **Uptrick: FVG Market Zones** indicator is its high level of customization. Traders can adjust various parameters to tailor the indicator to their specific needs and preferences.
- **Customizable Colors:** The indicator allows traders to choose their preferred colors for highlighting bullish and bearish gaps. This flexibility ensures that the indicator can be integrated seamlessly into any trading setup, regardless of the trader's color scheme preferences.
- **Adjustable Periods and Sensitivity:** By allowing traders to adjust the analysis period and volatility sensitivity, the indicator can be fine-tuned to suit different market conditions. For example, a trader might use a shorter analysis period and higher sensitivity in a volatile market, while opting for a longer period and lower sensitivity in a more stable market.
- **Toggling Visual Elements:** Traders can choose to enable or disable various visual elements of the indicator, such as gap highlighting, gap filling, and text labels. This level of control allows traders to declutter their charts and focus on the information that is most relevant to their trading strategy.
### Advantages and Benefits
The **Uptrick: FVG Market Zones** indicator offers several key advantages that make it a valuable tool for traders:
1. **Precision:** By focusing on Fair Value Gaps, the indicator provides highly precise levels of support and resistance, which are often more reliable than traditional horizontal levels.
2. **Clarity:** The clear visual representation of FVGs, along with the text labels and color coding, ensures that traders can quickly interpret the indicator's signals and incorporate them into their trading decisions.
3. **Adaptability:** The indicator's customizable settings allow it to be adapted to different markets, timeframes, and trading styles. Whether you are a day trader, swing trader, or long-term investor, this indicator can be tailored to meet your needs.
4. **Enhanced Decision-Making:** The trading signals generated by the indicator provide actionable insights that can help traders make more informed decisions. By aligning their trades with the identified FVG zones, traders can improve their chances of success.
5. **Risk Management:** The use of FVG zones as reference points for stop-loss and take-profit levels enhances risk management practices, helping traders protect their capital while maximizing their profit potential.
### Conclusion
The **Uptrick: FVG Market Zones** indicator is a powerful and versatile tool for traders seeking to enhance their market analysis and improve their trading outcomes. By focusing on Fair Value Gaps and providing a high level of customization, this indicator offers a unique blend of precision, clarity, and adaptability. Whether you are looking to identify key market zones, generate trading signals, or improve your risk management practices, the **Uptrick: FVG Market Zones** indicator is a valuable addition to any trader's toolkit.
With its innovative approach to market analysis and user-friendly design, **Uptrick: FVG Market Zones** stands out as an essential tool for traders who want to stay ahead of the market and make more informed trading decisions. Whether you are trading stocks, forex, commodities, or cryptocurrencies, this indicator provides the insights you need to navigate the markets with confidence and success.

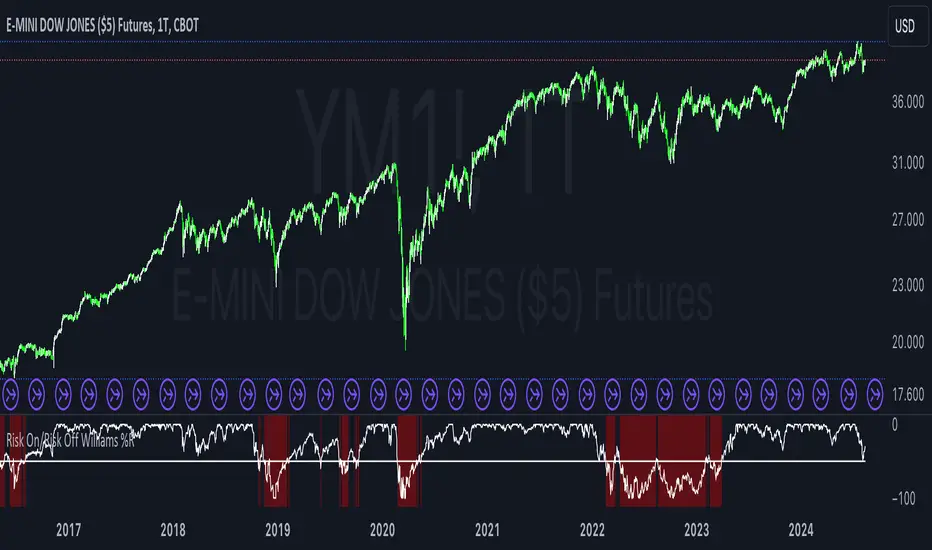
Risk On/Risk Off Williams %RThe Risk On/Risk Off Williams %R indicator is a technical analysis tool designed to gauge market sentiment by comparing the performance of risk-on and risk-off assets. This indicator combines the Williams %R, a momentum oscillator, with a composite index derived from various financial assets to determine the prevailing market risk sentiment.
Components:
Risk-On Assets: These are typically more volatile and are expected to perform well during bullish market conditions. The indicator uses the following risk-on assets:
SPY (S&P 500 ETF)
QQQ (Nasdaq-100 ETF)
HYG (High-Yield Corporate Bond ETF)
XLF (Financial Select Sector SPDR Fund)
XLK (Technology Select Sector SPDR Fund)
Risk-Off Assets: These are generally considered safer investments and are expected to outperform during bearish market conditions. The indicator includes:
TLT (iShares 20+ Year Treasury Bond ETF)
GLD (SPDR Gold Trust)
DXY (U.S. Dollar Index)
IEF (iShares 7-10 Year Treasury Bond ETF)
XLU (Utilities Select Sector SPDR Fund)
Calculation:
Risk-On Index: The average closing price of the risk-on assets.
Risk-Off Index: The average closing price of the risk-off assets.
The composite index is computed as:
Composite Index=Risk On Index−Risk Off Index
Composite Index=Risk On Index−Risk Off Index
Williams %R: This momentum oscillator measures the current price relative to the high-low range over a specified period. It is calculated as:
\text{Williams %R} = \frac{\text{Highest High} - \text{Composite Index}}{\text{Highest High} - \text{Lowest Low}} \times -100
where "Highest High" and "Lowest Low" are the highest and lowest values of the composite index over the lookback period.
Usage:
Williams %R: A momentum oscillator that ranges from -100 to 0. Values above -50 suggest bullish conditions, while values below -50 indicate bearish conditions.
Background Color: The background color of the chart changes based on the Williams %R relative to a predefined threshold level:
Green background: When Williams %R is above the threshold level, indicating a bullish sentiment.
Red background: When Williams %R is below the threshold level, indicating a bearish sentiment.
Purpose:
The indicator is designed to provide a visual representation of market sentiment by comparing the performance of risk-on versus risk-off assets. It helps traders and investors understand whether the market is leaning towards higher risk (risk-on) or safety (risk-off) based on the relative performance of these asset classes. By incorporating the Williams %R, the indicator adds a momentum-based dimension to this analysis, allowing for better decision-making in response to shifting market conditions.
Three Drive Pattern Detector [LuxAlgo]The Three Drives Pattern Detector indicator focuses on detecting and displaying completed Three Drives patterns on the user chart. This harmonic pattern is characterized by successive higher highs / lower lows following specific ratios.
The script uses a multi-length swing detection approach, as well as adjusting ratios to ensure flexibility and a maximum number of visible Three Drives patterns.
🔶 USAGE
The bullish/bearish Three Drives pattern is commonly interpreted as a reversal pattern and is characterized by three extensions (drives) and two intermediary retracements creating consecutive higher lows (for a bullish case) or lower highs (for a bearish case).
The multi-length swing detection approach taken by the indicator allows for detecting shorter-term alongside medium/longer-term patterns simultaneously, allowing to increase in the amount of detected patterns.
Users can set a Minimum Swing length (for example 2) and a Maximum Swing length (for example 100) which defines the range of the swing point detection length, higher values for these settings will detect longer-term Three-Drives patterns, while a larger range will allow for the detection of a larger number of patterns.
Sometimes multiple dashed lines as the last segment can be observed. This means multiple Three Drives patterns sharing multiple swing points have formed, with only the last segment being different.
🔹 Retracement/Extension Ratios
The Three Drives pattern often associates the retracement/extension to Fibonacci ratios of respectively 0.618/1.272.
Some sources specify a maximum retracement/extension level of 0.786/1.618, which means the retracement should be within the 0.618-0.786 range and the extension between 1.272-1.618.
Since finding a pattern where the retracement/extension is precisely at the 0.618/1.272 levels, or even between 0.618-0.786/1.272-1.618 is rare, the script allows users to adjust those ratios, which ensures more flexibility. Depending on the widening/tightening of the ratios, allowing users to find more patterns (but potentially less valid) or more valid (but fewer patterns).
In the example above, " Show Ratios " is set to " Ratios With Margin ", showing the ideal retracement/extension level together with the margin, while in the example below, " Show Ratios " is set to " Ratios ", which shows only a line where the price should ideally reverse.
While setting the ratios wider will result in more frequent but less valid patterns, it can also create good trading opportunities.
🔹 Best Practices
The indicator doesn't include Stop Loss (SL) or Take Profit (TP) levels, however, the 1.618 Fibonacci Extension level of the last leg can commonly be used as stop loss.
Typical Take Profit areas include:
Starting point of the pattern
Each retracement level (2x)
The 0.618 retracement level of the complete pattern
In the above bullish examples, the price was lower than the lowest point of the pattern. The price reversed and attained all TP levels without hitting the SL level.
In the above bearish example, the price went above the highest point of the pattern but did not hit the SL level, after which two TP levels were hit. Then, the price quickly went up, just missing the SL level before it came back down again, hitting the last 2 TP levels.
This example shows that other Fibonacci levels an also be effective when combined with the Three Drives pattern, even in the longer term.
🔶 DETAILS
🔹 Multi Length
The core of this publication is the multi-length swing detection. To ensure the maximum amount of Three Drives patterns are found, up to 99 different swing length periods can be used to detect swing points which are then tested for valid patterns.
Using a wider variety of swing points also ensures that patterns visible only with specific Swing settings can be found on the same chart without the user needing to constantly adjust the Swing settings to find other patterns.
The user only needs to set the desired minimum and maximum Swing Length.
In this case, swing detection using swing Lengths from 3 to 100 (97 different) are computed and evaluated for patterns. Three different patterns were found on the same chart, with swing lengths 3, 4, and 6.
Note: The Maximum Swing length should be equal to or higher than the Minimum Swing Length . If the maximum value is lower than the minimum, the script will automatically take the minimum value as the maximum to prevent errors.
🔹 Width Margin %
Users can filter out patterns based on the duration of each extension/retracement segment. When the users want segments of the detected patterns to be of a similar duration, the width percentage should be set lower. When the focus is on detecting more patterns the width percentage can be set higher.
🔹 Retracement/Extension Settings
Show Ratios , set to Ratios , show the ideal Fibonacci retracement/extension level, while Ratios With Margin (example below) show the additional margins for retracement/extension.
The upper and lower limits can be visualized while hovering over the calculated ratio label.
The dashed line shows an older pattern, where the last leg has been updated.
🔹 Last Known Pattern
The included dashboard highlights the date of the most recently detected pattern; the text will show " None " if no pattern is found.
🔹 Calculated Bars
The "Calculated Bars" setting makes use of the recently introduced calc_bars_count parameter, making it possible to effectively reduce the number of historical bars during the computation of the script, which significantly improves the loading speed of the script.
Users wishing to see the most recent patterns can set this setting to 1000 for example, where only the most recent 1000 bars are used to find patterns. If every bar must be used for pattern detection, set " Calculated bars " at 0.
🔶 SETTINGS
Minimum Swing Length: Minimum length used for the swing detection.
Maximum Swing Length: Maximum length used for the swing detection.
Retracement: Range of required ratios used for testing retracements.
Extension: Range of required ratios used for testing extensions.
Width Margin: Influences the symmetry of the pattern; with a higher number allowing for less symmetry.
🔹 Style
Text Size: Text size of the ratio labels.
Show Ratios: Show the ideal ratio, upper/lower limit of ratios, or none.
🔹 Dashboard
Show Dashboard: Toggle dashboard which shows the date of the last found pattern.
Location: Location of the dashboard on the chart.
Size: Text size.
🔹 Calculation
Calculated Bars: Allows the usage of fewer bars for performance/speed improvement.

Dominance DashboardThe "Dominance Dashboard" is a TradingView indicator designed to provide traders with a clear and concise visual representation of Bitcoin Dominance (BTC.D). This script helps traders monitor BTC.D in real-time, offering insights into market dynamics and potential trading signals based on the changes in Bitcoin's market dominance.
Key Features
Real-Time BTC Dominance: Displays the current Bitcoin Dominance percentage.
Historical Comparison: Shows the previous day's Bitcoin Dominance for comparison.
Visual Indicators: Utilizes color-coded arrows to indicate changes in Bitcoin Dominance (increase or decrease).
Customizable Table Settings: Users can customize the position, size, and colors of the displayed table to suit their preferences.
How It Works
Data Retrieval: The script uses request.security to fetch the latest and previous day's BTC.D data.
Comparison Mechanism: It compares the current BTC Dominance with the previous day's value to determine whether BTC.D has increased, decreased, or remained unchanged.
Dynamic Table Display: Based on user preferences, the script dynamically adjusts the table's position, text size, and colors.
Using the Indicator
Table Settings:
Show Header: Toggle the visibility of the table header.
Position: Choose from various predefined positions (e.g., Top Right, Bottom Right) to place the dashboard on your chart.
Text Size: Select the text size (Tiny, Small, Normal, Large) for better readability.
Text and Border Colors: Customize the text and border colors to match your chart's theme.
Timeframe Settings:
Show Current BTC Dominance: Enable or disable the display of the current BTC Dominance percentage.
Underlying Concepts
BTC Dominance: Bitcoin Dominance (BTC.D) measures Bitcoin's market capitalization relative to the total market capitalization of all cryptocurrencies. Monitoring BTC.D helps traders understand the flow of capital in and out of Bitcoin compared to other cryptocurrencies.
Visual Change Indicators: The script uses simple arrow symbols (🔼 for an increase and 🔽 for a decrease) to provide quick visual cues about the direction of change in BTC Dominance. This feature helps traders quickly assess market conditions without deep analysis.
Practical Use Cases
Market Sentiment Analysis: A rising BTC Dominance could indicate a market shift towards Bitcoin, potentially signaling a bearish sentiment for altcoins. Conversely, a falling BTC Dominance might suggest increased interest in altcoins.
Trend Confirmation: Traders can use BTC Dominance trends to confirm their trading strategies. For example, if a trader is bullish on Bitcoin, an increasing BTC Dominance might reinforce their position.
Portfolio Management: By monitoring BTC Dominance, traders can make informed decisions about portfolio rebalancing between Bitcoin and other cryptocurrencies.
Bearish vs Bullish ArgumentsThe Bearish vs Bullish Arguments Indicator is a tool designed to help traders visually assess and compare the number of bullish and bearish arguments based on their custom inputs. This script enables users to input up to five bullish and five bearish arguments, dynamically displaying the bias on a clean and customizable table on the chart. This provides traders with a clear, visual representation of the market sentiment they have identified.
Key Features:
Customizable Inputs: Users can input up to five bullish and five bearish arguments, which are displayed in a table on the chart.
Bias Calculation: The script calculates the bias (Bullish, Bearish, or Neutral) based on the number of bullish and bearish arguments provided.
Color Customization: Users can customize the colors for the table background, text, and headers, ensuring the table fits seamlessly into their charting environment.
Reset Functionality: A reset switch allows users to clear all input arguments with a single click, making it easy to start fresh.
How It Works:
Input Fields: The script provides input fields for up to five bullish and five bearish arguments. Each input is a simple text field where users can describe their arguments.
Bias Calculation: The script counts the number of non-empty bullish and bearish arguments and determines the overall bias. The bias is displayed in the table with a dynamically changing color to indicate whether the market sentiment is bullish, bearish, or neutral.
Customizable Table: The table is positioned on the chart according to the user's preference (top-left, top-right, bottom-left, bottom-right) and can be customized in terms of background color and text color.
How to Use:
Add the Indicator: Add the Bearish vs Bullish Arguments Indicator to your chart.
Input Arguments: Enter up to five bullish and five bearish arguments in the provided input fields in the script settings.
Customize Appearance: Adjust the table's background color, text color, and position on the chart to fit your preferences.
Example Use Case:
A trader might use this indicator to visually balance their arguments for and against a particular trade setup. By entering their reasons for a bullish outlook in the bullish argument fields and their reasons for a bearish outlook in the bearish argument fields, they can quickly see which side has more supporting points and make a more informed trading decision.
This script was inspired by Arjoio's concepts

RSI Sector analysis
Screening tool that produces a table with the various sectors and their RSI values. The values are shown in 3 rows, each with a user-defined length, and can be averaged out and displayed as a single value. The chart is color coded as well. Each ETF representing a sector can be looked at individually, with the top holdings in each preprogrammed, but users can define their own if they wish. The left most ticker is the "benchmark"; SPY is the benchmark for the various sectors, and the ETF is the benchmark for the tickers within.
Symbols are color coded: light blue text indicates that a symbol has greater RSI values in all three timeframes than the benchmark (the leftmost symbol). Orange text indicates that a symbol has a lower RSI value for all three timeframes. In the first row, light blue text indicates the largest RSI increase from the third row to the first row. Orange text indicates the largest RSI decrease from the third row to the first row.
A blue highlight indicates that the value is the highest among the tickers, excluding the benchmark, and an orange highlight indicates that the value is the lowest among the tickers, also excluding the benchmark. A blue highlight on the ticker indicates that it has the highest average value of the 3 rows, and a orange highlight on the ticker indicates that it has the lowest average value of the 3 rows.

VolumeSpreadAnalysisLibrary "VolumeSpreadAnalysis"
A library for Volume Spread Analysis (VSA).
spread(_barIndex)
Calculates the spread of a bar.
Parameters:
_barIndex (int) : (int) The index of the bar.
Returns: (float) The spread of the bar.
volume(_barIndex)
Retrieves the volume of a bar.
Parameters:
_barIndex (int) : (int) The index of the bar.
Returns: (float) The volume of the bar.
body(_barIndex)
Calculates the body of a bar.
Parameters:
_barIndex (simple int) : (int) The index of the bar.
Returns: (float) The body size of the bar.
wickUpper(_barIndex)
Calculates the upper wick of a bar (upper shadow).
Parameters:
_barIndex (simple int) : (int) The index of the bar.
Returns: (float) The upper wick size of the bar.
wickLower(_barIndex)
Calculates the lower wick of a bar (lower shadow).
Parameters:
_barIndex (simple int) : (int) The index of the bar.
Returns: (float) The lower wick size of the bar.
calcForecastedSMA(_source, _length, _forecastedLevel)
Calculates the forecasted Simple Moving Average (SMA).
Parameters:
_source (float) : (series float) Source data for calculation.
_length (simple int) : (int) The length of the SMA.
_forecastedLevel (float) : (float) The forecasted level to include in the calculation.
Returns: (float) The forecasted SMA value.
calcForecastedEMA(_source, _length, _forecastedLevel)
Calculates the forecasted Exponential Moving Average (EMA).
Parameters:
_source (float) : (series float) Source data for calculation.
_length (simple int) : (int) The length of the EMA.
_forecastedLevel (float) : (float) The forecasted level to include in the calculation.
Returns: (float) The forecasted EMA value.
calcForecastedRMA(_source, _length, _forecastedLevel)
Calculates the forecasted Relative Moving Average (RMA).
Parameters:
_source (float) : (series float) Source data for calculation.
_length (simple int) : (int) The length of the RMA.
_forecastedLevel (float) : (float) The forecasted level to include in the calculation.
Returns: (float) The forecasted RMA value.
calcForecastedWMA(_source, _length, _forecastedLevel)
Calculates the forecasted Weighted Moving Average (WMA).
Parameters:
_source (float) : (series float) Source data for calculation.
_length (simple int) : (int) The length of the WMA.
_forecastedLevel (float) : (float) The forecasted level to include in the calculation.
Returns: (float) The forecasted WMA value.
calcElapsedTimePercent()
Calculates the elapsed time percent of the current bar.
Returns: (float) The elapsed time percent.
calcForecastedSpread(multiplierAtMidpoints, multiplierAtPeaks)
Calculates the forecasted spread using elapsed time and dynamic multipliers, handling spread's non-linear nature.
Parameters:
multiplierAtMidpoints (float) : (float) The multiplier value at midpoints.
multiplierAtPeaks (float) : (float) The multiplier value at peaks.
Returns: (float) The forecasted spread value.
calcForecastedVolume()
Calculates the forecasted volume using elapsed time, satisfying volume's linear nature.
Returns: (float) The forecasted volume value.
calcForecastedMA(_source, _length, _forecastedSource, _type)
Calculates the forecasted Moving Average (MA) based on the specified type.
Parameters:
_source (float) : (series float) Source data for calculation.
_length (simple int) : (int) The length of the MA.
_forecastedSource (float) : (float) The forecasted level to include in the calculation.
_type (simple string) : (string) The type of the MA ("SMA", "EMA", "SMMA (RMA)", "WMA").
Returns: (float) The forecasted MA value.
calcMA(_source, _length, _type)
Calculates the Moving Average (MA) based on the specified type.
Parameters:
_source (float) : (series float) Source data for calculation.
_length (simple int) : (int) The length of the MA.
_type (simple string) : (string) The type of the MA ("SMA", "EMA", "SMMA (RMA)", "WMA").
Returns: (float) The MA value.
bullBar(_barIndex)
Determines if the bar is bullish.
Parameters:
_barIndex (simple int) : (int) The index of the bar.
Returns: (bool) True if the bar is bullish, otherwise false.
bearBar(_barIndex)
Determines if the bar is bearish.
Parameters:
_barIndex (simple int) : (int) The index of the bar.
Returns: (bool) True if the bar is bearish, otherwise false.
breakout(_barIndex)
Determines if there is a breakout above the previous bar.
Parameters:
_barIndex (simple int) : (int) The index of the bar.
Returns: (bool) True if there is a breakout, otherwise false.
breakdown(_barIndex)
Determines if there is a breakdown below the previous bar.
Parameters:
_barIndex (simple int) : (int) The index of the bar.
Returns: (bool) True if there is a breakdown, otherwise false.
rejectionWickUpper(_rejectionWick)
Determines if the upper wick is a rejection wick.
Parameters:
_rejectionWick (simple float) : (float) The rejection wick percentage.
Returns: (bool) True if the upper wick is a rejection wick, otherwise false.
rejectionWickLower(_rejectionWick)
Determines if the lower wick is a rejection wick.
Parameters:
_rejectionWick (simple float) : (float) The rejection wick percentage.
Returns: (bool) True if the lower wick is a rejection wick, otherwise false.
setupDataVolume(_data, _mult_Low, _mult_High, _mult_Ultra, _maLengthVolume, _maTypeVolume)
Sets up data for volume levels.
Parameters:
_data (map) : (map) The map to store the levels.
_mult_Low (simple float) : (float) The multiplier for low level.
_mult_High (simple float) : (float) The multiplier for high level.
_mult_Ultra (simple float) : (float) The multiplier for ultra level.
_maLengthVolume (simple int) : (int) The length for MA.
_maTypeVolume (simple string) : (string) The type for MA.
Returns: (void) Nothing.
setupDataSpread(_data, _mult_Low, _mult_High, _mult_Ultra, _maLengthSpread, _maTypeSpread)
Sets up data for spread levels.
Parameters:
_data (map) : (map) The map to store the levels.
_mult_Low (simple float) : (float) The multiplier for low level.
_mult_High (simple float) : (float) The multiplier for high level.
_mult_Ultra (simple float) : (float) The multiplier for ultra level.
_maLengthSpread (simple int) : (int) The length for MA.
_maTypeSpread (simple string) : (string) The type for MA.
Returns: (void) Nothing.
setupDataForecastVolume(_dataForecast, _mult_Low, _mult_High, _mult_Ultra, _maLengthVolume, _predictedLevelVolume, _maTypeVolume)
Sets up data for volume and spread levels for forecast.
Parameters:
_dataForecast (map)
_mult_Low (simple float) : (float) The multiplier for low level.
_mult_High (simple float) : (float) The multiplier for high level.
_mult_Ultra (simple float) : (float) The multiplier for ultra level.
_maLengthVolume (simple int) : (int) The length for MA.
_predictedLevelVolume (float) : (float) The predicted level for MA.
_maTypeVolume (simple string) : (string) The type for MA.
Returns: (void) Nothing.
setupDataForecastSpread(_dataForecast, _mult_Low, _mult_High, _mult_Ultra, _maLengthSpread, _predictedLevelSpread, _maTypeSpread)
Sets up data for spread levels for forecast.
Parameters:
_dataForecast (map)
_mult_Low (simple float) : (float) The multiplier for low level.
_mult_High (simple float) : (float) The multiplier for high level.
_mult_Ultra (simple float) : (float) The multiplier for ultra level.
_maLengthSpread (simple int) : (int) The length for MA.
_predictedLevelSpread (float) : (float) The predicted level for MA.
_maTypeSpread (simple string) : (string) The type for MA.
Returns: (void) Nothing.
isVolumeLow(_data, _barIndex)
Determines if the volume is low.
Parameters:
_data (map) : (map) The data map with volume levels.
_barIndex (int)
Returns: (bool) True if the volume is low, otherwise false.
isVolumeNormal(_data, _barIndex)
Determines if the volume is normal.
Parameters:
_data (map) : (map) The data map with volume levels.
_barIndex (int)
Returns: (bool) True if the volume is normal, otherwise false.
isVolumeHigh(_data, _barIndex)
Determines if the volume is high.
Parameters:
_data (map) : (map) The data map with volume levels.
_barIndex (int)
Returns: (bool) True if the volume is high, otherwise false.
isVolumeUltra(_data, _barIndex)
Determines if the volume is ultra.
Parameters:
_data (map) : (map) The data map with volume levels.
_barIndex (int)
Returns: (bool) True if the volume is ultra, otherwise false.
isSpreadLow(_data, _barIndex)
Determines if the spread is low.
Parameters:
_data (map) : (map) The data map with spread levels.
_barIndex (int)
Returns: (bool) True if the spread is low, otherwise false.
isSpreadNormal(_data, _barIndex)
Determines if the spread is normal.
Parameters:
_data (map) : (map) The data map with spread levels.
_barIndex (int)
Returns: (bool) True if the spread is normal, otherwise false.
isSpreadHigh(_data, _barIndex)
Determines if the spread is high.
Parameters:
_data (map) : (map) The data map with spread levels.
_barIndex (int)
Returns: (bool) True if the spread is high, otherwise false.
isSpreadUltra(_data, _barIndex)
Determines if the spread is ultra.
Parameters:
_data (map) : (map) The data map with spread levels.
_barIndex (int)
Returns: (bool) True if the spread is ultra, otherwise false.
isVolumeText(_data)
Determines text string representing the volume area level.
Parameters:
_data (map) : (map) The data map with volume levels.
Returns: (string) Text string of Low, Normal, High, or Ultra.
isSpreadText(_data)
Determines text string representing the spread area level.
Parameters:
_data (map) : (map) The data map with spread levels.
Returns: (string) Text string of Low, Normal, High, or Ultra.
calcBarColor(_value, _level)
Calculates the color based level.
Parameters:
_value (float) : (float) The value to check.
_level (float) : (float) The value level for comparison.
Returns: (color) The color for the bar.
bullPinBar(_maxBodyPercent, _minWickPercent)
Determines if the bar is a bull pin bar.
Parameters:
_maxBodyPercent (simple float) : (float) The maximum body percentage.
_minWickPercent (simple float) : (float) The minimum wick percentage.
Returns: (bool) True if the bar is a bull pin bar, otherwise false.
bearPinBar(_maxBodyPercent, _minWickPercent)
Determines if the bar is a bear pin bar.
Parameters:
_maxBodyPercent (simple float) : (float) The maximum body percentage.
_minWickPercent (simple float) : (float) The minimum wick percentage.
Returns: (bool) True if the bar is a bear pin bar, otherwise false.
dojiBar(_maxBodyPercent)
Determines if the bar is a doji.
Parameters:
_maxBodyPercent (simple float) : (float) The maximum body percentage.
Returns: (bool) True if the bar is a doji, otherwise false.
spinningTopBar(_minWicksPercent, _emaLength)
Determines if the bar is a spinning top.
Parameters:
_minWicksPercent (simple float) : (float) The minimum wicks percentage.
_emaLength (simple int) : (int) The length for EMA calculation.
Returns: (bool) True if the bar is a spinning top, otherwise false.
highWaveBar(_minBodyPercent, _minWickPercent, _bars)
Determines if the bar is a high wave bar.
Parameters:
_minBodyPercent (simple float) : (float) The minimum body percentage.
_minWickPercent (simple float) : (float) The minimum wick percentage.
_bars (simple int) : (int) The number of bars for comparison.
Returns: (bool) True if the bar is a high wave bar, otherwise false.
consolidationBar(_data, _spread, _bars)
Determines if the bars are in consolidation.
Parameters:
_data (map) : (map) The data map with spread levels.
_spread (simple float) : (float) The spread percentage for comparison.
_bars (simple int) : (int) The number of bars for comparison.
Returns: (bool) True if the bars are in consolidation, otherwise false.
S_DownThrust(_data, _bullPinBarMaxBody, _bullPinBarMinWick)
Determines if there is a sign of strength (DownThrust).
Parameters:
_data (map) : (map) The data map with volume and spread levels.
_bullPinBarMaxBody (simple float) : (float) The maximum body percentage for bull pin bar.
_bullPinBarMinWick (simple float) : (float) The minimum wick percentage for bull pin bar.
Returns: (bool) True if there is a sign of strength (DownThrust), otherwise false.
S_SellingClimax(_data, _rejectionWick)
Determines if there is a sign of strength (Selling Climax).
Parameters:
_data (map) : (map) The data map with volume and spread levels.
_rejectionWick (simple float) : (float) The rejection wick percentage.
Returns: (bool) True if there is a sign of strength (Selling Climax), otherwise false.
S_NoEffortBearishResult()
Determines if there is a sign of strength (No Effort Bearish Result).
Returns: (bool) True if there is a sign of strength (No Effort Bearish Result), otherwise false.
S_BearishEffortNoResult()
Determines if there is a sign of strength (Bearish Effort No Result).
Returns: (bool) True if there is a sign of strength (Bearish Effort No Result), otherwise false.
S_InverseDownThrust(_data, _bearPinBarMaxBody, _bearPinBarMinWick)
Determines if there is a sign of strength (Inverse DownThrust).
Parameters:
_data (map) : (map) The data map with volume and spread levels.
_bearPinBarMaxBody (simple float) : (float) The maximum body percentage for bear pin bar.
_bearPinBarMinWick (simple float) : (float) The minimum wick percentage for bear pin bar.
Returns: (bool) True if there is a sign of strength (Inverse DownThrust), otherwise false.
S_FailedSellingClimax()
Determines if there is a sign of strength (Failed Selling Climax).
Returns: (bool) True if there is a sign of strength (Failed Selling Climax), otherwise false.
S_BullOutsideReversal(_data)
Determines if there is a sign of strength (Bull Outside Reversal).
Parameters:
_data (map) : (map) The data map with volume and spread levels.
Returns: (bool) True if there is a sign of strength (Bull Outside Reversal), otherwise false.
S_EndOfFallingMarket(_data)
Determines if there is a sign of strength (End of Falling Market).
Parameters:
_data (map) : (map) The data map with volume and spread levels.
Returns: (bool) True if there is a sign of strength (End of Falling Market), otherwise false.
S_PseudoDownThrust(_bullPinBarMaxBody, _bullPinBarMinWick)
Determines if there is a sign of strength (Pseudo DownThrust).
Parameters:
_bullPinBarMaxBody (simple float) : (float) The maximum body percentage for bull pin bar.
_bullPinBarMinWick (simple float) : (float) The minimum wick percentage for bull pin bar.
Returns: (bool) True if there is a sign of strength (Pseudo DownThrust), otherwise false.
S_NoSupply(_bullPinBarMaxBody, _bullPinBarMinWick)
Determines if there is a sign of strength (No Supply).
Parameters:
_bullPinBarMaxBody (simple float) : (float) The maximum body percentage for bull pin bar.
_bullPinBarMinWick (simple float) : (float) The minimum wick percentage for bull pin bar.
Returns: (bool) True if there is a sign of strength (No Supply), otherwise false.
W_UpThrust(_data, _bearPinBarMaxBody, _bearPinBarMinWick)
Determines if there is a sign of weakness (UpThrust).
Parameters:
_data (map) : (map) The data map with volume and spread levels.
_bearPinBarMaxBody (simple float) : (float) The maximum body percentage for bear pin bar.
_bearPinBarMinWick (simple float) : (float) The minimum wick percentage for bear pin bar.
Returns: (bool) True if there is a sign of weakness (UpThrust), otherwise false.
W_BuyingClimax(_data, _rejectionWick)
Determines if there is a sign of weakness (Buying Climax).
Parameters:
_data (map) : (map) The data map with volume and spread levels.
_rejectionWick (simple float) : (float) The rejection wick percentage.
Returns: (bool) True if there is a sign of weakness (Buying Climax), otherwise false.
W_NoEffortBullishResult()
Determines if there is a sign of weakness (No Effort Bullish Result).
Returns: (bool) True if there is a sign of weakness (No Effort Bullish Result), otherwise false.
W_BullishEffortNoResult()
Determines if there is a sign of weakness (Bullish Effort No Result).
Returns: (bool) True if there is a sign of weakness (Bullish Effort No Result), otherwise false.
W_InverseUpThrust(_data, _bullPinBarMaxBody, _bullPinBarMinWick)
Determines if there is a sign of weakness (Inverse UpThrust).
Parameters:
_data (map) : (map) The data map with volume and spread levels.
_bullPinBarMaxBody (simple float) : (float) The maximum body percentage for bull pin bar.
_bullPinBarMinWick (simple float) : (float) The minimum wick percentage for bull pin bar.
Returns: (bool) True if there is a sign of weakness (Inverse UpThrust), otherwise false.
W_FailedBuyingClimax()
Determines if there is a sign of weakness (Failed Buying Climax).
Returns: (bool) True if there is a sign of weakness (Failed Buying Climax), otherwise false.
W_BearOutsideReversal(_data)
Determines if there is a sign of weakness (Bear Outside Reversal).
Parameters:
_data (map) : (map) The data map with volume and spread levels.
Returns: (bool) True if there is a sign of weakness (Bear Outside Reversal), otherwise false.
W_EndOfRisingMarket(_data)
Determines if there is a sign of weakness (End of Rising Market).
Parameters:
_data (map) : (map) The data map with volume and spread levels.
Returns: (bool) True if there is a sign of weakness (End of Rising Market), otherwise false.
W_PseudoUpThrust(_bearPinBarMaxBody, _bearPinBarMinWick)
Determines if there is a sign of weakness (Pseudo UpThrust).
Parameters:
_bearPinBarMaxBody (simple float) : (float) The maximum body percentage for bear pin bar.
_bearPinBarMinWick (simple float) : (float) The minimum wick percentage for bear pin bar.
Returns: (bool) True if there is a sign of weakness (Pseudo UpThrust), otherwise false.
W_NoDemand(_bearPinBarMaxBody, _bearPinBarMinWick)
Determines if there is a sign of weakness (No Demand).
Parameters:
_bearPinBarMaxBody (simple float) : (float) The maximum body percentage for bear pin bar.
_bearPinBarMinWick (simple float) : (float) The minimum wick percentage for bear pin bar.
Returns: (bool) True if there is a sign of weakness (No Demand), otherwise false.
N_QuietDoji(_dojiBarMaxBody)
Determines if there is a neutral signal (Quiet Doji).
Parameters:
_dojiBarMaxBody (simple float) : (float) The maximum body percentage for doji bar.
Returns: (bool) True if there is a neutral signal (Quiet Doji), otherwise false.
N_BalancedDoji(_data, _dojiBarMaxBody)
Determines if there is a neutral signal (Balanced Doji).
Parameters:
_data (map) : (map) The data map with volume and spread levels.
_dojiBarMaxBody (simple float) : (float) The maximum body percentage for doji bar.
Returns: (bool) True if there is a neutral signal (Balanced Doji), otherwise false.
N_StrongDoji(_dojiBarMaxBody)
Determines if there is a neutral signal (Strong Doji).
Parameters:
_dojiBarMaxBody (simple float) : (float) The maximum body percentage for doji bar.
Returns: (bool) True if there is a neutral signal (Strong Doji), otherwise false.
N_QuietSpinningTop(_spinningTopBarMinWicks, _spinningTopBarEmaLength)
Determines if there is a neutral signal (Quiet Spinning Top).
Parameters:
_spinningTopBarMinWicks (simple float) : (float) The minimum wicks percentage for spinning top bar.
_spinningTopBarEmaLength (simple int) : (int) The length for EMA calculation.
Returns: (bool) True if there is a neutral signal (Quiet Spinning Top), otherwise false.
N_BalancedSpinningTop(_data, _spinningTopBarMinWicks, _spinningTopBarEmaLength)
Determines if there is a neutral signal (Balanced Spinning Top).
Parameters:
_data (map) : (map) The data map with volume and spread levels.
_spinningTopBarMinWicks (simple float) : (float) The minimum wicks percentage for spinning top bar.
_spinningTopBarEmaLength (simple int) : (int) The length for EMA calculation.
Returns: (bool) True if there is a neutral signal (Balanced Spinning Top), otherwise false.
N_StrongSpinningTop(_spinningTopBarMinWicks, _spinningTopBarEmaLength)
Determines if there is a neutral signal (Strong Spinning Top).
Parameters:
_spinningTopBarMinWicks (simple float) : (float) The minimum wicks percentage for spinning top bar.
_spinningTopBarEmaLength (simple int) : (int) The length for EMA calculation.
Returns: (bool) True if there is a neutral signal (Strong Spinning Top), otherwise false.
N_QuietHighWave(_highWaveBarMinBody, _highWaveBarMinWick, _highWaveBarBars)
Determines if there is a neutral signal (Quiet High Wave).
Parameters:
_highWaveBarMinBody (simple float) : (float) The minimum body percentage for high wave bar.
_highWaveBarMinWick (simple float) : (float) The minimum wick percentage for high wave bar.
_highWaveBarBars (simple int) : (int) The number of bars for comparison.
Returns: (bool) True if there is a neutral signal (Quiet High Wave), otherwise false.
N_BalancedHighWave(_data, _highWaveBarMinBody, _highWaveBarMinWick, _highWaveBarBars)
Determines if there is a neutral signal (Balanced High Wave).
Parameters:
_data (map) : (map) The data map with volume and spread levels.
_highWaveBarMinBody (simple float) : (float) The minimum body percentage for high wave bar.
_highWaveBarMinWick (simple float) : (float) The minimum wick percentage for high wave bar.
_highWaveBarBars (simple int) : (int) The number of bars for comparison.
Returns: (bool) True if there is a neutral signal (Balanced High Wave), otherwise false.
N_StrongHighWave(_highWaveBarMinBody, _highWaveBarMinWick, _highWaveBarBars)
Determines if there is a neutral signal (Strong High Wave).
Parameters:
_highWaveBarMinBody (simple float) : (float) The minimum body percentage for high wave bar.
_highWaveBarMinWick (simple float) : (float) The minimum wick percentage for high wave bar.
_highWaveBarBars (simple int) : (int) The number of bars for comparison.
Returns: (bool) True if there is a neutral signal (Strong High Wave), otherwise false.
N_Consolidation(_data, _consolidationBarSpread, _consolidationBarBars)
Determines if there is a neutral signal (Consolidation).
Parameters:
_data (map) : (map) The data map with volume and spread levels.
_consolidationBarSpread (simple float) : (float) The spread percentage for consolidation bar.
_consolidationBarBars (simple int) : (int) The number of bars for comparison.
Returns: (bool) True if there is a neutral signal (Consolidation), otherwise false.

Trend Angle IndicatorTrend Angle Indicator
Description
The Trend Angle Indicator is designed to measure the strength of a trend by calculating the angle of the trend.
Specifically, it computes the angle of a Simple Moving Average (SMA) over a specified length and then applies
an Exponential Moving Average (EMA) to the angle for smoothing.
This approach provides a clear indication of the trend's direction and intensity.
It also includes customizable alerts for significant changes in the trend angle and zero-line crossings,
making it a robust tool for traders seeking to gauge market momentum.
Key Features
- **Trend Angle Calculation**: Measures the trend's angle, providing insights into trend direction and strength.
- **SMA and EMA**: Uses SMA for the base calculation and EMA for smoothening the angle values.
- **Visual Trend Indication**: Visually indicates uptrends and downtrends with customizable colors - red and green.
- **Alerts**: Configurable alerts for significant changes in trend angle and zero-line crossings.
Calculation Methodology
1. **Simple Moving Average (SMA):**
- The script calculates the SMA of the close price over a user-defined `input_length`.
2. **Angle Calculation:**
- The height of the trend is calculated by subtracting the SMA value from the SMA value `input_length` bars ago. A higher angle value indicates a stronger trend.
- The angle in degrees is obtained using the arctangent function: \
3. **Exponential Moving Average (EMA):**
- Applies an EMA to the calculated angle to smooth out the values based on a user-defined `input_ma_length`.
4. **Trend Detection:**
The color of the angle plot and filled area provide a quick visual representation of the current trend direction
- The trend angle changes are monitored and visualized with color-coded plots.
- Uptrend: Angle >= 0 uses `upColor` (green).
- Downtrend: Angle < 0 uses `downColor` (red).
#### Using the Indicator
1. **Adding the Indicator:**
- Add the indicator to your TradingView chart by selecting it from the Pine Script library or by pasting the script into the Pine Script editor.
2. **Inputs:**
- **Length**: Defines the period for the SMA calculation.
- **MA Length**: Sets the period for the EMA smoothing.
- **Angle Change Threshold (degrees)**: Defines the threshold for significant angle change alerts.
- **Color Candles**: Optionally colorizes the price candles based on the angle's trend direction.
3. **Customizing Plots:**
- **Angle Plot**: Displays the EMA of the trend angle. The color changes based on whether the trend is up or down.
- **Zero Line**: A horizontal line at zero to easily visualize crossings that signify a change in trend direction.
- **Fill Color**: Fills the area above/below the zero line with colors representing the direction of the trend.
4. **Setting Alerts:**
- **Cross Above Zero**: Triggers an alert when the trend angle crosses above zero, indicating a potential start of an uptrend.
- **Cross Below Zero**: Triggers an alert when the trend angle crosses below zero, indicating a potential start of a downtrend.
- **Significant Angle Change**: Alerts when the angle change exceeds the user-defined threshold, highlighting significant trend changes.
#### Example Usage
To use and customize the Trend Angle Indicator on your chart:
1. **Add to Chart**: Apply the indicator from the TradingView library or by pasting the script into the Pine Script editor.
2. **Configure Inputs**:
- Adjust the `Length` to set the period for the SMA.
- Set the `MA Length` for the EMA smoothing.
- Define the `Angle Change Threshold` for receiving alerts on significant changes.
3. **Display Customization**:
- Enable `Color Candles` to have the price candles reflect the trend direction.
4. **Set Alerts**:
- Use the alert conditions provided to get notified about critical events like zero line crossings or significant angle changes.
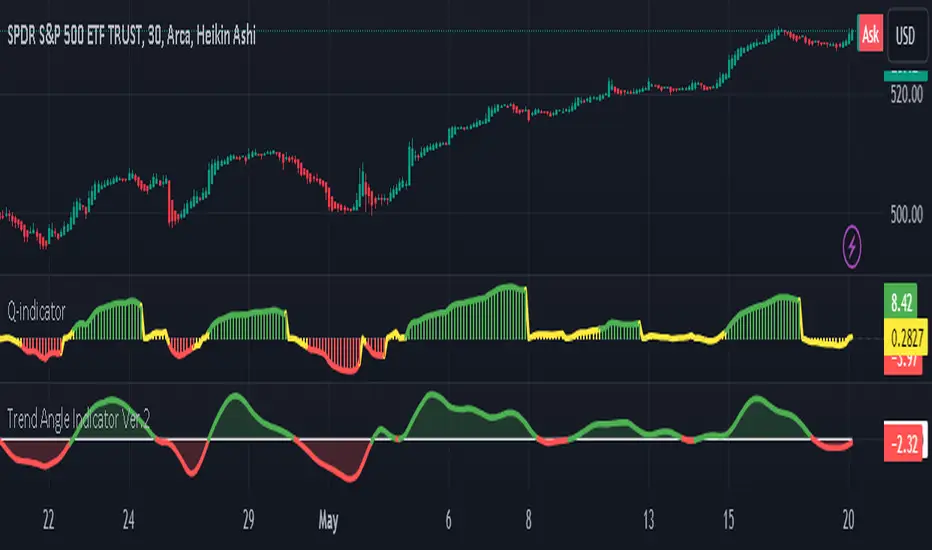
Bitcoin Halving Dates + CountdownBitcoin Halving Dates + Countdown Indicator
This unique TradingView Indicator is designed to provide traders and cryptocurrency enthusiasts with critical information about the Bitcoin halving events directly on their charts. Bitcoin halving is a significant event that reduces the reward for mining Bitcoin transactions by half, an occurrence that happens approximately every four years and is known to impact Bitcoin's price significantly.
Features:
▪ Halving Date Lines: The indicator plots vertical lines on the chart at the dates of past and the upcoming Bitcoin halving events.
Customizable Appearance: Users can personalize the look of the indicator with options to change the color of the halving lines, label background, and text for better visibility against their chart theme.
▪ Halving Event Labels: Each halving event is marked with a label indicating its sequence (e.g., 1st Halving) and the exact date it occurred or is expected to occur.
Countdown to Next Halving: For the upcoming halving event, the indicator displays a countdown in days, hours, minutes, and seconds, helping users anticipate the event with precise timing.
▪ User-friendly Options: Toggle the visibility of labels for a cleaner chart appearance and customize color schemes to match personal preferences or chart themes.
Usage:
This indicator is invaluable for those looking to understand Bitcoin's historical halving events and their timing in relation to price movements. It's also perfect for preparing for the next halving event, as the countdown feature provides a clear and timely reminder.
Customization Options:
▪ Show Labels: Toggle on/off the visibility of halving event labels.
Line Color: Choose the color of the vertical lines marking each halving event.
Label Background Color & Text Color: Customize the background and text color of the labels for better readability.
▪ Countdown Label Colors: Separate customization options for the countdown label's background and text colors, allowing for clear visibility and distinction from other chart elements.
Enhance your chart with this indicator and trade with more context and anticipation towards the future of Bitcoin.
IBIT Premium to CoinbaseThe BTC ETF premium indicator for TradingView is a specialized tool designed to measure and visualize the premium or discount of the iShares Bitcoin Trust (IBIT), an investment vehicle that holds Bitcoin, relative to the actual price of Bitcoin on the Coinbase exchange. This indicator can be particularly insightful for traders interested in the BTC securities market and those analyzing the demand for Bitcoin as reflected by institutional investment products.
#### Description:
The BTC ETF premium indicator in TradingView leverages an advanced Pine Script algorithm to calculate the premium (or discount) percentage of IBIT compared to the spot price of Bitcoin (BTC/USD) on Coinbase. The premium is a critical insight that reflects market sentiment and potentially arbitrage opportunities between the trust's share price and the underlying cryptocurrency asset.
Here's how the indicator works:
1. **Calculation Methodology:**
- **Implied Bitcoin Price of IBIT:** We determine the implied price of Bitcoin within IBIT by dividing the IBIT closing price by the known ratio of Bitcoin per share.
- **IBIT Premium to Coinbase:** The percentage premium is then calculated as:
$$\text{IBIT Premium} = \frac{(\text{Implied Bitcoin Price of IBIT } - \text{Actual Bitcoin Price on Coinbase})}{\text{Actual Bitcoin Price on Coinbase}} \times 100$$
- This calculation is performed using the closing prices on a per-minute basis to ensure timely and accurate analysis.
2. **Visualization:** The indicator plots the premium as a step line chart, making it easy to visualize changes over time. A dynamic label accompanies the plot, displaying the implied Bitcoin price, the actual percentage premium or discount, and whether the premium is trending up or down compared to the previous day's value.
3. **Usage Scenario:** Traders can use this indicator to monitor the live premium 24/7 and analyze how it behaves during different market conditions, including when the equity market, where IBIT is traded, is closed.
#### Additional Features:
- **Color-Coding:** The premium is color-coded in green when positive (premium) and in red when negative (discount), aiding quick visual assessment.
- **Zero-Line Reference:** A horizontal line is drawn at zero to easily identify when IBIT is trading at par with the spot price of Bitcoin.
- **Real-Time Label Updates:** The label updates in real time with the latest premium/discount information and includes an arrow to signify the trend direction.
#### Access and Usage:
The indicator can be favorited or added to your TradingView charts. You are also welcome to use the source code as a foundation for further customization to suit your trading strategies.
#### Notes:
Please consider that the IBIT has specific trading hours, and the indicator can show live changes even when its market is closed, which might lead to discrepancies from official static data. For best performance, use this indicator alongside the IBIT candlestick chart on TradingView.
GBTC Premium to CoinbaseThe BTC ETF premium indicator for TradingView is a specialized tool designed to measure and visualize the premium or discount of the Grayscale Bitcoin Trust (GBTC), an investment vehicle that holds Bitcoin, relative to the actual price of Bitcoin on the Coinbase exchange. This indicator can be particularly insightful for traders interested in the BTC securities market and those analyzing the demand for Bitcoin as reflected by institutional investment products.
#### Description:
The BTC ETF premium indicator in TradingView leverages an advanced Pine Script algorithm to calculate the premium (or discount) percentage of GBTC compared to the spot price of Bitcoin (BTC/USD) on Coinbase. The premium is a critical insight that reflects market sentiment and potentially arbitrage opportunities between the trust's share price and the underlying cryptocurrency asset.
Here's how the indicator works:
1. **Calculation Methodology:**
- **Implied Bitcoin Price of GBTC:** We determine the implied price of Bitcoin within GBTC by dividing the GBTC closing price by the known ratio of Bitcoin per share.
- **GBTC Premium to Coinbase:** The percentage premium is then calculated as:
$$\text{GBTC Premium} = \frac{(\text{Implied Bitcoin Price of GBTC} - \text{Actual Bitcoin Price on Coinbase})}{\text{Actual Bitcoin Price on Coinbase}} \times 100$$
- This calculation is performed using the closing prices on a per-minute basis to ensure timely and accurate analysis.
2. **Visualization:** The indicator plots the premium as a step line chart, making it easy to visualize changes over time. A dynamic label accompanies the plot, displaying the implied Bitcoin price, the actual percentage premium or discount, and whether the premium is trending up or down compared to the previous day's value.
3. **Usage Scenario:** Traders can use this indicator to monitor the live premium 24/7 and analyze how it behaves during different market conditions, including when the equity market, where GBTC is traded, is closed.
#### Additional Features:
- **Color-Coding:** The premium is color-coded in green when positive (premium) and in red when negative (discount), aiding quick visual assessment.
- **Zero-Line Reference:** A horizontal line is drawn at zero to easily identify when GBTC is trading at par with the spot price of Bitcoin.
- **Real-Time Label Updates:** The label updates in real time with the latest premium/discount information and includes an arrow to signify the trend direction.
#### Access and Usage:
The indicator can be favorited or added to your TradingView charts. You are also welcome to use the source code as a foundation for further customization to suit your trading strategies.
#### Notes:
Please consider that the GBTC has specific trading hours, and the indicator can show live changes even when its market is closed, which might lead to discrepancies from official static data. For best performance, use this indicator alongside the GBTC candlestick chart on TradingView.

Smart Money Oscillator [ChartPrime]The "Smart Money Oscillator " is a premium and discount zone oscillator with BOS and CHoCH built in for further analysis of price action. This indicator works by first determining the the premium and discount zones by using pivot points and high/lows. The top of this oscillator represents the current premium zone while the bottom half of this oscillator represents the discount zone. This oscillator functionally works like a stochastic oscillator with more sophisticated upper and lower bounds generated using smart money concept theories. We have included a moving average to allow the user to visualize the currant momentum in the oscillator. Another key feature we have included lagging divergences to help traders visualize potential reversal conditions.
Understanding the concepts of Premium and Discount zones, as well as Break of Structure (BoS) and Change of Character (CHoCH), is crucial for traders using the Smart Money Oscillator. These concepts are rooted in market structure analysis, which involves studying price levels and movements.
Premium Zone is where the price is considered to be relatively high or 'overbought'. In this zone, prices have risen significantly and may indicate that the asset is becoming overvalued, potentially leading to a reversal or slowdown in the upward trend.
The Discount Zone represents a 'discount' or 'oversold' area. Here, prices have fallen substantially, suggesting that the asset might be undervalued. This could be an indicator of a potential upward reversal or a pause in the downward trend.
Break of Structure (BoS) is about the continuation of a trend. In a bullish trend, a BoS is identified by the break of a recent higher high. In a bearish trend, it's the break of a recent Lower Low. BoS indicates that the trend is strong and likely to continue in its current direction. It's a sign of strength in the prevailing trend, whether up or down.
Change of Character (CHoCH) is an indication of a potential end to a trend. It occurs when there's a significant change in the market's behavior, contradicting the current trend. For example, in an uptrend characterized by higher highs and higher lows, a CHoCH may occur if a new high is formed but then is followed by an impulsive move downwards. This suggests that the bullish trend may be weakening and a bearish reversal could be imminent. CHoCH is essentially a sign of trend exhaustion and potential reversal.
With each consecutive BoS, the signal line of the oscillator will deepen in color. This allows you to visually see the strength of the current trend. The maximum strength of the trend is found by keeping track of the maximum number of consecutive BoS's within a window of 10. This calculation excludes periods without any BoS's to allow for a more stable max.
Quick Update is a feature that implements a more aggressive algorithm to update the highs and lows. Instead of updating the pivot points exclusively to update the range levels, it will attempt to use the current historical highs/lows to update the bounds. This results in a more responsive range at the cost of stability. There are pros and cons for both settings. With Quick Update disabled, the indicator will allow for strong reversals to register without the indicator maxing out. With Quick Update enabled, the indicator will show shorter term extremes with the risk of the signal being pinned to the extremities during strong trends or large movements. With Quick Update disabled, the oscillator prioritizes stability, using a more historical perspective to set its bounds. When Quick Update is enabled, the oscillator becomes more responsive, adjusting its bounds rapidly to reflect the latest market movements.
The Scale Offset feature allows the indicator to break the boundaries of the oscillator. This can be useful when the market is breaking highs or lows allowing the user to identify extremities in price. With Scale Offset disabled the oscillator will always remain inside of the boundaries because the extremities will be updated instantly. When this feature is enabled it will update the boundaries one step behind instead of updating it instantly. This allows the user to more easily see overbought and oversold conditions at the cost of incurring a single bar lag to the boundaries. Generally this is a good idea as this behavior makes the oscillator more sensitive to recent price spikes or drops, reflecting sudden market movements more accurately. It accentuates the extremities of the market conditions, potentially offering a more aggressive analysis. The main trade-off with the Scale Offset feature is between sensitivity and potential overreaction. It offers a more immediate and exaggerated reflection of market conditions but might also lead to misinterpretations in certain scenarios, especially in highly volatile markets.
Divergence is used to predict potential trend reversals. It occurs when the price of an asset and the reading of an oscillator move in opposite directions. This discrepancy can signal a weakening of the current trend and possibly indicate a potential reversal.
Divergence doesn't always lead to a trend reversal, but it's a warning sign that the current trend might be weakening. Divergence can sometimes give false signals, particularly in strongly trending markets where the oscillator may remain in overbought or oversold conditions for extended periods. The lagging nature of using pivot points to calculate divergences means that all divergences are limited by the pivot look forward input. The upside of using a longer look forward is that the divergences will be more accurate. The obvious con here is that it will be more delayed and might be useless by the time it appears. Its recommended to use the built in divergences as a way to learn how these are formed so you can make your own in real time.
By default, the oscillator uses a smoothing of 3 to allow for a more price like behavior while still being rather smooth compared to raw price data. Conversely, you can increase this value to make this indicator behave smoother. Something to keep in mind is that the amount of delay from real time is equal to half of the smoothing period.
We have included a verity of alerts in this indicator. Here is a list of all of the available alerts: Bullish BOS, Bearish BOS, Bullish CHoCH, Bearish CHoCH, Bullish Divergence, Hidden Bullish Divergence, Bearish Divergence, Hidden Bearish Divergence, Cross Over Average, Cross Under Average.
Below are all of the inputs and their tooltips to get you started:
Settings:
Smoothing: Specifies the degree of smoothing applied to the oscillator. Higher values result in smoother but potentially less responsive signals.
Average Length: Sets the length of the moving average applied to the oscillator, affecting its sensitivity and smoothness.
Pivot Length: Specifies the forward-looking length for pivot points, affecting how the oscillator anticipates future price movements. This directly impacts the delay in finding a pivot.
Max Length: Sets the maximum length to consider for calculating the highest values in the oscillator.
Min Length: Defines the minimum length for calculating the lowest values in the oscillator.
Quick Update: Activates a faster update mode for the oscillator's extremities, which may result in less stable range boundaries.
Scale Offset: When enabled, delays updating minimum and maximum values to enhance signal directionality, allowing the signal to occasionally exceed normal bounds.
Candle Color: Enables coloring of candles based on the current directional signal of the oscillator.
Labels:
Enable BOS/CHoCH Labels: Activates the display of BOS (Break of Structure) and CHoCH (Change of Character) labels on the chart.
Visual Padding: Turns on additional visual padding at the top and bottom of the chart to accommodate labels. Determines the amount of visual padding added to the chart for label display.
Divergence:
Divergence Pivot: Defines the number of bars to the right of the pivot in divergence calculations, influencing the oscillator's responsiveness.
Divergence Pivot Forward: Directly impacts latency. Longer periods results in more accurate results at the sacrifice of delay.
Upper Range: Sets the upper range limit for divergence calculations, influencing the oscillator's sensitivity to larger trends.
Lower Range: Determines the lower range limit for divergence calculations, affecting the oscillator's sensitivity to shorter trends.
Symbol: Allows selection of the label style for divergence indicators, with options for text or symbolic representation.
Regular Bullish: Activates the detection and marking of regular bullish divergences in the oscillator.
Hidden Bullish: Enables the identification and display of hidden bullish divergences.
Regular Bearish: Turns on the feature to detect and highlight regular bearish divergences.
Hidden Bearish: Activates the functionality for detecting and displaying hidden bearish divergences.
Color:
Bullish: Determines the minimum/maximum color gradient for bullish signals, impacting the chart's visual appearance.
Bearish: Defines the minimum/maximum color gradient for bearish signals, affecting their visual representation.
Average: Specifies the color for the average line of the oscillator, enhancing chart readability.
CHoCH: Sets the color for bullish/bearish CHoCH (Change of Character) signals.
Premium/Discount: Determines the color for the premium/discount zone in the oscillator's visual representation.
Text Color: Sets the color for the text in BoS/CHoCH labels.
Regular Bullish: Defines the color used to represent regular bullish divergences.
Hidden Bullish: Specifies the color for hidden bullish divergences.
Regular Bearish: Determines the color for hidden bearish divergences.
Divergence Text Color: Specifies the color for the text in divergence labels.

Liquidations Meter [LuxAlgo]The Liquidation Meter aims to gauge the momentum of the bar, identify the strength of the bulls and bears, and more importantly identify probable exhaustion/reversals by measuring probable liquidations.
🔶 USAGE
This tool includes many features related to the concept of liquidation. The two core ones are the liquidation meter and liquidation price calculator, highlighted below.
🔹 Liquidation Meter
The liquidation meter presents liquidations on the price chart by measuring the highest leverage value of longs and shorts that have been potentially liquidated on the last chart bar, hence allowing traders to:
gauge the momentum of the bar.
identify the strength of the bulls and bears.
identify probable reversal/exhaustion points.
Liquidation of low-leveraged positions can be indicative of exhaustion.
🔹 Liquidation Price Calculator
A liquidation price calculator might come in handy when you need to calculate at what price level your leveraged position in Crypto, Forex, Stocks, or any other asset class gets liquidated to add a protective stop to mitigate risk. Monitoring an open position gets easier if the trader can calculate the total risk in order for them to choose the right amount of margin and leverage.
Liquidation price is the distance from the trader's entry price to the price where trader's leveraged position gets liquidated due to a loss. As the leverage is increased, the distance from trader's entry price to the liquidation price shrinks.
While you have one or several trades open you can quickly check their liquidation levels and determine which one of the trades is closest to their liquidation price.
If you are a day trader that uses leverage and you want to know which trade has the best outlook you can calculate the liquidation price to see which one of the trades looks best.
🔹 Dashboard
The bar statistics option enables measuring and presenting trading activity, volatility, and probable liquidations for the last chart bar.
🔶 DETAILS
It's important to note that liquidation price calculator tool uses a formula to calculate the liquidation price based on the entry price + leverage ratio.
Other factors such as leveraged fees, position size, and other interest payments have been excluded since they are variables that don’t directly affect the level of liquidation of a leveraged position.
The calculator also assumes that traders are using an isolated margin for one single position and does not take into consideration the additional margin they might have in their account.
🔹Liquidation price formula
the liquidation distance in percentage = 100 / leverage ratio
the liquidation distance in price = current asset price x the liquidation distance in percentage
the liquidation price (longs) = current asset price – the liquidation distance in price
the liquidation price (shorts) = current asset price + the liquidation distance in price
or simply
the liquidation price (longs) = entry price * (1 – 1 / leverage ratio)
the liquidation price (shorts) = entry price * (1 + 1 / leverage ratio)
Example:
Let’s say that you are trading a leverage ratio of 1:20. The first step is to calculate the distance to your liquidation point in percentage.
the liquidation distance in percentage = 100 / 20 = 5%
Now you know that your liquidation price is 5% away from your entry price. Let's calculate 5% below and above the entry price of the asset you are currently trading. As an example, we assume that you are trading bitcoin which is currently priced at $35000.
the liquidation distance in price = $35000 x 0.05 = $1750
Finally, calculate liquidation prices.
the liquidation price (longs) = $35000 – $1750 = $33250
the liquidation price (short) = $35000 + $1750 = $36750
In this example, short liquidation price is $36750 and long liquidation price is $33250.
🔹How leverage ratio affects the liquidation price
The entry price is the starting point of the calculation and it is from here that the liquidation price is calculated, where the leverage ratio has a direct impact on the liquidation price since the more you borrow the less “wiggle-room” your trade has.
An increase in leverage will subsequently reduce the distance to full liquidation. On the contrary, choosing a lower leverage ratio will give the position more room to move on.
🔶 SETTINGS
🔹Liquidations Meter
Base Price: The option where to set the reference/base price.
🔹Liquidation Price Calculator
Liquidation Price Calculator: Toggles the visibility of the calculator. Details and assumptions made during the calculations are stated in the tooltip of the option.
Entry Price: The option where to set the entry price, a value of 0 will use the current closing price. Details are given in the tooltip of the option.
Leverage: The option where to set the leverage value.
Show Calculated Liquidation Prices on the Chart: Toggles the visibility of the liquidation prices on the price chart.
🔹Dashboard
Show Bar Statistics: Toggles the visibility of the last bar statistics.
🔹Others
Liquidations Meter Text Size: Liquidations Meter text size.
Liquidations Meter Offset: Liquidations Meter offset.
Dashboard/Calculator Placement: Dashboard/calculator position on the chart.
Dashboard/Calculator Text Size: Dashboard text size.
🔶 RELATED SCRIPTS
Here are some of the scripts that are related to the liquidation and liquidity concept, for more and other conceptual scripts you are kindly invited to visit LuxAlgo-Scripts .
Liquidation-Levels
Liquidations-Real-Time
Buyside-Sellside-Liquidity

Monte Carlo Simulation - Your Strategy [Kioseff Trading]Hello!
This script “Monte Carlo Simulation - Your Strategy” uses Monte Carlo simulations for your inputted strategy returns or the asset on your chart!
Features
Monte Carlo Simulation: Performs Monte Carlo simulation to generate multiple future paths.
Asset Price or Strategy: Can simulate either future asset prices based on historical log returns or a specific trading strategy's future performance.
User-Defined Input: Allows you to input your own historical returns for simulation.
Statistical Methods: Offers two simulation methods—Gaussian (Normal) distribution and Bootstrapping.
Graphical Display: Provides options for graphical representation, including line plots and histograms.
Cumulative Probability Target: Enables setting a user-defined cumulative probability target to quantify simulation results.
Adjustable Parameters: Offers numerous user-adjustable settings like number of simulations, forecast length, and more.
Historical Data Points: Option to specify the amount of historical data to be used in the simulation (price).
Custom Binning: Allows you to select the binning method for histograms, with options like Sturges, Rice, and Square Root.
Best/Worst Case: Allows you to show only the best case / worst case outcome (range) for all simulations!
Scatterplot: allows you to show up to 1000 potential outcomes for a specified trade number (or bars forward price endpoint) using a scatter plot.
The image above shows the primary components of the indicator!
The image above shows the best/worst case outcome feature in action!
The image above shows a "fun feature" where 1000 simulated end points for a 15-bar price trajectory are shown as a scatter plot!
How To Perform a Monte Carlo Simulation On Your Strategy
Really, you can input any data into the indicator it will perform a Monte Carlo Simulation on it :D
The following instructions show how to export your strategy results from TradingView to an Excel File, copy the data, and input it into the indicator.
However , you are not limited to following this method!
Wherever your strategy results are stored, simply copy and paste them into the indicator text area in the settings and simulations will begin.
Returns Should Follow This Format
1
3
-3
2
-5
The numbers are presented as a single column. No commas or separators used.
The numbers above are in sequential order. A return of "1" for the first trade and a return of "-5" for the last trade. Your strategy returns will likely be in sequential order already so don't worry too much about this (:
How To Perform a Monte Carlo Simulation On Your TradingView Strategy With Excel Data
Export your strategy returns to an excel file using TradingView
Navigate to your downloads folder to column G "Profit"
Click the column and press CTRL + SPACE to highlight the entire column
Press CTRL + C to copy the entire column
Open this indicator's settings and paste the returns into the text area
The image above illustrates the process!
Notes on Inputting Returns
*Must input your returns without a separate as a vertical list
*The initial text area can only hold so many return values. If your list of trades is large you can input additional returns into two additional text areas at the bottom of the indicator settings.
That should be it; thank you for checking this out!
