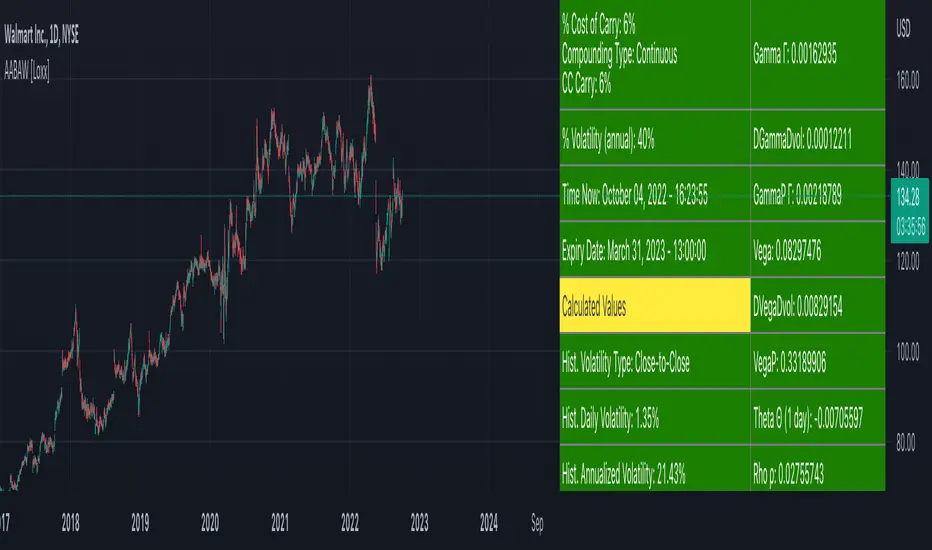
American Approximation: Barone-Adesi and Whaley [Loxx]American Approximation: Barone-Adesi and Whaley is an American Options pricing model. This indicator also includes numerical greeks. You can compare the output of the American Approximation to the Black-Scholes-Merton value on the output of the options panel.
An American option can be exercised at any time up to its expiration date. This added freedom complicates the valuation of American options relative to their European counterparts. With a few exceptions, it is not possible to find an exact formula for the value of American options. Several researchers have, however, come up with excellent closed-form approximations. These approximations have become especially popular because they execute quickly on computers compared to numerical techniques. At the end of the chapter, we look at closed-form solutions for perpetual American options.
The Barone-Adesi and Whaley Approximation
The quadratic approximation method by Barone-Adesi and Whaley (1987) can be used to price American call and put options on an underlying asset with cost-of-carry rate b. When b > r, the American call value is equal to the European call value and can then be found by using the generalized Black-Scholes-Merton (BSM) formula. The model is fast and accurate for most practical input values.
American Call
C(S, C, T) = Cbsm(S, X, T) + A2 / (S/S*)^q2 ... when S < S*
C(S, C, T) = S - X ... when S >= S*
where Cbsm(S, X, T) is the general Black-Scholes-Merton call formula, and
A2 = S* / q2 * (1 - e^((b - r) * T)) * N(d1(S*)))
d1(S) = (log(S/X) + (b + v^2/2) * T) / (v * T^0.5)
q2 = (-(N-1) + ((N-1)^2 + 4M/K))^0.5) / 2
M = 2r/v^2
N = 2b/v^2
K = 1 - e^(-r*T)
American Put
P(S, C, T) = Pbsm(S, X, T) + A1 / (S/S**)^q1 ... when S < S**
P(S, C, T) = X - S .... when S >= S**
where Pbsm(S, X, T) is the generalized BSM put option formula, and
A1 = -S** / q1 * (1 - e^((b - r) * T)) * N(-d1(S**)))
q1 = (-(N-1) - ((N-1)^2 + 4M/K))^0.5) / 2
where S* is the critical commodity price for the call option that satisfies
S* - X = c(S*, X, T) + (1 - e^((b - r) * T) * N(d1(S*))) * S* * 1/q2
These equations can be solved by using a Newton-Raphson algorithm. The iterative procedure should continue until the relative absolute error falls within an acceptable tolerance level. See code for details on the Newton-Raphson algorithm.
Inputs
S = Stock price.
K = Strike price of option.
T = Time to expiration in years.
r = Risk-free rate
c = Cost of Carry
V = Variance of the underlying asset price
cnd1(x) = Cumulative Normal Distribution
cbnd3(x) = Cumulative Bivariate Normal Distribution
nd(x) = Standard Normal Density Function
convertingToCCRate(r, cmp) = Rate compounder
Numerical Greeks or Greeks by Finite Difference
Analytical Greeks are the standard approach to estimating Delta, Gamma etc... That is what we typically use when we can derive from closed form solutions. Normally, these are well-defined and available in text books. Previously, we relied on closed form solutions for the call or put formulae differentiated with respect to the Black Scholes parameters. When Greeks formulae are difficult to develop or tease out, we can alternatively employ numerical Greeks - sometimes referred to finite difference approximations. A key advantage of numerical Greeks relates to their estimation independent of deriving mathematical Greeks. This could be important when we examine American options where there may not technically exist an exact closed form solution that is straightforward to work with. (via VinegarHill FinanceLabs)
Things to know
Only works on the daily timeframe and for the current source price.
You can adjust the text size to fit the screen
Search in scripts for "text"
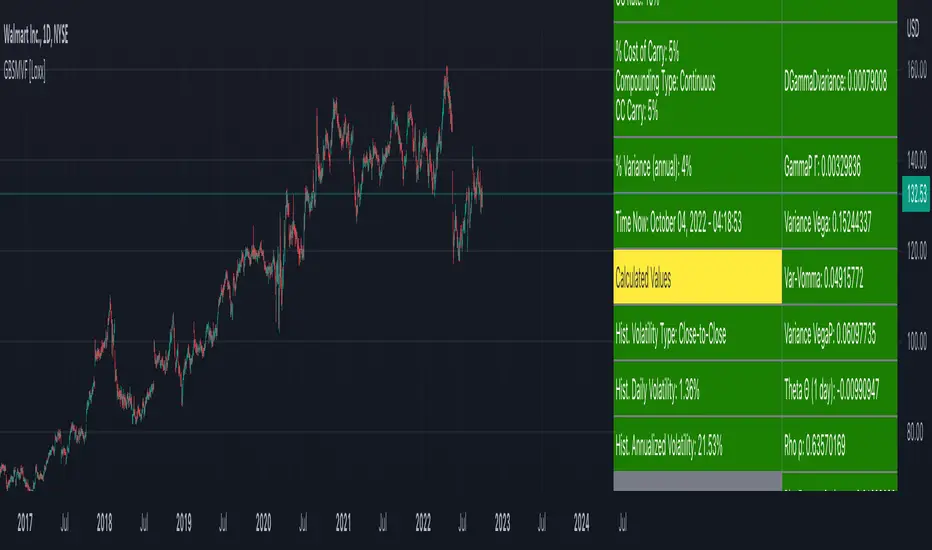
Generalized Black-Scholes-Merton on Variance Form [Loxx]Generalized Black-Scholes-Merton on Variance Form is an adaptation of the Black-Scholes-Merton Option Pricing Model including Numerical Greeks. The following information is an excerpt from Espen Gaarder Haug's book "Option Pricing Formulas". This version is to price Options using variance instead of volatility.
Black- Scholes- Merton on Variance Form
In some circumstances, it is useful to rewrite the BSM formula using variance as input instead of volatility, V = v^2:
c = S * e^((b - r) * T) * N(d1) - X * e^(-r * T) * N(d2)
p = X * e^(-r * T) * N(-d2) - S * e^((b - r) * T) * N(-d1)
where
d1 = (log(S / X) + (b + V^2 / 2) * T) / (V * T)^0.5
d2 = d1 - (V * T)^0.5
BSM on variance form clearly gives the same price as when written on volatility form. The variance form is used indirectly in terms of its partial derivatives in some stochastic variance models, as well as for hedging of variance swaps. The BSM on variance form moreover admits an interesting symmetry between put and call options as discussed by Adamchuk and Haug (2005) at www.wilmott.com .
c(S, X, T, r, b, V) = -c(-S, -X, -T, -r, -b, -V)
and
p(S, X, T, r, b, V) = -p(-S, -X, -T, -r, -b, -V)
It is possible to find several similar symmetries if we introduce imaginary numbers.
b = r ... gives the Black and Scholes (1973) stock option model.
b = r — q ... gives the Merton (1973) stock option model with continuous dividend yield q.
b = 0 ... gives the Black (1976) futures option model.
b = 0 and r = 0 ... gives the Asay (1982) margined futures option model.
b = r — rf ... gives the Garman and Kohlhagen (1983) currency option model.
Inputs
S = Stock price.
X = Strike price of option.
T = Time to expiration in years.
r = Risk-free rate
cc = Cost of Carry
V = Variance of the underlying asset price
cnd (x) = The cumulative normal distribution function
nd(x) = The standard normal density function
convertingToCCRate(r, cmp ) = Rate compounder
Numerical Greeks or Greeks by Finite Difference
Analytical Greeks are the standard approach to estimating Delta, Gamma etc... That is what we typically use when we can derive from closed form solutions. Normally, these are well-defined and available in text books. Previously, we relied on closed form solutions for the call or put formulae differentiated with respect to the Black Scholes parameters. When Greeks formulae are difficult to develop or tease out, we can alternatively employ numerical Greeks - sometimes referred to finite difference approximations. A key advantage of numerical Greeks relates to their estimation independent of deriving mathematical Greeks. This could be important when we examine American options where there may not technically exist an exact closed form solution that is straightforward to work with. (via VinegarHill FinanceLabs)
Things to know
Only works on the daily timeframe and for the current source price.
You can adjust the text size to fit the screen
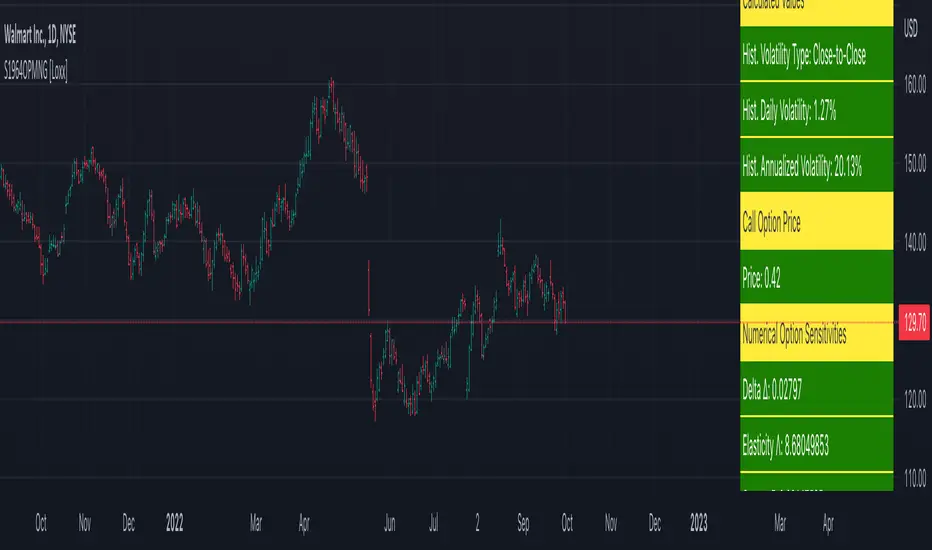
Sprenkle 1964 Option Pricing Model w/ Num. Greeks [Loxx]Sprenkle 1964 Option Pricing Model w/ Num. Greeks is an adaptation of the Sprenkle 1964 Option Pricing Model in Pine Script. The following information is an except from Espen Gaarder Haug's book "Option Pricing Formulas".
The Sprenkle Model
Sprenkle (1964) assumed the stock price was log-normally distributed and thus that the asset price followed a geometric Brownian motion, just as in the Black and Scholes (1973) analysis. In this way he ruled out the possibility of negative stock prices, consistent with limited liability. Sprenkle moreover allowed for a drift in the asset price, thus allowing positive interest rates and risk aversion (Smith, 1976). Sprenkle assumed today's value was equal to the expected value at maturity.
c = S * e^(rho*T) * N(d1) - (1 - k) * X * N(d2)
d1 = (log(S/X) + (rho + v^2 / 2) * T) / (v * T^0.5)
d2 = d1 - (v * T^0.5)
Inputs
S = Stock price.
X = Strike price of option.
T = Time to expiration in years.
r = Risk-free rate
v = Volatility of the underlying asset price
k = Market risk aversion adjustment
rho = Average growth rate share
cnd (x) = The cumulative normal distribution function
nd(x) = The standard normal density function
nd(x) = The standard normal density function
convertingToCCRate(r, cmp) = Rate compounder
Numerical Greeks or Greeks by Finite Difference
Analytical Greeks are the standard approach to estimating Delta, Gamma etc... That is what we typically use when we can derive from closed form solutions. Normally, these are well-defined and available in text books. Previously, we relied on closed form solutions for the call or put formulae differentiated with respect to the Black Scholes parameters. When Greeks formulae are difficult to develop or tease out, we can alternatively employ numerical Greeks - sometimes referred to finite difference approximations. A key advantage of numerical Greeks relates to their estimation independent of deriving mathematical Greeks. This could be important when we examine American options where there may not technically exist an exact closed form solution that is straightforward to work with. (via VinegarHill FinanceLabs)
Things to know
Only works on the daily timeframe and for the current source price.
You can adjust the text size to fit the screen
PipMotionFXHi guys,
If you are looking to add some watermark into your charts. You can use this indicator.
You can add add a title and a subtitle, if you want to write in diferents lines, you can use \n as you can see in the script.
All the features are customizable: position, text size, text color, background.
Enjoy it.

lower_tf█ OVERVIEW
This library is a Pine programmer’s tool containing functions to help those who use the request.security_lower_tf() function. Its `ltf()` function helps translate user inputs into a lower timeframe string usable with request.security_lower_tf() . Another function, `ltfStats()`, accumulates statistics on processed chart bars and intrabars.
█ CONCEPTS
Chart bars
Chart bars , as referred to in our publications, are bars that occur at the current chart timeframe, as opposed to those that occur at a timeframe that is higher or lower than that of the chart view.
Intrabars
Intrabars are chart bars at a lower timeframe than the chart's. Each 1H chart bar of a 24x7 market will, for example, usually contain 60 intrabars at the LTF of 1min, provided there was market activity during each minute of the hour. Mining information from intrabars can be useful in that it offers traders visibility on the activity inside a chart bar.
Lower timeframes (LTFs)
A lower timeframe is a timeframe that is smaller than the chart's timeframe. This framework exemplifies how authors can determine which LTF to use by examining the chart's timeframe. The LTF determines how many intrabars are examined for each chart bar; the lower the timeframe, the more intrabars are analyzed.
Intrabar precision
The precision of calculations increases with the number of intrabars analyzed for each chart bar. As there is a 100K limit to the number of intrabars that can be analyzed by a script, a trade-off occurs between the number of intrabars analyzed per chart bar and the chart bars for which calculations are possible.
█ `ltf()`
This function returns a timeframe string usable with request.security_lower_tf() . It calculates the returned timeframe by taking into account a user selection between eight different calculation modes and the chart's timeframe. You send it the user's selection, along with the text corresponding to the eight choices from which the user has chosen, and the function returns a corresponding LTF string.
Because the function processes strings and doesn't require recalculation on each bar, using var to declare the variable to which its result is assigned will execute the function only once on bar zero and speed up your script:
var string ltfString = ltf(ltfModeInput, LTF1, LTF2, LTF3, LTF4, LTF5, LTF6, LTF7, LTF8)
The eight choices users can select from are of two types: the first four allow a selection from the desired amount of chart bars to be covered, the last four are choices of a fixed number of intrabars to be analyzed per chart bar. Our example code shows how to structure your input call and then make the call to `ltf()`. By changing the text associated with the `LTF1` to `LTF8` constants, you can tailor it to your preferences while preserving the functionality of `ltf()` because you will be sending those string constants as the function's arguments so it can determine the user's selection. The association between each `LTFx` constant and its calculation mode is fixed, so the order of the arguments is important when you call `ltf()`.
These are the first four modes and the `LTFx` constants corresponding to each:
Covering most chart bars (least precise) — LTF1
Covers all chart bars. This is accomplished by dividing the current timeframe in seconds by 4 and converting that number back to a string in timeframe.period format using secondsToTfString() . Due to the fact that, on premium subscriptions, the typical historical bar count is between 20-25k bars, dividing the timeframe by 4 ensures the highest level of intrabar precision possible while achieving complete coverage for the entire dataset with the maximum allowed 100K intrabars.
Covering some chart bars (less precise) — LTF2
Covering less chart bars (more precise) — LTF3
These levels offer a stepped LTF in relation to the chart timeframe with slightly more, or slightly less precision. The stepped lower timeframe tiers are calculated from the chart timeframe as follows:
Chart Timeframe Lower Timeframe
Less Precise More Precise
< 1hr 1min 1min
< 1D 15min 1min
< 1W 2hr 30min
> 1W 1D 60min
Covering the least chart bars (most precise) — LTF4
Analyzes the maximum quantity of intrabars possible by using the 1min LTF, which also allows the least amount of chart bars to be covered.
The last four modes allow the user to specify a fixed number of intrabars to analyze per chart bar. Users can choose from 12, 24, 50 or 100 intrabars, respectively corresponding to the `LTF5`, `LTF6`, `LTF7` and `LTF8` constants. The value is a target; the function will do its best to come up with a LTF producing the required number of intrabars. Because of considerations such as the length of a ticker's session, rounding of the LTF to the closest allowable timeframe, or the lowest allowable timeframe of 1min intrabars, it is often impossible for the function to find a LTF producing the exact number of intrabars. Requesting 100 intrabars on a 60min chart, for example, can only produce 60 1min intrabars. Higher chart timeframes, tickers with high liquidity or 24x7 markets will produce optimal results.
█ `ltfStats()`
`ltfStats()` returns statistics that will be useful to programmers using intrabar inspection. By analyzing the arrays returned by request.security_lower_tf() in can determine:
• intrabarsInChartBar : The number of intrabars analyzed for each chart bar.
• chartBarsCovered : The number of chart bars where intrabar information is available.
• avgIntrabars : The average number of intrabars analyzed per chart bar. Events like holidays, market activity, or reduced hours sessions can cause the number of intrabars to vary, bar to bar.
The function must be called on each bar to produce reliable results.
█ DEMONSTRATION CODE
Our example code shows how to provide users with an input from which they can select a LTF calculation mode. If you use this library's functions, feel free to reuse our input setup code, including the tooltip providing users with explanations on how it works for them.
We make a simple call to request.security_lower_tf() to fetch the close values of intrabars, but we do not use those values. We simply send the returned array to `ltfStats()` and then plot in the indicator's pane the number of intrabars examined on each bar and its average. We also display an information box showing the user's selection of the LTF calculation mode, the resulting LTF calculated by `ltf()` and some statistics.
█ NOTES
• As in several of our recent publications, this script uses secondsToTfString() to produce a timeframe string in timeframe.period format from a timeframe expressed in seconds.
• The script utilizes display.data_window and display.status_line to restrict the display of certain plots.
These new built-ins allow coders to fine-tune where a script’s plot values are displayed.
• We implement a new recommended best practice for tables which works faster and reduces memory consumption.
Using this new method, tables are declared only once with var , as usual. Then, on bar zero only, we use table.cell() calls to populate the table.
Finally, table.set_*() functions are used to update attributes of table cells on the last bar of the dataset.
This greatly reduces the resources required to render tables. We encourage all Pine Script™ programmers to do the same.
Look first. Then leap.
█ FUNCTIONS
The library contains the following functions:
ltf(userSelection, choice1, choice2, choice3, choice4, choice5, choice6, choice7, choice8)
Selects a LTF from the chart's TF, depending on the `userSelection` input string.
Parameters:
userSelection : (simple string) User-selected input string which must be one of the `choicex` arguments.
choice1 : (simple string) Input selection corresponding to "Least precise, covering most chart bars".
choice2 : (simple string) Input selection corresponding to "Less precise, covering some chart bars".
choice3 : (simple string) Input selection corresponding to "More precise, covering less chart bars".
choice4 : (simple string) Input selection corresponding to "Most precise, 1min intrabars".
choice5 : (simple string) Input selection corresponding to "~12 intrabars per chart bar".
choice6 : (simple string) Input selection corresponding to "~24 intrabars per chart bar".
choice7 : (simple string) Input selection corresponding to "~50 intrabars per chart bar".
choice8 : (simple string) Input selection corresponding to "~100 intrabars per chart bar".
Returns: (simple string) A timeframe string to be used with `request.security_lower_tf()`.
ltfStats()
Returns statistics about analyzed intrabars and chart bars covered by calls to `request.security_lower_tf()`.
Parameters:
intrabarValues : (float [ ]) The ID of a float array containing values fetched by a call to `request.security_lower_tf()`.
Returns: A 3-element tuple: [ (series int) intrabarsInChartBar, (series int) chartBarsCovered, (series float) avgIntrabars ].

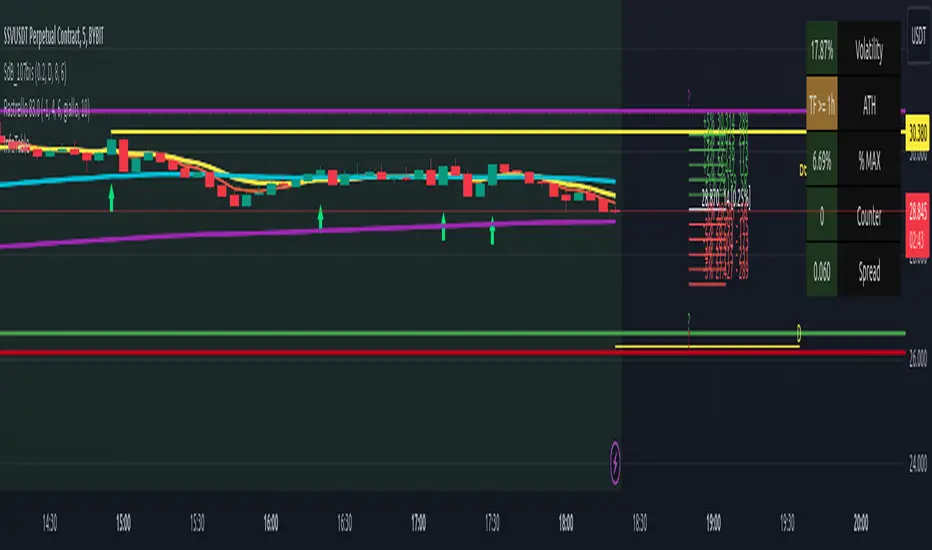
Candle Info by MontyThis indicator was made to help my friend.
This indicator basically calculates the MOVE in percentage and shows the OHLC of candle in a label.
-> Panel Index: How much index you want the label to be.
-> Show Candle OHLC: Shows Open High Low and Close of the candle in the panel/label
-> % Calculation Mode:
1: Calculated by Candle Wick Low to Candle Wick High for Green candle and Vice Versa for Red Candle
2: Calculated by Open of a candle to the current price.
-> Label Text Color: Used to change the color of the Label Text
-> Label Background Color: Used to change the color of Label background
Join the free Discord: discord.gg/chuffgang


Multi Yield CurveAn inversion between the 2 year and 10 year US treasury yield generally means a recession within 2 years. But the yield curve has more to it than that. This script helps analysis of the current and past yield curve (not limited to US treasury) and is very configurable.
"A yield curve is a line that plots yields (interest rates) of bonds having equal credit quality but differing maturity dates. The slope of the yield curve gives an idea of future interest rate changes and economic activity." (Investopedia)
When the slope is upward (longer maturity bonds have a higher interest rate than shorter maturity bonds), it generally means the economy is doing well and is expanding. When the slope is downward it generally means that there is more downside risk in the future.
The more inverted the curve is, and the more the inversion moves to the front, the more market participants are hedging against downside risk in the future.
The script draws up to 4 moments of a yield curve, which makes it easy to compare the current yield curve with past yield curves. It also draws lines in red when that part of the curve is inverted.
The script draws the lines with proper length between maturity (which most scripts do not) in order to make it more representative of the real maturity duration. The width cannot be scaled because TradingView does not allow drawing based on pixels.
This script is the only free script at time of writing with proper lengths, showing multiple yield curves, and being able to show yield curves other than the US treasury.
█ CONFIGURATION
(The following can be configured by clicking "Settings" when the script is added to a chart)
By default the script is configured to show the US treasury (government bond) yields of all maturities, but it can be configured for any yield curve.
A ticker represents yield data for a specific maturity of a bond.
To configure different tickers, go to the "TICKERS" section. Tickers in this section must be ordered from low maturity to high maturity.
• Enable: draw the ticker on the chart.
• Ticker: ticker symbol on TradingView to fetch data for.
• Months: amount of months of bond maturity the ticker represents.
To configure general settings, go to the "GENERAL" section.
• Period: used for calculating how far back to look for data for past yield curve lines. See "Times back" further in this description for more info.
• Min spacing: minimum amount of spacing between labels. Depending on the size of the screen, value labels can overlap. This setting sets how much empty space there must be between labels.
• Value format: how the value at that part of the line should be written on the label. For example, 0.000 means the value will have 3 digits precision.
To configure line settings per yield curve, each has its own "LINE" section with the line number after it.
• Enable: whether to enable drawing of this line.
• Times back: how many times period to go back in time. When period is D, and times value is 2, the line will be of data from 2 days ago.
• Color: color of the line when not inverted.
• Style: style of the line. Possible values: sol, dsh, dot
• Inversion color: color of the line when the curve inverses between the two maturities at that part of the curve.
• Thickness: thickness of the line in pixels.
• Labels: whether to draw value labels above the line. By default, this is only enabled for the first line.
• Label text color: text color of value label.
• Label background color: background color of value label.
To configure the durations axis at the bottom of the chart, go to the "DURATIONS" section.
• Durations: whether to show maturity term duration labels below the chart.
• Offset: amount to offset durations label to be below chart.
█ MISC
Script originally inspired by the US Treasury Yield Curve script by @longfiat but has been completely rewritten and changed.

Impactful pattern and candles pattern AlertThe Alertion indicator!
impactful pattern:
pattern that happen near the zone or in the zone at lower timeframe and give us entry and stop limit price.
It is helpful for price action traders and those who want to decrease their risk.
There are 3 IP patterns:
Quasimodo
Head and shoulder
whipsaw engulfing
These patterns may occur near the zone or may not occur but by them, you can decrease your trading risk for example you can
trade with half lot before IP pattern and enter with other half after pattern.
how to use?
for example:
you find zone at 1h timeframe for short position
when price enter to your zone
you run this indicator and choose your lower timeframe, for example 15m and click on short position.
Then make the alert by right-click on your chart and choose the add alert and at condition box choose the impactful pattern and then click on create
now wait for message :)
Candles pattern:
like reversal bar, key reversal bar, exhaustion bar, pin bar, two-bar reversal, tree-bar reversal, inside bar, outside bar
these occur when the trend turn, so it is usable when the price enter to your zone or near your zone.
This pattern can decrease your risk.
Inside bar and outside bar:
if this pattern engulf up, it is bullish pattern and if engulf down, it is bearish pattern.
what does this indicator do?
this indicator is for making alert
it helps you to decrease your risk and failure.
You optimize it to alert you when IP pattern happen or candle pattern happen or inside bar or outside bar engulfing or all of them.
For IP pattern, it will message you entry and stop limit price.
It works at 2 different timeframes, so you can make alert for example in 1h TF for candles pattern and 15m TF for IP pattern.
Indicator will alert you for candles pattern at your chart timeframe and for IP pattern at timeframe you've chosen when you run the indicator, and it is changeable
in setting.
setting options
TIMEFRAME
IP: select the timeframe for IP patterns it means when IP pattern happen at that timeframe the indicator will alert you
example = your TF is 1h, you found the supply zone and want to trade, note that IP pattern happen in lower TF, so you select 15m TF or TF lower than 1h.
Short position: select it if you want to make short position.
BUFFERING
indicator send you entry and stop limit price
you can change it by amount of percent
it is your strategy to change your entry and stop loss or not
example= in head and shoulder pattern at short position, the stop limit is high price of head in pattern
so the indicator will message you the exact price but if you want to put
your stop limit 5 percent upper than exact price you can enter 5 in front of stop loss
or you want to enter 5 percent lower than exact high price of shoulder, you can optimize it.
ALERTION
you choose what alert you want
IP alert or candle alert or inside and outside bar alert
type your text for alert
you can write additional text for your message
ADVANCE
IP alert frequency option:
1. Once per bar : indicator will alert you for IP pattern once at your chat timeframe bar, and you should wait til next bar for next alert.
2. Once per bar close : alert you when your chart timeframe bar closed and next alert will happen when next bar is closed.
3. All: alert you all the times IP pattern happen
pivot left and right bars: lower will find smaller pattern
at the END:
this indicator is not strategy
it is part of your strategy that help you to increase your winning rate.
It is helpful for scalping and candle patterns finding.
After you make an alert, you can delete the indicator or change your timeframe or make another alert, your previous alert won’t change.
Thank you all.

watermarkOverview
This indicator allows you generate a watermark in your charts for your live streams without using additional software.
Features
The main differences with respect to the available tools are:
_ This indicator converts a input text to ascii art in a easy way. That means you won't need to run externals scripts to generate the data required.
_ The watermark can be configured to repeat the message to cover the whole screen or only a specific part.
_ Programmers can use this code as a reference to include additional fonts using ascii art in their charts.
Settings
Below are the available inputs used to configure the watermark:
Text : it's the message shown.
Style : it selects the font style.
Color : the color used in the watermark.
Size : this is used to change the font size.
Position : where the watermark will be applied.
Repetition : number of rows and columns where the watermark is displayed.
Spacing : it defines the horizontal and vertical spacing between the watermarks.
Enable frame : it includes a frame in the watermark.
If you think this type of tools are useful, please consider leave a comment and contact me for additional features.
Ness92

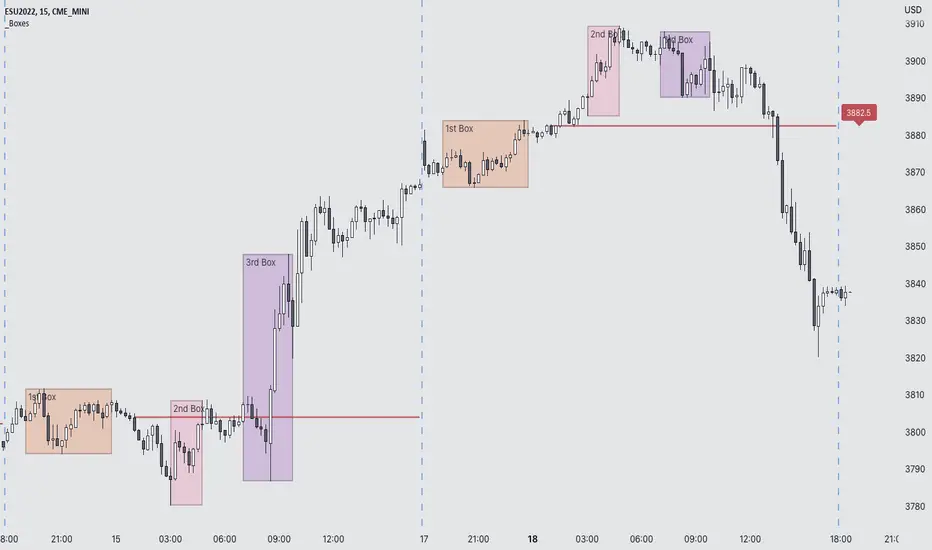
Futures Exchange Sessions 3.0Description
The ultimate conclusion to the Futures Exchange Sessions 2.0 indicator. In version 3.0 the user gets full control of the start and end times of three separate dynamic boxes and one horizontal line. If the user wants to visually keep track of killzones, lunches, or any other time span in a trading day, version 3.0 will dynamically expand and keep track of price within the time specified by the user.
Inputs and Style
Everything about the three dynamic boxes and one horizontal line can but independently configured. Color, style, border, width can all be adjusted. In the Settings each box has a text box so the user can give each one a unique name.
Timezone
All of the start and end times are in EST. Additionally, each box and line need a dependent start of each day. This is controlled by a setting where the user can specify a timezone called Start Day Timezone which would be midnight of the respective timezone. In general if a box or line resides within a particular Session pick the corresponding timezone. If the users box/line fits in the Asian Session then choose Asia/Shanghai. If the box/line is within the London Session then choose Europe/London. And the same goes for the New York Session.
Special Notes
If start time is within one period of the Start Day Timezone in the Settings, then the line/box won't display
Boxes and time lines only display when timeframe is <= 30 minute
To turn off box text label set opacity to 0%
InfoTableLibrary "InfoTable"
Funzioni per tabella info
infoTable(nrRighe)
Tabella per info a n righe e 2 colonne
Parameters:
nrRighe : : num righe tabella; textColor : colore testo tabella : giallo (default), bianco, nero, blu
Returns: oggetto tabella per info
scriviCella()
[LIB] Array / Matrix DisplayLibrary "ArrayMatrixHUD"
Show Array or Matrix Elements In Table
For Arrays: Set the number of rows you want the data displayed in and it will generate a table, calculating the columns based on the size of the array being displayed.
For Matrix: It will automatically match the Rows and Columns to the values in the matrix.
Note: On the left, the table shows the index of the array/matrix value starting at 1. So, to call that value from inside the array, subtract 1 from the index value to the left. For matrices, keep in mind that the row and column are also starting at one when trying to call a value from the matrix. The numbering of the values on the left is for display purposes only.
viewArray(_arrayName, _pos, _txtSize, _tRows)
Array Element Display (Supports float, int, string, and bool)
Parameters:
_arrayName : ID of Array to be Displayed
_pos : Position for Table
_txtSize : Size of Table Cell Text
_tRows : Number of Rows to Display Data In (columns will be calculated accordingly)
Returns: A Display of Array Values in a Table
viewMatrix(_matrixName, _pos, _txtSize)
Matrix Element Display (Supports float, int, string, and bool)
Parameters:
_matrixName : ID of Matrix to be Displayed
_pos : Position for Table
_txtSize : Size of Table Cell Text
Returns: A Display of Matrix Values in a Table

Support/Resistance With Breaks & Bounces [MyTradingCoder]This script uses the built-in pivothigh/pivotlow functions to find and identify new levels of basic support and resistance. The script will also automatically identify the first occurrence of a bounce/rejection off the most recent green/red line as well as automatically identify the first occurrence of a breakout of the most recent green/red line. This is a very basic, but effective indicator that is well written, and open source for anyone to learn from or build off of.
All details needed to understand how to use the script are listed below. Enjoy!
Customizable inputs:
- Option to change how pivot points are calculated('candle body' or 'candle wicks')
- Option to change the sensitivity of the pivots(leftbars and rightbars linked)
- Option to change the line width
Available Alert Options:
- Red Line Breakout
- Red Line Bounce/Rejection
- Green Line Breakout
- Green Line Bounce/Rejection
User Manual:
- All calculations are done on the last update of the bar(candle close)
- Only 1 breakout will be allowed per line
- Only 1 rejection will be allowed per line
- If the text is red, then the signal is related to the 'red line', if the text is green, then the signal is related to the 'green line'
- The code is open source, and is programmed using arrays/loops out of the gate, despite not needing to do so. This allows for easy modifications to the scripts behavior while keeping the functionality without it breaking.
- Pivot Rightbars is hardcoded to the same value for leftbars(leftbars = sensitivity). Uncomment the input for right_bars if you want the ability to change the rightbars independently from the leftbars
- When a new line is identified, the old one will stop updating, and no longer be considered for breakout/rejections. This can be changed with a bit of pine knowledge by performing some slight modifications to the code.
- When a new line is drawn, the old line will move backwards a little bit for cleanliness/clarity purposes
- If you have any questions/comments/requests/concerns please leave them down in the comments below
- Don't forget to leave a like if you find this script useful

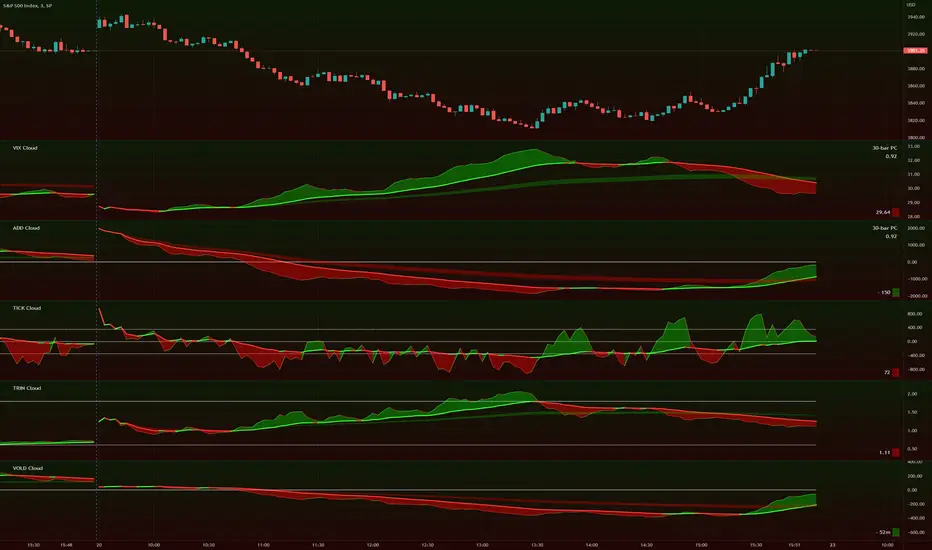
TIG's Market Internals Clouds Indicator v2.0=================================
== GENERAL INTRODUCTION
=================================
If you find market internals inform your intraday trading decisions (SPX, ES futures, SPY or more generally) this may be helpful.
Currently available internals are:
- ADD
- TICK
- TRIN
- VIX
- VOLD
Also, you can display your favorite alternative market internal (or BTC, if you want?!) by entering the relevant ticker in the 'Custom' field
=================================
== NOTES
=================================
The default EMA lengths seem to work reasonably well for 1, 2, 3-minute timeframes (except for TICK - you may wish to apply a bit more smoothing to TICK to reduce the noise)
Of course; you can add this indicator to your chart multiple times, and display a different internal each time.
The default Text Color is set as a mid-grey, which is readable in both TV color schemes. I prefer dark mode, and so I change the text color to white. You can't see the scheme setting from within a script, unfortunately, so this can't be automated.
=================================
== EXPERIMENTAL FEATURE
=================================
As a free bonus, the indicator can display the 30-bar (default) Pearson Correlation Coefficient between the internal, and price action (based on the super-fast EMA, to give a bit of smoothing). This may give a clue as to whether or not the market is aligned with what the internal is doing, or if the market (today) is not correlated with the particular internal.
Very roughly speaking:
- 0.50 means that 50% of the price action can be explained by reference to the internal. This is about the same level of correlation between VIX and Actual Move
- 0.80 suggests pretty strong correlation
I don't know why (yet) but sometimes this works, and sometimes it doesn't display a sensible figure.
=================================
== QUESTIONS AND FEEDBACK
=================================
If you have any general questions about market internals, Google is your friend.
If you have any specific queries, bug reports, feature requests or general feedback about this indicator please leave a comment below, and I'll get back to you ASAP!
matrixautotableLibrary "matrixautotable"
Automatic Table from Matrixes with pseudo correction for na values and default color override for missing values. uses overloads in cases of cheap float only, with additional addon for strings next, then cell colors, then text colors, and tooltips last.. basic size and location are auto, include the template to speed this up...
TODO : make bools version
var string group_table = ' Table'
var int _tblssizedemo = input.int ( 10 )
string tableYpos = input.string ( 'middle' , '↕' , inline = 'place' , group = group_table, options= )
string tableXpos = input.string ( 'center' , '↔' , inline = 'place' , group = group_table, options= , tooltip='Position on the chart.')
int _textSize = input.int ( 1 , 'Table Text Size' , inline = 'place' , group = group_table)
var matrix _floatmatrix = matrix.new (_tblssizedemo, _tblssizedemo, 0 )
var matrix _stringmatrix = matrix.new (_tblssizedemo, _tblssizedemo, 'test' )
var matrix _bgcolormatrix = matrix.new (_tblssizedemo, _tblssizedemo, color.white )
var matrix _textcolormatrix = matrix.new (_tblssizedemo, _tblssizedemo, color.black )
var matrix _tooltipmatrix = matrix.new (_tblssizedemo, _tblssizedemo, 'tool' )
// basic table ready to go with the aboec matrixes (replace in your code)
// for demo purpose, random colors, random nums, random na vals
if barstate.islast
varip _xsize = matrix.rows (_floatmatrix) -1
varip _ysize = matrix.columns (_floatmatrix) -1
for _xis = 0 to _xsize -1 by 1
for _yis = 0 to _ysize -1 by 1
_randomr = int(math.random(50,250))
_randomg = int(math.random(50,250))
_randomb = int(math.random(50,250))
_randomt = int(math.random(10,90 ))
bgcolor = color.rgb(250 - _randomr, 250 - _randomg, 250 - _randomb, 100 - _randomt )
txtcolor = color.rgb(_randomr, _randomg, _randomb, _randomt )
matrix.set(_bgcolormatrix ,_yis,_xis, bgcolor )
matrix.set(_textcolormatrix ,_yis,_xis, txtcolor)
matrix.set(_floatmatrix ,_yis,_xis, _randomr)
// random na
_ymiss = math.floor(math.random(0, _yis))
_xmiss = math.floor(math.random(0, _xis))
matrix.set( _floatmatrix ,_ymiss, _xis, na)
matrix.set( _stringmatrix ,_ymiss, _xis, na)
matrix.set( _bgcolormatrix ,_ymiss, _xis, na)
matrix.set( _textcolormatrix ,_ymiss, _xis, na)
matrix.set( _tooltipmatrix ,_ymiss, _xis, na)
// import here
import kaigouthro/matrixautotable/1 as mtxtbl
// and render table..
mtxtbl.matrixtable(_floatmatrix, _stringmatrix, _bgcolormatrix, _textcolormatrix, _tooltipmatrix, _textSize ,tableYpos ,tableXpos)
matrixtable(_floatmatrix, _stringmatrix, _bgcolormatrix, _textcolormatrix, _tooltipmatrix, _textSize, tableYpos, tableXpos) matrixtable
Parameters:
_floatmatrix : float vals
_stringmatrix : string
_bgcolormatrix : color
_textcolormatrix : color
_tooltipmatrix : string
_textSize : int
tableYpos : string
tableXpos : string
matrixtable(_floatmatrix, _stringmatrix, _bgcolormatrix, _textcolormatrix, _textSize, tableYpos, tableXpos) matrixtable
Parameters:
_floatmatrix : float vals
_stringmatrix : string
_bgcolormatrix : color
_textcolormatrix : color
_textSize : int
tableYpos : string
tableXpos : string
matrixtable(_floatmatrix, _stringmatrix, _bgcolormatrix, _txtdefcol, _textSize, tableYpos, tableXpos) matrixtable
Parameters:
_floatmatrix : float vals
_stringmatrix : string
_bgcolormatrix : color
_txtdefcol : color
_textSize : int
tableYpos : string
tableXpos : string
matrixtable(_floatmatrix, _stringmatrix, _txtdefcol, _bgdefcol, _textSize, tableYpos, tableXpos) matrixtable
Parameters:
_floatmatrix : float vals
_stringmatrix : string
_txtdefcol : color
_bgdefcol : color
_textSize : int
tableYpos : string
tableXpos : string
matrixtable(_floatmatrix, _txtdefcol, _bgdefcol, _textSize, tableYpos, tableXpos) matrixtable
Parameters:
_floatmatrix : float vals
_txtdefcol : color
_bgdefcol : color
_textSize : int
tableYpos : string
tableXpos : string

Tick travel ⍗This script is a further exploration of 'ticks' (only on realtime - live bars), based on my previous script:
- www.tradingview.com -
What are 'ticks'?
... Once the script’s execution reaches the rightmost bar in the dataset, if trading is currently active on the chart’s symbol,
then Pine indicators will execute once every time an update occurs, i.e., price or volume changes ...
(www.tradingview.com)
This script has 2 parts:
1) Option: ' Tick up/down'
This is a further progression of previous work.
During bar development, every time there is an update (tick), a dot is placed.
If for example there is 1 tick (first of new bar), a dot will be placed on 1,
if it is the 8th tick off that bar, there will be a dot placed on 8.
While my previous script had the issue that there was an upper limit per bar (max 32),
this script (because it is working with labels) can place max 500 dots.
For each bar this is better, it has to be mentioned though that looking in history, once the limit of 500 has been reached,
you'll notice the last ones are being deleted. This is one of the reasons the script is not suitable for higher timeframes
(1h and higher, even higher than 5 minutes can give some issues if it is a highly traded ticker), if a bar would have more
than 500 ticks, they won't be drawn anymore (which is not desirable of course)
2) Option: ' Tick progression'
These are the same ticks, but placed on the candle itself, or you can show the candle:
Or 'without' candle (or 'black' colour):
When 'No candles' are enabled, the 'candles' get the colour at the right.
At the moment it is not possible to drawn between 2 candles, this technique uses labels with 'text',
each tick on a candle will have a 'space' added, so you can see a progression to the right.
Colours
- if price is higher than previous tick price -> green
- if price is lower than previous tick price -> red
- otherwise -> blue (dimmed)
There are options to choose the 'dot', when choosing 'custom',
just enter (copy/paste) your symbol of your choice in the 'custom' field:
Caveats:
- Labels and text will not always be exactly on the price itself
- The scripts needs more testings, possibly some ticks don't always get drawn as they should.
The lower the timeframe, the more possible issues can occur
- Since (candle option) the dots move to the right, the higher the timeframe and/or the more ticks,
the sooner ticks will go in the area of next candle.
That's why I made a separate 'start symbol'
-> This is the very first tick on each candle, then you can zoom in/out more easily until the dots don't merge into each other candle area:
A timeframe higher than 5 minutes mostly won't be feasible I believe
This script wouldn't be possible without the help of @LucF, also because of his script
With very much respect I am hugely inspired by him! Many Thanks to him, Tradingview, and everything associated with them!
Cheers!

Scrolling WatermarkThis is an improvement on the watermark published by TradingView.
Along with displaying a little bit of text on the corner of your chart, this text scrolls from left to right, or right to left! You choose!
This functionality works on all live charts. It will not scroll if the chart is currently inactive. :(
Even though this is based on the indicator by TradingView This script uses entirely original code and method developed by myself.
"Do keep in mind that if you use it when publishing ideas, videos or scripts, House Rules prohibit advertising on your chart." -Watermark by TradingView

LEGENDary WatermarkHi guys,
If you are looking to add some watermark into your charts. You can use this indicator.
You can add add a title and a subtitle, if you want to write in diferents lines, you can use \n as you can see in the script.
All the features are customizable: position, text size, text color, background.
Enjoy it.
I made an upgrade on the indicator by someone request,
In this update, it is allow to show some symbol information (pair and timeframe).
Thanks.

BBW EMA RIBBON+BB%B+EMA BUY/SELL SignalsBINANCE:BTCUSDT
* * * TESTED ON BTCUSDT 4H CHART * * *
The indicator gives signals based on possible ENTRY/EXIT zones (calculated using an ema ribbon of the BBW) and BB%B oversold/overbought conditions, also a 200 EMA filter is used to trade following the major trend.
ENTRY/EXIT zones can be used as a confirmation on other strategies (green zones suggest a possible entry for a long in an uptrend and for a short in a downtrend, red zones suggest a possible exit for long & short)
Only LONG signals are given.
Signals are divided in 3 categories based on their strenght:
- Weak BUY/SELL (green/red circles on chart)
- normal BUY/SELL (green/red triangles with "BUY" or "SELL" text on chart)
- strong BUY/SELL (green/red labels with "STRONG BUY" or "STRONG SELL" text on chart)
You can use signals from the same category as triggers for entering or exiting a trade or you can try using signals from different categories
All indicators settings can be costumized
Possible EXTRY/EXIT zones can be turned ON/OFF
Every signal label can be turned ON/OFF
EMA that changes color based on last candle close can be turned ON/OFF
Alerts can be set for:
- General Signals (every signal will trigger it)
- Weak Signals (only weak signals will trigger it)
- Normal Signals (only normal signals will trigger it)
- Strong Signals (only strong signals will trigger it)
There are 3 BB%B Oversold & 3 BB%B Overbought value presets:
- BASIC (default values)
- LOW (slightly lower values from default)
- HIGH (slightly higher values from default)
Tips:
Use BB%B OS LOW preset to find entries at a better price
Use BB%B OS HIGH preset to find entries faster
Use BB%B OB LOW preset to find exits faster
Use BB%B OB HIGH preset to find exits at a better price
There are 3 Filters already included:
- A checkbox to toggle ON/OFF the use of Heikin Ashi candels to detect trades
- A checkbox to toggle ON/OFF the use of an ema filter for the ribbon that tries to reduce the number of false signals on over-extended price movements
- A checkbox to toggle ON/OFF the use of an ema filter that tries to reduce the number of false signals when price crosses the moving average many times consecutively

BB+RSI+EMA BUY/SELL SignalsBINANCE:BTCUSDT
* * * TESTED ON BTCUSDT 4H CHART * * *
The indicator gives signals based on candles touching BB lines and RSI oversold/overbought conditions, also a 200 EMA filter is used to trade following the major trend.
Only LONG signals are given.
Signals are divided in 3 categories based on their strenght:
- Weak BUY/SELL (green/red circles on chart)
- normal BUY/SELL (green/red triangles with "BUY" or "SELL" text on chart)
- strong BUY/SELL (green/red labels with "STRONG BUY" or "STRONG SELL" text on chart)
You can use signals from the same category as triggers for entering or exiting a trade or you can try using signals from different categories
All indicators settings can be costumized
Every signal label can be turned ON/OFF
EMA that changes color based on last candle close can be turned ON/OFF
Alerts can be set for:
- General Signals (every signal will trigger it)
- Weak Signals (only weak signals will trigger it)
- Normal Signals (only normal signals will trigger it)
- Strong Signals (only strong signals will trigger it)

AG FX - WatermarkHi guys,
If you are looking to add some watermark into your charts. You can use this indicator.
You can add add a title and a subtitle, if you want to write in diferents lines, you can use \n as you can see in the script.
All the features are customizable: position, text size, text color, background.
Enjoy it.

Shariah & PN17 Bursa MalaysiaDISCLAIMER: This Indicator work only with Bursa Malaysia's Stock
HOW DOES THE INDICATOR WORK
0. This is an overlay type of indicator. (Panel on chart)
1. This indicator list all shariah stock including warrant up to the month & year stated on the panel.
2. User may update the list (delete or adding) accordingly - refer to comment in the code
3. Panel of the indicator may be relocated in the indicator setting - default: TOP RIGHT
4. Panel will indicate Red Color with 'PN17' text for PN17/G3 stock
5. Panel will indicate Green Color with 'S' text for shariah stock
6. Panel will indicate none for non-shariah stock
7. If shariah stock was listed as PN17/GN3 stock, panel will indicate as PN17
Notes : Refer to code's comment for details.
