SMA ProjectionWhat it does
Draws a linear projection of a Simple Moving Average (SMA) 20 bars into the future using the SMA’s recent slope. Optionally shows a tiny momentum flag (just a number) positioned 0.75× ATR below the SMA on the last bar. No future data is read; everything updates on the current bar only.
How it works
SMA: Standard SMA on your chosen source and length.
Projection (fixed 20 bars): Uses a linear extrapolation from the last SMA value with slope
slope = (ma - ma ) / slopeLen
Momentum magnitude (optional): A signed number where >0 = up-slope, <0 = down-slope, ~0 = flat. Units are selectable: price/bar, %/bar, or ATR/bar (default). The flag is rendered small and colored teal (pos) / red (neg) / gray (flat).
Key features
Fixed 20-bar projection (no input—keeps it simple and comparable).
Tiny numeric momentum flag (off by default) placed well below the line (0.75× ATR).
Unit choices for momentum: price/bar, %/bar, ATR/bar.
Deadband option to zero-out tiny slopes.
Non-repainting projection: drawn only on the last bar; updates each candle.
Inputs (summary)
SMA length and Source
Slope lookback (for magnitude)
Show momentum flag (default: Off)
Magnitude units: price/bar, %/bar, ATR/bar (default)
Deadband and Decimals for display control
Tips
For smoother projections, increase slope lookback; for responsiveness, decrease it.
Use ATR/bar or %/bar if you want momentum values that are more comparable across symbols and timeframes.
The projection is indicative, not predictive—combine with structure, volume, and risk management.
Notes & limits
The “future” line is just a linear extrapolation from recent behavior; regime shifts will break linearity.
The momentum flag text is intentionally minimal to avoid chart clutter.
Works on any timeframe; the projection distance is always 20 bars on that timeframe.
Tags: SMA, moving average, projection, slope, momentum, ATR, extrapolation, non-repainting, trading tools
Search in scripts for "text"

ORB Breakout Traffic Signal (5/15/30)ORB Breakout Traffic Signal (5/15/30)
This indicator visualizes Opening Range Breakouts (ORB) for the first 5, 15, and 30 minutes of the US regular trading session (09:30–16:00 ET).
It provides a compact, easy-to-read traffic signal table on your chart to show whether price is breaking out, breaking down, or consolidating inside the range.
🔑 Features
Auto-anchors at 09:30 ET (converted to your local time automatically).
Tracks ORB High/Low for:
5-minute window (09:30–09:34)
15-minute window (09:30–09:44)
30-minute window (09:30–09:59)
Displays results in a compact table:
↑ (green) → price has broken above the ORB high
↓ (red) → price has broken below the ORB low
• (gray) → price remains inside the ORB range (optional; can be disabled)
Customizable:
Toggle which ORBs to show (5m, 15m, 30m)
Choose table position (top/bottom left/right)
Adjustable text size
Option to plot the ORB High/Low lines on your chart
📌 Usage
Designed for intraday traders watching US equities/ETFs/futures.
Works best on 1-minute or 5-minute charts with Extended Hours turned OFF (so the session starts exactly at 09:30 ET).
Helps you quickly spot early breakouts (5m), mid-session trends (15m), or confirmed directional moves (30m).
⚠️ Notes
Signals only update during the RTH session
Outside market hours, the last locked ORB and signal remain displayed until the next open.
This tool is for analysis/visualization only; not a buy/sell signal. Always combine with your own trading strategy and risk management.
👉 Perfect for traders who want a quick visual confirmation of whether price is breaking out of the opening range or stuck inside it.

Hilly's Advanced Crypto Scalping Strategy - 5 Min ChartTo determine the "best" input parameters for the Advanced Crypto Scalping Strategy on a 5-minute chart, we need to consider the goals of optimizing for profitability, minimizing false signals, and adapting to the volatile nature of cryptocurrencies. The default parameters in the script are a starting point, but the optimal values depend on the specific cryptocurrency pair, market conditions, and your risk tolerance. Below, I'll provide recommended input values based on common practices in crypto scalping, along with reasoning for each parameter. I’ll also suggest how to fine-tune them using TradingView’s backtesting and optimization tools.
Recommended Input Parameters
These values are tailored for a 5-minute chart for liquid cryptocurrencies like BTC/USD or ETH/USD on exchanges like Binance or Coinbase. They aim to balance signal frequency and accuracy for day trading.
Fast EMA Length (emaFastLen): 9
Reasoning: A 9-period EMA is commonly used in scalping to capture short-term price movements while remaining sensitive to recent price action. It reacts faster than the default 10, aligning with the 5-minute timeframe.
Slow EMA Length (emaSlowLen): 21
Reasoning: A 21-period EMA provides a good balance for identifying the broader trend on a 5-minute chart. It’s slightly longer than the default 20 to reduce noise while confirming the trend direction.
RSI Length (rsiLen): 14
Reasoning: The default 14-period RSI is a standard choice for momentum analysis. It works well for detecting overbought/oversold conditions without being too sensitive on short timeframes.
RSI Overbought (rsiOverbought): 75
Reasoning: Raising the overbought threshold to 75 (from 70) reduces false sell signals in strong bullish trends, which are common in crypto markets.
RSI Oversold (rsiOversold): 25
Reasoning: Lowering the oversold threshold to 25 (from 30) filters out weaker buy signals, ensuring entries occur during stronger reversals.
MACD Fast Length (macdFast): 12
Reasoning: The default 12-period fast EMA for MACD is effective for capturing short-term momentum shifts in crypto, aligning with scalping goals.
MACD Slow Length (macdSlow): 26
Reasoning: The default 26-period slow EMA is a standard setting that works well for confirming momentum trends without lagging too much.
MACD Signal Smoothing (macdSignal): 9
Reasoning: The default 9-period signal line is widely used and provides a good balance for smoothing MACD crossovers on a 5-minute chart.
Bollinger Bands Length (bbLen): 20
Reasoning: The default 20-period Bollinger Bands are effective for identifying volatility breakouts, which are key for scalping in crypto markets.
Bollinger Bands Multiplier (bbMult): 2.0
Reasoning: A 2.0 multiplier is standard and captures most price action within the bands. Increasing it to 2.5 could reduce signals but improve accuracy in highly volatile markets.
Stop Loss % (slPerc): 0.8%
Reasoning: A tighter stop loss of 0.8% (from 1.0%) suits the high volatility of crypto, helping to limit losses on false breakouts while keeping risk manageable.
Take Profit % (tpPerc): 1.5%
Reasoning: A 1.5% take-profit target (from 2.0%) aligns with scalping’s goal of capturing small, frequent gains. Crypto markets often see quick reversals, so a smaller target increases the likelihood of hitting profits.
Use Candlestick Patterns (useCandlePatterns): True
Reasoning: Enabling candlestick patterns (e.g., engulfing, hammer) adds confirmation to signals, reducing false entries in choppy markets.
Use Volume Filter (useVolumeFilter): True
Reasoning: The volume filter ensures signals occur during high-volume breakouts, which are more likely to sustain in crypto markets.
Signal Arrow Size (signalSize): 2.0
Reasoning: Increasing the arrow size to 2.0 (from 1.5) makes buy/sell signals more visible on the chart, especially on smaller screens or volatile price action.
Background Highlight Transparency (bgTransparency): 85
Reasoning: A slightly higher transparency (85 from 80) keeps the background highlights subtle but visible, avoiding chart clutter.
How to Apply These Parameters
Copy the Script: Use the Pine Script provided in the previous response.
Paste in TradingView: Open TradingView, go to the Pine Editor, paste the code, and click "Add to Chart."
Set Parameters: In the strategy settings, manually input the recommended values above or adjust them via the input fields.
Test on a 5-Minute Chart: Apply the strategy to a liquid crypto pair (e.g., BTC/USDT, ETH/USDT) on a 5-minute chart.
Fine-Tuning for Optimal Performance
To find the absolute best parameters for your specific trading pair and market conditions, use TradingView’s Strategy Tester and optimization features:
Backtesting:
Run the strategy on historical data for your chosen pair (e.g., BTC/USDT on Binance).
Check metrics like Net Profit, Profit Factor, Win Rate, and Max Drawdown in the Strategy Tester.
Focus on a sample period of at least 1–3 months to capture various market conditions (bull, bear, sideways).
Parameter Optimization:
In the Strategy Tester, click the settings gear next to the strategy name.
Enable optimization for key inputs like emaFastLen (test range: 7–12), emaSlowLen (15–25), slPerc (0.5–1.5), and tpPerc (1.0–3.0).
Run the optimization to find the combination with the highest net profit or best Sharpe ratio, but avoid over-optimization (curve-fitting) by testing on out-of-sample data.
Market-Specific Adjustments:
Volatile Pairs (e.g., DOGE/USDT): Use tighter stop losses (e.g., 0.5–0.7%) and smaller take-profit targets (e.g., 1.0–1.2%) to account for rapid price swings.
Stable Pairs (e.g., BTC/USDT): Slightly wider stop losses (e.g., 1.0–1.2%) and take-profit targets (e.g., 1.8–2.5%) may work better.
Trending Markets: Increase emaSlowLen (e.g., to 25–30) to follow stronger trends.
Choppy Markets: Tighten bbMult (e.g., to 1.8) and lower rsiOverbought/rsiOversold (e.g., to 70/30) to filter noise.
Forward Testing:
After backtesting, run the strategy in real-time on a demo account for 1–2 weeks to validate performance under current market conditions.
Important Notes
No Universal "Best" Numbers: Optimal parameters vary by crypto pair, exchange, and market conditions (e.g., bull vs. bear market). The suggested values are a starting point based on common scalping practices.
Risk Management: Never risk more than 1–2% of your account per trade. Adjust position sizing in TradingView’s strategy settings to align with your risk tolerance.
Market Volatility: Crypto markets are highly volatile. Test the strategy on your specific pair and adjust parameters if signals are too frequent or too rare.
Not Financial Advice: This is an educational tool. Backtest thoroughly and use a demo account before trading with real funds.
If you want me to generate a chart showing backtest performance for specific parameters or to tweak the script further (e.g., adding more indicators or adjusting signal logic), let me know!can you add clear buy ans sell signs above the candles in this codeTo add clear buy and sell signals above the candles in the provided Pine Script, I'll modify the existing code to include prominent text labels directly above (for sell signals) and below (for buy signals) the candles. These labels will be larger, color-coded, and positioned to avoid clutter, ensuring they are easily visible on the chart. The core strategy logic (EMA, RSI, MACD, Bollinger Bands, candlestick patterns, and volume filter) will remain unchanged, and I'll reuse the same artifact_id since this is an update to the previous script.AdvancedCryptoScalpingStrategy.pinex-pine

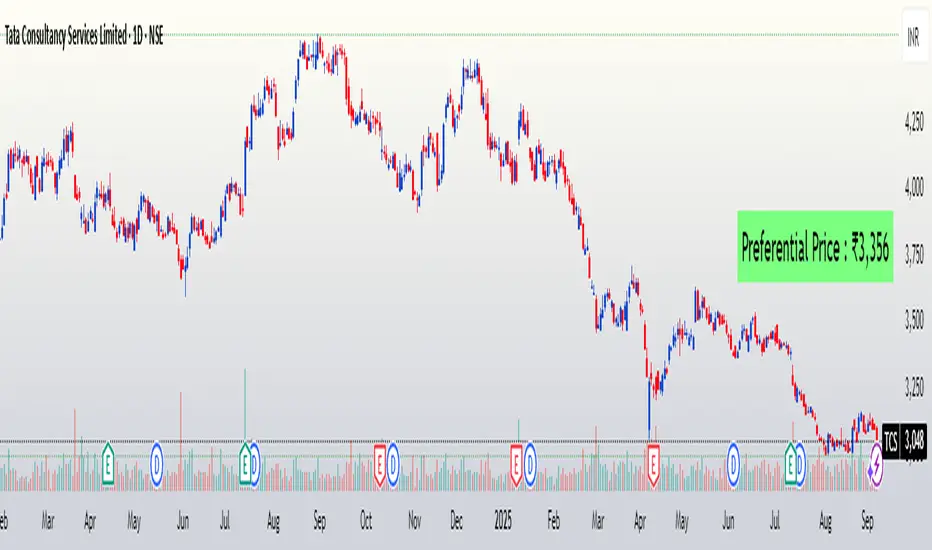
FuTech : Preferential Price📌 First Ever Indicator : FuTech : Preferential Price
💡 What if you could instantly know the Preferential Price — as if the company announced a preferential issue in today’s meeting surprisingly?
Normally, you’d be stuck with tedious valuation spreadsheets and SEBI formula checks 🧮📑…
✨ But not anymore — this tool does the hard work for you!
With just one click, it auto-calculates the Preferential Issue Floor Price under SEBI ICDR Regulations, 2018 - Regulation 164 (as amended), directly from your chart symbol.
✅ How it works ?
📅 Relevant Date = 30 days prior to either:
• Today’s date (default mode)
• Or your chosen EGM date (user input)
📊 For the Relevant Date, the indicator automatically computes:
• VWAP (90 trading days preceding Relevant Date)
• VWAP (10 trading days preceding Relevant Date)
🔎 As per SEBI Reg.164, the higher of these two VWAPs is selected as the Minimum Issue Price (Preferential Price).
💰 Price is neatly formatted in Indian style (e.g. ₹1,00,000).
✅ Key Features:
⚡ Auto-calculates from chart symbol — no manual entry.
🎛️ Option to input EGM date for accurate floor price compliance.
🎨 Fully customizable: text color, size, background, position.
🪄 Clean display → shows only the final Preferential Price (Reg.164).
📌 Usage:
This indicator is built for analysts, fund managers, and corporate professionals dealing with Preferential Allotment pricing compliance.
It ensures quick visibility of the floor price under SEBI ICDR rules, directly on your chart.
⚠️ Disclaimer:
📌 The calculated Preferential Price is an approximation based on SEBI ICDR Reg.164 methodology.
📊 Actual price determined by the company / merchant banker may vary slightly (±5) due to rounding, data source differences, or timing adjustments.
📅 Ensure to verify with official exchange data and SEBI filings before relying on these numbers.
📝 This tool is meant for analytical and educational purposes only, not a substitute for regulatory or professional advice.
SMC Analysis - Fair Value Gaps (Enhanced)SMC Analysis - Fair Value Gaps (Enhanced) Script Summary
Overview
The "SMC Analysis - Fair Value Gaps (Enhanced)" script, written in Pine Script (version 6), is a technical analysis indicator designed for TradingView to identify and visualize Fair Value Gaps (FVGs) on a price chart. It supports both the main timeframe and multiple higher timeframes (MTF) for comprehensive market analysis. FVGs are price gaps formed by a three-candle pattern, indicating potential areas of market inefficiency where price may return to fill the gap.
Key Features
FVG Detection:
Identifies bullish FVGs: Occur when the high of a candle two bars prior is lower than the low of the current candle, with the middle candle being bullish (close > open).
Identifies bearish FVGs: Occur when the low of a candle two bars prior is higher than the high of the current candle, with the middle candle being bearish (close < open).
Visualizes FVGs as colored boxes on the chart (green for bullish, red for bearish).
Mitigation Tracking:
Tracks when FVGs are touched (price overlaps the gap range) or mitigated (price fully closes the gap).
Strict Mode: Marks an FVG as mitigated when price touches the gap range.
Normal Mode: Requires a full breakthrough (price crossing the gap’s bottom for bullish FVGs or top for bearish FVGs) for mitigation.
Optionally converts FVG box borders to dashed lines and increases transparency when partially touched.
Multi-Timeframe (MTF) Support:
Analyzes FVGs on three user-defined higher timeframes (default: 15m, 60m, 240m).
Displays MTF FVGs with distinct labels and slightly more transparent colors.
Ensures no duplicate processing of MTF bars to maintain performance.
Customization Options:
FVG Length: Adjustable duration for how long FVGs are displayed (default: 20 bars).
Show/Hide FVGs: Toggle visibility for main timeframe and each MTF.
Color Customization: User-defined colors for bullish and bearish FVGs (default: green and red).
Display Options: Toggle for showing dashed lines after partial touches and strict mitigation mode.
Performance Optimization:
Limits the number of displayed boxes (50 for main timeframe, 20 per MTF) to prevent performance issues.
Automatically removes older boxes to maintain a clean chart.
Functionality
Visualization: Draws boxes around detected FVGs, with customizable colors and text labels ("FVG" for main timeframe, "FVG " for MTF).
Dynamic Updates: Extends or terminates FVG boxes based on mitigation status and user settings.
Efficient Storage: Uses arrays to manage FVG data (boxes, tops, bottoms, indices, mitigation status, and touch status) separately for main and MTF analyses.
Use Case
This indicator is designed for traders using Smart Money Concepts (SMC) to identify areas of market inefficiency (FVGs) for potential price reversals or continuations. The MTF support allows analysis across different timeframes, aiding in confirming trends or spotting higher-timeframe support/resistance zones.

Optimized ADX DI CCI Strategy### Key Features:
- Combines ADX, DI+/-, CCI, and RSI for signal generation.
- Supports customizable timeframes for indicators.
- Offers multiple exit conditions (Moving Average cross, ADX change, performance-based stop-loss).
- Tracks and displays trade statistics (e.g., win rate, capital growth, profit factor).
- Visualizes trades with labels and optional background coloring.
- Allows countertrading (opening an opposite trade after closing one).
1. **Indicator Calculation**:
- **ADX and DI+/-**: Calculated using the `ta.dmi` function with user-defined lengths for DI and ADX smoothing.
- **CCI**: Computed using the `ta.cci` function with a configurable source (default: `hlc3`) and length.
- **RSI (optional)**: Calculated using the `ta.rsi` function to filter overbought/oversold conditions.
- **Moving Averages**: Used for CCI signal smoothing and trade exits, with support for SMA, EMA, SMMA (RMA), WMA, and VWMA.
2. **Signal Generation**:
- **Buy Signal**: Triggered when DI+ > DI- (or DI+ crosses over DI-), CCI > MA (or CCI crosses over MA), and optional ADX/RSI filters are satisfied.
- **Sell Signal**: Triggered when DI+ < DI- (or DI- crosses over DI+), CCI < MA (or CCI crosses under MA), and optional ADX/RSI filters are satisfied.
3. **Trade Execution**:
- **Entry**: Long or short trades are opened using `strategy.entry` when signals are detected, provided trading is allowed (`allow_long`/`allow_short`) and equity is positive.
- **Exit**: Trades can be closed based on:
- Opposite signal (if no other exit conditions are used).
- MA cross (price crossing below/above the exit MA for long/short trades).
- ADX percentage change exceeding a threshold.
- Performance-based stop-loss (trade loss exceeding a percentage).
- **Countertrading**: If enabled, closing a trade triggers an opposite trade (e.g., closing a long opens a short).
4. **Visualization**:
- Labels are plotted at trade entries/exits (e.g., "BUY," "SELL," arrows).
- Optional background coloring highlights open trades (green for long, red for short).
- A statistics table displays real-time metrics (e.g., capital, win rates).
5. **Trade Tracking**:
- Tracks the number of long/short trades, wins, and overall performance.
- Monitors equity to prevent trading if it falls to zero.
### 2.3 Key Components
- **Indicator Calculations**: Uses `request.security` to fetch indicator data for the specified timeframe.
- **MA Function**: A custom `ma_func` handles different MA types for CCI and exit conditions.
- **Signal Logic**: Combines crossover/under checks with recent bar windows for flexibility.
- **Exit Conditions**: Multiple configurable exit strategies for risk management.
- **Statistics Table**: Updates dynamically with trade and capital metrics.
## 3. Configuration Options
The script provides extensive customization through input parameters, grouped for clarity in the TradingView settings panel. Below is a detailed breakdown of each setting and its impact.
### 3.1 Strategy Settings (Global)
- **Initial Capital**: Default `10000`. Sets the starting capital for backtesting.
- **Effect**: Determines the base equity for calculating position sizes and performance metrics.
- **Default Quantity Type**: `strategy.percent_of_equity` (50% of equity).
- **Effect**: Controls the size of each trade as a percentage of available equity.
- **Pyramiding**: Default `2`. Allows up to 2 simultaneous trades in the same direction.
- **Effect**: Enables multiple entries if conditions are met, increasing exposure.
- **Commission**: 0.2% per trade.
- **Effect**: Simulates trading fees, reducing net profit in backtesting.
- **Margin**: 100% for long and short trades.
- **Effect**: Assumes no leverage; adjust for margin trading simulations.
- **Calc on Every Tick**: `true`.
- **Effect**: Ensures real-time signal updates for precise execution.
### 3.2 Indicator Settings
- **Indicator Timeframe** (`indicator_timeframe`):
- **Options**: `""` (chart timeframe), `1`, `5`, `15`, `30`, `60`, `240`, `D`, `W`.
- **Default**: `""` (uses chart timeframe).
- **Effect**: Determines the timeframe for ADX, DI, CCI, and RSI calculations. A higher timeframe reduces noise but may delay signals.
### 3.3 ADX & DI Settings
- **DI Length** (`adx_di_len`):
- **Default**: `30`.
- **Range**: Minimum `1`.
- **Effect**: Sets the period for calculating DI+ and DI-. Longer periods smooth trends but reduce sensitivity.
- **ADX Smoothing Length** (`adx_smooth_len`):
- **Default**: `14`.
- **Range**: Minimum `1`.
- **Effect**: Smooths the ADX calculation. Longer periods produce smoother ADX values.
- **Use ADX Filter** (`use_adx_filter`):
- **Default**: `false`.
- **Effect**: If `true`, requires ADX to exceed the threshold for signals to be valid, filtering out weak trends.
- **ADX Threshold** (`adx_threshold`):
- **Default**: `25`.
- **Range**: Minimum `0`.
- **Effect**: Sets the minimum ADX value for valid signals when the filter is enabled. Higher values restrict trades to stronger trends.
### 3.4 CCI Settings
- **CCI Length** (`cci_length`):
- **Default**: `20`.
- **Range**: Minimum `1`.
- **Effect**: Sets the period for CCI calculation. Longer periods reduce noise but may lag.
- **CCI Source** (`cci_src`):
- **Default**: `hlc3` (average of high, low, close).
- **Effect**: Defines the price data for CCI. `hlc3` is standard, but users can choose other sources (e.g., `close`).
- **CCI MA Type** (`ma_type`):
- **Options**: `SMA`, `EMA`, `SMMA (RMA)`, `WMA`, `VWMA`.
- **Default**: `SMA`.
- **Effect**: Determines the moving average type for CCI signal smoothing. EMA is more responsive; VWMA weights by volume.
- **CCI MA Length** (`ma_length`):
- **Default**: `14`.
- **Range**: Minimum `1`.
- **Effect**: Sets the period for the CCI MA. Longer periods smooth the MA but may delay signals.
### 3.5 RSI Filter Settings
- **Use RSI Filter** (`use_rsi_filter`):
- **Default**: `false`.
- **Effect**: If `true`, applies RSI-based overbought/oversold filters to signals.
- **RSI Length** (`rsi_length`):
- **Default**: `14`.
- **Range**: Minimum `1`.
- **Effect**: Sets the period for RSI calculation. Longer periods reduce sensitivity.
- **RSI Lower Limit** (`rsi_lower_limit`):
- **Default**: `30`.
- **Range**: `0` to `100`.
- **Effect**: Defines the oversold threshold for buy signals. Lower values allow trades in more extreme conditions.
- **RSI Upper Limit** (`rsi_upper_limit`):
- **Default**: `70`.
- **Range**: `0` to `100`.
- **Effect**: Defines the overbought threshold for sell signals. Higher values allow trades in more extreme conditions.
### 3.6 Signal Settings
- **Cross Window** (`cross_window`):
- **Default**: `0`.
- **Range**: `0` to `5` bars.
- **Effect**: Specifies the lookback period for detecting DI+/- or CCI crosses. `0` requires crosses on the current bar; higher values allow recent crosses, increasing signal frequency.
- **Allow Long Trades** (`allow_long`):
- **Default**: `true`.
- **Effect**: Enables/disables new long trades. If `false`, only closing existing longs is allowed.
- **Allow Short Trades** (`allow_short`):
- **Default**: `true`.
- **Effect**: Enables/disables new short trades. If `false`, only closing existing shorts is allowed.
- **Require DI+/DI- Cross for Buy** (`buy_di_cross`):
- **Default**: `true`.
- **Effect**: If `true`, requires a DI+ crossover DI- for buy signals; if `false`, DI+ > DI- is sufficient.
- **Require CCI Cross for Buy** (`buy_cci_cross`):
- **Default**: `true`.
- **Effect**: If `true`, requires a CCI crossover MA for buy signals; if `false`, CCI > MA is sufficient.
- **Require DI+/DI- Cross for Sell** (`sell_di_cross`):
- **Default**: `true`.
- **Effect**: If `true`, requires a DI- crossover DI+ for sell signals; if `false`, DI+ < DI- is sufficient.
- **Require CCI Cross for Sell** (`sell_cci_cross`):
- **Default**: `true`.
- **Effect**: If `true`, requires a CCI crossunder MA for sell signals; if `false`, CCI < MA is sufficient.
- **Countertrade** (`countertrade`):
- **Default**: `true`.
- **Effect**: If `true`, closing a trade triggers an opposite trade (e.g., close long, open short) if allowed.
- **Color Background for Open Trades** (`color_background`):
- **Default**: `true`.
- **Effect**: If `true`, colors the chart background green for long trades and red for short trades.
### 3.7 Exit Settings
- **Use MA Cross for Exit** (`use_ma_exit`):
- **Default**: `true`.
- **Effect**: If `true`, closes trades when the price crosses the exit MA (below for long, above for short).
- **MA Length for Exit** (`ma_exit_length`):
- **Default**: `20`.
- **Range**: Minimum `1`.
- **Effect**: Sets the period for the exit MA. Longer periods delay exits.
- **MA Type for Exit** (`ma_exit_type`):
- **Options**: `SMA`, `EMA`, `SMMA (RMA)`, `WMA`, `VWMA`.
- **Default**: `SMA`.
- **Effect**: Determines the MA type for exit signals. EMA is more responsive; VWMA weights by volume.
- **Use ADX Change Stop-Loss** (`use_adx_stop`):
- **Default**: `false`.
- **Effect**: If `true`, closes trades when the ADX changes by a specified percentage.
- **ADX % Change for Stop-Loss** (`adx_change_percent`):
- **Default**: `5.0`.
- **Range**: Minimum `0.0`, step `0.1`.
- **Effect**: Specifies the percentage change in ADX (vs. previous bar) that triggers a stop-loss. Higher values reduce premature exits.
- **Use Performance Stop-Loss** (`use_perf_stop`):
- **Default**: `false`.
- **Effect**: If `true`, closes trades when the loss exceeds a percentage threshold.
- **Performance Stop-Loss (%)** (`perf_stop_percent`):
- **Default**: `-10.0`.
- **Range**: `-100.0` to `0.0`, step `0.1`.
- **Effect**: Specifies the loss percentage that triggers a stop-loss. More negative values allow larger losses before exiting.
## 4. Visual and Statistical Output
- **Labels**: Displayed at trade entries/exits with arrows (↑ for buy, ↓ for sell) and text ("BUY," "SELL"). A "No Equity" label appears if equity is zero.
- **Background Coloring**: Optionally colors the chart background (green for long, red for short) to indicate open trades.
- **Statistics Table**: Displayed at the top center of the chart, updated on timeframe changes or trade events. Includes:
- **Capital Metrics**: Initial capital, current capital, capital growth (%).
- **Trade Metrics**: Total trades, long/short trades, win rate, long/short win rates, profit factor.
- **Open Trade Status**: Indicates if a long, short, or no trade is open.
## 5. Alerts
- **Buy Signal Alert**: Triggered when `buy_signal` is true ("Cross Buy Signal").
- **Sell Signal Alert**: Triggered when `sell_signal` is true ("Cross Sell Signal").
- **Usage**: Users can set up TradingView alerts to receive notifications for trade signals.

Price Action [BreakOut] InternalKey Features and Functionality
Support & Resistance (S/R): The script automatically identifies and draws support and resistance lines based on a user-defined "swing period." These lines are drawn from recent pivot points, and users can customize their appearance, including color, line style (solid, dashed, dotted), and extension (left, right, or both). The indicator can also display the exact price of each S/R level.
Trendlines: It draws trendlines connecting pivot highs and pivot lows. This feature helps visualize the current trend direction. Users can choose to show only the newest trendlines, customize their length and style, and select the source for the pivot points (e.g., candle close or high/low shadow).
Price Action Pivots: This is a core component that identifies and labels different types of pivots based on price action: Higher Highs (HH), Lower Highs (LH), Higher Lows (HL), and Lower Lows (LL). These pivots are crucial for understanding market structure and identifying potential trend changes. The script marks these pivots with shapes and can display their price values.
Fractal Breakouts: The script identifies and signals "fractal breakouts" and "breakdowns" when the price closes above a recent high pivot or below a recent low pivot, respectively. These signals are visually represented with up (⬆) and down (⬇) arrow symbols on the chart.
Customization and Alerts: The indicator is highly customizable. You can toggle on/off various features (S/R, trendlines, pivots, etc.), adjust colors, line styles, and text sizes. It also includes an extensive list of alert conditions, allowing traders to receive notifications for:
Price Crossovers: When the close price crosses over or under a support or resistance level.
Trendline Breaks: When the price breaks above an upper trendline or below a lower trendline.
Fractal Breaks: When a fractal breakout or breakdown occurs.

FlowScope [Hapharmonic]FlowScope: Uncover the Market's True Intent 🔬
Ever wished you could look inside the candles and see where the real action is happening? FlowScope is your microscope for the market's flow, designed to give you a powerful edge by revealing the volume distribution that price action alone can't show you.
Instead of just looking at the open, high, low, and close, FlowScope lets you dive deeper into the market's auction process. It groups candles together and builds a detailed Volume Profile for that period, showing you exactly where the trading happened and revealing the story behind the price action.
Let's explore how you can use it to gain a powerful new edge.
🧐 Core Concept: How It Works
At its heart, FlowScope does three key things:
It Groups Candles: You decide how many candles to group together. For example, setting " Group Candles " to 4 on a 5-minute chart effectively gives you a detailed 20-minute candle and profile. This helps you see the bigger picture and filter out market noise.
It Builds a Volume Profile: For each group, FlowScope analyzes the volume at every single price level. It then displays this as a horizontal histogram (we call this a "footprint" or profile). Longer bars mean more volume was traded at that price, indicating a "fair" price or an area of acceptance. Shorter bars mean price moved through quickly, indicating rejection.
It Creates a Custom "Grouped Candle": To summarize the group's overall price action, FlowScope draws a single, custom candle representing the entire group's:
Open: The open of the first candle in the group.
High: The absolute highest price reached within the group.
Low: The absolute lowest price reached within the group.
Close: The close of the last candle in the group.
This gives you a crystal-clear view of the group's net result, free from the back-and-forth noise of the individual candles inside it.
Below are some of the stunning preset color palettes you can choose from to customize your view:
🚀 How to Use: Practical Applications
FlowScope isn't just for looking pretty; it's a powerful analysis tool. Here are a few ways to integrate it into your trading:
Identify High-Volume Nodes (HVNs): Look for the longest bars in the profile. These are price levels where the market spent the most time and traded the most volume. HVNs often act as powerful "magnets" for price, becoming key areas of support and resistance.
Spot Low-Volume Nodes (LVNs): These are areas with very short bars or gaps in the profile. They represent price levels that the market moved through quickly and inefficiently. If price returns to an LVN, it's likely to move through it quickly again.
Analyze the Summary Box: This is where the real magic happens! ✨
Total Volume (Σ): The total volume for the entire group.
Buy (B) vs. Sell (S) Volume: FlowScope analyzes the lower timeframe action to estimate the buying and selling pressure that made up the total volume. Is a big red candle mostly aggressive selling, or was it just a lack of buyers? The B/S data gives you clues. A high-volume candle with nearly 50/50 buy/sell pressure might indicate absorption or a potential reversal.
Use the Grouped Candle for Clarity: Is the market in a clear uptrend, or is it just choppy? The grouped candle can give you a much clearer signal. A series of strong, green grouped candles shows much more conviction than a mix of small green and red candles.
⚙️ Settings & Customization
This is where you can truly make FlowScope your own. Let's walk through each setting.
Profile Settings
Group Candles: The number of standard chart candles you want to combine into a single FlowScope profile. A setting of 1 will analyze every single bar. A higher number gives you a broader market view. When Group Candles is set to 5, the data from the 5 individual candles are combined, and the volume is calculated accordingly.
Max Profile Boxes: This setting is more than just a number; it's a smart limit that ensures your profiles are always readable and relevant to the current market conditions.
Adaptive Sizing (The Ideal Goal): FlowScope first tries to create the perfect profile by making each volume box's height proportional to the current market volatility. It calculates an "ideal" box height based on the Average True Range ( ATR / 10 ). This is powerful because it automatically adapts: you get smaller, more detailed boxes in quiet, low-volatility markets, and larger, clearer boxes in volatile, fast-moving markets.
The Safety Cap (Your Setting): However, what if you group several candles during a massive price move? The price range could be huge! If we only used the small, ATR-based box height, you might end up with hundreds of tiny, unreadable boxes. This is where your Max Profile Boxes setting (defaulting to 50) comes in. It acts as a maximum detail cap . If the adaptive, volatility-based calculation determines that it would need more boxes than your setting (e.g., more than 50), the indicator will override it. It will then simply divide the entire price range of the group into exactly the number of boxes you specified (e.g., 50).
In short: You are setting the maximum allowable detail. FlowScope intelligently adapts the profile's granularity below that limit based on market volatility, ensuring you always get a clear and meaningful picture.
Style
Show Profile BG: A simple toggle to show or hide the faint background color behind the volume bars. Turning it off can create a cleaner look.
Color Mode: This dropdown controls how the volume profile text is colored.
Custom Gradient: This mode uses the three custom colors you select in the "Profile Colors" section to create a beautiful gradient across the profile.
Candle Color: This mode colors the profile based on whether the grouped candle was bullish (green) or bearish (red). The color will be a gradient, with the most intense color applied to the box with the highest volume; the colors of the other boxes will fade out from that point. It's a great way to see the profile's "mood" at a glance.
Profile Colors 🎨
Use Preset Palette: This is the master switch!
If checked: You can choose from 10 stunning, pre-designed color palettes from the Palette dropdown. The custom color pickers below will be disabled.
If unchecked (Default): The Palette dropdown will be disabled, and you can now choose your own three colors for the gradient.
Palette: (Only active when "Use Preset Palette" is checked) . Choose from 10 luxurious, eye-catching color schemes like "Solar Flare" or "Deep Space" to instantly change the look and feel of your chart.
Low Price / Mid Price / High Price: (Only active when "Use Preset Palette" is unchecked) . These three color pickers allow you to design your own unique gradient for the Custom Gradient color mode.
Candle Display
These settings control the custom "Grouped Candle" that summarizes the profile. When using the "Show Custom Candle" feature, you should change the chart's candlestick display to Bars for a cleaner view.
Show Custom Candle: This is the main toggle. When you check this box, the original chart candles will be hidden, and your custom FlowScope candle will be displayed instead. This custom candle is intentionally small to ensure it does not visually overlap with the volume profile boxes.
Show Body: (Only active when "Show Custom Candle" is checked) . Toggles the visibility of the candle's body.
Wick Width & Body Width: (Only active when "Show Custom Candle" is checked) . These sliders let you control the thickness of the wick and body lines to match your personal style.
Up Color / Down Color: (Only active when "Show Custom Candle" is checked) . Choose the colors for your bullish and bearish custom candles.
Experiment with the settings, find a style that works for you, and start seeing the market in a whole new light.
Happy trading! 📈😊

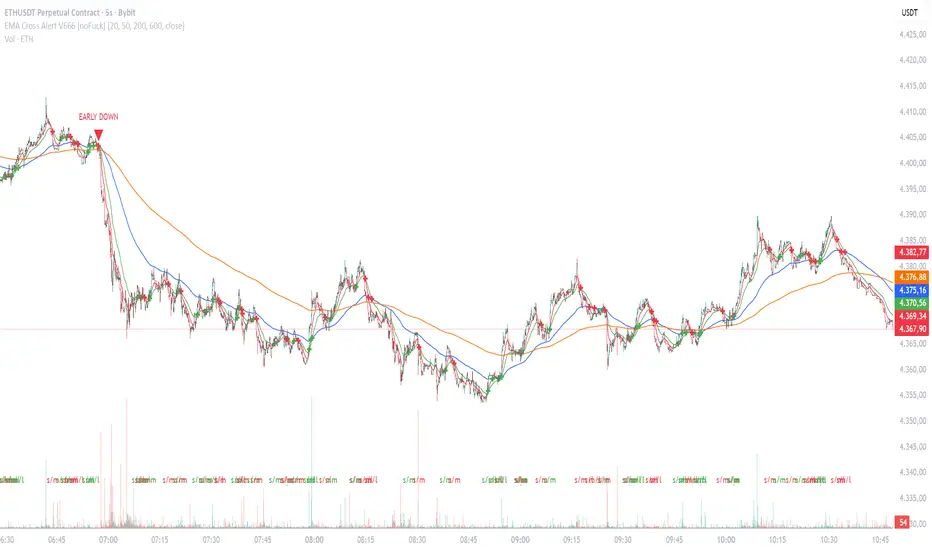
EMA Cross Alert V666 [noFuck]EMA Cross Alert — What it does
EMA Cross Alert watches three EMAs (Short, Mid, Long), detects their crossovers, and reports exactly one signal per bar by priority: EARLY > Short/Mid > Mid/Long > Short/Long. Optional EARLY mode pings when Short crosses Long while Mid is still between them—your polite early heads-up.
Why you might like it
Three crossover types: s/m, m/l, s/l
EARLY detection: earlier hints, not hype
One signal per bar: less noise, more focus
Clear visuals: tags, big cross at signal price, EARLY triangles
Alert-ready: dynamic alert text on bar close + static alertconditions for UI
Inputs (plain English)
Short/Mid/Long EMA length — how fast each EMA reacts
Extra EMA length (visual only) — context EMA; does not affect signals
Price source — e.g., Close
Show cross tags / EARLY triangles / large cross — visual toggles
Enable EARLY signals (Short/Long before Mid) — turn early pings on/off
Count Mid EMA as "between" even when equal (inclusive) — ON: Mid counts even if exactly equal to Short or Long; OFF (default): Mid must be strictly between them
Enable dynamic alerts (one per bar close) — master alert switch
Alert on Short/Mid, Mid/Long, Short/Long, EARLY — per-signal alert toggles
Quick tips
Start with defaults; if you want more EARLY on smooth/low-TF markets, turn “inclusive” ON
Bigger lengths = calmer trend-following; smaller = faster but choppier
Combine with volume/structure/risk rules—the indicator is the drummer, not the whole band
Disclaimer
Alerts, labels, and triangles are not trade ideas or financial advice. They are informational signals only. You are responsible for entries, exits, risk, and position sizing. Past performance is yesterday; the future is fashionably late.
Credits
Built with the enthusiastic help of Code Copilot (AI)—massively involved, shamelessly proud, and surprisingly good at breakfasting on exponential moving averages.
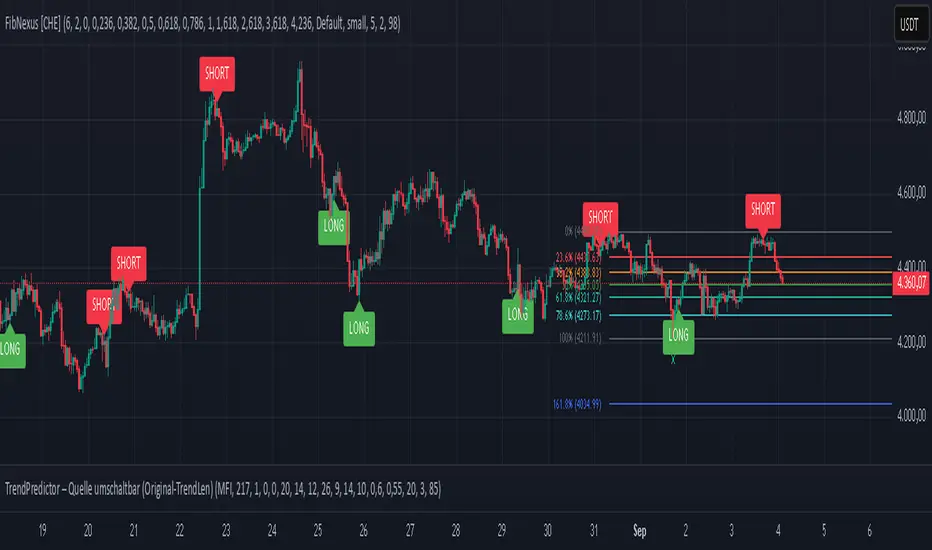
FibNexus [CHE]FibNexus — Auto-Fibonacci with Adaptive TrendLen + TFRSI Triggers
What it is.
FibNexus is a chart overlay that auto-anchors Fibonacci levels to the most relevant swing range without any manual timeframe picking. It does this by computing an adaptive trend length (“TrendLen”) from recent price behavior, then drawing retracements/extensions from the detected swing High/Low. A built-in TFRSI module adds LONG/SHORT triggers and ready-made alerts.
What makes FibNexus different (the TrendLen edge)
Most Fibonacci tools either (a) use fixed lookbacks or (b) force you to choose a higher reference timeframe (or a multiplier of it) and then place Fibs on those higher-TF swings. Your earlier Ultimate Fibonacci Trading Tool \ follows that higher-reference approach (auto TF, multiplier, or manual) and emphasizes custom level/label options. ( )
FibNexus flips that workflow:
* It doesn’t rely on a higher timeframe or a static lookback.
* Instead, it measures multiple window lengths inside the current chart timeframe and selects the one that best fits the data right now.
* From that data-driven window, it automatically finds the most recent swing high & low and draws the entire Fib stack from there.
* When the statistically “best” window changes, anchors update once, labels refresh cleanly, and then lines just extend to the right on each new bar.
Result: No more guesswork about “which timeframe or lookback should I use?”—FibNexus adapts the anchors to market conditions and keeps the drawing noise low.
How TrendLen works (transparent, deterministic)
1. Scan windows: The script evaluates a series of lookbacks (10, 20, …, 500 bars).
2. Score by correlation: For each window, it computes the correlation between price and its lagged version and picks the window with the highest correlation (the strongest, most self-consistent trend segment).
3. Anchor the swing: On a confirmed bar and only when TrendLen changes, it scans the last `TrendLen` bars to capture the highest high and lowest low and marks them with “X”.
4. Draw once, extend later: It deletes the old Fib objects, redraws the active levels from those anchors, and from then on extends the lines to the right as new bars print (no redraw spam).
This makes FibNexus responsive (it adapts when the structure shifts) and quiet (it doesn’t constantly repaint Fibs).
Fibonacci engine (levels, labels, direction)
* Retracements: 0.000 · 0.236 · 0.382 · 0.500 · 0.618 · 0.786 · 1.000
* Extensions: 1.618 · 2.618 · 3.618 · 4.236
* Label styles: *Default* (percent + price), *None*, *Percentage*, *Price*
* Label sizing: *tiny → huge*
* Bull/Bear context: Direction is inferred from mid-range positioning; prices are projected accordingly (retracement vs. extension math is handled for both cases).
* Selective toggles: You can show/hide any level and color it independently.
Momentum & signals (TFRSI module)
FibNexus embeds your TFRSI (“The Forbidden RSI \ ”) as the momentum/trigger layer. TFRSI is your open-source oscillator published on TradingView and designed for fast, normalized momentum readouts with customizable length/smoothing. ( )
* Defaults: `TFRSI length = 6`, `signal smoothing = 2`
* Triggers:
* LONG when TFRSI crosses up through the Long level (default 2.0)
* SHORT when TFRSI crosses down through the Short level (default 98.0)
* On-chart labels: Green LONG under the bar, red SHORT above the bar.
* Spam control: Keep only the N most recent labels to avoid clutter.
* Confirmed bars only: Signals/labels finalize at bar close to reduce flicker.
Alerts (ready for TradingView)
* LONG signal (TFRSI crossover)
* SHORT signal (TFRSI crossunder)
* TrendLen changed (anchors/Fibs recalculated)
* Price crossed a Fib level (any active level)
Use the provided `alertcondition(...)` entries in the TV dialog. Optionally enable instant `alert()` calls with verbose text (avoid duplicates if you also add alertconditions).
Typical use-cases & playbook
* Level reaction trading: In trends, watch 0.382 / 0.5 / 0.618 for reaction. A TFRSI up-cross near a retracement in an uptrend is a straightforward continuation setup; the opposite applies in downtrends.
* Breakout objectives: After clearing the 1.000 line (old swing), 1.618 is a common first extension target; beyond that, 2.618/3.618/4.236 map stretch objectives.
* Chop control: In range conditions, keep signals conservative (e.g., stick with the tight defaults 2.0/98.0 or raise thresholds). Always seek confluence (candlesticks, volume, HTF bias).
* Less micromanagement: You don’t need to babysit timeframe selection or anchors—TrendLen recomputes only when the data say so.
Inputs (by group)
* Core: TFRSI length & smoothing.
* Fibonacci Levels: Per-level toggles, numeric values, colors.
* Fibonacci Labels: Style (percentage/price/both/none) and size.
* Signals: Max number of visible LONG/SHORT labels (or 0 = off).
* TFRSI Trigger: Long/Short thresholds (defaults 2.0 / 98.0).
* Alerts: Master enable, per-event toggles, optional instant `alert()`.
Performance & UX
* Overlay indicator; efficient object handling.
* Clean redraw policy: Full re-draw only when TrendLen changes; otherwise Fibs extend horizontally.
* Clarity: Auto-marked swing anchors (“X”), configurable labels/colors.
Credits & references
* TFRSI – “The Forbidden RSI \ ” (open-source publication and description on TradingView). Used here as the momentum basis.
* “Ultimate Fibonacci Trading Tool \ ” (your earlier open-source tool on TradingView). Focuses on higher-reference timeframe selection (auto/multiplier/manual) and rich labeling controls; FibNexus replaces the fixed/higher-TF anchor logic with adaptive TrendLen in the current timeframe.
Risk disclaimer
This indicator is for educational/information purposes only and is not financial advice. No performance guarantees; past behavior does not predict future results. Trading involves substantial risk (including total loss). Always do your own research, test on demo, use risk management, and consult a licensed advisor where appropriate. Use at your own risk.
Disclaimer:
The content provided, including all code and materials, is strictly for educational and informational purposes only. It is not intended as, and should not be interpreted as, financial advice, a recommendation to buy or sell any financial instrument, or an offer of any financial product or service. All strategies, tools, and examples discussed are provided for illustrative purposes to demonstrate coding techniques and the functionality of Pine Script within a trading context.
Any results from strategies or tools provided are hypothetical, and past performance is not indicative of future results. Trading and investing involve high risk, including the potential loss of principal, and may not be suitable for all individuals. Before making any trading decisions, please consult with a qualified financial professional to understand the risks involved.
By using this script, you acknowledge and agree that any trading decisions are made solely at your discretion and risk.
Enhance your trading precision and confidence with FibNexus ! 🚀
Happy trading
Chervolino
Elliott Wave Rule EngineWhat this tool does
The indicator scans price for two concurrent swing structures—a Small (shorter-degree) and a Large (higher-degree) set—then applies an Elliott/NeoWave rule engine to the most recent 5-swing motive (1-2-3-4-5) or 3-swing corrective (A-B-C). It produces:
Blue lines for Small swings and Orange lines for Large swings.
A rule dashboard (optional) showing PASS/FAIL/WARN for core rules & guidelines.
Buy/Sell labels when (a) a valid motive completes and (b) loop “consensus,” alignment, and scoring gates are satisfied.
Reading the chart
Small swings: thin blue segments, built from your Small settings.
Large swings: thicker orange segments, from your Large settings.
Background tint: faint green when a motive (impulse/diagonal) is valid right now on Small.
Labels (if enabled):
“1…5” or “A-B-C” markers on the latest detected structure.
Buy/Sell label at the last pivot when all gates pass; text may include a score %.
How it works
For both Small and Large degrees the script:
- Loops over all (left, right) combinations you specify (e.g., Small Left = 3..6, Right = 0..0) and calls ta.pivothigh/low.
- Aggregates the results:
- Keeps the most extreme pivot found in the loop (highest high or lowest low) that’s newer than the last accepted swing.
- Gates acceptance by minimum % change versus the last opposite swing (inside the loop) and a post-aggregation filter (Small Minimum swing %, Large Minimum swing %).
- Merges back-to-back same-type swings (HH or LL) by keeping only the more extreme one.
- Keeps only the last N=lookbackWaves swings (default 100).
- Consensus (used for signals) comes from the loop counts:
- sBuyConsensus = small L-count / total-combos (bullish bias)
- sSellConsensus = small H-count / total-combos (bearish bias)
(and the same for Large). This is a data-driven “how many combos agreed” measure.
2) Rule engine (Impulse/Diagonal vs. Corrective)
When there are at least 6 Small swings, the engine tests 1-2-3-4-5:
Hard rules (must pass for an Impulse):
- Wave-2 not > 100% of Wave-1 (no retrace beyond start of W1).
- Wave-3 not the shortest among 1,3,5.
- Wave-4 doesn’t overlap Wave-1 (if it does, structure may be a Diagonal).
- Diagonal eligibility: Rules 1 & 2 pass but Rule 3 fails ⇒ eligible as a Diagonal (
Guidelines (7 checks, count toward a threshold you set):
- W2 retraces a Fib level (within ±fibTol).
- W4 retraces a Fib level (within ±fibTol).
- W3 strongest momentum (speed = |Δprice| / bars).
- Alternation: W2 vs W4 have meaningfully different “sharpness” (price per bar), threshold altSlopeThr.
- Proportion (Price): |W1| and |W3| within propTolP× each other.
- Proportion (Time): W1W3 and W2W4 durations within propTolT×.
- W5 weaker than W3 (momentum divergence proxy).
A Motive is valid if:
- Impulse: all 3 hard rules pass and guideline passes ≥ Min guideline passes.
- Diagonal: diagonal-eligible and guideline passes ≥ Min guideline passes.
- if motive fails, the engine still evaluates ABC as Zigzag and Flat to populate the table:
- Zigzag: B shallower than ~0.618A; C ≈ A or 1.618A (±fibTol).
- Flat: B ≥ ~0.9A; expanded flat if B > 1.0A and C in *A; “running” note if C < A.
3) Signal logic (consensus-gated & scored)
Signals fire only on new Small pivots and only if a Small motive just validated:Direction comes from the motive’s W1 (up = bull, down = bear).
Consensus checks (from the loop):
Use Sell consensus if the last pivot is a High, or Buy consensus if it’s a Low.Require it ≥ Min SMALL loop consensus and ahead of the opposite side by at least Min consensus margin.If you also require Large quality: check the corresponding Large consensus ≥ Min LARGE loop consensus.
Alignment: If Require small/large directional alignment is ON, Small and Large directions must match (or the Large motive must be complete).
Score:
- If Large not required: finalScore = smallConsensus × smallQuality.
- If Large required: finalScore = smallConsensus × smallQuality × largeQuality.
- Need finalScore ≥ Min final score.
When all gates pass, you’ll see “Buy xx%” or “Sell xx%” at the pivot.
Inputs (explained):
- Smaller Wave Swing Detection (Looped)
- Small Left Min / Max (default 3..6): ta.pivot* left widths to scan.
- Small Right Min / Max (default 0..0): right widths to scan (0 = earliest confirmation).
- Small Minimum swing % (post-aggregation) (0.3%): filters out tiny swings after the loop.
- Larger Wave Swing Detection (Looped)
- Large Left Min / Max (100..200) and Right Min/Max (0..0): higher-degree scan (defaults are big; adjust for intraday).
- Large Minimum swing % (post-aggregation) (1.5%).
- Loop Filters (inside the loop)
- Small loop min % change (0.20%): a candidate pivot counts only if move vs. last opposite Small swing ≥ this.
- Large loop min % change (1.50%): same idea for Large.
Rule Engine Tolerances
- Fibonacci tolerance (±%) (0.05 = 5%): closeness to Fib levels.
-Same-degree TIME proportion max (x) (2.00×) and PRICE proportion max (x) (3.00×).
- Alternation slope ratio threshold (0.10): higher = stricter alternation.
- Min guideline passes (0–7) (5): threshold for motive validity.
- Signal Probability (Loop Consensus)
- Min SMALL loop consensus (0.60).
- Min LARGE loop consensus (0.50) (used only if Large validation matters).
- Min consensus margin vs opposite (0.10): e.g., 0.60 vs 0.45 fails (margin 0.15 passes).
Require LARGE 1–5 valid (or diagonal) for signal (off by default).
Min final score (0.20): gate on the composite score.
Annotate label with score % (on).
WARN (orange): guideline not met—pattern can still be valid if total passes ≥ Min guideline passes.
FAQ
Q: Why did I get a diagonal instead of an impulse?
A: Wave-4 overlapped Wave-1 (Rule 3). If Rules 1 & 2 pass and guidelines meet your minimum, it’s eligible as a Diagonal.
Q: Where do Buy/Sell labels come from?
A: Only after a valid Small motive at a new pivot, and only if consensus, alignment, and final score gates pass (per your settings).
Q: It “missed” a wave in hindsight.
A: Pivots require right bars to confirm; extremely tight settings can filter that swing; adjust Small min % or ranges.
Q: Are there repaints?
A: No, It uses standard pivot confirmation; until a pivot is confirmed, recent swings can evolve. After confirmation, lines/labels are stable.
Limitations & disclaimers
Elliott/NeoWave rules are heuristics; markets are messy. Treat outputs as structured context, not certainty.
Consensus is pattern-scan agreement, not probability of profit Not investment advice; always couple with risk management.

Martingale Strategy Simulator [BackQuant]Martingale Strategy Simulator
Purpose
This indicator lets you study how a martingale-style position sizing rule interacts with a simple long or short trading signal. It computes an equity curve from bar-to-bar returns, adapts position size after losing streaks, caps exposure at a user limit, and summarizes risk with portfolio metrics. An optional Monte Carlo module projects possible future equity paths from your realized daily returns.
What a martingale is
A martingale sizing rule increases stake after losses and resets after a win. In its classical form from gambling, you double the bet after each loss so that a single win recovers all prior losses plus one unit of profit. In markets there is no fixed “even-money” payout and returns are multiplicative, so an exact recovery guarantee does not exist. The core idea is unchanged:
Lose one leg → increase next position size
Lose again → increase again
Win → reset to the base size
The expectation of your strategy still depends on the signal’s edge. Sizing does not create positive expectancy on its own. A martingale raises variance and tail risk by concentrating more capital as a losing streak develops.
What it plots
Equity – simulated portfolio equity including compounding
Buy & Hold – equity from holding the chart symbol for context
Optional helpers – last trade outcome, current streak length, current allocation fraction
Optional diagnostics – daily portfolio return, rolling drawdown, metrics table
Optional Monte Carlo probability cone – p5, p16, p50, p84, p95 aggregate bands
Model assumptions
Bar-close execution with no slippage or commissions
Shorting allowed and frictionless
No margin interest, borrow fees, or position limits
No intrabar moves or gaps within a bar (returns are close-to-close)
Sizing applies to equity fraction only and is capped by your setting
All results are hypothetical and for education only.
How the simulator applies it
1) Directional signal
You pick a simple directional rule that produces +1 for long or −1 for short each bar. Options include 100 HMA slope, RSI above or below 50, EMA or SMA crosses, CCI and other oscillators, ATR move, BB basis, and more. The stance is evaluated bar by bar. When the stance flips, the current trade ends and the next one starts.
2) Sizing after losses and wins
Position size is a fraction of equity:
Initial allocation – the starting fraction, for example 0.15 means 15 percent of equity
Increase after loss – multiply the next allocation by your factor after a losing leg, for example 2.00 to double
Reset after win – return to the initial allocation
Max allocation cap – hard ceiling to prevent runaway growth
At a high level the size after k consecutive losses is
alloc(k) = min( cap , base × factor^k ) .
In practice the simulator changes size only when a leg ends and its PnL is known.
3) Equity update
Let r_t = close_t / close_{t-1} − 1 be the symbol’s bar return, d_{t−1} ∈ {+1, −1} the prior bar stance, and a_{t−1} the prior bar allocation fraction. The simulator compounds:
eq_t = eq_{t−1} × (1 + a_{t−1} × d_{t−1} × r_t) .
This is bar-based and avoids intrabar lookahead. Costs, slippage, and borrowing costs are not modeled.
Why traders experiment with martingale sizing
Mean-reversion contexts – if the signal often snaps back after a string of losses, adding size near the tail of a move can pull the average entry closer to the turn
Behavioral or microstructure edges – some rules have modest edge but frequent small whipsaws; size escalation may shorten time-to-recovery when the edge manifests
Exploration and stress testing – studying the relationship between streaks, caps, and drawdowns is instructive even if you do not deploy martingale sizing live
Why martingale is dangerous
Martingale concentrates capital when the strategy is performing worst. The main risks are structural, not cosmetic:
Loss streaks are inevitable – even with a 55 percent win rate you should expect multi-loss runs. The probability of at least one k-loss streak in N trades rises quickly with N.
Size explodes geometrically – with factor 2.0 and base 10 percent, the sequence is 10, 20, 40, 80, 100 (capped) after five losses. Without a strict cap, required size becomes infeasible.
No fixed payout – in gambling, one win at even odds resets PnL. In markets, there is no guaranteed bounce nor fixed profit multiple. Trends can extend and gaps can skip levels.
Correlation of losses – losses cluster in trends and in volatility bursts. A martingale tends to be largest just when volatility is highest.
Margin and liquidity constraints – leverage limits, margin calls, position limits, and widening spreads can force liquidation before a mean reversion occurs.
Fat tails and regime shifts – assumptions of independent, Gaussian returns can understate tail risk. Structural breaks can keep the signal wrong for much longer than expected.
The simulator exposes these dynamics in the equity curve, Max Drawdown, VaR and CVaR, and via Monte Carlo sketches of forward uncertainty.
Interpreting losing streaks with numbers
A rough intuition: if your per-trade win probability is p and loss probability is q=1−p , the chance of a specific run of k consecutive losses is q^k . Over many trades, the chance that at least one k-loss run occurs grows with the number of opportunities. As a sanity check:
If p=0.55 , then q=0.45 . A 6-loss run has probability q^6 ≈ 0.008 on any six-trade window. Across hundreds of trades, a 6 to 8-loss run is not rare.
If your size factor is 1.5 and your base is 10 percent, after 8 losses the requested size is 10% × 1.5^8 ≈ 25.6% . With factor 2.0 it would try to be 10% × 2^8 = 256% but your cap will stop it. The equity curve will still wear the compounded drawdown from the sequence that led to the cap.
This is why the cap setting is central. It does not remove tail risk, but it prevents the sizing rule from demanding impossible positions
Note: The p and q math is illustrative. In live data the win rate and distribution can drift over time, so real streaks can be longer or shorter than the simple q^k intuition suggests..
Using the simulator productively
Parameter studies
Start with conservative settings. Increase one element at a time and watch how the equity, Max Drawdown, and CVaR respond.
Initial allocation – lower base reduces volatility and drawdowns across the board
Increase factor – set modestly above 1.0 if you want the effect at all; doubling is aggressive
Max cap – the most important brake; many users keep it between 20 and 50 percent
Signal selection
Keep sizing fixed and rotate signals to see how streak patterns differ. Trend-following signals tend to produce long wrong-way streaks in choppy ranges. Mean-reversion signals do the opposite. Martingale sizing interacts very differently with each.
Diagnostics to watch
Use the built-in metrics to quantify risk:
Max Drawdown – worst peak-to-trough equity loss
Sharpe and Sortino – volatility and downside-adjusted return
VaR 95 percent and CVaR – tail risk measures from the realized distribution
Alpha and Beta – relationship to your chosen benchmark
If you would like to check out the original performance metrics script with multiple assets with a better explanation on all metrics please see
Monte Carlo exploration
When enabled, the forecast draws many synthetic paths from your realized daily returns:
Choose a horizon and a number of runs
Review the bands: p5 to p95 for a wide risk envelope; p16 to p84 for a narrower range; p50 as the median path
Use the table to read the expected return over the horizon and the tail outcomes
Remember it is a sketch based on your recent distribution, not a predictor
Concrete examples
Example A: Modest martingale
Base 10 percent, factor 1.25, cap 40 percent, RSI>50 signal. You will see small escalations on 2 to 4 loss runs and frequent resets. The equity curve usually remains smooth unless the signal enters a prolonged wrong-way regime. Max DD may rise moderately versus fixed sizing.
Example B: Aggressive martingale
Base 15 percent, factor 2.0, cap 60 percent, EMA cross signal. The curve can look stellar during favorable regimes, then a single extended streak pushes allocation to the cap, and a few more losses drive deep drawdown. CVaR and Max DD jump sharply. This is a textbook case of high tail risk.
Strengths
Bar-by-bar, transparent computation of equity from stance and size
Explicit handling of wins, losses, streaks, and caps
Portable signal inputs so you can A–B test ideas quickly
Risk diagnostics and forward uncertainty visualization in one place
Example, Rolling Max Drawdown
Limitations and important notes
Martingale sizing can escalate drawdowns rapidly. The cap limits position size but not the possibility of extended adverse runs.
No commissions, slippage, margin interest, borrow costs, or liquidity limits are modeled.
Signals are evaluated on closes. Real execution and fills will differ.
Monte Carlo assumes independent draws from your recent return distribution. Markets often have serial correlation, fat tails, and regime changes.
All results are hypothetical. Use this as an educational tool, not a production risk engine.
Practical tips
Prefer gentle factors such as 1.1 to 1.3. Doubling is usually excessive outside of toy examples.
Keep a strict cap. Many users cap between 20 and 40 percent of equity per leg.
Stress test with different start dates and subperiods. Long flat or trending regimes are where martingale weaknesses appear.
Compare to an anti-martingale (increase after wins, cut after losses) to understand the other side of the trade-off.
If you deploy sizing live, add external guardrails such as a daily loss cut, volatility filters, and a global max drawdown stop.
Settings recap
Backtest start date and initial capital
Initial allocation, increase-after-loss factor, max allocation cap
Signal source selector
Trading days per year and risk-free rate
Benchmark symbol for Alpha and Beta
UI toggles for equity, buy and hold, labels, metrics, PnL, and drawdown
Monte Carlo controls for enable, runs, horizon, and result table
Final thoughts
A martingale is not a free lunch. It is a way to tilt capital allocation toward losing streaks. If the signal has a real edge and mean reversion is common, careful and capped escalation can reduce time-to-recovery. If the signal lacks edge or regimes shift, the same rule can magnify losses at the worst possible moment. This simulator makes those trade-offs visible so you can calibrate parameters, understand tail risk, and decide whether the approach belongs anywhere in your research workflow.

Live Market - Performance MonitorLive Market — Performance Monitor
Study material (no code) — step-by-step training guide for learners
________________________________________
1) What this tool is — short overview
This indicator is a live market performance monitor designed for learning. It scans price, volume and volatility, detects order blocks and trendline events, applies filters (volume & ATR), generates trade signals (BUY/SELL), creates simple TP/SL trade management, and renders a compact dashboard summarizing market state, risk and performance metrics.
Use it to learn how multi-factor signals are constructed, how Greeks-style sensitivity is replaced by volatility/ATR reasoning, and how a live dashboard helps monitor trade quality.
________________________________________
2) Quick start — how a learner uses it (step-by-step)
1. Add the indicator to a chart (any ticker / timeframe).
2. Open inputs and review the main groups: Order Block, Trendline, Signal Filters, Display.
3. Start with defaults (OB periods ≈ 7, ATR multiplier 0.5, volume threshold 1.2) and observe the dashboard on the last bar.
4. Walk the chart back in time (use the last-bar update behavior) and watch how signals, order blocks, trendlines, and the performance counters change.
5. Run the hands-on labs below to build intuition.
________________________________________
3) Main configurable inputs (what you can tweak)
• Order Block Relevant Periods (default ~7): number of consecutive candles used to define an order block.
• Min. Percent Move for Valid OB (threshold): minimum percent move required for a valid order block.
• Number of OB Channels: how many past order block lines to keep visible.
• Trendline Period (tl_period): pivot lookback for detecting highs/lows used to draw trendlines.
• Use Wicks for Trendlines: whether pivot uses wicks or body.
• Extension Bars: how far trendlines are projected forward.
• Use Volume Filter + Volume Threshold Multiplier (e.g., 1.2): requires volume to be greater than multiplier × average volume.
• Use ATR Filter + ATR Multiplier: require bar range > ATR × multiplier to filter noise.
• Show Targets / Table settings / Colors for visualization.
________________________________________
4) Core building blocks — what the script computes (plain language)
Price & trend:
• Spot / LTP: current close price.
• EMA 9 / 21 / 50: fast, medium, slow moving averages to define short/medium trend.
o trend_bullish: EMA9 > EMA21 > EMA50
o trend_bearish: EMA9 < EMA21 < EMA50
o trend_neutral: otherwise
Volatility & noise:
• ATR (14): average true range used for dynamic target and filter sizing.
• dynamic_zone = ATR × atr_multiplier: minimum bar range required for meaningful move.
• Annualized volatility: stdev of price changes × sqrt(252) × 100 — used to classify volatility (HIGH/MEDIUM/LOW).
Momentum & oscillators:
• RSI 14: overbought/oversold indicator (thresholds 70/30).
• MACD: EMA(12)-EMA(26) and a 9-period signal line; histogram used for momentum direction and strength.
• Momentum (ta.mom 10): raw momentum over 10 bars.
Mean reversion / band context:
• Bollinger Bands (20, 2σ): upper, mid, lower.
o price_position measures where price sits inside the band range as 0–100.
Volume metrics:
• avg_volume = SMA(volume, 20) and volume_spike = volume > avg_volume × volume_threshold
o volume_ratio = volume / avg_volume
Support & Resistance:
• support_level = lowest low over 20 bars
• resistance_level = highest high over 20 bars
• current_position = percent of price between support & resistance (0–100)
________________________________________
5) Order Block detection — concept & logic
What it tries to find: a bar (the base) followed by N candles in the opposite direction (a classical order block setup), with a minimum % move to qualify. The script records the high/low of the base candle, averages them, and plots those levels as OB channels.
How learners should think about it (conceptual):
1. An order block is a signature area where institutions (theory) left liquidity — often seen as a large bar followed by a sequence of directional candles.
2. This indicator uses a configurable number of subsequent candles to confirm that the pattern exists.
3. When found, it stores and displays the base candle’s high/low area so students can see how price later reacts to those zones.
Implementation note for learners: the tool keeps a limited history of OB lines (ob_channels). When new OBs exceed the count, the oldest lines are removed — good practice to avoid clutter.
________________________________________
6) Trendline detection — idea & interpretation
• The script finds pivot highs and lows using a symmetric lookback (tl_period and half that as right/left).
• It then computes a trendline slope from successive pivots and projects the line forward (extension_bars).
• Break detection: Resistance break = close crosses above the projected resistance line; Support break = close crosses below projected support.
Learning tip: trendlines here are computed from pivot points and time. Watch how changing tl_period (bigger = smoother, fewer pivots) alters the trendlines and break signals.
________________________________________
7) Signal generation & filters — step-by-step
1. Primary triggers:
o Bullish trigger: order block bullish OR resistance trendline break.
o Bearish trigger: bearish order block OR support trendline break.
2. Filters applied (both must pass unless disabled):
o Volume filter: volume must be > avg_volume × volume_threshold.
o ATR filter: bar range (high-low) must exceed ATR × atr_multiplier.
o Not in an existing trade: new trades only start if trade_active is false.
3. Trend confirmation:
o The primary trigger is only confirmed if trend is bullish/neutral for buys or bearish/neutral for sells (EMA alignment).
4. Result:
o When confirmed, a long or short trade is activated with TP/SL calculated from ATR multiples.
________________________________________
8) Trade management — what the tool does after a signal
• Entry management: the script marks a trade as trade_active and sets long_trade or short_trade flags.
• TP & SL rules:
o Long: TP = high + 2×ATR ; SL = low − 1×ATR
o Short: TP = low − 2×ATR ; SL = high + 1×ATR
• Monitoring & exit:
o A trade closes when price reaches TP or SL.
o When TP/SL hit, the indicator updates win_count and total_pnl using a very simple calculation (difference between TP/SL and previous close).
o Visual lines/labels are drawn for TP and updated as the trade runs.
Important learner notes:
• The script does not store a true entry price (it uses close in its P&L math), so PnL is an approximation — treat this as a learning proxy, not a position accounting system.
• There’s no sizing, slippage, or fee accounted — students must manually factor these when translating to real trades.
• This indicator is not a backtesting strategy; strategy.* functions would be needed for rigorous backtest results.
________________________________________
9) Signal strength & helper utilities
• Signal strength is a composite score (0–100) made up of four signals worth 25 points each:
1. RSI extreme (overbought/oversold) → 25
2. Volume spike → 25
3. MACD histogram magnitude increasing → 25
4. Trend existence (bull or bear) → 25
• Progress bars (text glyphs) are used to visually show RSI and signal strength on the table.
Learning point: composite scoring is a way to combine orthogonal signals — study how changing weights changes outcomes.
________________________________________
10) Dashboard — how to read each section (walkthrough)
The dashboard is split into sections; here's how to interpret them:
1. Market Overview
o LTP / Change%: immediate price & daily % change.
2. RSI & MACD
o RSI value plus progress bar (overbought 70 / oversold 30).
o MACD histogram sign indicates bullish/bearish momentum.
3. Volume Analysis
o Volume ratio (current / average) and whether there’s a spike.
4. Order Block Status
o Buy OB / Sell OB: the average base price of detected order blocks or “No Signal.”
5. Signal Status
o 🔼 BUY or 🔽 SELL if confirmed, or ⚪ WAIT.
o No-trade vs Active indicator summarizing market readiness.
6. Trend Analysis
o Trend direction (from EMAs), market sentiment score (composite), volatility level and band/position metrics.
7. Performance
o Win Rate = wins / signals (percentage)
o Total PnL = cumulative PnL (approximate)
o Bull / Bear Volume = accumulated volumes attributable to signals
8. Support & Resistance
o 20-bar highest/lowest — use as nearby reference points.
9. Risk & R:R
o Risk Level from ATR/price as a percent.
o R:R Ratio computed from TP/SL if a trade is active.
10. Signal Strength & Active Trade Status
• Numeric strength + progress bar and whether a trade is currently active with TP/SL display.
________________________________________
11) Alerts — what will notify you
The indicator includes pre-built alert triggers for:
• Bullish confirmed signal
• Bearish confirmed signal
• TP hit (long/short)
• SL hit (long/short)
• No-trade zone
• High signal strength (score > 75%)
Training use: enable alerts during a replay session to be notified when the indicator would have signalled.
________________________________________
12) Labs — hands-on exercises for learners (step-by-step)
Lab A — Order Block recognition
1. Pick a 15–30 minute timeframe on a liquid ticker.
2. Use default OB periods (7). Mark each time the dashboard shows a Buy/Sell OB.
3. Manually inspect the chart at the base candle and the following sequence — draw the OB zone by hand and watch later price reactions to it.
4. Repeat with OB periods 5 and 10; note stability vs noise.
Lab B — Trendline break confirmation
1. Increase trendline period (e.g., 20), watch trendlines form from pivots.
2. When a resistance break is flagged, compare with MACD & volume: was momentum aligned?
3. Note false breaks vs confirmed moves — change extension_bars to see projection effects.
Lab C — Filter sensitivity
1. Toggle Use Volume Filter off, and record the number and quality of signals in a 2-day window.
2. Re-enable volume filter and change threshold from 1.2 → 1.6; note how many low-quality signals are filtered out.
Lab D — Trade management simulation
1. For each signalled trade, record the time, close entry approximation, TP, SL, and eventual hit/miss.
2. Compute actual PnL if you had entered at the open of the next bar to compare with the script’s PnL math.
3. Tabulate win rate and average R:R.
Lab E — Performance review & improvement
1. Build a spreadsheet of signals over 30–90 periods with columns: Date, Signal type, Entry price (real), TP, SL, Exit, PnL, Notes.
2. Analyze which filters or indicators contributed most to winners vs losers and adjust weights.
________________________________________
13) Common pitfalls, assumptions & implementation notes (things to watch)
• P&L simplification: total_pnl uses close as a proxy entry price. Real entry/exit prices and slippage are not recorded — so PnL is approximate.
• No position sizing or money management: the script doesn’t compute position size from equity or risk percent.
• Signal confirmation logic: composite "signal_strength" is a simple 4×25 point scheme — explore different weights or additional signals.
• Order block detection nuance: the script defines the base candle and checks the subsequent sequence. Be sure to verify whether the intended candle direction (base being bullish vs bearish) aligns with academic/your trading definition — read the code carefully and test.
• Trendline slope over time: slope is computed using timestamps; small differences may make lines sensitive on very short timeframes — using bar_index differences is usually more stable.
• Not a true backtester: to evaluate performance statistically you must transform the logic into a strategy script that places hypothetical orders and records exact entry/exit prices.
________________________________________
14) Suggested improvements for advanced learners
• Record true entry price & timestamp for accurate PnL.
• Add position sizing: risk % per trade using SL distance and account size.
• Convert to strategy. (Pine Strategy)* to run formal backtests with equity curves, drawdowns, and metrics (Sharpe, Sortino).
• Log trades to an external spreadsheet (via alerts + webhook) for offline analysis.
• Add statistics: average win/loss, expectancy, max drawdown.
• Add additional filters: news time blackout, market session filters, multi-timeframe confirmation.
• Improve OB detection: combine wick/body, volume spike at base bar, and liquidity sweep detection.
________________________________________
15) Glossary — quick definitions
• ATR (Average True Range): measure of typical range; used to size targets and stops.
• EMA (Exponential Moving Average): trend smoothing giving more weight to recent prices.
• RSI (Relative Strength Index): momentum oscillator; >70 overbought, <30 oversold.
• MACD: momentum oscillator using difference of two EMAs.
• Bollinger Bands: volatility bands around SMA.
• Order Block: a base candle area with subsequent confirmation candles; a zone of institutional interest (learning model).
• Pivot High/Low: local turning point defined by candles on both sides.
• Signal Strength: combined score from multiple indicators.
• Win Rate: proportion of signals that hit TP vs total signals.
• R:R (Risk:Reward): ratio of potential reward (TP distance) to risk (entry to SL).
________________________________________
16) Limitations & assumptions (be explicit)
• This is an indicator for learning — not a trading robot or broker connection.
• No slippage, fees, commissions or tie-in to real orders are considered.
• The logic is heuristic (rule-of-thumb), not a guarantee of performance.
• Results are sensitive to timeframe, market liquidity, and parameter choices.
________________________________________
17) Practical classroom / study plan (4 sessions)
• Session 1 — Foundations: Understand EMAs, ATR, RSI, MACD, Bollinger Bands. Run the indicator and watch how these numbers change on a single day.
• Session 2 — Zones & Filters: Study order blocks and trendlines. Test volume & ATR filters and note changes in false signals.
• Session 3 — Simulated trading: Manually track 20 signals, compute real PnL and compare to the dashboard.
• Session 4 — Improvement plan: Propose changes (e.g., better PnL accounting, alternative OB rule) and test their impact.
________________________________________
18) Quick reference checklist for each signal
1. Was an order block or trendline break detected? (primary trigger)
2. Did volume meet threshold? (filter)
3. Did ATR filter (bar size) show a real move? (filter)
4. Was trend aligned (EMA 9/21/50)? (confirmation)
5. Signal confirmed → mark entry approximation, TP, SL.
6. Monitor dashboard (Signal Strength, Volatility, No-trade zone, R:R).
7. After exit, log real entry/exit, compute actual PnL, update spreadsheet.
________________________________________
19) Educational caveat & final note
This tool is built for training and analysis: it helps you see how common technical building blocks combine into trade ideas, but it is not a trading recommendation. Use it to develop judgment, to test hypotheses, and to design robust systems with proper backtesting and risk control before risking capital.
________________________________________
20) Disclaimer (must include)
Training & Educational Only — This material and the indicator are provided for educational purposes only. Nothing here is investment advice or a solicitation to buy or sell financial instruments. Past simulated or historical performance does not predict future results. Always perform full backtesting and risk management, and consider seeking advice from a qualified financial professional before trading with real capital.
________________________________________

Natal & Transit Planetary Aspect Table📐 Natal & Transit Planetary Aspect Table
This open-source TradingView indicator displays a customizable table of astrological aspects between natal (first trade or custom date) planetary positions and current/live transits. Built in Pine Script v6, it leverages the AstroLib library for accurate geocentric or heliocentric longitude calculations, supporting a range of financial assets and historical events. Ideal for astro-finance enthusiasts, it highlights major and minor aspects with orbs, applying/separating status, and color-coded visuals. Supports 10 planetary bodies in geocentric mode (Sun, Moon, Mercury, Venus, Mars, Jupiter, Saturn, Uranus, Neptune, Pluto) or 11 in heliocentric mode (adds Earth).
Why Use This Indicator?
Astrology offers a unique lens for market analysis by examining planetary alignments relative to an asset's "birth" date (e.g., first trade), potentially revealing cycles, trends, and timing insights that complement technical and fundamental strategies. This tool empowers traders to integrate astro-finance principles, visualizing cosmic influences that may correlate with price movements, reversals, or volatility—backed by historical presets and customizable options for personalized research.
Key Features:
- 23 preset natal dates for assets like BTC, ETH, NYSE, and more (e.g., BTC genesis block on 2009-01-03), with credits to Susan Abbott Gidel for most of the first trade dates from her book " Trading In Sync With Commodities: Introducing Astrology To Your Technical Toolbox ."
- Manual natal and transit timestamp inputs for flexibility.
- Supports geocentric (default) or heliocentric views (displayed as 𝒢 or ℋ in the table), with adjustable observer location (latitude, longitude, timezone).
- Configurable aspects: Conjunction (☌), Opposition (☍), Trine (△), Square (□), Sextile (⚹), and minors like Semi-Sextile (⚺), Quincunx (⚻), etc., with user-defined orbs and colors.
- Applying (a) or separating (s) status is determined by comparing the orb on the current bar to the previous one—if decreasing, applying; if increasing, separating. This simplified approach may differ from traditional astrological methods that consider planetary speeds, directions (direct/retrograde), and which body is faster/slower.
- Table displays planet symbols or names, degrees/signs with tooltips showing exact longitude (e.g., hovering over a planet symbol reveals its precise degree), and aspect symbols/tags (e.g., ⚹a for applying sextile).
- Tooltip on the dates cell to view the exact transit and natal dates for easy tracking.
- Live mode updates with chart timeframe; test mode allows the user to move the transit date historically or to the future via a custom timestamp.
- Customizable table position, text size, colors, and visibility.
How to Use:
1. Add the indicator to your TradingView chart.
2. Select a preset or manual natal date in settings.
3. Choose live transits or test mode with a custom timestamp.
4. Enable/disable aspects and adjust orbs/colors as needed.
5. Hover over cells for detailed tooltips (e.g., exact orb and applying/separating status).
Powered by @BarefootJoey AstroLib for ephemeris data. For best accuracy, verify positions against external sources.
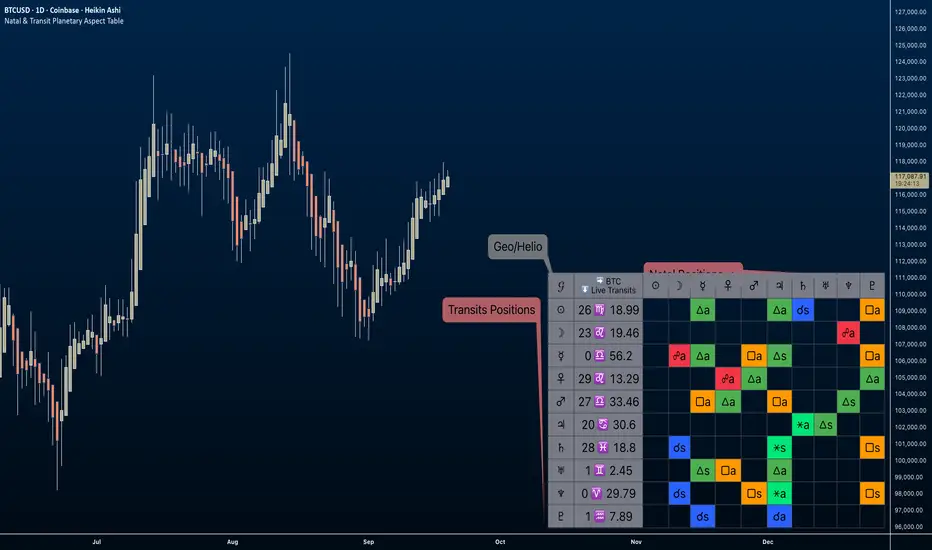
1D Exit Alerts"A Daily Exit LONG" + "B Daily Exit SHORT":
I'm not using this one anymore since they often make me worry more than necessary, and I focus more on aiming to reach specific price targets, or using the 5m Exit alerts instead.
Also swing trades require less time-sensitive operations than day trades, so for me personally they felt a bit redundant.
But maybe it helps some of you:
There are 4 conditions that trigger it. As with 5m Exit Alerts, the triggering reasons show up in the exit alert message (unfortunately only as a number, since alert messages can't have "dynamic text" in TradingView).
Here are the conditions sorted from best to worst:
Gap Up / Down. Better check SPY and the stock whether a Gap Reversal is likely to happen (aka get out) or whether the stock will keep going higher / lower.
Earnings: End of day or Tomorrow morning. Alert is triggered at beginning of morning before earnings, and then again 15m before market close.
Mental stop loss: Broke daily EMA 8 or SMA - in the wrong direction....
Wrong direction: Broke below / above yesterday's Low / High. It's not immediately triggered, but only after re-touching VWAP again, to prevent too impulsive exits.
As with 5m Exit alerts: Always consider how the market and stock looks like, then decide whether to exit or not! These are meant to make you look at the chart, not to FOMO-exit.
"X Candle Close":
Same as in 1D Enter alert: Is triggered 15m before market close (I put it in here as well because I kept forgetting whether I put this one into Enter or Exit alerts...)
More infos: www.reddit.com
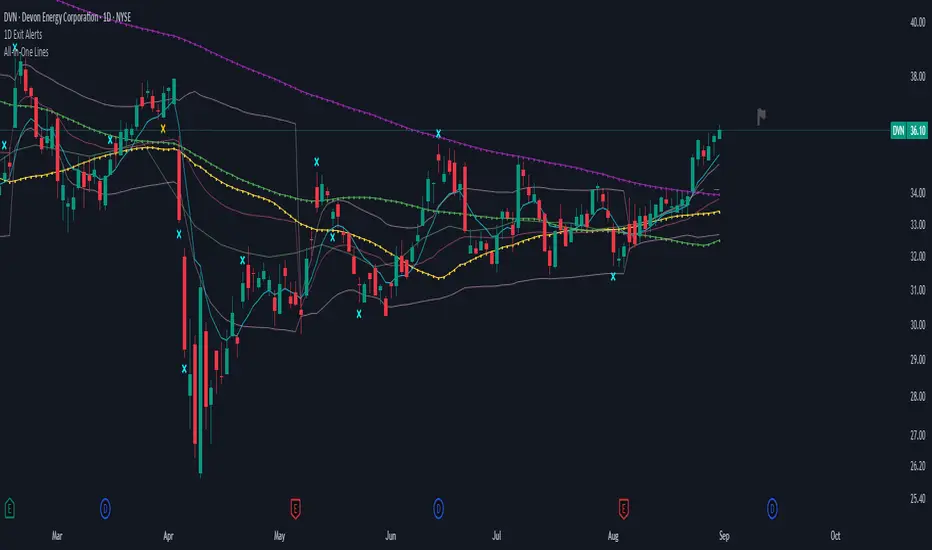
5m Exit AlertsThese can help a lot with Daytrading if you don't have a price target in mind when there's no clear resistance / support nearby, and you don't trust the market enough to hold it as a swing trade.
Keep in mind that its main purpose is to give you a "warning" that it might be good to look at your screen, instead of guaranteeing you "now is the best time to exit". You won't reach high winning stats by blindly following this alert.
"A Exit LONG":
(I'm using letters instead of numbers for all Exit alerts to make sure I don't accidentally confuse Enter and Exit alerts).
There are 4 conditions that might trigger it. The reasons show up in the exit alert message (unfortunately only as a number, since alert messages can't have "dynamic text" in TradingView), and can also be displayed as symbols in the chart (see image above - make sure to enable "Show Signals" in the indicator settings first though).
Here are the conditions sorted from best to worst:
Technical reversal: Bearish Hammer candle with Volume > 2 * avg volume (of last 30 candles), when 5m candle closed. Reversal very likely. This is usually the best time to take your gains for the rest of the day.
EMA 3/8 cross: standard 5m EMA 3/8 cross, indicating a trend reversal, or at least a pullback. Can also be helpful to detect double tops / double bottoms.
Trailing Stop Loss: Crossed below 30m EMA 8, 5m candle closed. This is a "fallback" alert in case EMA 3 was already below EMA 8 before you set up the alert. It's not unlikely that the stock might go further down to VWAP, so depending on the chart and market this might be a good opportunity to save the gains you have left.
"Final" Stop Loss: Crossed below VWAP. Usually not a good sign. If you entered around VWAP your losses shouldn't be big yet, but if you plan on holding the stock the Daily chart and market outlook should better be quite convincing, and you wouldn't have needed to use this alert in the first place.
Keep in mind these work of course best if you picked a "good" stock: clear movement, tidy price action, high volume. Otherwise alerts are more likely to be triggered redundantly.
Always consider how the market and stock looks like, then decide whether to exit or not! Usually it makes sense to wait a bit to see f. e. whether the stock bounces off the 30m EMA 8, and it's just a pullback.
"B Enter SHORT":
Similar, but for shorts...
"C 1m Scalp LONG" + "D 1m Scalp SHORT":
Simple Scalping alert for EMA 3/8 cross on a 1m chart - but without needing to use a 1m chart to set it up!
Unfortunately it's not as accurate as manually setting this alert up on a 1m chart. It might be an advantage though that it sometimes is triggered 1-2 min later, since this means there are less redundant triggerings.
It can be useful esp. on high momentum trades, but I honestly haven't used it in a looong while.
"X Candle Close":
same as in 5m Entry indicator: triggered when 5m candle is confirmed
"Z Trend Change: UP" + "Z Trend Change: DOWN":
This one is meant to be used only on SPY: It alerts you when SPY is changing its trending direction, which might mean entering or closing existing trades.
I have therefore set it up to never end (by setting it to "Once Per Bar Close" in the alert settings).
It's based on DMI positive or negative being > 25. I had it based on VWAP at the beginning, but there were days where it was triggered every 5 minutes...
More infos: www.reddit.com

ATR Extension from Moving Average, with Robust Sigma Bands
# ATR Extension from Moving Average, with Robust Sigma Bands
**What it does**
This indicator measures how far price is from a selected moving average, expressed in **ATR multiples**, then overlays **robust sigma bands** around the long run central tendency of that extension. Positive values mean price is extended above the MA, negative values mean price is extended below the MA. The signal adapts to volatility through ATR, which makes comparisons consistent across symbols and regimes.
**Why it can help**
* Normalizes distance to an MA by ATR, which controls for changing volatility
* Uses the **bar’s extreme** against the MA, not just the close, so it captures true stretch
* Computes a **median** and **standard deviation** of the extension over a multi-year window, which yields simple, intuitive bands for trend and mean-reversion decisions
---
## Inputs
* **MA length**: default 50, options 200, 64, 50, 20, 9, 4, 3
* **MA timeframe**: Daily or Weekly. The MA is computed on the chosen higher timeframe through `request.security`.
* **MA type**: EMA or SMA
* **Years lookback**: 1 to 10 years, default 5. This sets the sample for the median and sigma calculation, `years * 365` bars.
* **Line width**: visual width of the plotted extension series
* **Table**: optional on-chart table that displays the current long run **median** and **sigma** of the extension, with selectable text size
**Fixed parameters in this release**
* **ATR length**: 20 on the daily timeframe
* **ATR type**: classic ATR. ADR percent is not enabled in this version.
---
## Plots and colors
* **Main plot**: “Extension from 50d EMA” by default. Value is in **ATR multiples**.
* **Reference lines**:
* `median` line, black dashed
* +2σ orange, +3σ red
* −2σ blue, −3σ green
---
## How it is calculated
1. **Moving average** on the selected higher timeframe: EMA or SMA of `close`.
2. **Extreme-based distance** from MA, as a percent of price:
* If `close > MA`, use `(high − MA) / close * 100`
* Else, use `(low − MA) / close * 100`
3. **ATR percent** on the daily timeframe: `ATR(20) / close * 100`
4. **ATR multiples**: extension percent divided by ATR percent
5. **Robust center and spread** over the chosen lookback window:
* Center: **median** of the ATR-multiple series
* Spread: **standard deviation** of that series
* Bands: center ± 1σ, 2σ, 3σ, with 2σ and 3σ drawn
This design yields an intuitive unit scale. A value of **+2.0** means price is about 2 ATR above the selected MA by the most stretched side of the current bar. A value of **−3.0** means roughly 3 ATR below.
---
## Practical use
* **Trend continuation**
* Sustained readings near or above **+1σ** together with a rising MA often signal healthy momentum.
* **Mean reversion**
* Spikes into **±2σ** or **±3σ** can identify stretched conditions for fade setups in range or late-trend environments.
* **Regime awareness**
* The **median** moves slowly. When median drifts positive for many months, the market spends more time extended above the MA, which often marks bullish regimes. The opposite applies in bearish regimes.
**Notes**
* The MA can be set to Weekly while ATR remains Daily. This is deliberate, it keeps the normalization stable for most symbols.
* On very short intraday charts, the extension remains meaningful since it references the session’s extreme against a higher-timeframe MA and a daily ATR.
* Symbols with short histories may not fill the lookback window. Bands will adapt as data accrues.
---
## Table overlay
Enable **Table → Show** to see:
* “ATR from \”
* Current **median** and **sigma** of the extension series for your lookback
---
## Recommended settings
* **Swing equities**: 50 EMA on Daily, 5 to 7 years
* **Index trend work**: 200 EMA on Daily, 10 years
* **Position trading**: 20 or 50 EMA on Weekly MA, 5 to 10 years
---
## Interpretation examples
* Reading **+2.7** with price above a rising 50 EMA, near prior highs
* Strong trend extension, consider pyramiding in trend systems or waiting for a pullback if you are a mean-reverter.
* Reading **−2.2** into multi-month support with flattening MA
* Stretch to the downside that often mean-reverts, size entries based on your system rules.
---
## Credits
The concept of measuring stretch from a moving average in ATR units has a rich community history. This implementation and its presentation draw on ideas popularized by **Jeff Sun**, **SugarTrader**, and **Steve D Jacobs**. Thanks to each for their contributions to ATR-based extension thinking.
---
## License
This script and description are distributed under **MPL-2.0**, consistent with the header in the source code.
---
## Changelog
* **v1.0**: Initial public release. Daily ATR normalization, EMA or SMA on D or W timeframe, robust median and sigma bands, optional table.
---
## Disclaimer
This tool is for educational use only. It is not financial advice. Always test on your own data and strategies, then manage risk accordingly.

Simple MADSimple MAD is a lightweight and customizable indicator that calculates the Median Absolute Deviation (MAD) over a configurable period to measure market volatility. It dynamically displays Stop-Loss (SL) and Take-Profit (TP) levels based on MAD multipliers, both in absolute price and percentage terms.
The indicator includes a clean, watermark-style table with full layout controls — allowing you to adjust position, text size, alignment, and colors. It supports both manual entry price and automatic use of the latest close, making it ideal for traders who want to manage risk with precision and clarity.
Perfect for swing traders, volatility-based strategies, and anyone looking to integrate MAD into their decision-making.

XAUUSD Lot Size Calculator + RSI (Yoothobbiz)This indicator is designed for Gold traders on the 5-minute timeframe (M5) who want a clear and editable lot size, stop loss, and take profit calculator directly on their chart.
✨ Features:
📌 Dynamic Lot Size Calculation – based on account capital, chosen risk %, and stop loss distance.
⚖️ Risk/Reward Management – automatically displays TP level using a customizable risk/reward ratio (e.g., 1:2, 1:3, etc.).
🛑 Stop Loss in Points & Price – calculates SL from recent M5 highs/lows, including spread.
🎯 Take Profit in Price & Points – automatically adjusted to your risk/reward ratio.
💵 Risk in USD – instantly shows how much capital is at risk per trade.
🕒 Custom Time Zone Support – displays the real trading time (default UTC-4 for New York), fully editable for any user.
⏱ Timeframe Label – clearly shows the working timeframe (M5 by default).
🎨 Fully Editable Display Panel:
Position (6 corners available).
Font family, size, style (bold/italic).
Text and background colors.
Adjustable spacing between lines.
🔑 How to Use:
Set your capital and risk % in the settings.
Adjust spread (in points) if needed.
Choose your risk/reward ratio.
The panel will display:
Recommended lot size for XAUUSD
Stop loss (price + points)
Take profit (price + ratio)
Risk in $
Timeframe & real-time clock
📍 Notes:
Optimized for XAUUSD (Gold) and the 5M timeframe.
Works on any asset/timeframe, but SL logic is based on M5 candle highs/lows.
Ideal for traders who want a fast and disciplined risk management tool right on their chart.
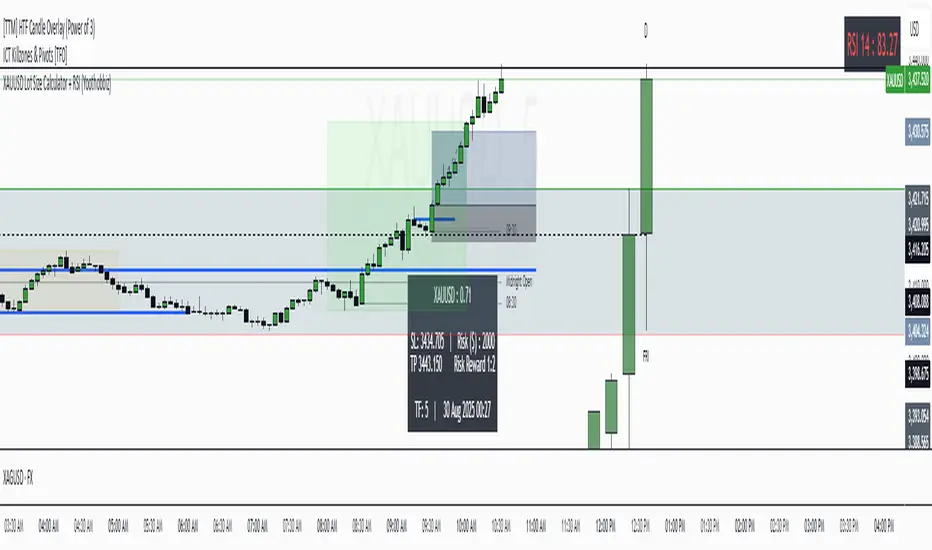
Break Point Record Table — GSK-VIZAG-AP-INDIA "Break Point Record Table — GSK-VIZAG-AP-INDIA" indicator captures key break points during each trading session and presents a clear, color-coded table overlay on the chart for quick visual reference. Specifically, it logs sessions' open price and monitors subsequent price action for notable breaks in the session high or low prices. Each break event is recorded with the time, price, and percentage change from the previous break, helping traders identify significant price movements within the session at a glance.
Key Features:
Records the session start time and opening price for context.
Tracks every intraday break above the previous session high or below the previous session low.
Calculates and displays the percentage change at each break event.
Highlights breaks with descriptive text including break time and values to aid trade decision-making.
Displays a table with columns for Time, Open, High, Low, and a Description of the event.
Uses color-coded cells to differentiate between session start, highs, lows, and break descriptions for better readability.
Maintains performance and readability by limiting the table to the latest 30 break events.
Usage & Benefits:
This indicator is ideal for intraday traders who want reliable visual cues to monitor momentum shifts and breakout/breakdown points during the trading day. By capturing these break points as discrete events and organizing the data into an easily accessible, visually intuitive table, it improves situational awareness and supports timely trading decisions.
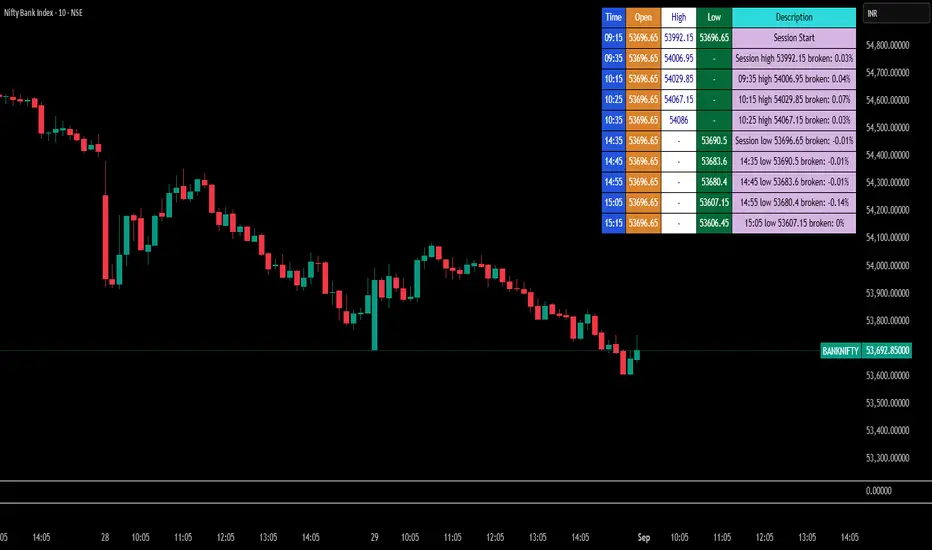
Elliott Wave [BigBeluga]🔵 OVERVIEW
Elliott Wave automatically finds and draws an Elliott-style 5-wave impulse and a dashed projection for a potential -(a)→(b)→(c) correction. It detects six sequential reversal points from rolling highs/lows — 1, 2, 3, 4, 5, (a) — validates their relative placement, and then renders the wave with labels and horizontal reference lines. If price invalidates the structure by closing back through the Wave-5 level inside a 100-bar window, the pattern is cleared (optionally kept as “broken”) while key dotted levels remain for context.
🔵 CONCEPTS
Reversal harvesting from extremes : The script scans highest/lowest values over a user-set Length and stores swing points with their bar indices.
Six-point validation : A pattern requires six pivots (1…5 and (a)). Their vertical/temporal order must satisfy Elliott-style constraints before drawing.
Impulse + projection : After confirming 1→5, the tool plots a curved polyline through the pivots and a dashed forward path from (a) toward (b) (midpoint of 5 and (a)) and back to (c).
Risk line (invalidator) : The Wave-5 price is tracked; a close back through it within 100 bars marks the structure as broken.
Minimal persistence : When broken, the wave drawing is removed to avoid noise, while dotted horizontals for waves 5 and 4 remain as reference.
🔵 FEATURES
Automatic pivot collection from rolling highs/lows (user-controlled Length ).
Wave labeling : Points 1–5 are printed; the last collected swing is marked b
. Projected i
& i
are shown with a dashed polyline.
Breaker line & cleanup : If price closes above Wave-5 (opposite for bears) within 100 bars, the pattern is removed; only dotted levels of 5 and 4 stay.
Styling controls :
Length (pivot sensitivity)
Text Size for labels (tiny/small/normal/large)
Wave color input
Show Broken toggle to keep invalidated patterns visible
Lightweight memory : Keeps a compact buffer of recent pivots/draws to stay responsive.
🔵 HOW TO USE
Set sensitivity : Increase Length on noisy charts for cleaner pivots; decrease to catch earlier/shorter structures.
Wait for confirmation : Once 1→5 is printed and (a) appears, use the Wave-5 line as your invalidation. A close back through it within ~100 bars removes the active wave (unless Show Broken is on).
Plan with the dashed path : The (a)→(b)→(c) projection offers a scenario for potential corrective movement and risk placement.
Work MTF : Identify cleaner waves on higher TFs; refine execution on lower TFs near the breaker or during the move toward (b).
Seek confluence : Align with structure (S/R), volume/Delta, or your trend filter to avoid counter-context trades.
🔵 CONCLUSION
Elliott Wave systematizes discretionary wave analysis: it detects and labels the 5-wave impulse, projects a plausible (a)-(b)-(c) path, and self-cleans on invalidation. With clear labels, dotted reference levels, and a practical breaker rule, it gives traders an objective framework for scenario planning, invalidation, and timing.

Previous Day OHLC Dashboard (Last N Days)Indicator: Previous Day OHLC Dashboard (Multi-Day)
This indicator displays a dashboard-style table on your chart that shows the Open, High, Low, and Close (OHLC) of the previous trading days. It’s designed to help traders quickly reference key daily levels that often act as important support and resistance zones.
🔑 Features:
Dashboard Table: Shows OHLC data for the last N trading days (default = 3, up to 10).
Customizable Appearance:
Change the position of the dashboard (Top-Right, Top-Left, Bottom-Right, Bottom-Left).
Adjust text size (Tiny → Huge).
Customize colors for header, labels, and each OHLC column.
Yesterday’s OHLC Lines (optional): Plots horizontal lines on the chart for the previous day’s Open, High, Low, and Close.
Intraday & Multi-Timeframe Compatible: Works on all timeframes below Daily — values update automatically from the daily chart.
📊 Use Cases:
Quickly identify yesterday’s key levels for intraday trading.
Track how current price reacts to previous day’s support/resistance.
Keep a multi-day reference for trend bias and range context.
⚙️ How it Works:
The indicator pulls daily OHLC values using request.security() with lookahead_on to ensure prior day’s values are extended across the next session.
These values are displayed in a compact table for quick reference.
Optionally, the most recent daily levels (D-1) are plotted as chart lines.
✅ Perfect for day traders, scalpers, and swing traders who rely on yesterday’s price action to plan today’s trades.
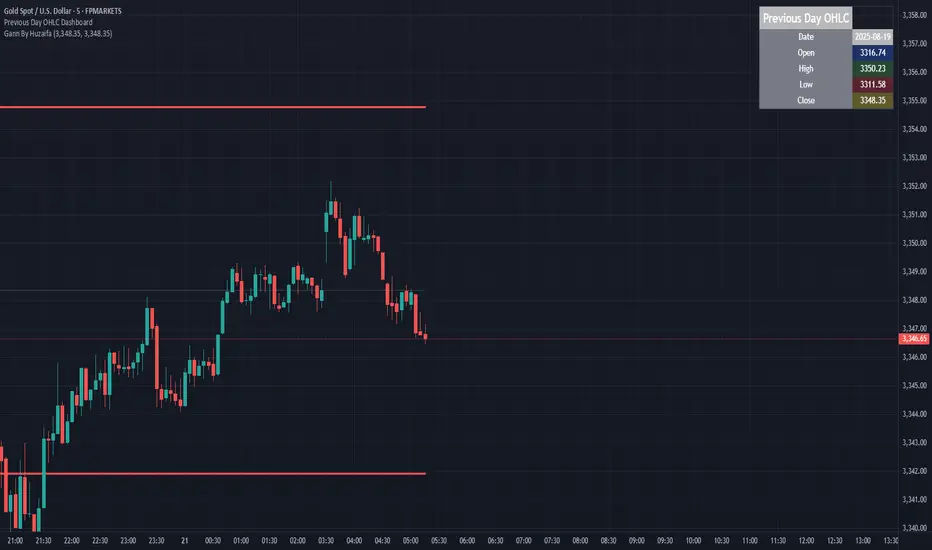
Follow-up Buy / Sell Volume Pressure at Supply / Demand Zones█ Overview:
BE-Volume Footprint & Pressure Candles, is an indicator which is preliminarily designed to analyze the supply and demand patterns based on Rally Base Rally (RBR), Drop Base Drop (DBD), Drop Base Rally (DBR) & Rally Base Drop (RBD) concepts in conjunction to volume pressure. Understanding these concepts are crucial. Let's break down why the "Base" is you Best friend in this context.
Commonness in RBR, DBD, DBR, RBD patterns ?
There is an impulse price movement at first, be it rally (price moving up) or the Drop (price moving down), followed by a period of consolidation which is referred as "BASE" and later with another impulse move of price (Rally or Drop).
Why is the Base Important
1. Market Balance: Base represents a balance between buyers and sellers. This is where decisions are made.
2. Confirmation: It confirms the strength of previous impulse move which has happened.
Base & the Liquidity Play:
Supply & Demand Zone predict the presence of all large orders within the limits of the Base Zone. Price is expected to return to the zone to fill the unfilled orders placed by large players.
For the price to move in the intended direction Liquidity plays the major role. hence indicator aims to help traders in identifying those zones where liquidity exists and the volume pressure helps in confirming that liquidity is making its play.
Bottom pane in the below snapshots is a visual representation of Buyers volume pressure (Green Line & the Green filled area) making the price move upwards vs Sellers volume pressure (Red Line & the Red filled area) making the price move downwards.
Top pane in the below snapshots is a visual representation on the pattern identification (Blue marked zone & the Blue line referred as Liquidity level)
Bullish Pressure On Buy Liquidity:
Bearish Pressure On Sell Liquidity:
█ How It Works:
1. Indicator computes technical & mathematical operations such as ATR, delta of Highs & Lows of the candle and Candle ranges to identify the patterns and marks the liquidity lines accordingly.
2. Indicator then waits for price to return to the liquidity levels and checks if Directional volume pressure to flow-in while the prices hover near the Liquidity zones.
3. Once the Volume pressure is evident, loop in to the ride.
█ When It wont Work:
When there no sufficient Liquidity or sustained Opposite volume pressure, trades are expected to fail.
█ Limitations:
Works only on the scripts which has volume info. Relays on LTF candles to determine intra-bar volumes. Hence, Use on TF greater than 1 min and lesser than 15 min.
█ Indicator Features:
1. StrictEntries: employs' tighter rules (rather most significant setups) on the directional volume pressure applied for the price to move. If unchecked, liberal rules applied on the directional volume pressure leading to more setups being identified.
2. Setup Confirmation period: Indicates Waiting period to analyze the directional volume pressure. Early (lesser wait period) is Risky and Late (longer wait period) is too late for the
ride. Find the quant based on the accuracy of the setup provided in the bottom right table.
3. Algo Enabled with Place Holders:
Indicator is equipped with algo alerts, supported with necessary placeholders to trade any instrument like stock, options etc.
Accepted PlaceHolders (Case Sensitive!!)
1. {{ticker}}-->InstrumentName
2. {{datetime}}-->Date & Time Of Order Placement
3. {{close}}-->LTP Price of Script
4. {{TD}}-->Current Level:
Note: Negative Numbers for Short Setup
5. {{EN}} {{SL}} {{TGT}} {{T1}} {{T2}} --> Trade Levels
6. {{Qty}} {{Qty*x}} --> Qty -> Trade Qty mapped in Settings. Replace x with actual number of your choice for the multiplier
7. {{BS}}-->Based on the Direction of Trade Output shall be with B or S (B == Long Trade & S == Short Trade)
8. {{BUYSELL}}-->Based on the Direction of Trade Output shall be with BUY or SELL (BUY == Long Trade & SELL == Short Trade)
9. {{IBUYSELL}}-->Based on the Direction of Trade Output shall be with BUY or SELL (BUY == SHORT Trade & SELL == LONG Trade)
Dynamic Alerts:
10. { {100R0} }-->Dynamic Place Holder 100 Refers to Strike Difference and Zero refers to ATM
11. { {100R-1} }-->Dynamic Place Holder 100 Refers to Strike Difference and -1 refers to
ATM - 100 strike
12. { {50R2} }-->Dynamic Place Holder 50 Refers to Strike Difference and 2 refers to
ATM + (2 * 50 = 100) strike
13. { {"ddMMyy", 0} }-->Dynamically Picks today date in the specified format.
14. { {"ddMMyy", n} }-->replace n with actual number of your choice to Pick date post today date in the specified format.
15. { {"ddMMyy", "MON"} }-->dynamically pick Monday date (coming Monday, if today is not Monday)
Note. for the 2nd Param-->you can choose to specify either Number OR any letter from =>
16. {{CEPE}} {{ICEPE}} {{CP}} {{ICP}} -> Dynamic Option Side CE or C refers to Calls and PE or P refers to Puts. If "I" is used in PlaceHolder text, On long entries PUTs shall be used
Indicator is equipped with customizable Trade & Risk management settings like multiple Take profit levels, Trailing SL.
