Smart Money Trades Pro [BOSWaves]Smart Money Trades Pro – Advanced Market Structure & Liquidity Visualizer
Overview
Smart Money Trades Pro is a comprehensive trading tool designed for traders seeking an in-depth understanding of market structure, liquidity dynamics, and institutional flow. The indicator systematically identifies key market turning points, including break of structure (BOS) and change of character (CHoCH) events, and overlays these with adaptive visualizations to highlight high-probability trade setups. By integrating ATR-based risk zones, progressive take-profit levels, and real-time trade analytics, Smart Money Trades Pro transforms complex price action into an interpretable framework suitable for multiple trading styles, including scalping, intraday, and swing trading.
Unlike traditional static indicators, Smart Money Trades Pro adapts continuously to market conditions. It evaluates swing highs and lows over a configurable lookback period, then determines structural breaks using customizable confirmation methods (candle body or wick). The resulting signals are augmented with dynamic entry, stop-loss, and target levels, allowing traders to analyze potential trade opportunities with both precision and context. The indicator’s design ensures that each visual element—trend-colored candles, signal markers, and risk/reward boxes—reflects real-time market conditions, offering an actionable interpretation of institutional activity.
How It Works
The indicator’s foundation is built upon market structure analysis. By calculating pivot highs and lows over a specified period, Smart Money Trades Pro identifies potential points of liquidity accumulation and exhaustion. When price breaks a pivot high or low, the indicator evaluates whether this constitutes a BOS or a CHoCH, signaling trend continuation or reversal. These events are marked on the chart with distinct visual cues, allowing traders to quickly discern shifts in market sentiment without manually analyzing historical price action.
Once a structural break is confirmed, the indicator automatically determines entry levels, stop-loss placements, and progressive take-profit zones (TP1, TP2, TP3). These calculations are based on ATR-derived volatility, ensuring that targets scale with current market conditions. Risk and reward zones are plotted as shaded boxes, providing a clear visual representation of potential profit relative to risk for each trade setup. This system allows traders to maintain discipline and consistency, with dynamic trade management baked directly into the visualization.
Trend direction is further reinforced by color-coded candles, which reflect the prevailing market bias. Bullish trends are represented by one color, bearish trends by another, and neutral conditions are displayed in muted tones. This continuous visual feedback simplifies the process of trend assessment and helps confirm the validity of trade setups alongside BOS and CHoCH markers.
Signals and Breakouts
Smart Money Trades Pro includes structured visual signals to indicate actionable price movements:
Bullish Break Signals – Triangular markers below the candle appear when a swing high is broken, suggesting potential long opportunities.
Bearish Break Signals – Triangular markers above the candle appear when a swing low is broken, indicating potential short setups.
Change of Character (CHoCH) – Special markers highlight trend reversals, showing where momentum shifts from bullish to bearish or vice versa.
These markers are strategically spaced to prevent overlap and remain clear during high-volatility periods. Traders can use them in combination with trend-colored candles, risk/reward zones, and ATR-based targets to assess the strength and reliability of each setup. The integrated table provides live trade information, including entry price, stop-loss level, take-profit levels, risk/reward ratio, and trade direction, ensuring that trade decisions are informed and data-driven.
Interpretation
Trend Analysis : The indicator’s trend coloring, combined with BOS and CHoCH detection, provides an immediate view of market direction. Rising structures indicate bullish momentum, while falling structures signal bearish momentum. CHoCH markers highlight potential trend reversals or significant liquidity sweeps.
Volatility and Risk Assessment : ATR-based calculations determine stop-loss distances and target levels, giving a quantitative measure of risk relative to market volatility. Wide ATR readings indicate periods of high price fluctuation, whereas narrow readings suggest consolidation and reduced risk exposure.
Market Structure Insights : By monitoring swing highs and lows alongside break confirmations, traders can identify where institutional players are likely active. Areas with multiple structural breaks or overlapping targets can indicate liquidity hotspots, potential reversal zones, or areas of market congestion.
Trade Management : The built-in trade zones allow traders to visualize entry, risk, and reward simultaneously. Progressive targets (TP1, TP2, TP3) reflect incremental profit-taking strategies, while dynamic stop-loss levels help preserve capital during adverse moves.
Strategy Integration
Smart Money Trades Pro supports a range of trading approaches:
Trend Following : Enter trades in the direction of confirmed BOS while using CHoCH markers and trend-colored candles to validate momentum.
Pullback Entries : Use failed breakout retests or minor reversals toward broken structure levels for lower-risk entries.
Mean Reversion : In consolidated zones with narrow ATR and repeated BOS/CHoCH activity, anticipate reversals or short-term corrective moves.
Multi-Timeframe Confirmation : Overlay signals on higher or lower timeframes to filter noise and improve trade accuracy.
Stop-loss levels should be placed just beyond the opposing structural point, while take-profit targets can be scaled using the ATR-based zones. Progressive targets allow for partial exits or scaling out of trades while maintaining exposure to larger moves.
Advanced Techniques
Traders seeking greater precision can combine Smart Money Trades Pro with volume, momentum, or volatility indicators to validate signals. Observing sequences of BOS and CHoCH markers across multiple timeframes provides insight into liquidity accumulation and depletion trends. Tracking the expansion or contraction of ATR-based zones helps anticipate shifts in volatility, enabling better timing for entries and exits.
Customizing the structure period and confirmation type allows the indicator to adapt to different asset classes and timeframes. Shorter periods increase sensitivity to smaller swings, while longer periods filter noise and emphasize higher-probability structural breaks. By integrating these features, the indicator offers a robust statistical framework for disciplined, data-driven trading decisions.
Inputs and Customization
Structure Detection Period : Defines the lookback window for pivot high and low calculation.
Break Confirmation : Choose whether to confirm breaks using candle body or wick.
Display CHoCH : Toggle visibility of change-of-character markers.
Color Trend Bars : Enable color-coding of candles based on market structure direction.
Show Info Table : Display trade dashboard showing entry, stop-loss, take-profits, risk/reward, and bias.
Table Position : Choose from top-left, top-right, bottom-left, or bottom-right placement.
Color Customization : Configure bullish, bearish, neutral, risk, reward, and text colors for enhanced visual clarity.
Why Use Smart Money Trades Pro
Smart Money Trades Pro transforms complex market behavior into an actionable visual framework. By combining market structure analysis, liquidity tracking, ATR-based risk/reward mapping, and a dynamic trade dashboard, it provides a multidimensional view of the market. Traders can focus on execution, interpret trends, and evaluate overextensions or reversals without relying on guesswork. The indicator is suitable for scalping, intraday, and swing strategies, offering a comprehensive system for understanding and trading alongside institutional participants.
Search in scripts for "text"

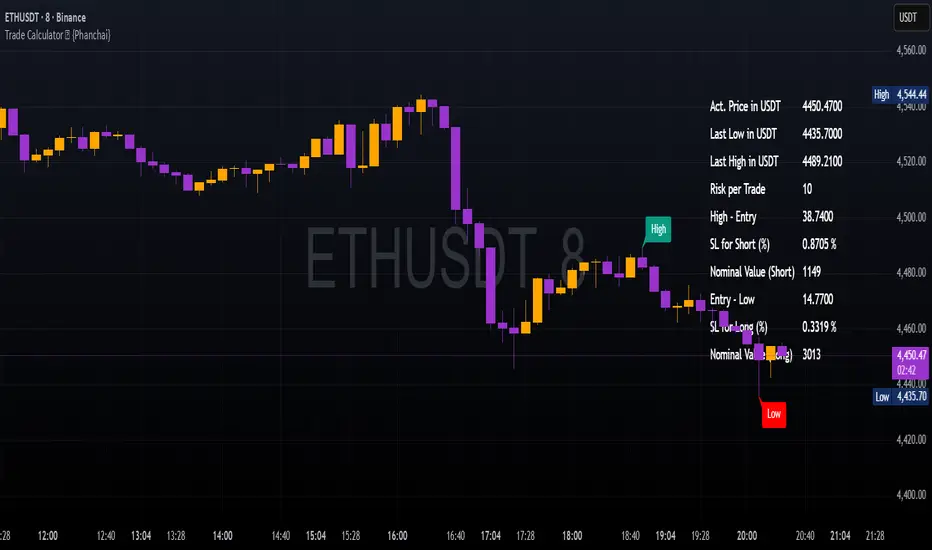
Trade Calculator {Phanchai}Trade Calculator 🧮 {Phanchai} — Documentation
A lightweight sizing helper for TradingView that turns your risk per trade into an estimated maximum nominal position size — using the most recent chart low as your stop reference. Built for speed and clarity right on the chart.
Key Features
Clean on-chart info table with configurable font size and position.
Row toggles: show/hide each line (Price, Last Low, Risk per Trade, Entry − Low, SL to Low %, Max. Nominal Value in USDT).
Configurable low reference: Last N bars or Running since load .
Low label placed exactly at the wick of the lowest bar (no horizontal line).
Custom padding: add extra rows above/below and blank columns left/right (with custom whitespace/text fillers) to fine-tune layout.
Integer display for Risk per Trade (USDT) and Max. Nominal Value (USDT); decimals configurable elsewhere.
Open source script — easy to read and extend.
How to Use
Add the indicator: open TradingView → Indicators → paste the source code → Add to chart.
Pick your low reference in settings:
Last N bars — uses the lowest low within your chosen lookback.
Running since load — tracks the lowest low since the script loaded.
Set your capital and risk:
Total Capital — your account size in USDT.
Max. invest Capital per Trade (%) — your risk per trade as a percent of Total Capital.
Tidy the table:
Use Table Position and Table Size to place it.
Add Extra rows/columns and set left/right fillers (spaces allowed) for padding.
Toggle individual rows (on/off) to show only what you need.
Read the numbers:
Act. Price in USDT — current close.
Last Low in USDT — stop reference price.
Risk per Trade — whole-USDT value of your risk budget for this trade.
Entry − Low — absolute risk per unit.
SL to Low (%) — percentage distance from price to low.
Max. Nominal Value in USDT — estimated max nominal position size given your risk budget and stop at the low.
Scope
This calculator is designed for long trades only (stop below price at the chart low).
Notes & Assumptions
Does not factor fees, funding, slippage, tick size, or broker/venue position limits.
“Running since load” updates as new lows appear; “Last N bars” uses only the selected lookback window.
If price equals the low (zero distance), sizing will be undefined (division by zero guarded as “—”).
Risk Warning
Trading involves substantial risk. Always double-check every value the calculator shows, confirm your stop distance, and verify position sizing with your broker/platform before entering any order. Never risk money you cannot afford to lose.
Open Source & Feedback
The source code is open. If you spot a bug or have an idea to improve the tool, feel free to share suggestions — I’m happy to iterate and make it better.
JL - Market HeatmapThis indicator plots a static table on your chart that displays any tickers you want and their % change on the day so far.
It updates in real time, changes color as it updates, and has several custom functions available for you:
1. Plot up to 12 tickers of your choice
2. Choose a layout with 1-4 rows
3. Display % Change or Not
4. Choose your font size (Tiny, Small, Normal, Large)
5. Up/Down Cell Colors (% change dependent)
6. Up/Down Text Colors (high contrast to your color choices)
The purpose of the indicator is to quickly measure a broad basket of market instruments to paint a more context-rich perspective of the chart you are looking at.
I hope this indicator can help you (and me) accomplish this task in a simple, clean, and seamless manner.
Thanks and enjoy - Jack

MACD StrategyOverview
The "MACD Strategy" is a straightforward trading strategy tested for BTCUSDT Futures on the 1-minute timeframe, leveraging the Moving Average Convergence Divergence (MACD) indicator to identify momentum-based buy and sell opportunities. Developed with input from expert trading analyst insights, this strategy combines technical precision with risk management, making it suitable for traders of all levels on platforms like TradingView. It focuses on capturing trend reversals and momentum shifts, with clear visual cues and automated alerts for seamless integration with trading bots (e.g., Bitget webhooks).
#### How It Works
This strategy uses the MACD indicator to generate trading signals based on momentum and trend direction:
- **Buy Signal**: Triggered when the MACD line crosses above the signal line, and the MACD histogram turns positive (above zero). This suggests increasing bullish momentum.
- **Sell Signal**: Triggered when the MACD line crosses below the signal line, and the MACD histogram turns negative (below zero), indicating growing bearish momentum.
Once a signal is detected, the strategy opens a position (long for buy, short for sell) with a position size calculated based on your risk tolerance. It includes a stop-loss to limit losses and a take-profit to lock in gains, both dynamically adjusted using the Average True Range (ATR) for adaptability to market volatility.
#### Key Features
- **MACD-Based Signals**: Relies solely on MACD for entry points, plotted in a separate pane for clear momentum analysis.
- **Risk Management**: Automatically calculates position size based on a percentage of your account balance and sets stop-loss and take-profit levels using ATR multipliers and a risk:reward ratio.
- **Visual Feedback**: Plots entry, stop-loss, and take-profit lines on the chart with labeled markers for easy tracking.
- **Alerts**: Includes Bitget webhook-compatible alerts for automated trading, notifying you of buy and sell signals in real-time.
#### Input Parameters
- **Account Balance**: Default 10000 – Set your initial trading capital to determine position sizing.
- **MACD Fast Length**: Default 12 – The short-term EMA period for MACD sensitivity.
- **MACD Slow Length**: Default 26 – The long-term EMA period for MACD calculation.
- **MACD Signal Length**: Default 9 – The smoothing period for the signal line.
- **Risk Per Trade (%)**: Default 3.0 – The percentage of your account balance risked per trade (e.g., 3% of 10000 = 300).
- **Risk:Reward Ratio**: Default 3.0 – The ratio of potential profit to risk (e.g., 3:1 means risking 1 to gain 3).
- **SL Multiplier**: Default 1.0 – Multiplies ATR to set the stop-loss distance (e.g., 1.0 x ATR).
- **TP Multiplier**: Default 3.0 – Multiplies ATR to set the take-profit distance, adjusted by the risk:reward ratio.
- **Line Length (bars)**: Default 25 – Duration in bars for displaying trade lines on the chart.
- **Label Position**: Default 'left' – Position of text labels (left or right) relative to trade lines.
- **ATR Period**: Default 14 – The number of periods for calculating ATR to measure volatility.
#### How to Use
1. **Add to Chart**: Load the "MACD Strategy" as a strategy and the "MACD Indicator" as a separate indicator on your TradingView chart (recommended for BTCUSDT Futures on the 1-minute timeframe).
2. **Customize Settings**: Adjust the input parameters based on your risk tolerance and market conditions. For BTCUSDT Futures, consider reducing `Risk Per Trade (%)` during high volatility (e.g., 1%) or increasing `SL Multiplier` for wider stops.
3. **Visual Analysis**: Watch the main chart for trade entry lines (green for buy, red for sell), stop-loss (red), and take-profit (green) lines with labels. Use the MACD pane below to confirm momentum shifts.
4. **Set Alerts**: Create alerts in TradingView for "Buy Signal" and "Sell Signal" to automate trades via Bitget webhooks.
5. **Backtest and Optimize**: Test the strategy on historical BTCUSDT Futures 1-minute data to fine-tune parameters. The short timeframe requires quick execution, so monitor closely for slippage or latency.
#### Tips for Success
- **Market Conditions**: This strategy performs best in trending markets on the 1-minute timeframe. Avoid choppy conditions where MACD crossovers may produce false signals.
- **Risk Management**: Start with the default 3% risk per trade and adjust downward (e.g., 1%) during volatile periods like BTCUSDT news events. The 3:1 risk:reward ratio targets consistent profitability.
- **Timeframe**: Optimized for 1-minute charts; switch to 5-minute or 15-minute for less noise if needed.
- **Confirmation**: Cross-check MACD signals with price action or support/resistance levels for higher accuracy on BTCUSDT Futures.
#### Limitations
- This strategy relies solely on MACD, so it may lag in fast-moving or sideways markets. Consider adding a secondary filter (e.g., RSI) if needed.
- Stop-loss and take-profit are ATR-based and may need adjustment for BTCUSDT Futures’ high volatility, especially during leverage trading.
#### Conclusion
The "MACD Strategy" offers a simple yet effective way to trade momentum shifts using the MACD indicator, tested for BTCUSDT Futures on the 1-minute timeframe, with robust risk management and visual tools. Whether you’re scalping crypto futures or exploring short-term trends, this strategy provides a solid foundation for automated or manual trading. Share your feedback or customizations in the comments, and happy trading!

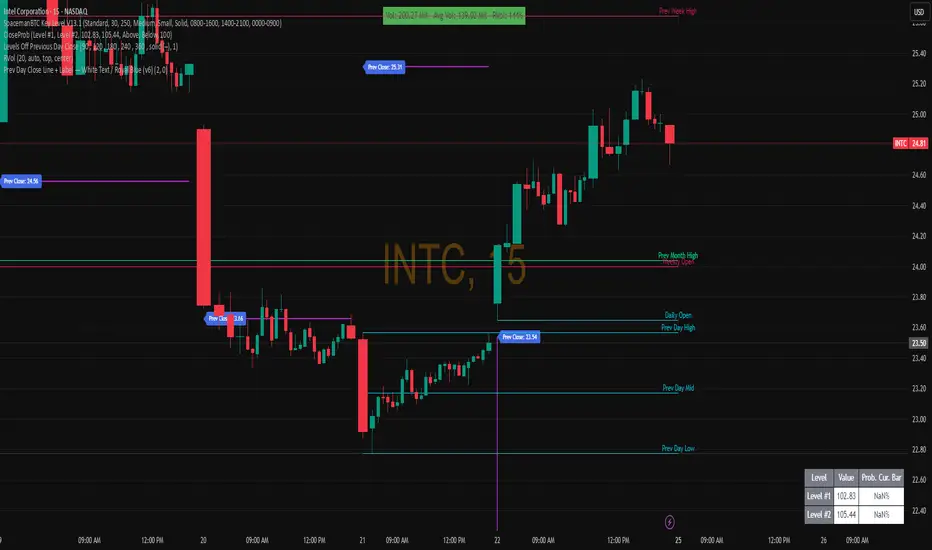
Prev Day Close Line + Label — White Text / Royal Blue (v6)Previous Day Close line with clear labeling.
- Gap up vs PDC
- Gap down vs PDC
Helps analyze what yesterday attempted to do helps to confirm whether the attempt was successful.
Trend dealing rangeHi all!
This indicator will help you find the current dealing range according to the trend. If the trend is bullish the indicator will look for a range between the latest low pivot to the latest high pivot. Vice versa in a bearish trend. The code uses my new library 'FibonacciRetracement' () that has the same code as my other indicator 'Fibonacci retracement' ().
It plots 5 lines from the low to the high and labels them 0 %, 25 %, 50 %, 75 % and 100 %. A trendline can be drawn between the two pivots (dashed and gray by default). Firstly you can define the pivot lengths used, this setting is in the 'Market structure' section but it also applies to the dealing range (it defaults to 5 (left) and 2 (right)). You can show prices if you want to (shown in parantheses, off by default). You can change the default labels position (from left) and the font size (12 by default and higher up it's 7 for market structure text). Lastly you can change the alert frequency (defaults to once per bar close) and the price that has to enter a zone for alert to be sent. 'Close' means that the closing price (or current price if you change the alert frequency to all or once per bar) has to be inside the zone and 'Wick' means that the entire candle needs to be inside the zone.
It's very useful for traders to find the current dealing range and this indicator will help you to do so.
So, this indicator will give you the dealing range and basic market structure through break of structures and change of characters.
If you have any input or suggestions on future features or bugs, don't hesitate to let me know!
Best of trading luck!

FibonacciRetracementHi all!
This library will help you draw Fibonacci retracement levels (zones). The code is from my indicator "Fibonacci retracement" (). You can see that description for more information about the behaviour and example of how to use this library. The code is almost the same with the addition of alerts. If the alert frequency is 'alert.freq_once_per_bar_close' alert messages will be concatenated and have a header saying how many messages it contains (if it's more than 1).
Hope this is of help!
Library "FibonacciRetracement"
ConcateAlerts(context)
Concatenates all alerts from the bar to one string (separated by new lines) and clears alert messages on the current bar.
Parameters:
context (Context)
AddAlert(context, message, unshiftInsteadOfPush)
Parameters:
context (Context)
message (string)
unshiftInsteadOfPush (bool)
Range(context, structure, settings)
Will return values if new levels/zones should be drawn.
Parameters:
context (Context) : The 'Context' for the Fibonacci retracement.
structure (Structure type from mickes/PriceAction/1) : The current 'Structure' from the 'MarketStructure' library.
settings (Settings) : The 'Settings' object for the 'Context'.
Returns: A tuple with the start and end pivot if new zones should be drawn, ' ' otherwise.
DrawAll(context, settings, start, end)
Draws lines and labels for the zone. It will also set the 'Price' value that will be used for absolute positions.
Parameters:
context (Context) : The 'Context' for the Fibonacci retracement.
settings (Settings) : The 'Settings' object for the 'Context'.
start (Pivot type from mickes/PriceAction/1)
end (Pivot type from mickes/PriceAction/1)
AlertActive(context, settings)
Will alert for all zones that are active. If multiple alert messages are added they will be concatenated (separated by a new line) with a header saying how many messages the alert contains.
Parameters:
context (Context) : The 'Context' for the Fibonacci retracement. This contains the zones that will be alerted if price (wick or close according to the settings) enters it.
settings (Settings) : The 'Settings' object for the 'Context'.
TrendlineSettings
Holds all the values for 'TrendlineSettings'.
Fields:
Enabled (series bool) : If the trendline should be visible or not.
Color (series color) : The color of the trendline.
Style (series string) : The style of the trendline (as a string).
GenericZonesSettings
Holds all the values for 'GenericZonesSettings', that will be applicable to all drawn objects.
Fields:
ExtendRight (series bool) : If all lines should extend to the right or not.
Style (series string) : The style of all drawn lines
Reverse (series bool) : If true, all lines will be reversed.
Prices (series bool) : If price levels should be shown or not.
Levels (series bool) : If levels should be shown or not.
LevelsValue (series string) : Either 'Value' or 'Percent'. Defined if value or percentage should be shown.
FontSize (series int) : The for size of the text in labels drawn.
LabelsPosition (series string) : Coul be 'Left', 'Rigth' or 'Adapt'. 'Adapt' will try to adapt the labels position to the prices.
ZoneSettings
Holds all the values for 'ZoneSettings'.
Fields:
Enabled (series bool) : If this zone is enabled or not.
Level (series float) : The level of the zone.
Color (series color) : The color that will be displayed.
Price (series float) : The price of the level. Will be set internally.
Settings
Holds all the values for 'Settings'.
Fields:
PivotLeftLength (series int) : The left length used to find pivots through the 'MarketStructure' library.
PivotRightLength (series int) : The right length used to find pivots through the 'MarketStructure' library.
Trendline (TrendlineSettings) : The settings for the 'Trendline' object.
GenericZonesSettings (GenericZonesSettings) : The setting applicable to all zones.
AlertFrequency (series string) : The frequency for the alerts. If 'alert.freq_once_per_bar_close', alert messages will be concatenated and have a header saying how many messages it contains (if it's more than 1).
AlertPrice (series string) : The price that has to enter a zone. Can be 'Close' (the closing price) or 'Wick' (the whole candle needs to be in the zone).
Zone1 (ZoneSettings) : The 'ZoneSettings' that represents this zone.
Zone2 (ZoneSettings) : The 'ZoneSettings' that represents this zone.
Zone3 (ZoneSettings) : The 'ZoneSettings' that represents this zone.
Zone4 (ZoneSettings) : The 'ZoneSettings' that represents this zone.
Zone5 (ZoneSettings) : The 'ZoneSettings' that represents this zone.
Zone6 (ZoneSettings) : The 'ZoneSettings' that represents this zone.
Zone7 (ZoneSettings) : The 'ZoneSettings' that represents this zone.
Zone8 (ZoneSettings) : The 'ZoneSettings' that represents this zone.
Zone9 (ZoneSettings) : The 'ZoneSettings' that represents this zone.
Zone10 (ZoneSettings) : The 'ZoneSettings' that represents this zone.
Zone11 (ZoneSettings) : The 'ZoneSettings' that represents this zone.
Zone12 (ZoneSettings) : The 'ZoneSettings' that represents this zone.
Zone13 (ZoneSettings) : The 'ZoneSettings' that represents this zone.
Zone14 (ZoneSettings) : The 'ZoneSettings' that represents this zone.
Zone15 (ZoneSettings) : The 'ZoneSettings' that represents this zone.
Zone16 (ZoneSettings) : The 'ZoneSettings' that represents this zone.
Zone17 (ZoneSettings) : The 'ZoneSettings' that represents this zone.
Zone18 (ZoneSettings) : The 'ZoneSettings' that represents this zone.
Zone19 (ZoneSettings) : The 'ZoneSettings' that represents this zone.
Zone20 (ZoneSettings) : The 'ZoneSettings' that represents this zone.
Zone21 (ZoneSettings) : The 'ZoneSettings' that represents this zone.
Zone22 (ZoneSettings) : The 'ZoneSettings' that represents this zone.
Zone23 (ZoneSettings) : The 'ZoneSettings' that represents this zone.
Zone24 (ZoneSettings) : The 'ZoneSettings' that represents this zone.
Context
Holds all the values for 'Context'.
Fields:
Lines (array) : All the drawn lines for the current 'Context'.
Labels (array) : All the drawn labels for the current 'Context'.
Boxes (array) : All the drawn boxes for the current 'Context'.
Alerts (array) : All the alert messages on the current tick.
Start (series int) : The start bar index of the current 'Context'.

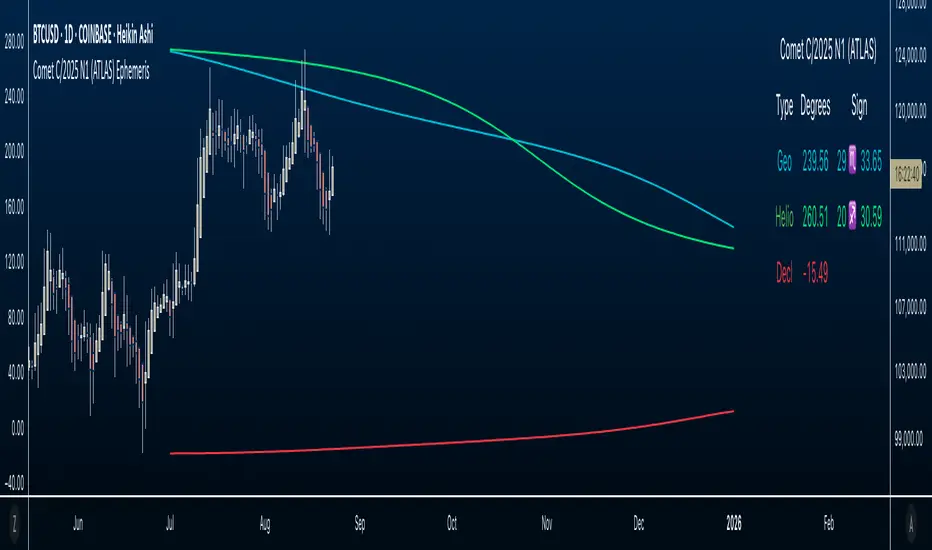
Comet C/2025 N1 (ATLAS) Ephemeris☄️ Ephemeris How-To: Plot JPL Horizons Data on TradingView (Educational)
Overview
This open-source Pine Script™ v6 indicator demonstrates how to bring external astronomical ephemeris into TradingView and plot it on a daily chart. Using Comet C/2025 N1 (ATLAS) as an example dataset, it shows the mechanics of structuring arrays, indexing by date, and drawing past and forward ( future projections ) values—strictly as an educational visualization of celestial motion.
Why This Approach
Data is generated from NASA JPL Horizons, a mission-grade, publicly available ephemeris service ( (ssd.jpl.nasa.gov)). On the daily timeframe, Horizons provides high-precision positions you can regenerate whenever solutions update—useful for educational accuracy in exploring orbital data.
What’s Plotted
- Geocentric ecliptic longitude (Earth-view)
- Heliocentric ecliptic longitude (Sun-centered)
- Declination (deg from celestial equator)
Features
- Simple arrays + date indexing (no per-row timestamps)
- Circles for historical/current bars; polylines to connect forward points, emphasizing future projections
- Toggle any series on/off via inputs
- Daily timeframe enforced (runtime error if not 1D)
- Optional table with zodiac conversion (AstroLib by BarefootJoey)
Data & Updates
The example arrays span 2025-07-01 (discovery date) → 2026-01-01. You can refresh them anytime from JPL Horizons (Observer: Geocentric; daily step; include ecliptic lon/lat and declination) and paste the new values into the script.
How we pulled the ephemeris from JPL Horizons (quick guide):
0) Open ssd.jpl.nasa.gov System
1. Ephemeris Type: Observer Table
2. Target Body: C/2025 N1 (ATLAS) (or any object you want)
3. Observer Location: Geocentric
4. Time Specification: set Start, Stop, Step = 1 day
5. Table Settings → Quantities:
* Astrometric RA & Dec
* Heliocentric ecliptic longitude & latitude
* Observer (geocentric) ecliptic longitude & latitude
6. Additional Table Settings:
* Calendar format: Gregorian
* Date/Time: calendar (UTC), Hours & Minutes (HH:MM)
* Angle format: Decimal degrees
* Refraction model: No refraction / airless
* Range units: Astronomical units (au)
7. Generate → Download results (CSV or text).
8. Use AI or a small script to parse columns (e.g., Obs ecliptic lon, Helio ecliptic lon, Declination) into arrays, then paste them into your Pine script.
Educational Note
This indicator’s goal is to show how to prepare and plot ephemeris—so you can adapt the method for other comets or celestial bodies, or swap in data from existing astro libraries, for learning about astronomical projections using JPL daily data.
Credits & License
- Ephemeris: Solar System Dynamics Group, Horizons On-Line Ephemeris System, 4800 Oak Grove Drive, Jet Propulsion Laboratory, Pasadena, CA 91109, USA.
- Zodiac conversion: AstroLib by BarefootJoey
- License: MIT
- For educational use only.
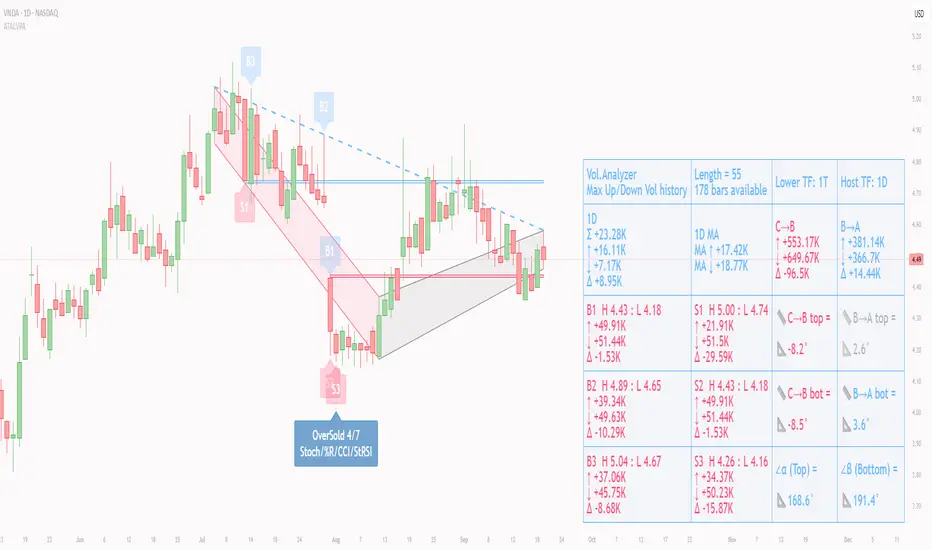
ATAI Volume Pressure Analyzer V 1.0 — Pure Up/DownATAI Volume Pressure Analyzer V 1.0 — Pure Up/Down
Overview
Volume is a foundational tool for understanding the supply–demand balance. Classic charts show only total volume and don’t tell us what portion came from buying (Up) versus selling (Down). The ATAI Volume Pressure Analyzer fills that gap. Built on Pine Script v6, it scans a lower timeframe to estimate Up/Down volume for each host‑timeframe candle, and presents “volume pressure” in a compact HUD table that’s comparable across symbols and timeframes.
1) Architecture & Global Settings
Global Period (P, bars)
A single global input P defines the computation window. All measures—host‑TF volume moving averages and the half‑window segment sums—use this length. Default: 55.
Timeframe Handling
The core of the indicator is estimating Up/Down volume using lower‑timeframe data. You can set a custom lower timeframe, or rely on auto‑selection:
◉ Second charts → 1S
◉ Intraday → 1 minute
◉ Daily → 5 minutes
◉ Otherwise → 60 minutes
Lower TFs give more precise estimates but shorter history; higher TFs approximate buy/sell splits but provide longer history. As a rule of thumb, scan thin symbols at 5–15m, and liquid symbols at 1m.
2) Up/Down Volume & Derived Series
The script uses TradingView’s library function tvta.requestUpAndDownVolume(lowerTf) to obtain three values:
◉ Up volume (buyers)
◉ Down volume (sellers)
◉ Delta (Up − Down)
From these we define:
◉ TF_buy = |Up volume|
◉ TF_sell = |Down volume|
◉ TF_tot = TF_buy + TF_sell
◉ TF_delta = TF_buy − TF_sell
A positive TF_delta indicates buyer dominance; a negative value indicates selling pressure. To smooth noise, simple moving averages of TF_buy and TF_sell are computed over P and used as baselines.
3) Key Performance Indicators (KPIs)
Half‑window segmentation
To track momentum shifts, the P‑bar window is split in half:
◉ C→B: the older half
◉ B→A: the newer half (toward the current bar)
For each half, the script sums buy, sell, and delta. Comparing the two halves reveals strengthening/weakening pressure. Example: if AtoB_delta < CtoB_delta, recent buying pressure has faded.
[ 4) HUD (Table) Display /i]
Colors & Appearance
Two main color inputs define the theme: a primary color and a negative color (used when Δ is negative). The panel background uses a translucent version of the primary color; borders use the solid primary color. Text defaults to the primary color and flips to the negative color when a block’s Δ is negative.
Layout
The HUD is a 4×5 table updated on the last bar of each candle:
◉ Row 1 (Meta): indicator name, P length, lower TF, host TF
◉ Row 2 (Host TF): current ↑Buy, ↓Sell, ΔDelta; plus Σ total and SMA(↑/↓)
◉ Row 3 (Segments): C→B and B→A blocks with ↑/↓/Δ
◉ Rows 4–5: reserved for advanced modules (Wings, α/β, OB/OS, Top
5) Advanced Modules
5.1 Wings
“Wings” visualize volume‑driven movement over C→B (left wing) and B→A (right wing) with top/bottom lines and a filled band. Slopes are ATR‑per‑bar normalized for cross‑symbol/TF comparability and converted to angles (degrees). Coloring mirrors HUD sign logic with a near‑zero threshold (default ~3°):
◉ Both lines rising → blue (bullish)
◉ Both falling → red (bearish)
◉ Mixed/near‑zero → gray
Left wing reflects the origin of the recent move; right wing reflects the current state.
5.2 α / β at Point B
We compute the oriented angle between the two wings at the midpoint B:
β is the bottom‑arc angle; α = 360° − β is the top‑arc angle.
◉ Large α (>180°) or small β (<180°) flags meaningful imbalance.
◉ Intuition: large α suggests potential selling pressure; small β implies fragile support. HUD cells highlight these conditions.
5.3 OB/OS Spike
OverBought/OverSold (OB/OS) labels appear when directional volume spikes align with a 7‑oscillator vote (RSI, Stoch, %R, CCI, MFI, DeMarker, StochRSI).
◉ OB label (red): unusually high sell volume + enough OB votes
◉ OS label (teal): unusually high buy volume + enough OS votes
Minimum votes and sync window are user‑configurable; dotted connectors can link labels to the candle wick.
5.4 Top3 Volume Peaks
Within the P window the script ranks the top three BUY peaks (B1–B3) and top three SELL peaks (S1–S3).
◉ B1 and S1 are drawn as horizontal resistance (at B1 High) and support (at S1 Low) zones with adjustable thickness (ticks/percent/ATR).
◉ The HUD dedicates six cells to show ↑/↓/Δ for each rank, and prints the exact High (B1) and Low (S1) inline in their cells.
6) Reading the HUD — A Quick Checklist
◉ Meta: Confirm P and both timeframes (host & lower).
◉ Host TF block: Compare current ↑/↓/Δ against their SMAs.
◉ Segments: Contrast C→B vs B→A deltas to gauge momentum change.
◉ Wings: Right‑wing color/angle = now; left wing = recent origin.
◉ α / β: Look for α > 180° or β < 180° as imbalance cues.
◉ OB/OS: Note labels, color (red/teal), and the vote count.
◉Top3: Keep B1 (resistance) and S1 (support) on your radar.
Use these together to sketch scenarios and invalidation levels; never rely on a single signal in isolation.
[ 7) Example Highlights (What the table conveys) /i]
◉ Row 1 shows the indicator name, the analysis length P (default 55), and both TFs used for computation and display.
◉ B1 / S1 blocks summarize each side’s peak within the window, with Δ indicating buyer/seller dominance at that peak and inline price (B1 High / S1 Low) for actionable levels.
◉ Angle cells for each wing report the top/bottom line angles vs. the horizontal, reflecting the directional posture.
◉ Ranks B2/B3 and S2/S3 extend context beyond the top peak on each side.
◉ α / β cells quantify the orientation gap at B; changes reflect shifting buyer/seller influence on trend strength.
Together these visuals often reveal whether the “wings” resemble a strong, upward‑tilted arm supported by buyer volume—but always corroborate with your broader toolkit
8) Practical Tips & Tuning
◉ Choose P by market structure. For daily charts, 34–89 bars often works well.
◉ Lower TF choice: Thin symbols → 5–15m; liquid symbols → 1m.
◉ Near‑zero angle: In noisy markets, consider 5–7° instead of 3°.
◉ OB/OS votes: Daily charts often work with 3–4 votes; lower TFs may prefer 4–5.
◉ Zone thickness: Tie B1/S1 zone thickness to ATR so it scales with volatility.
◉ Colors: Feel free to theme the primary/negative colors; keep Δ<0 mapped to the negative color for readability.
Combine with price action: Use this indicator alongside structure, trendlines, and other tools for stronger decisions.
Technical Notes
Pine Script v6.
◉ Up/Down split via TradingView/ta library call requestUpAndDownVolume(lowerTf).
◉ HUD‑first design; drawings for Wings/αβ/OBOS/Top3 align with the same sign/threshold logic used in the table.
Disclaimer: This indicator is provided solely for educational and analytical purposes. It does not constitute financial advice, nor is it a recommendation to buy or sell any security. Always conduct your own research and use multiple tools before making trading decisions.
Candlestick Patterns Dashboard Pro+ [ULTIMATE]Unleash the power of automated candlestick analysis with the most comprehensive and customizable pattern detection tool on TradingView. This is not just another pattern scanner; it's a complete trading dashboard designed to identify, score, and confirm high-probability setups, saving you hours of manual chart analysis.
Built with performance and reliability in mind, this script goes beyond simple detection by introducing a unique reliability score for every pattern, advanced confirmation filters, and a powerful on-screen dashboard to keep you informed.
Key Features
📈 Comprehensive Pattern Detection: Automatically identifies 13 of the most effective candlestick patterns, including Bullish/Bearish Engulfing, Hammer, Shooting Star, Doji, Morning/Evening Star, and more.
🔟 Dynamic Reliability Scoring: Every pattern is assigned a score from 1-10 based on its confirmation strength. Factors include candle body size, volume confirmation, trend alignment, and higher-timeframe confluence, giving you a quantifiable measure of a pattern's potential.
📊 The Ultimate Dashboard: Your at-a-glance command center. The on-screen dashboard provides a complete summary of all active patterns, showing you exactly when they last occurred and highlighting the most recent signals. It also includes an "Overall Bias" meter for a quick sentiment check.
🛡️ Trade Smarter with Advanced Confirmation Filters: Eliminate low-quality signals and focus on what matters.
Trend Alignment: Use SMA(50) and SMA(200) to only show patterns that agree with the dominant market trend.
Volume Confirmation: Validate patterns by requiring a surge in volume.
Non-Repainting HTF Confirmation: Ensure your patterns align with the trend on a higher timeframe (e.g., Daily trend for a 4H signal) using a reliable, non-repainting method.
Market Condition Filter: Isolate patterns that occur only in "Trending" or "Ranging" markets.
Time Filter: Restrict pattern detection to specific trading sessions.
🔧 ‘Fuzzy Logic’ for Real-World Trading: Textbook patterns are rare. Use the "Fuzzy Logic" settings to adjust the criteria for patterns like the Hammer, Piercing Line, and Doji, allowing you to catch imperfect but still valid real-world formations.
⚙️ Fully Customizable Scoring: You decide what's important! Adjust the bonus scores for volume, trend, and other factors to create a scoring system that perfectly aligns with your trading strategy.
🚨 Powerful & Customizable Alerts: Never miss an opportunity.
Create alerts for any individual pattern.
Get notified of "Pattern Clusters" when multiple bullish or bearish signals appear in close succession.
Customize the alert messages to be compatible with your favorite trading automation services.
🚀 Performance Optimized: A "Max Bars Back" setting ensures the script runs smoothly and efficiently, even on lower-end devices or extensive historical data.
How To Use This Indicator
For Confirmation: The primary strength of this tool is for confirmation. Do not trade based on patterns alone. Use the detected signals to confirm your own analysis, such as a pattern appearing at a key support/resistance level, a trendline, or a Fibonacci retracement. A Bullish Engulfing pattern at a major support level is a much stronger signal than one appearing in the middle of a range.
For Discovery: Use the Dashboard to quickly scan through your favorite assets. A dashboard full of recent bullish signals on one asset, and bearish on another, can instantly help you focus your attention for the day.
Customizing for Your Style:
Start with the Market Presets ("Forex," "Stocks," "Crypto") for a solid baseline.
Dive into the Scoring Weights to tell the indicator what you value most. A pure volume trader might increase the Volume Bonus score.
Adjust the Fuzzy Logic settings based on your market's volatility. A volatile crypto market might require a more lenient Doji definition than a stable blue-chip stock.
Setting Up Alerts:
Add the indicator to your chart.
Click the "Alert" button in the TradingView toolbar.
Set the "Condition" to "Candlestick Patterns Dashboard Pro+ ".
Choose the specific alert you want from the dropdown (e.g., "Bullish Pattern Detected," "Bearish Pattern Cluster").
Customize the message if needed and click "Create."
A Note of Thanks
This script began as a personal project and has evolved into this ultimate version thanks to invaluable community feedback, bug reports, and suggestions. A special thank you to the users who helped identify and fix critical bugs related to syntax and variable scope. This collaborative effort has made the indicator more robust and reliable for everyone.
Disclaimer: This tool is for educational and analytical purposes only. All trading involves substantial risk. Past performance is not indicative of future results. Please trade responsibly.

Trapped Traders [ScorsoneEnterprises]This indicator identifies and visualizes trapped traders - market participants caught on the wrong side of price movements with significant volume imbalances. By analyzing volume delta at specific price levels, it reveals where traders are likely experiencing unrealized losses and may be forced to exit their positions.
The point of this tool is to identify where the liquidity in a trend may be.
var lowerTimeframe = switch
useCustomTimeframeInput => lowerTimeframeInput
timeframe.isseconds => "1S"
timeframe.isintraday => "1"
timeframe.isdaily => "5"
=> "60"
= ta.requestVolumeDelta(lowerTimeframe)
price_quantity = map.new()
is_red_candle = close < open
is_green_candle = close > open
for i=0 to lkb-1 by 1
current_vol = price_quantity.get(close)
new_vol = na(current_vol) ? lastVolume : current_vol + lastVolume
price_quantity.put(close, new_vol)
if is_green_candle and new_vol < 0
price_quantity.put(close, new_vol)
else if is_red_candle and new_vol > 0
price_quantity.put(close, new_vol)
We see in this snippet, the lastVolume variable is the most recent volume delta we can receive from the lower timeframe, we keep updating the price level we're keeping track of with that lastVolume from the lower timeframe.
This is the bulk of the concept as this level and size gives us the idea of how many traders were on the wrong side of the trend, and acting as liquidity for the profitable entries. The more, the stronger.
There are 3 ways to visualize this. A basic label, that will display the size and if positive or negative next to the bar, a gradient line that goes 10 bars to the future to be used as a support or resistance line that includes the quantity, and a bubble chart with the quantity. The larger the quantity, the bigger the bubble.
We see in this example on NYMEX:CL1! that there are lines plotted throughout this price action that price interacts with in meaningful way. There are consistently many levels for us.
Here on CME_MINI:ES1! we see the labels on the chart, and the size set to large. It is the same concept just another way to view it.
This chart of CME_MINI:RTY1! shows the bubble chart visualization. It is a way to view it that is pretty non invasive on the chart.
Every timeframe is supported including daily, weekly, and monthly.
The included settings are the display style, like mentioned above. If the user would like to see the volume numbers on the chart. The text size along with the transparency percentage. Following that is the settings for which lower timeframe to calculate the volume delta on. Finally, if you would like to see your inputs in the status line.
No indicator is 100% accurate, use "Trapped Traders" along with your own discretion.

T-Virus Sentiment [hapharmonic]🧬 T-Virus Sentiment: Visualize the Market's DNA
Remember the iconic T-Virus vial from the first Resident Evil? That powerful, swirling helix of potential has always fascinated me. It sparked an idea: what if we could visualize the market's underlying health in a similar way? What if we could capture the "genetic code" of market sentiment and contain it within a dynamic, 3D indicator? This project is the result of that idea, brought to life with Pine Script.
The indicator's main goal is to measure the strength and direction of market sentiment by analyzing the "genetic code" of price action through a variety of trusted indicators. The result is displayed as a liquid level within a DNA helix, a bubble density representing buying pressure, and a T-Virus mascot that reflects the overall mood.
🧐 Core Concept: How It Works
The primary output of the indicator is the "Active %" gauge you see on the right side of the vial. This percentage represents the overall sentiment score, calculated as an average from 7 different technical analysis tools. Each tool is analyzed on every bar and assigned a score from 1 (strong bearish pressure) to 5 (strong bullish potential).
In this indicator, we re-imagine market dynamics through the lens of a viral outbreak. A strong bear market is like a virus taking hold, pulling all technical signals down into a state of weakness. Conversely, a powerful bull market is like an antiviral serum ; positive signals rise and spread toward the top of the vial, indicating that the system is being injected with strength.
This is not just another line on a chart. It's a comprehensive sentiment dashboard designed to give an immediate, at-a-glance understanding of the confluence between 7 classic technical indicators. The incredible 3D model of the vial itself was inspired by a design concept found here .
⚛️ The 4 Core Elements of T-Virus Sentiment
These four elements work in harmony to give a complete, multi-faceted picture of market sentiment. Each component tells a different part of the story.
The Virus Mascot: An instant emotional cue. This character provides the quickest possible read on the overall market mood, combining sentiment with volume pressure.
The Antiviral Serum Level: The main quantitative output. This is the liquid level in the DNA helix and the percentage gauge on the right, representing the average sentiment score from all 7 indicators.
Buy Pressure & Bubble Density: This visualizes volume flow. The density of bubbles represents the intensity of accumulation (buying) versus distribution (selling). It's the "power" behind the move.
The Signal Distribution: This shows the confluence (or dispersion) of sentiment. Are all signals bullish and clustered at the top, or are they scattered, indicating a conflicted market? The position of the indicator labels is crucial, as each is assigned to one of five distinct zones:
Base Bottom: The market is at its weakest. Signals here suggest strong bearish control and distribution.
Lower Zone: The market is still bearish, but signals may be showing early signs of accumulation or bottoming.
Neutral Core (Center): A state of balance or sideways consolidation. The market is waiting for a new direction.
Upper Zone: Bullish momentum is becoming clear. Signals are strengthening and showing bullish control.
Top Cap: The market is "heating up" with strong bullish sentiment, potentially nearing overbought conditions.
🐂🐻 The Virus Mascot: The At-a-Glance Indicator
This character acts as a shortcut to confirm market health. It combines the sentiment score with volume, preventing false confidence in a low-volume rally.
Its state is determined by a dual-check: the overall "Antiviral Serum Level" and the "Buy Pressure" must both be above 50%.
Green & Smiling: The 'all clear' signal. This means that not only is the overall technical sentiment bullish, but it's also being supported by real buying pressure. This is a sign of a healthy bull market.
Red & Angry: A warning sign. This appears if either the sentiment is weak, or a bullish sentiment is not being confirmed by buying volume. The latter could indicate a potential "bull trap" or an exhaustive move.
This mascot can be disabled from the settings page under "Virus Mascot Styling" if a cleaner look is preferred.
🫧 Bubble Density: Gauging Buy vs. Sell Pressure
The bubbles visualize the battle between buyers and sellers. There are two modes to control how this is calculated:
Mode 1: Visible Range (The 'Big Picture' View)
This default mode is best for getting a broad, contextual understanding of the current session. It dynamically analyzes the volume of every single candlestick currently visible on the screen to calculate the buy/sell pressure ratio. It answers the question: "Over the entire period I'm looking at, who is in control?" As you zoom in or out, the calculation adapts.
Mode 2: Custom Lookback (The 'Precision' View)
This mode is for traders who need to analyze short-term pressure. You can define a fixed number of recent bars to analyze, which is perfect for scalping or understanding the volume dynamics leading into a key level. It answers the question: "What is happening right now ?" In the example above, a lookback of 2 focuses only on the most recent action, clearly showing intense, immediate selling pressure (few bubbles) and a corresponding drop in the sentiment score to 29%.
ℹ️ Interactive Tooltips: Dive Deeper
We believe in transparency, not 'black box' indicators. This feature transforms the indicator from a visual aid into an active learning tool.
Simply hover the mouse over any indicator label (like EMA, OBV, etc.) to get a detailed tooltip. It will explain the specific data points and thresholds that signal met to be placed in its current zone. This helps build trust in the signals and allows users to fine-tune the indicator settings to better match their own trading style.
🎯 The Scoring Logic Breakdown
The "Antiviral Serum Level" gauge is the average score from 7 technical analysis tools. Each is graded on a 5-point scale (1=Strong Bearish to 5=Strong Bullish). Here’s a detailed, transparent look at how each "gene" is evaluated:
Relative Strength Index (RSI)
Measures momentum and overbought/oversold conditions.
Group 1 (Strong Bearish): RSI > 80 (Extreme Overbought)
Group 2 (Bearish): 70 < RSI ≤ 80 (Overbought)
Group 3 (Neutral): 30 ≤ RSI ≤ 70
Group 4 (Bullish): 20 ≤ RSI < 30 (Oversold)
Group 5 (Strong Bullish): RSI < 20 (Extreme Oversold)
Exponential Moving Averages (EMA)
Evaluates the trend's strength and structure based on the alignment of multiple EMAs (9, 21, 50, 100, 200, 250).
Group 1 (Strong Bearish): A perfect bearish sequence (9 < 21 < 50 < ...)
Group 2 (Bearish Transition): Early signs of a potential reversal (e.g., 9 > 21 but still below 50)
Group 3 (Neutral / Mixed): MAs are intertwined or showing a partial bullish sequence.
Group 4 (Bullish): A strong bullish sequence is forming (e.g., 9 > 21 > 50 > 100)
Group 5 (Strong Bullish): A perfect bullish sequence (9 > 21 > 50 > 100 > 200 > 250)
Moving Average Convergence Divergence (MACD)
Analyzes the relationship between two moving averages to gauge momentum.
Group 1 (Strong Bearish): MACD & Histogram are negative and momentum is falling.
Group 2 (Weakening Bearish): MACD is negative but the histogram is rising or positive.
Group 3 (Neutral / Crossover): A crossover event is occurring near the zero line.
Group 4 (Bullish): MACD & Histogram are positive.
Group 5 (Strong Bullish): MACD & Histogram are positive, rising strongly, and accelerating.
Average Directional Index (ADX)
Measures trend strength, not direction. The score is based on both ADX value and the dominance of DI+ vs DI-.
Group 1 (Bearish / No Trend): ADX < 20 and DI- is dominant.
Group 2 (Developing Bearish Trend): 20 ≤ ADX < 25 and DI- is dominant.
Group 3 (Neutral / Indecision): Trend is weak or DI+ and DI- are nearly equal.
Group 4 (Developing Bullish Trend): 25 ≤ ADX ≤ 40 and DI+ is dominant.
Group 5 (Strong Bullish Trend): ADX > 40 and DI+ is dominant.
Ichimoku Cloud (IKH)
A comprehensive indicator that defines support/resistance, momentum, and trend direction.
Group 1 (Strong Bearish): Price is below the Kumo, Tenkan < Kijun, and Chikou is below price.
Group 2 (Bearish): Price is inside or below the Kumo, with mixed secondary signals.
Group 3 (Neutral / Ranging): Price is inside the Kumo, often with a Tenkan/Kijun cross.
Group 4 (Bullish): Price is above the Kumo with strong primary signals.
Group 5 (Strong Bullish): All signals are aligned bullishly: price above Kumo, bullish Tenkan/Kijun cross, bullish future Kumo, and Chikou above price.
Bollinger Bands (BB)
Measures volatility and relative price levels.
Group 1 (Strong Bearish): Price is below the lower band.
Group 2 (Bearish Territory): Price is between the lower band and the basis line.
Group 3 (Neutral): Price is hovering around the basis line.
Group 4 (Bullish Territory): Price is between the basis line and the upper band.
Group 5 (Strong Bullish): Price is above the upper band.
On-Balance Volume (OBV)
Uses volume flow to predict price changes. The score is based on OBV's trend and its position relative to its moving average.
Group 1 (Strong Bearish): OBV is below its MA and falling.
Group 2 (Weakening Bearish): OBV is below its MA but showing signs of rising.
Group 3 (Neutral): OBV is very close to its MA.
Group 4 (Bullish): OBV is above its MA and rising.
Group 5 (Strong Bullish): OBV is above its MA, rising strongly, and showing signs of a volume spike.
🧭 How to Use the T-Virus Sentiment Indicator
IMPORTANT: This indicator is a sentiment dashboard , not a direct buy/sell signal generator. Its strength lies in showing confluence and providing a quick, holistic view of the market's technical health.
Confirmation Tool: Use the "Active %" gauge to confirm a trade setup from your primary strategy. For example, if you see a bullish chart pattern, a high and rising sentiment score can add confidence to your trade.
Momentum & Trend Gauge: A consistently high score (e.g., > 75%) suggests strong, established bullish momentum. A consistently low score (< 25%) suggests strong bearish control. A score hovering around 50% often indicates a ranging or indecisive market.
Divergence & Warning System: Pay attention to divergences. If the price is making new highs but the sentiment score is failing to follow or is actively decreasing, it could be an early warning sign that the underlying momentum is weakening.
⚙️ Settings & Customization
The indicator is highly customizable to fit any trading style.
Position & Anchor: Control where the vial appears on the chart.
Styling (Vial, Helix, etc.): Nearly every visual element can be color-customized.
Signals: This is where the real power is. All underlying indicator parameters (RSI length, MACD settings, etc.) can be fine-tuned to match a personal strategy. The text labels can also be disabled if the chart feels cluttered.
Enjoy visualizing the market's DNA with the T-Virus Sentiment indicator

Bitcoin cme gap indicators, BINANCE vs CME exchanges premium gap
# CME BTC Premium Indicator Documentation CME:BTC1!
## 1. Overview
Indicator Name: CME BTC Premium
Platform: TradingView (Pine Script v6)
Type: Premium / Gap Analysis
Purpose:
* Visualize the CME BTC futures premium/discount relative to Binance BTCUSDT spot price.
* Detect gap-up or gap-down events on the daily chart.
* Assess short-term market sentiment and potential volatility through price discrepancies.
## 2. Key Features
1. CME Premium Calculation
* Formula:
CME Premium(%) = ((CME Price - Binance Price) / Binance Price) X 100
* Positive premium: CME futures are higher than spot → Color: Blue
* Negative premium: CME futures are lower than spot → Color: Purple
2. Premium Visualization Options
* `Column` (default)
* `Line`
3. Daily Gap Detection (Daily Chart Only)
* Gap Up: CME open > previous high × 1.0001 (≥ 0.01%)
* Gap Down: CME open < previous low × 0.9999 (≤ 0.01%)
* Visualization:
* Bar Color:
* Gap Up → Yellow (semi-transparent)
* Gap Down → Blue (semi-transparent)
* Background Color:
* Gap Up → Yellow (semi-transparent)
* Gap Down → Blue (semi-transparent)
4. Label Display
* If `Show CME Label` is enabled, the last bar displays a premium percentage label.
* Label color matches premium color; text color: Black.
* Style: `style_label_upper_left`, Size: `small`.
## 3. User Inputs
| Option Name | Description | Type / Default |
| -------------- | ------------------------- | --------------------------------------- |
| Show CME Label | Display CME premium label | Boolean / true |
| CME Plot Type | CME premium chart style | String / Column (Options: Column, Line) |
## 4. Data Sources
| Data Item | Symbol | Description |
| ------------- | ---------------- | ----------------------------- |
| Binance Price | BINANCE\:BTCUSDT | Spot BTC price |
| CME Price | CME\:BTC1! | CME BTC futures closing price |
| CME Open | CME\:BTC1! | CME BTC futures open price |
| CME Low | CME\:BTC1! | CME BTC futures low price |
| CME High | CME\:BTC1! | CME BTC futures high price |
## 5. Chart Display
1. Premium Column/Line
* Displays the CME premium percentage in real-time.
* Color: Premium ≥ 0 → Blue, Premium < 0 → Purple
2. Zero Line
* Indicates CME futures are at parity with spot for quick visual reference.
3. Gap Highlight
* Applied only on daily charts.
* Gap-up or gap-down is highlighted using bar and background colors.
4. Label
* Shows the latest CME premium percentage for quick monitoring.
## 6. Use Cases
* Analyze spot-futures premium to gauge CME market sentiment.
* Identify short-term volatility and potential trend reversals through daily gaps.
* Combine premium and gap analysis to support altcoin trend analysis and position strategy.
## 7. Limitations
* This indicator does not provide investment advice or trading recommendations; it is for informational purposes only.
* Data delays, API restrictions, or exchange differences may result in calculation discrepancies.
* Gap detection is meaningful only on daily charts; other timeframes may not provide valid signals.

Daily Buy/Sell Triggers + ATR TargetsThis tool gives you a once-per-day, objective ATR map: Buy Trigger above the open, Sell Trigger below the open, clean ATR targets, and FULL ATR extremes. It’s designed for clarity, precision, and zero intraday repainting so you can plan the session and execute with confidence.
This indicator prints a new, static grid of intraday levels every New York 18:00 (end of the NY trading day). The grid is anchored at the day’s open and spaced by the Daily ATR so you get tick-precise Buy Trigger, Sell Trigger, intermediate ATR targets, and the FULL ATR bounds for the session.
The levels act as objective support/resistance and intraday measuring sticks for continuation, mean-reversion, and range expansion trades.
What you see on the chart
A thin midline at the Daily Open (anchor).
Green lines above, red lines below, spaced at your chosen ATR multiples.
Text at the far right for:
Buy trigger
Sell trigger
FULL ATR (both sides)
Intermediate targets are unlabeled to keep the chart clean (they’re still tradable S/R).
Advanced Volume Profile Pro Delta + POC + VAH/VAL# Advanced Volume Profile Pro - Delta + POC + VAH/VAL Analysis System
## WHAT THIS SCRIPT DOES
This script creates a comprehensive volume profile analysis system that combines traditional volume-at-price distribution with delta volume calculations, Point of Control (POC) identification, and Value Area (VAH/VAL) analysis. Unlike standard volume indicators that show only total volume over time, this script analyzes volume distribution across price levels and estimates buying vs selling pressure using multiple calculation methods to provide deeper market structure insights.
## WHY THIS COMBINATION IS ORIGINAL AND USEFUL
**The Problem Solved:** Traditional volume indicators show when volume occurs but not where price finds acceptance or rejection. Standalone volume profiles lack directional bias information, while basic delta calculations don't provide structural context. Traders need to understand both volume distribution AND directional sentiment at key price levels.
**The Solution:** This script implements an integrated approach that:
- Maps volume distribution across price levels using configurable row density
- Estimates delta (buying vs selling pressure) using three different methodologies
- Identifies Point of Control (highest volume price level) for key support/resistance
- Calculates Value Area boundaries where 70% of volume traded
- Provides real-time alerts for key level interactions and volume imbalances
**Unique Features:**
1. **Developing POC Visualization**: Real-time tracking of Point of Control migration throughout the session via blue dotted trail, revealing institutional accumulation/distribution patterns before they complete
2. **Multi-Method Delta Calculation**: Price Action-based, Bid/Ask estimation, and Cumulative methods for different market conditions
3. **Adaptive Timeframe System**: Auto-adjusts calculation parameters based on chart timeframe for optimal performance
4. **Flexible Profile Types**: N Bars Back (precise control), Days Back (calendar-based), and Session-based analysis modes
5. **Advanced Imbalance Detection**: Identifies and highlights significant buying/selling imbalances with configurable thresholds
6. **Comprehensive Alert System**: Monitors POC touches, Value Area entry/exit, and major volume imbalances
## HOW THE SCRIPT WORKS TECHNICALLY
### Core Volume Profile Methodology:
**1. Price Level Distribution:**
- Divides price range into user-defined rows (10-50 configurable)
- Calculates row height: `(Highest Price - Lowest Price) / Number of Rows`
- Distributes each bar's volume across price levels it touched proportionally
**2. Delta Volume Calculation Methods:**
**Price Action Method:**
```
Price Range = High - Low
Buy Pressure = (Close - Low) / Price Range
Sell Pressure = (High - Close) / Price Range
Buy Volume = Total Volume × Buy Pressure
Sell Volume = Total Volume × Sell Pressure
Delta = Buy Volume - Sell Volume
```
**Bid/Ask Estimation Method:**
```
Average Price = (High + Low + Close) / 3
Buy Volume = Close > Average ? Volume × 0.6 : Volume × 0.4
Sell Volume = Total Volume - Buy Volume
```
**Cumulative Method:**
```
Buy Volume = Close > Open ? Volume : Volume × 0.3
Sell Volume = Close ≤ Open ? Volume : Volume × 0.3
```
**3. Point of Control (POC) Identification:**
- Scans all price levels to find maximum volume concentration
- POC represents the price level with highest trading activity
- Acts as significant support/resistance level
- **Developing POC Feature**: Tracks POC evolution in real-time via blue dotted trail, showing how institutional interest migrates throughout the session. Upward POC migration indicates accumulation patterns, downward migration suggests distribution, providing early trend signals before price confirmation.
**4. Value Area Calculation:**
- Starts from POC and expands up/down to encompass 70% of total volume
- VAH (Value Area High): Upper boundary of value area
- VAL (Value Area Low): Lower boundary of value area
- Expansion algorithm prioritizes direction with higher volume
**5. Adaptive Range Selection:**
Based on profile type and timeframe optimization:
- **N Bars Back**: Fixed lookback period with performance optimization (20-500 bars)
- **Days Back**: Calendar-based analysis with automatic timeframe adjustment (1-365 days)
- **Session**: Current trading session or custom session times
### Performance Optimization Features:
- **Sampling Algorithm**: Reduces calculation load on large datasets while maintaining accuracy
- **Memory Management**: Clears previous drawings to prevent performance degradation
- **Safety Constraints**: Prevents excessive memory usage with configurable limits
## HOW TO USE THIS SCRIPT
### Initial Setup:
1. **Profile Configuration**: Select profile type based on trading style:
- N Bars Back: Precise control over data range
- Days Back: Intuitive calendar-based analysis
- Session: Real-time session development
2. **Row Density**: Set number of rows (30 default) - more rows = higher resolution, slower performance
3. **Delta Method**: Choose calculation method based on market type:
- Price Action: Best for trending markets
- Bid/Ask Estimate: Good for ranging markets
- Cumulative: Smoothed approach for volatile markets
4. **Visual Settings**: Configure colors, position (left/right), and display options
### Reading the Profile:
**Volume Bars:**
- **Length**: Represents relative volume at that price level
- **Color**: Green = net buying pressure, Red = net selling pressure
- **Intensity**: Darker colors indicate volume imbalances above threshold
**Key Levels:**
- **POC (Blue Line)**: Highest volume price - major support/resistance
- **VAH (Purple Dashed)**: Value Area High - upper boundary of fair value
- **VAL (Orange Dashed)**: Value Area Low - lower boundary of fair value
- **Value Area Fill**: Shaded region showing main trading range
**Developing POC Trail:**
- **Blue Dotted Lines**: Show real-time POC evolution throughout the session
- **Migration Patterns**: Upward trail indicates bullish accumulation, downward trail suggests bearish distribution
- **Early Signals**: POC movement often precedes price movement, providing advance warning of institutional activity
- **Institutional Footprints**: Reveals where smart money concentrated volume before final POC establishment
### Trading Applications:
**Support/Resistance Analysis:**
- POC acts as magnetic price level - expect reactions
- VAH/VAL provide intermediate support/resistance levels
- Profile edges show areas of low volume acceptance
**Developing POC Analysis:**
- **Upward Migration**: POC moving higher = institutional accumulation, bullish bias
- **Downward Migration**: POC moving lower = institutional distribution, bearish bias
- **Stable POC**: Tight clustering = balanced market, range-bound conditions
- **Early Trend Detection**: POC direction change often precedes price breakouts
**Entry Strategies:**
- Buy at VAL with POC as target (in uptrends)
- Sell at VAH with POC as target (in downtrends)
- Breakout plays above/below profile extremes
**Volume Imbalance Trading:**
- Strong buying imbalance (>60% threshold) suggests continued upward pressure
- Strong selling imbalance suggests continued downward pressure
- Imbalances near key levels provide high-probability setups
**Multi-Timeframe Context:**
- Use higher timeframe profiles for major levels
- Lower timeframe profiles for precise entries
- Session profiles for intraday trading structure
## SCRIPT SETTINGS EXPLANATION
### Volume Profile Settings:
- **Profile Type**: Determines data range for calculation
- N Bars Back: Exact number of bars (20-500 range)
- Days Back: Calendar days with timeframe adaptation (1-365 days)
- Session: Trading session-based (intraday focus)
- **Number of Rows**: Profile resolution (10-50 range)
- **Profile Width**: Visual width as chart percentage (10-50%)
- **Value Area %**: Volume percentage for VA calculation (50-90%, 70% standard)
- **Auto-Adjust**: Automatically optimizes for different timeframes
### Delta Volume Settings:
- **Show Delta Volume**: Enable/disable delta calculations
- **Delta Calculation Method**: Choose methodology based on market conditions
- **Highlight Imbalances**: Visual emphasis for significant volume imbalances
- **Imbalance Threshold**: Percentage for imbalance detection (50-90%)
### Session Settings:
- **Session Type**: Daily, Weekly, Monthly, or Custom periods
- **Custom Session Time**: Define specific trading hours
- **Previous Sessions**: Number of historical sessions to display
### Days Back Settings:
- **Lookback Days**: Number of calendar days to analyze (1-365)
- **Automatic Calculation**: Script automatically converts days to bars based on timeframe:
- Intraday: Accounts for 6.5 trading hours per day
- Daily: 1 bar per day
- Weekly/Monthly: Proportional adjustment
### N Bars Back Settings:
- **Lookback Bars**: Exact number of bars to analyze (20-500)
- **Precise Control**: Best for systematic analysis and backtesting
### Visual Customization:
- **Colors**: Bullish (green), Bearish (red), and level colors
- **Profile Position**: Left or Right side of chart
- **Profile Offset**: Distance from current price action
- **Labels**: Show/hide level labels and values
- **Smooth Profile Bars**: Enhanced visual appearance
### Alert Configuration:
- **POC Touch**: Alerts when price interacts with Point of Control
- **VA Entry/Exit**: Alerts for Value Area boundary interactions
- **Major Imbalance**: Alerts for significant volume imbalances
## VISUAL FEATURES
### Profile Display:
- **Horizontal Bars**: Volume distribution across price levels
- **Color Coding**: Delta-based coloring for directional bias
- **Smooth Rendering**: Optional smoothing for cleaner appearance
- **Transparency**: Configurable opacity for chart readability
### Level Lines:
- **POC**: Solid blue line with optional label
- **VAH/VAL**: Dashed colored lines with value displays
- **Extension**: Lines extend across relevant time periods
- **Value Area Fill**: Optional shaded region between VAH/VAL
### Information Table:
- **Current Values**: Real-time POC, VAH, VAL prices
- **VA Range**: Value Area width calculation
- **Positioning**: Multiple table positions available
- **Text Sizing**: Adjustable for different screen sizes
## IMPORTANT USAGE NOTES
**Realistic Expectations:**
- Volume profile analysis provides structural context, not trading signals
- Delta calculations are estimations based on price action, not actual order flow
- Past volume distribution does not guarantee future price behavior
- Combine with other analysis methods for comprehensive market view
**Best Practices:**
- Use appropriate profile types for your trading style:
- Day Trading: Session or Days Back (1-5 days)
- Swing Trading: Days Back (10-30 days) or N Bars Back
- Position Trading: Days Back (60-180 days)
- Consider market context (trending vs ranging conditions)
- Verify key levels with additional technical analysis
- Monitor profile development for changing market structure
**Performance Considerations:**
- Higher row counts increase calculation complexity
- Large lookback periods may affect chart performance
- Auto-adjust feature optimizes for most use cases
- Consider using session profiles for intraday efficiency
**Limitations:**
- Delta calculations are estimations, not actual transaction data
- Profile accuracy depends on available price/volume history
- Effectiveness varies across different instruments and market conditions
- Requires understanding of volume profile concepts for optimal use
**Data Requirements:**
- Requires volume data for accurate calculations
- Works best on liquid instruments with consistent volume
- May be less effective on very low volume or exotic instruments
This script serves as a comprehensive volume analysis tool for traders who need detailed market structure information with integrated directional bias analysis and real-time POC development tracking for informed trading decisions.

VSA - The Volume HUDVSA Volume HUD: Your At-a-Glance Volume Dashboard
Tired of cluttered charts with multiple indicators taking up screen space?
The VSA Volume HUD is a clean, powerful, and fully customisable Heads-Up Display that puts all the critical volume and price action data you need into one compact box, right on your chart.
Designed for traders who rely on Volume Spread Analysis (VSA), this tool helps you instantly gauge the strength, conviction, and context behind every price move as it happens.
Key Features
This indicator isn't just about showing the current volume; it provides a comprehensive, real-time analysis of the market's activity.
Real-time VSA Dashboard: A persistent on-screen table that updates with every tick, giving you instant feedback without needing to look away from the price. The HUD is fully draggable (hold Ctrl/Cmd + click and drag) to place it anywhere you like.
Essential Volume Metrics:
Current Volume: Displayed in a clean, abbreviated format (e.g., 1.25M for millions, 54.3K for thousands).
% Change (vs. Previous Bar): Instantly see if volume is expanding or contracting.
Vs Short-Term Average: Compare the current bar's volume to a moving average to spot unusual spikes.
Volume Velocity: Measures the rate of change in volume over a short period, helping you spot acceleration or deceleration in market interest.
Relative Volume (RVOL): See how the current volume compares to the average for that specific time of day, perfect for identifying abnormally high or low activity.
Price Action & Volatility Context:
Range vs. ATR: Quickly determine if the current bar's volatility is expanding or contracting compared to the recent average.
Price vs. VWAP: See how far the current price has deviated from the session's Volume-Weighted Average Price, a key level for institutional traders.
Deep Customization is Key
Tailor the HUD to perfectly match your trading style and chart aesthetic.
Display & Layout:
Compact Mode: Remove the metric labels for a sleek, minimalist view that saves screen space.
Bar Meters: Enable optional visual bars next to key metrics for a quick, graphical representation of strength.
Total Control: Toggle every single metric on or off to build the exact dashboard you need. Adjust text size, position, and background opacity with ease.
Smart Coloring & Visual Alerts:
Advanced VSA Coloring: This isn't just about up/down candles. The script intelligently colors volume based on confluence. It highlights increasing volume on a strong up-bar (bullish confirmation) or increasing volume on a down-bar (potential climax or distribution), giving you a deeper VSA context.
High Volume Highlight: Make standout bars impossible to miss! The entire HUD background can change color automatically when volume surges past a custom threshold (e.g., over 150% of the average), instantly drawing your attention to critical moments.
Full Color Customization: Change every color to match your chart's theme, including separate colors for bullish/bearish moves, the background, and the border.
How to Use It
The VSA Volume HUD is a powerful confirmation tool. Use it to:
Confirm Breakouts: Look for a spike in Volume vs. Average and RVOL as price breaks a key level.
Spot Exhaustion: Notice high volume on a narrow-range candle after a long trend, visible through the Range/ATR metric.
Gauge Conviction: Use the Advanced Coloring to see if volume is supporting the price move (e.g., green volume on a green candle) or diverging from it.

STOCK EXCHANGE + SILVER BULLET FRAMESThis script is an updated version of the " NY/LDN/TOK Stock Exchange Opening Hours " script.
Objective
Displays global stock exchange sessions (New York, London, Tokyo) with session frames, highs/lows, and opening lines. Includes ICT Silver Bullet windows (NY, London, Tokyo) with configurable shading. Past sessions are frozen at close, ongoing sessions update dynamically until closure, and upcoming sessions are pre-drawn. Fully customizable with options for weekends, labels, padding, opacity, and individual session toggles.
It is designed to help traders quickly interpret market context, liquidity zones, and session-based price behavior.
Main Features
Past sessions (historical data)
• Session Frames:
• Each box is frozen at the session’s close.
• The left edge aligns with the opening time, while the right edge is fixed at the closing time.
• The top and bottom reflect the highest and lowest prices during the session.
• Session Labels:
• Names (NY, LDN, TOK) displayed above the frame, aligned left, in the same color as the frame.
• Opening Lines:
• Vertical dotted lines mark the start of each session.
Ongoing and upcoming sessions (live market)
• Dynamic Session Frames:
• The right edge is locked at the future close time.
• The top and bottom update in real time as new highs and lows form.
• Labels and Lines:
• The session label is visible above the active frame.
• Opening lines are drawn as soon as the session begins.
Silver Bullet Time Windows (ICT concept)
• Highlights key liquidity windows within sessions:
• New York: 10:00–11:00 and 14:00–15:00
• London: 08:00–09:00
• Tokyo: 09:00–10:00
• Silver Bullet zones are shaded with configurable opacity (default 5%).
Customization and Options
• Enable or disable individual sessions (NY, London, Tokyo).
• Toggle weekend display (frames and Silver Bullets).
• Adjust label size, padding, and text visibility.
• Control frame opacity (default 0%).
• Optimized memory management with automatic pruning of old graphical objects.

Market Structure Trend Change by TenAMTraderMarket Structure Trend Change Indicator
Description:
This indicator detects changes in market trend by analyzing swing highs and lows to identify Higher Highs (HH), Higher Lows (HL), Lower Highs (LH), and Lower Lows (LL). It helps traders quickly see potential reversals and trend continuation points.
Features:
Automatically identifies pivots based on configurable left and right bars.
Labels pivot points (HH, HL, LH, LL) directly on the chart (text-only for clarity).
Generates buy and sell signals when a trend change is detected:
Buy Signal: HL after repeated LLs.
Sell Signal: LH after repeated HHs.
Fully customizable signal appearance: arrow type, circle, label, color, and size.
Adjustable minimum number of repeated highs or lows before a trend change triggers a signal.
Alerts built in for automated notifications when buy/sell signals occur.
Default Settings:
Optimized for a 10-minute chart.
Default “Min repeats before trend change” and pivot left/right bars are set for typical 10-min price swings.
User Customization:
Adjust the “Pivot Left Bars,” “Pivot Right Bars,” and “Min repeats before trend change” to match your trading style, chart timeframe, and volatility.
Enable pivot labels for visual clarity if desired.
Set alerts to receive notifications of trend changes in real time.
How to Use:
Apply the indicator to any chart and timeframe. It works best on swing-trading or trend-following strategies.
Watch for Buy/Sell signals in conjunction with your other analysis, such as volume, support/resistance, or other indicators.
Legal Disclaimer:
This indicator is provided for educational and informational purposes only. It is not financial advice. Trading involves substantial risk, and past performance is not indicative of future results. Users should trade at their own risk and are solely responsible for any gains or losses incurred.
Chart-Only Scanner — Pro Table v2.5.1Chart-Only Scanner — Pro Table v2.5
User Manual (Pine Script v6)
What this tool does (in one line)
A compact, on-chart table that scores the current chart symbol (or an optional override) using momentum, volume, trend, volatility, and pattern checks—so you can quickly decide UP, DOWN, or WAIT.
Quick Start (90 seconds)
Add the indicator to any chart and timeframe (1m…1M).
Leave “Override chart symbol” = OFF to auto-use the chart’s symbol.
Choose your layout:
Row (wide horizontal strip), or Grid (title + labeled cells).
Pick a size preset (Micro, Small, Medium, Large, Mobile).
Optional: turn on “Use Higher TF (EMA 20/50)” and set HTF Multiplier (e.g., 4 ⇒ if chart is 15m, HTF is 60m).
Watch the table:
DIR (↑/↓/→), ROC%, MOM, VOL, EMA stack, HTF, REV, SCORE, ACT.
Add an alert if you want: the script fires when |SCORE| ≥ Action threshold.
What to expect
A small table appears on the chart corner you choose, updating each bar (or only at bar close if you keep default smart-update).
The ACT cell shows 🔥 (strong), 👀 (medium), or ⏳ (weak).
Panels & Settings (every option explained)
Core
Momentum Period: Lookback for rate-of-change (ROC%). Shorter = more reactive; longer = smoother.
ROC% Threshold: Minimum absolute ROC% to call direction UP (↑) or DOWN (↓); otherwise →.
Require Volume Confirmation: If ON and VOL ≤ 1.0, the SCORE is forced to 0 (prevents low-volume false positives).
Override chart symbol + Custom symbol: By default, the indicator uses the chart’s symbol. Turn this ON to lock to a specific ticker (e.g., a perpetual).
Higher TF
Use Higher TF (EMA 20/50): Compares EMA20 vs EMA50 on a higher timeframe.
HTF Multiplier: Higher TF = (chart TF × multiplier).
Example: on 3H chart with multiplier 2 ⇒ HTF = 6H.
Volatility & Oscillators
ATR Length: Used to show ATR% (ATR relative to price).
RSI Length: Standard RSI; colors: green ≤30 (oversold), red ≥70 (overbought).
Stoch %K Length: With %D = SMA(%K, 3).
MACD Fast/Slow/Signal: Standard MACD values; we display Line, Signal, Histogram (L/S/H).
ADX Length (Wilder): Wilder’s smoothing (internal derivation); also shows +DI / −DI if you enable the ADX column.
EMAs / Trend
EMA Fast/Mid/Slow: We compute EMA(20/50/200) by default (editable).
EMA Stack: Bull if Fast > Mid > Slow; Bear if Fast < Mid < Slow; Flat otherwise.
Benchmark (optional, OFF by default)
Show Relative Strength vs Benchmark: Displays RS% = ROC(symbol) − ROC(benchmark) over the Momentum Period.
Benchmark Symbol: Ticker used for comparison (e.g., BTCUSDT as a market proxy).
Columns (show/hide)
Toggle which fields appear in the table. Hiding unused fields keeps the layout clean (especially on mobile).
Display
Layout Mode:
Row = a single two-row strip; each column is a metric.
Grid = a title row plus labeled pairs (label/value) arranged in rows.
Size Preset: Micro, Small, Medium, Large, Mobile change text size and the grid density.
Table Corner: Where the panel sits (e.g., Top Right).
Opaque Table Background: ON = dark card; OFF = transparent(ish).
Update Every Bar: ON = update intra-bar; OFF = smart update (last bar / real-time / confirmed history).
Action threshold (|score|): The cutoff for 🔥 and alert firing (default 70).
How to read each field
CHART: The active symbol name (or your custom override).
DIR: ↑ (ROC% > threshold), ↓ (ROC% < −threshold), → otherwise.
ROC%: Rate of change over Momentum Period.
Formula: (Close − Close ) / Close × 100.
MOM: A scaled momentum score: min(100, |ROC%| × 10).
VOL: Volume ratio vs 20-bar SMA: Volume / SMA(Volume,20).
1.5 highlights as yellow (significant participation).
ATR%: (ATR / Close) × 100 (volatility relative to price).
RSI: Colored for extremes: ≤30 green, ≥70 red.
Stoch K/D: %K and %D numbers.
MACD L/S/H: Line, Signal, Histogram. Histogram color reflects sign (green > 0, red < 0).
ADX, +DI, −DI: Trend strength and directional components (Wilder). ADX ≥ 25 is highlighted.
EMA 20/50/200: Current EMA values (editable lengths).
STACK: Bull/Bear/Flat as defined above.
VWAP%: (Close − VWAP) / Close × 100 (premium/discount to VWAP).
HTF: ▲ if HTF EMA20 > EMA50; ▼ if <; · if flat/off.
RS%: Symbol’s ROC% − Benchmark ROC% (positive = outperforming).
REV (reversal):
🟢 Eng/Pin = bullish engulfing or bullish pin detected,
🔴 Eng/Pin = bearish engulfing or bearish pin,
· = none.
SCORE (absolute shown as a number; sign shown via DIR and ACT):
Components:
base = MOM × 0.4
volBonus = VOL > 1.5 ? 20 : VOL × 13.33
htfBonus = use_mtf ? (HTF == DIR ? 30 : HTF == 0 ? 15 : 0) : 0
trendBonus = (STACK == DIR) ? 10 : 0
macdBonus = 0 (placeholder for future versions)
scoreRaw = base + volBonus + htfBonus + trendBonus + macdBonus
SCORE = DIR ≥ 0 ? scoreRaw : −scoreRaw
If Require Volume Confirmation and VOL ≤ 1.0 ⇒ SCORE = 0.
ACT:
🔥 if |SCORE| ≥ threshold
👀 if 50 < |SCORE| < threshold
⏳ otherwise
Practical examples
Strong long (trend + participation)
DIR = ↑, ROC% = +3.2, MOM ≈ 32, VOL = 1.9, STACK = Bull, HTF = ▲, REV = 🟢
SCORE: base(12.8) + volBonus(20) + htfBonus(30) + trend(10) ≈ 73 → ACT = 🔥
Action idea: look for longs on pullbacks; confirm risk with ATR%.
Weak long (no volume)
DIR = ↑, ROC% = +1.0, but VOL = 0.8 and Require Volume Confirmation = ON
SCORE forced to 0 → ACT = ⏳
Action: wait for volume > 1.0 or turn off confirmation knowingly.
Bearish reversal warning
DIR = →, REV = 🔴 (bearish engulfing), RSI = 68, HTF = ▼
SCORE may be mid-range; ACT = 👀
Action: watch for breakdown and rising VOL.
Alerts (how to use)
The script calls alert() whenever |SCORE| ≥ Action threshold.
To receive pop-ups, sounds, or emails: click “⏰ Alerts” in TradingView, choose this indicator, and pick “Any alert() function call.”
The alert message includes: symbol, |SCORE|, DIR.
Layout, Size, and Corner tips
Row is best when you want a compact status ribbon across the top.
Grid is clearer on big screens or when you enable many columns.
Size:
Mobile = one pair per row (tall, readable)
Micro/Small = dense; good for many fields
Large = presentation/screenshots
Corner: If the table overlaps price, change the corner or set Opaque Background = OFF.
Repaint & timeframe behavior
Default smart update prefers stability (last bar / live / confirmed history).
For a stricter, “close-only” behavior (less repaint): turn Update Every Bar = OFF and avoid Heikin Ashi when you want raw market OHLC (HA modifies price inputs).
HTF logic is derived from a clean, integer multiple of your chart timeframe (via multiplier). It works with 3H/4H and any TF.
Performance notes
The script analyzes one symbol (chart or override) with multiple metrics using efficient tuple requests.
If you later want a multi-symbol grid, do it with pages (10–15 per page + rotate) to stay within platform limits (recommended future add-on).
Troubleshooting
No table visible
Ensure the indicator is added and not hidden.
Try toggling Opaque Background or switch Corner (it might be behind other drawings).
Keep Columns count reasonable for the chosen Size.
If you turned ON Override, verify the Custom symbol exists on your data provider.
Numbers look different on HA candles
Heikin Ashi modifies OHLC; switch to regular candles if you need raw price metrics.
3H/4H issues
Use integer HTF Multiplier (e.g., 2, 4). The tool builds the correct string internally; no manual timeframe strings needed.
Power user tips
Volume gating: keeping Require Volume Confirmation = ON filters most fake moves; if you’re a scalper, reduce strictness or turn it off.
Action threshold: 60–80 is typical. Higher = fewer but stronger signals.
Benchmark RS%: great for spotting leaders/laggards; positive RS% = outperformance vs benchmark.
Change policy & safety
This version doesn’t alter your historical logic you tested (no radical changes).
Any future “radical” change (score weights, HTF logic, UI hiding data) will ship with a toggle and an Impact Statement so you can keep old behavior if you prefer.
Glossary (quick)
ROC%: Percent change over N bars.
MOM: Scaled momentum (0–100).
VOL ratio: Volume vs 20-bar average.
ATR%: ATR as % of price.
ADX/DI: Trend strength / direction components (Wilder).
EMA stack: Relationship between EMAs (bullish/bearish/flat).
VWAP%: Premium/discount to VWAP.
RS%: Relative strength vs benchmark.

RSI - (R.A Trader)Of course. Here is a descriptive text in English for the custom RSI indicator, written for the students of R.A. Trader.
The R.A. Trader Custom RSI Indicator
1. Overview
Welcome, students of R.A. Trader!
This is the official custom Relative Strength Index (RSI) indicator designed specifically to support the analytical methods taught by Rudá Alves. This tool replaces the standard RSI with a specialized configuration, providing a more nuanced view of market momentum that aligns directly with the R.A. Trader strategy.
Its purpose is to help you quickly and accurately identify key zones of strength, weakness, and potential market exhaustion.

Spirit Time SMT 1M DIVDivergences from 90Min-1Min
apparently i have to explain more of what this does.
pretty self explanatory
Hope this enough text

Stop-Loss Sentinel
Cutloss Swing Marker with Adjustable Trend Lines
This indicator identifies swing highs and lows using pivot points.
Swing Highs are marked with a green downward triangle and a "Cutloss" label above the bar.
Swing Lows are marked with a red upward triangle and a "Cutloss" label below the bar.
From each Cutloss point, a horizontal trend line is drawn forward for a set number of bars.
All colors (text, trend lines) and line length are fully adjustable in the settings.
Intended Use:
Helps traders visually mark potential stop-loss or reversal zones and track them over the next few bars. Works on any timeframe, but is designed for fast decision-making on lower timeframes like M1.
Marks key swing highs/lows with ‘Cutloss’ labels and triangles, then extends customizable trend lines for the next bars. Ideal for spotting stop-loss or reversal zones on any timeframe.
VRD-5: Volume Reversal Detector (5 Bars)Overview
This Pine Script indicator detects potential trend reversals based on volume patterns over a 5-bar period. It identifies accumulation (bullish) and distribution (bearish) patterns using volume analysis combined with price action.
Key Features
Volume Analysis:
Compares current volume to a 34-period SMA
Identifies strong/weak volume using configurable thresholds
Calculates volume "energy" as a 5-bar average ratio
Pattern Detection:
Bearish Signal: Looks for decreasing volume after a strong volume bar
Bullish Signal: Looks for increasing volume after weak volume bars
Visualization:
Colored volume histogram (bullish/bearish/neutral)
SMA volume line
Labels for detected signals
Customization Options:
Adjustable lookback period (3-10 bars)
Configurable thresholds for volume strength
Strict mode requiring confirming price action
Suggested Improvements
Performance Optimization:
Reduce the max_labels_count (currently 500) to improve performance
Consider using barstate.isconfirmed for more efficient calculations
Enhanced Visualization:
Add arrows on price chart for better visibility
Include a background color highlight for signal periods
Add option to display the energy level as a separate line
Additional Features:
Incorporate RSI or MACD for confirmation
Add multi-timeframe analysis capability
Include a strategy version for backtesting
Code Structure:
Separate the logic into distinct functions for better readability
Add more detailed comments for complex calculations
Consider using varip for real-time updates if needed
User Experience:
Add input options for label text size/position
Include sound options for alerts
Add a toggle for the information table
This indicator provides a solid foundation for volume-based reversal detection that could be further enhanced with these improvements while maintaining its core functionality.
