taLibrary "ta"
This library is a Pine Script™ programmer’s tool containing calcs for my oscillators and some helper functions.
buoyancy(src, targetPeriod, maxLookback)
Calculates buoyancy using a target of `src` summed over `targetPeriod` bars, not searching back farther than `maxLookback` bars. See:
Parameters:
src : (series float) The source value that is summed to constitute the target.
targetPeriod : (series int) The qty of bars to sum `src` for in order to calculate the target.
maxLookback : (simple int) The maximum number of bars back the function will search.
Returns: (series float) Buoyancy: the gap between the avg distance of past up and dn bars added to reach the target, divided by the max distance reached. Returns zero when an error condition occurs.
efficientWork(length)
Calculates Efficient Work on `length` bars. See:
Parameters:
length : (simple int) The length of the ALMA used to calculate the result.
Returns: (series float) A -1 to +1 value representing the efficiency of price travel, bar to bar.
ma(type, src, length)
Returns the `type` MA of the `src` over the `length`.
Parameters:
type : (simple string) The type of MA required (uses constants that must be defined earlier in the script).
src : (series float) The source value used to calculate the MA.
length : (simple int) The length value used to calculate the MA.
Returns: (series float) The MA value.
divergenceChannel(divergence, hiSrc, loSrc, breachHiSrc, breachLoSrc)
Calculates the levels and states of divergence channels, which are created when divergences occur.
Parameters:
divergence : (series bool) `true` on divergences, which can be defined any way. On breached channels it creates a new channel, otherwise, channel levels are expanded.
hiSrc : (series float) The price source used to set the channel's hi level when a divergence occurs.
loSrc : (series float) The price source used to set the channel's lo level when a divergence occurs.
breachHiSrc : (series float) The price source that must breach over the channel's `channelHi` level for a breach to occur.
breachLoSrc : (series float) The price source that must breach under the channel's `channelLo` level for a breach to occur.
Returns: A tuple containing the following values:
sourceStrToFloat(srcString)
Converts the name of a source in the `srcString` to its numerical equivalent.
Parameters:
srcString : (series string) The string representing the name of the source value to be returned.
Returns: (series float) The source's value.
Search in scripts for "the script"

Strategy█ OVERVIEW
This library is a Pine Script™ programmer’s tool containing a variety of strategy-related functions to assist in calculations like profit and loss, stop losses and limits. It also includes several useful functions one can use to convert between units in ticks, price, currency or a percentage of the position's size.
█ CONCEPTS
The library contains three types of functions:
1 — Functions beginning with `percent` take either a portion of a price, or the current position's entry price and convert it to the value outlined in the function's documentation.
Example: Converting a percent of the current position entry price to ticks, or calculating a percent profit at a given level for the position.
2 — Functions beginning with `tick` convert a tick value to another form.
These are useful for calculating a price or currency value from a specified number of ticks.
3 — Functions containing `Level` are used to calculate a stop or take profit level using an offset in ticks from the current entry price.
These functions can be used to plot stop or take profit levels on the chart, or as arguments to the `limit` and `stop` parameters in strategy.exit() function calls.
Note that these calculated levels flip automatically with the position's bias.
For example, using `ticksToStopLevel()` will calculate a stop level under the entry price for a long position, and above the entry price for a short position.
There are also two functions to assist in calculating a position size using the entry's stop and a fixed risk expressed as a percentage of the current account's equity. By varying the position size this way, you ensure that entries with different stop levels risk the same proportion of equity.
█ NOTES
Example code using some of the library's functions is included at the end of the library. To see it in action, copy the library's code to a new script in the Pine Editor, and “Add to chart”.
For each trade, the code displays:
• The entry level in orange.
• The stop level in fuchsia.
• The take profit level in green.
The stop and take profit levels automatically flip sides based on whether the current position is long or short.
Labels near the last trade's levels display the percentages used to calculate them, which can be changed in the script's inputs.
We plot markers for entries and exits because strategy code in libraries does not display the usual markers for them.
Look first. Then leap.
█ FUNCTIONS
percentToTicks(percent) Converts a percentage of the average entry price to ticks.
Parameters:
percent : (series int/float) The percentage of `strategy.position_avg_price` to convert to ticks. 50 is 50% of the entry price.
Returns: (float) A value in ticks.
percentToPrice(percent) Converts a percentage of the average entry price to a price.
Parameters:
percent : (series int/float) The percentage of `strategy.position_avg_price` to convert to price. 50 is 50% of the entry price.
Returns: (float) A value in the symbol's quote currency (USD for BTCUSD).
percentToCurrency(price, percent) Converts the percentage of a price to money.
Parameters:
price : (series int/float) The symbol's price.
percent : (series int/float) The percentage of `price` to calculate.
Returns: (float) A value in the symbol's currency.
percentProfit(exitPrice) Calculates the profit (as a percentage of the position's `strategy.position_avg_price` entry price) if the trade is closed at `exitPrice`.
Parameters:
exitPrice : (series int/float) The potential price to close the position.
Returns: (float) Percentage profit for the current position if closed at the `exitPrice`.
priceToTicks(price) Converts a price to ticks.
Parameters:
price : (series int/float) Price to convert to ticks.
Returns: (float) A quantity of ticks.
ticksToPrice(price) Converts ticks to a price offset from the average entry price.
Parameters:
price : (series int/float) Ticks to convert to a price.
Returns: (float) A price level that has a distance from the entry price equal to the specified number of ticks.
ticksToCurrency(ticks) Converts ticks to money.
Parameters:
ticks : (series int/float) Number of ticks.
Returns: (float) Money amount in the symbol's currency.
ticksToStopLevel(ticks) Calculates a stop loss level using a distance in ticks from the current `strategy.position_avg_price` entry price. This value can be plotted on the chart, or used as an argument to the `stop` parameter of a `strategy.exit()` call. NOTE: The stop level automatically flips based on whether the position is long or short.
Parameters:
ticks : (series int/float) The distance in ticks from the entry price to the stop loss level.
Returns: (float) A stop loss level for the current position.
ticksToTpLevel(ticks) Calculates a take profit level using a distance in ticks from the current `strategy.position_avg_price` entry price. This value can be plotted on the chart, or used as an argument to the `limit` parameter of a `strategy.exit()` call. NOTE: The take profit level automatically flips based on whether the position is long or short.
Parameters:
ticks : (series int/float) The distance in ticks from the entry price to the take profit level.
Returns: (float) A take profit level for the current position.
calcPositionSizeByStopLossTicks(stopLossTicks, riskPercent) Calculates the position size needed to implement a given stop loss (in ticks) corresponding to `riskPercent` of equity.
Parameters:
stopLossTicks : (series int) The stop loss (in ticks) that will be used to protect the position.
riskPercent : (series int/float) The maximum risk level as a percent of current equity (`strategy.equity`).
Returns: (int) A quantity of contracts.
calcPositionSizeByStopLossPercent(stopLossPercent, riskPercent, entryPrice) Calculates the position size needed to implement a given stop loss (%) corresponding to `riskPercent` of equity.
Parameters:
stopLossPercent : (series int/float) The stop loss in percent that will be used to protect the position.
riskPercent : (series int/float) The maximum risk level as a percent of current equity (`strategy.equity`).
entryPrice : (series int/float) The entry price of the position.
Returns: (int) A quantity of contracts.
exitPercent(id, lossPercent, profitPercent, qty, qtyPercent, comment, when, alertMessage) A wrapper of the `strategy.exit()` built-in which adds the possibility to specify loss & profit in as a value in percent. NOTE: this function may work incorrectly with pyramiding turned on due to the use of `strategy.position_avg_price` in its calculations of stop loss and take profit offsets.
Parameters:
id : (series string) The order identifier of the `strategy.exit()` call.
lossPercent : (series int/float) Stop loss as a percent of the entry price.
profitPercent : (series int/float) Take profit as a percent of the entry price.
qty : (series int/float) Number of contracts/shares/lots/units to exit a trade with. The default value is `na`.
qtyPercent : (series int/float) The percent of the position's size to exit a trade with. If `qty` is `na`, the default value of `qty_percent` is 100.
comment : (series string) Optional. Additional notes on the order.
when : (series bool) Condition of the order. The order is placed if it is true.
alertMessage : (series string) An optional parameter which replaces the {{strategy.order.alert_message}} placeholder when it is used in the "Create Alert" dialog box's "Message" field.

Autotable█ OVERVIEW
The library allows to automatically draw a table based on a string or float matrix (or both) controlling all of the parameters of the table (including merging cells) with parameter matrices (like, e.g. matrix of cell colors).
All things you would normally do with table.new() and table.cell() are now possible using respective parameters of library's main function, autotable() (as explained further below).
Headers can be supplied as arrays.
Merging of the cells is controlled with a special matrix of "L" and "U" values which instruct a cell to merged with the cell to the left or upwards (please see examples in the script and in this description).
█ USAGE EXAMPLES
The simplest and most straightforward:
mxF = matrix.new(3,3, 3.14)
mxF.autotable(bgcolor = color.rgb(249, 209, 29)) // displays float matrix as a table in the top right corner with defalult settings
mxS = matrix.new(3,3,"PI")
// displays string matrix as a table in the top right corner with defalult settings
mxS.autotable(Ypos = "bottom", Xpos = "right", bgcolor = #b4d400)
// displays matrix displaying a string value over a float value in each cell
mxS.autotable(mxF, Ypos = "middle", Xpos = "center", bgcolor = color.gray, text_color = #86f62a)
Draws this:
Tables with headers:
if barstate.islast
mxF = matrix.new(3,3, 3.14)
mxS = matrix.new(3,3,"PI")
arColHeaders = array.from("Col1", "Col2", "Col3")
arRowHeaders = array.from("Row1", "Row2", "Row3")
// float matrix with col headers
mxF.autotable(
bgcolor = #fdfd6b
, arColHeaders = arColHeaders
)
// string matrix with row headers
mxS.autotable(arRowHeaders = arRowHeaders, Ypos = "bottom", Xpos = "right", bgcolor = #b4d400)
// string/float matrix with both row and column headers
mxS.autotable(mxF
, Ypos = "middle", Xpos = "center"
, arRowHeaders = arRowHeaders
, arColHeaders = arColHeaders
, cornerBgClr = #707070, cornerTitle = "Corner\ncell", cornerTxtClr = #ffdc13
, bgcolor = color.gray, text_color = #86f62a
)
Draws this:
█ FUNCTIONS
One main function is autotable() which has only one required argument mxValS, a string matrix.
Please see below the description of all of the function parameters:
The table:
tbl (table) (Optional) If supplied, this table will be deleted.
The data:
mxValS (matrix ) (Required) Cell text values
mxValF (matrix) (Optional) Numerical part of cell text values. Is concatenated to the mxValS values via `string_float_separator` string (default "\n")
Table properties, have same effect as in table.new() :
defaultBgColor (color) (Optional) bgcolor to be used if mxBgColor is not supplied
Ypos (string) (Optional) "top", "bottom" or "center"
Xpos (string) (Optional) "left", "right", or "center"
frame_color (color) (Optional) frame_color like in table.new()
frame_width (int) (Optional) frame_width like in table.new()
border_color (color) (Optional) border_color like in table.new()
border_width (int) (Optional) border_width like in table.new()
force_overlay (simple bool) (Optional) If true draws table on main pane.
Cell parameters, have same effect as in table.cell() ):
mxBgColor (matrix) (Optional) like bgcolor argument in table.cell()
mxTextColor (matrix) (Optional) like text_color argument in table.cell()
mxTt (matrix) (Optional) like tooltip argument in table.cell()
mxWidth (matrix) (Optional) like width argument in table.cell()
mxHeight (matrix) (Optional) like height argument in table.cell()
mxHalign (matrix) (Optional) like text_halign argument in table.cell()
mxValign (matrix) (Optional) like text_valign argument in table.cell()
mxTextSize (matrix) (Optional) like text_size argument in table.cell()
mxFontFamily (matrix) (Optional) like text_font_family argument in table.cell()
Other table properties:
tableWidth (float) (Optional) Overrides table width if cell widths are non zero. E.g. if there are four columns and cell widths are 20 (either as set via cellW or via mxWidth) then if tableWidth is set to e.g. 50 then cell widths will be 50 * (20 / 80), where 80 is 20*4 = total width of all cells. Works simialar for widths set via mxWidth - determines max sum of widths across all cloumns of mxWidth and adjusts cell widths proportionally to it. If cell widths are 0 (i.e. auto-adjust) tableWidth has no effect.
tableHeight (float) (Optional) Overrides table height if cell heights are non zero. E.g. if there are four rows and cell heights are 20 (either as set via cellH or via mxHeight) then if tableHeigh is set to e.g. 50 then cell heights will be 50 * (20 / 80), where 80 is 20*4 = total height of all cells. Works simialar for heights set via mxHeight - determines max sum of heights across all cloumns of mxHeight and adjusts cell heights proportionally to it. If cell heights are 0 (i.e. auto-adjust) tableHeight has no effect.
defaultTxtColor (color) (Optional) text_color to be used if mxTextColor is not supplied
text_size (string) (Optional) text_size to be used if mxTextSize is not supplied
font_family (string) (Optional) cell text_font_family value to be used if a value in mxFontFamily is no supplied
cellW (float) (Optional) cell width to be used if a value in mxWidth is no supplied
cellH (float) (Optional) cell height to be used if a value in mxHeight is no supplied
halign (string) (Optional) cell text_halign value to be used if a value in mxHalign is no supplied
valign (string) (Optional) cell text_valign value to be used if a value in mxValign is no supplied
Headers parameters:
arColTitles (array) (Optional) Array of column titles. If not na a header row is added.
arRowTitles (array) (Optional) Array of row titles. If not na a header column is added.
cornerTitle (string) (Optional) If both row and column titles are supplied allows to set the value of the corner cell.
colTitlesBgColor (color) (Optional) bgcolor for header row
colTitlesTxtColor (color) (Optional) text_color for header row
rowTitlesBgColor (color) (Optional) bgcolor for header column
rowTitlesTxtColor (color) (Optional) text_color for header column
cornerBgClr (color) (Optional) bgcolor for the corner cell
cornerTxtClr (color) (Optional) text_color for the corner cell
Cell merge parameters:
mxMerge (matrix) (Optional) A matrix determining how cells will be merged. "L" - cell merges to the left, "U" - upwards.
mergeAllColTitles (bool) (Optional) Allows to print a table title instead of column headers, merging all header row cells and leaving just the value of the first cell. For more flexible options use matrix arguments leaving header/row arguments na.
mergeAllRowTitles (bool) (Optional) Allows to print one text value merging all header row cells and leaving just the value of the first cell. For more flexible options use matrix arguments leaving header/row arguments na.
Format:
string_float_separator (string) (Optional) A string used to separate string and float parts of cell values (mxValS and mxValF). Default is "\n"
format (string) (Optional) format string like in str.format() used to format numerical values
nz (string) (Optional) Determines how na numerical values are displayed.
The only other available function is autotable(string,... ) with a string parameter instead of string and float matrices which draws a one cell table.
█ SAMPLE USE
E.g., CSVParser library demo uses Autotable's for generating complex tables with merged cells.
█ CREDITS
The library was inspired by @kaigouthro's matrixautotable . A true master. Many thanks to him for his creative, beautiful and very helpful libraries.

ATE_Common_Functions_LibraryLibrary "ATE_Common_Functions_Library"
- ATE_Common_Functions_Library was created to assist in constructing CCOMET Scanners
RCI(_rciLength, _source, _interval)
You will see me using this a lot. DEFINITELY my favorite oscillator to utilize for SO many different things from
timing entries/exits to determining trends.Calculation of this indicator based on Spearmans Correlation.
Parameters:
_rciLength (int) : (int)
Amount of bars back to use in RCI calculations.
_source (float) : (float)
Source to use in RCI calculations (can use ANY source series. Ie, open,close,high,low,etc).
_interval (int) : (int)
Optional (if parameter not included, it defaults to 3). RCI calculation groups bars by this amount and then will.
rank these groups of bars.
Returns: (float)
Returns a single RCI value that will oscillates between -100 and +100.
RCIAVG(_rciSMAlen, _source, _interval, firstLength, lastLength)
20 RCI's are averaged together to get this RCI Avg (Rank Correlation Index Average). Each RCI (of the 20 total RCI)
has a progressively LARGER Lookback Length. Rather than having ALL of the RCI Lengths be individually adjustable (because of too many inputs),
I have made the FIRST Length used (smallest Length value in the set) and the LAST Length used (largest length value in the set) be adjustable
and all other 18 Lengths are equally spread out between the 'firstLength' and the 'lastLength'.
Parameters:
_rciSMAlen (int) : (int)
Unlike the Single RCI Function, this function smooths out the end result using an SMA with a length value that is this parameter.
_source (float) : (float)
Source to use in RCI calculations (can use ANY source series. Ie, open,close,high,low,etc).
_interval (int) : (int)
Optional (if parameter not included, it defaults to 3). Within the RCI calculation, bars next to each other are grouped together
and then these groups are Ranked against each other. This parameter is the number of adjacent bars that are grouped together.
firstLength (int) : (int)
Optional (if parameter is not included when the function is called on in the script, then it defaults to 200).
This parameter is the Lookback Length for the 1st RCI used (so the SMALLEST Length used) in the RCI Avg.
lastLength (int) : (int)
Optional (if parameter is not included when the function is called on in the script, then it defaults to 2500).
This parameter is the Lookback Length for the 20th(the LAST) RCI used (so the LARGEST Length used) in the RCI Avg.
***** BEWARE ***** The 'lastLength' must be less than (or possibly equal to) 5000 because Tradingview has capped it at 5000, causing an error.
***** BEWARE ***** If the script gives a compiler "time out" error then the 'lastLength' must be lowered until it no longer times out when compiling.
Returns: (float)
Returns a single RCI value that is the Avg of many RCI values that will oscillate between -100 and +100.
PercentChange(_startingValue, _endingValue)
This is a quick function to calculate how much % change has occurred between the '_startingValue' and the '_endingValue'
that you input into the function.
Parameters:
_startingValue (float) : (float)
The source value to START the % change calculation from.
_endingValue (float) : (float)
The source value to END the % change caluclation from.
Returns: Returns a single output being the % value between 0-100 (with trailing numbers behind a decimal). If you want only
a certain amount of numbers behind the decimal, this function needs to be put within a formatting function to do so.
Rescale(_source, _oldMin, _oldMax, _newMin, _newMax)
Rescales series with a known '_oldMin' & '_oldMax'. Use this when the scale of the '_source' to
rescale is known (bounded).
Parameters:
_source (float) : (float)
Source to be normalized.
_oldMin (int) : (float)
The known minimum of the '_source'.
_oldMax (int) : (float)
The known maximum of the '_source'.
_newMin (int) : (float)
What you want the NEW minimum of the '_source' to be.
_newMax (int) : (float)
What you want the NEW maximum of the '_source' to be.
Returns: Outputs your previously bounded '_source', but now the value will only move between the '_newMin' and '_newMax'
values you set in the variables.
Normalize_Historical(_source, _minimumLvl, _maximumLvl)
Normalizes '_source' that has a previously unknown min/max(unbounded) determining the max & min of the '_source'
FROM THE ENTIRE CHARTS HISTORY. ]
Parameters:
_source (float) : (float)
Source to be normalized.
_minimumLvl (int) : (float)
The Lower Boundary Level.
_maximumLvl (int) : (float)
The Upper Boundary Level.
Returns: Returns your same '_source', but now the value will MOSTLY stay between the minimum and maximum values you set in the
'_minimumLvl' and '_maximumLvl' variables (ie. if the source you input is an RSI...the output is the same RSI value but
instead of moving between 0-100 it will move between the maxand min you set).
Normailize_Local(_source, _length, _minimumLvl, _maximumLvl)
Normalizes series with previously unknown min/max(unbounded). Much like the Normalize_Historical function above this one,
but rather than using the Highest/Lowest Values within the ENTIRE charts history, this on looks for the Highest/Lowest
values of '_source' within the last ___ bars (set by user as/in the '_length' parameter. ]
Parameters:
_source (float) : (float)
Source to be normalized.
_length (int) : (float)
The amount of bars to look back to determine the highest/lowest '_source' value.
_minimumLvl (int) : (float)
The Lower Boundary Level.
_maximumLvl (int) : (float)
The Upper Boundary Level.
Returns: Returns a single output variable being the previously unbounded '_source' that is now normalized and bound between
the values used for '_minimumLvl'/'_maximumLvl' of the '_source' within the user defined lookback period.
Object: object oriented programming made possible! Hash map's in Pinescript?? Absolutely
This Library is the first step towards bringing a much needed data structure to the Pine Script community.
"Object" allows Pine coders to finally create objects full or unique key:value pairs, which are converted to strings and stored in an array. Data can be stored and accessed using dedicated get and set methods.
The workflow is simple, but has a few nuances:
0. Import this library into your project; you can give it whatever alias you'd like (I'll be using obj)
1. Create your first object using the obj.new() method and assign it a variable or "ID".
2. Use the object's ID as the first argument into the obj.set() method, for the key and value there's one extra step required. They must be added as arguments to the appropriate prop_() method.
Note: While objects in this library technically only store data as strings, any primitive data type can be converted to a string before being stored, meaning that one object can hold data from multiple types at once. There's a trade off though..Pine Script requires that all exported function parameters have pre-defined types, meaning that as convenient as it would be to have a single method for storing and returning data of every type, it's not currently possible. Instead there are functions to add properties for each individual type, which are then converted to strings automatically (the original type is flagged and stored along with the data). Furthermore, since switch/if statements can only return values of the same type, there must also be "get" methods which correspond with each type. Again, a single "get" method which auto-detects the returned value's type was the goal but it's just not currently possible. Instead each get method is only allowed to return a value of its own type. No worries though, all the "get" methods will throw errors if they can't access the data you're trying to access. In that error message, you'll be informed exactly which "get" method you need to use if you ever lose track of what type of data you should be returning.
3. The second argument for obj.set() method is the obj.prop_() method. You just plug in your key as a string and your value and you're done. Easy as that.
Please do not skip this step, properties must be formatted correctly for data to be stored and accessed correctly
4. Obj.get_ (s: string, f: float, b: bool, i: int) methods are even easier, just choose whichever method will return the data type you need, then plug in your ID, and key and that's it. Objects will output data of the same type they were stored as!
There's a short example at the end of the script if you'd like to see more!
prop_string(string: key, string: value)
returns property formatted to string and flagged as string type
prop_float(string: key, float: value)
returns property formatted to string and flagged as float type
prop_bool(string: key, bool: value)
returns property formatted to string and flagged as bool type
prop_int(string: key, int: value)
returns property formatted to string and flagged as int type
Support for lines and shapes coming soon!
new()
returns an empty object
set(string : ID, string: property)
adds new property to object
get_f(string : ID, string: key)
returns float values
get_s(string : ID, string: key)
returns string values
get_b(string : ID, string: key)
returns boolean values
get_i(string : ID, string: key)
returns int values
More methods like Obj.remove(), Obj.size(), Obj.fromString, Obj.fromArray, Obj.toJSON, Obj.keys, & Obj.values coming very soon!!

typeandcastLibrary "typeandcast"
Contains the following methods:
_type() - Returns the type of the variable in the forms "int", "array", "matrix"
_type_item() - Returns the type of the variable or of the element (for array/matrix). (e.g. `arrayFloat._type_item()` returns 'float').
_type_struct() - Returns the type of the structure only (i.e. "array" or "matrix"), for simple types (like e.g. `int`) returns "simple". (e.g. `arrayFloat._type_struct()` returns 'array').
_tona() - Casts na to the type of the parent object. (e.g. for an `int x` calling `x.tona()` returns `int(na)`
(inspired by the works of @kaigouthro and @faiyaz7283)
The _type() / _type_item() / _type_struct() methods are available for the following types:
int
float
bool
string
color
line
label
box
table
linefill
int
float
bool
string
color
line
label
box
table
linefill
matrix
matrix
matrix
matrix
matrix
matrix
matrix
matrix
matrix
matrix
The `tona()' method is available only for the simple types (except `linefill`, coundn't make it work for it)
Please see the descriptions in the script.

taLibrary "ta"
█ OVERVIEW
This library holds technical analysis functions calculating values for which no Pine built-in exists.
Look first. Then leap.
█ FUNCTIONS
cagr(entryTime, entryPrice, exitTime, exitPrice)
It calculates the "Compound Annual Growth Rate" between two points in time. The CAGR is a notional, annualized growth rate that assumes all profits are reinvested. It only takes into account the prices of the two end points — not drawdowns, so it does not calculate risk. It can be used as a yardstick to compare the performance of two instruments. Because it annualizes values, the function requires a minimum of one day between the two end points (annualizing returns over smaller periods of times doesn't produce very meaningful figures).
Parameters:
entryTime : The starting timestamp.
entryPrice : The starting point's price.
exitTime : The ending timestamp.
exitPrice : The ending point's price.
Returns: CAGR in % (50 is 50%). Returns `na` if there is not >=1D between `entryTime` and `exitTime`, or until the two time points have not been reached by the script.
█ v2, Mar. 8, 2022
Added functions `allTimeHigh()` and `allTimeLow()` to find the highest or lowest value of a source from the first historical bar to the current bar. These functions will not look ahead; they will only return new highs/lows on the bar where they occur.
allTimeHigh(src)
Tracks the highest value of `src` from the first historical bar to the current bar.
Parameters:
src : (series int/float) Series to track. Optional. The default is `high`.
Returns: (float) The highest value tracked.
allTimeLow(src)
Tracks the lowest value of `src` from the first historical bar to the current bar.
Parameters:
src : (series int/float) Series to track. Optional. The default is `low`.
Returns: (float) The lowest value tracked.
█ v3, Sept. 27, 2022
This version includes the following new functions:
aroon(length)
Calculates the values of the Aroon indicator.
Parameters:
length (simple int) : (simple int) Number of bars (length).
Returns: ( [float, float ]) A tuple of the Aroon-Up and Aroon-Down values.
coppock(source, longLength, shortLength, smoothLength)
Calculates the value of the Coppock Curve indicator.
Parameters:
source (float) : (series int/float) Series of values to process.
longLength (simple int) : (simple int) Number of bars for the fast ROC value (length).
shortLength (simple int) : (simple int) Number of bars for the slow ROC value (length).
smoothLength (simple int) : (simple int) Number of bars for the weigted moving average value (length).
Returns: (float) The oscillator value.
dema(source, length)
Calculates the value of the Double Exponential Moving Average (DEMA).
Parameters:
source (float) : (series int/float) Series of values to process.
length (simple int) : (simple int) Length for the smoothing parameter calculation.
Returns: (float) The double exponentially weighted moving average of the `source`.
dema2(src, length)
An alternate Double Exponential Moving Average (Dema) function to `dema()`, which allows a "series float" length argument.
Parameters:
src : (series int/float) Series of values to process.
length : (series int/float) Length for the smoothing parameter calculation.
Returns: (float) The double exponentially weighted moving average of the `src`.
dm(length)
Calculates the value of the "Demarker" indicator.
Parameters:
length (simple int) : (simple int) Number of bars (length).
Returns: (float) The oscillator value.
donchian(length)
Calculates the values of a Donchian Channel using `high` and `low` over a given `length`.
Parameters:
length (int) : (series int) Number of bars (length).
Returns: ( [float, float, float ]) A tuple containing the channel high, low, and median, respectively.
ema2(src, length)
An alternate ema function to the `ta.ema()` built-in, which allows a "series float" length argument.
Parameters:
src : (series int/float) Series of values to process.
length : (series int/float) Number of bars (length).
Returns: (float) The exponentially weighted moving average of the `src`.
eom(length, div)
Calculates the value of the Ease of Movement indicator.
Parameters:
length (simple int) : (simple int) Number of bars (length).
div (simple int) : (simple int) Divisor used for normalzing values. Optional. The default is 10000.
Returns: (float) The oscillator value.
frama(source, length)
The Fractal Adaptive Moving Average (FRAMA), developed by John Ehlers, is an adaptive moving average that dynamically adjusts its lookback period based on fractal geometry.
Parameters:
source (float) : (series int/float) Series of values to process.
length (int) : (series int) Number of bars (length).
Returns: (float) The fractal adaptive moving average of the `source`.
ft(source, length)
Calculates the value of the Fisher Transform indicator.
Parameters:
source (float) : (series int/float) Series of values to process.
length (simple int) : (simple int) Number of bars (length).
Returns: (float) The oscillator value.
ht(source)
Calculates the value of the Hilbert Transform indicator.
Parameters:
source (float) : (series int/float) Series of values to process.
Returns: (float) The oscillator value.
ichimoku(conLength, baseLength, senkouLength)
Calculates values of the Ichimoku Cloud indicator, including tenkan, kijun, senkouSpan1, senkouSpan2, and chikou. NOTE: offsets forward or backward can be done using the `offset` argument in `plot()`.
Parameters:
conLength (int) : (series int) Length for the Conversion Line (Tenkan). The default is 9 periods, which returns the mid-point of the 9 period Donchian Channel.
baseLength (int) : (series int) Length for the Base Line (Kijun-sen). The default is 26 periods, which returns the mid-point of the 26 period Donchian Channel.
senkouLength (int) : (series int) Length for the Senkou Span 2 (Leading Span B). The default is 52 periods, which returns the mid-point of the 52 period Donchian Channel.
Returns: ( [float, float, float, float, float ]) A tuple of the Tenkan, Kijun, Senkou Span 1, Senkou Span 2, and Chikou Span values. NOTE: by default, the senkouSpan1 and senkouSpan2 should be plotted 26 periods in the future, and the Chikou Span plotted 26 days in the past.
ift(source)
Calculates the value of the Inverse Fisher Transform indicator.
Parameters:
source (float) : (series int/float) Series of values to process.
Returns: (float) The oscillator value.
kvo(fastLen, slowLen, trigLen)
Calculates the values of the Klinger Volume Oscillator.
Parameters:
fastLen (simple int) : (simple int) Length for the fast moving average smoothing parameter calculation.
slowLen (simple int) : (simple int) Length for the slow moving average smoothing parameter calculation.
trigLen (simple int) : (simple int) Length for the trigger moving average smoothing parameter calculation.
Returns: ( [float, float ]) A tuple of the KVO value, and the trigger value.
pzo(length)
Calculates the value of the Price Zone Oscillator.
Parameters:
length (simple int) : (simple int) Length for the smoothing parameter calculation.
Returns: (float) The oscillator value.
rms(source, length)
Calculates the Root Mean Square of the `source` over the `length`.
Parameters:
source (float) : (series int/float) Series of values to process.
length (int) : (series int) Number of bars (length).
Returns: (float) The RMS value.
rwi(length)
Calculates the values of the Random Walk Index.
Parameters:
length (simple int) : (simple int) Lookback and ATR smoothing parameter length.
Returns: ( [float, float ]) A tuple of the `rwiHigh` and `rwiLow` values.
stc(source, fast, slow, cycle, d1, d2)
Calculates the value of the Schaff Trend Cycle indicator.
Parameters:
source (float) : (series int/float) Series of values to process.
fast (simple int) : (simple int) Length for the MACD fast smoothing parameter calculation.
slow (simple int) : (simple int) Length for the MACD slow smoothing parameter calculation.
cycle (simple int) : (simple int) Number of bars for the Stochastic values (length).
d1 (simple int) : (simple int) Length for the initial %D smoothing parameter calculation.
d2 (simple int) : (simple int) Length for the final %D smoothing parameter calculation.
Returns: (float) The oscillator value.
stochFull(periodK, smoothK, periodD)
Calculates the %K and %D values of the Full Stochastic indicator.
Parameters:
periodK (simple int) : (simple int) Number of bars for Stochastic calculation. (length).
smoothK (simple int) : (simple int) Number of bars for smoothing of the %K value (length).
periodD (simple int) : (simple int) Number of bars for smoothing of the %D value (length).
Returns: ( [float, float ]) A tuple of the slow %K and the %D moving average values.
stochRsi(lengthRsi, periodK, smoothK, periodD, source)
Calculates the %K and %D values of the Stochastic RSI indicator.
Parameters:
lengthRsi (simple int) : (simple int) Length for the RSI smoothing parameter calculation.
periodK (simple int) : (simple int) Number of bars for Stochastic calculation. (length).
smoothK (simple int) : (simple int) Number of bars for smoothing of the %K value (length).
periodD (simple int) : (simple int) Number of bars for smoothing of the %D value (length).
source (float) : (series int/float) Series of values to process. Optional. The default is `close`.
Returns: ( [float, float ]) A tuple of the slow %K and the %D moving average values.
supertrend(factor, atrLength, wicks)
Calculates the values of the SuperTrend indicator with the ability to take candle wicks into account, rather than only the closing price.
Parameters:
factor (float) : (series int/float) Multiplier for the ATR value.
atrLength (simple int) : (simple int) Length for the ATR smoothing parameter calculation.
wicks (simple bool) : (simple bool) Condition to determine whether to take candle wicks into account when reversing trend, or to use the close price. Optional. Default is false.
Returns: ( [float, int ]) A tuple of the superTrend value and trend direction.
szo(source, length)
Calculates the value of the Sentiment Zone Oscillator.
Parameters:
source (float) : (series int/float) Series of values to process.
length (simple int) : (simple int) Length for the smoothing parameter calculation.
Returns: (float) The oscillator value.
t3(source, length, vf)
Calculates the value of the Tilson Moving Average (T3).
Parameters:
source (float) : (series int/float) Series of values to process.
length (simple int) : (simple int) Length for the smoothing parameter calculation.
vf (simple float) : (simple float) Volume factor. Affects the responsiveness.
Returns: (float) The Tilson moving average of the `source`.
t3Alt(source, length, vf)
An alternate Tilson Moving Average (T3) function to `t3()`, which allows a "series float" `length` argument.
Parameters:
source (float) : (series int/float) Series of values to process.
length (float) : (series int/float) Length for the smoothing parameter calculation.
vf (simple float) : (simple float) Volume factor. Affects the responsiveness.
Returns: (float) The Tilson moving average of the `source`.
tema(source, length)
Calculates the value of the Triple Exponential Moving Average (TEMA).
Parameters:
source (float) : (series int/float) Series of values to process.
length (simple int) : (simple int) Length for the smoothing parameter calculation.
Returns: (float) The triple exponentially weighted moving average of the `source`.
tema2(source, length)
An alternate Triple Exponential Moving Average (TEMA) function to `tema()`, which allows a "series float" `length` argument.
Parameters:
source (float) : (series int/float) Series of values to process.
length (float) : (series int/float) Length for the smoothing parameter calculation.
Returns: (float) The triple exponentially weighted moving average of the `source`.
trima(source, length)
Calculates the value of the Triangular Moving Average (TRIMA).
Parameters:
source (float) : (series int/float) Series of values to process.
length (int) : (series int) Number of bars (length).
Returns: (float) The triangular moving average of the `source`.
trima2(src, length)
An alternate Triangular Moving Average (TRIMA) function to `trima()`, which allows a "series int" length argument.
Parameters:
src : (series int/float) Series of values to process.
length : (series int) Number of bars (length).
Returns: (float) The triangular moving average of the `src`.
trix(source, length, signalLength, exponential)
Calculates the values of the TRIX indicator.
Parameters:
source (float) : (series int/float) Series of values to process.
length (simple int) : (simple int) Length for the smoothing parameter calculation.
signalLength (simple int) : (simple int) Length for smoothing the signal line.
exponential (simple bool) : (simple bool) Condition to determine whether exponential or simple smoothing is used. Optional. The default is `true` (exponential smoothing).
Returns: ( [float, float, float ]) A tuple of the TRIX value, the signal value, and the histogram.
uo(fastLen, midLen, slowLen)
Calculates the value of the Ultimate Oscillator.
Parameters:
fastLen (simple int) : (series int) Number of bars for the fast smoothing average (length).
midLen (simple int) : (series int) Number of bars for the middle smoothing average (length).
slowLen (simple int) : (series int) Number of bars for the slow smoothing average (length).
Returns: (float) The oscillator value.
vhf(source, length)
Calculates the value of the Vertical Horizontal Filter.
Parameters:
source (float) : (series int/float) Series of values to process.
length (simple int) : (simple int) Number of bars (length).
Returns: (float) The oscillator value.
vi(length)
Calculates the values of the Vortex Indicator.
Parameters:
length (simple int) : (simple int) Number of bars (length).
Returns: ( [float, float ]) A tuple of the viPlus and viMinus values.
vzo(length)
Calculates the value of the Volume Zone Oscillator.
Parameters:
length (simple int) : (simple int) Length for the smoothing parameter calculation.
Returns: (float) The oscillator value.
williamsFractal(period)
Detects Williams Fractals.
Parameters:
period (int) : (series int) Number of bars (length).
Returns: ( [bool, bool ]) A tuple of an up fractal and down fractal. Variables are true when detected.
wpo(length)
Calculates the value of the Wave Period Oscillator.
Parameters:
length (simple int) : (simple int) Length for the smoothing parameter calculation.
Returns: (float) The oscillator value.
█ v7, Nov. 2, 2023
This version includes the following new and updated functions:
atr2(length)
An alternate ATR function to the `ta.atr()` built-in, which allows a "series float" `length` argument.
Parameters:
length (float) : (series int/float) Length for the smoothing parameter calculation.
Returns: (float) The ATR value.
changePercent(newValue, oldValue)
Calculates the percentage difference between two distinct values.
Parameters:
newValue (float) : (series int/float) The current value.
oldValue (float) : (series int/float) The previous value.
Returns: (float) The percentage change from the `oldValue` to the `newValue`.
donchian(length)
Calculates the values of a Donchian Channel using `high` and `low` over a given `length`.
Parameters:
length (int) : (series int) Number of bars (length).
Returns: ( [float, float, float ]) A tuple containing the channel high, low, and median, respectively.
highestSince(cond, source)
Tracks the highest value of a series since the last occurrence of a condition.
Parameters:
cond (bool) : (series bool) A condition which, when `true`, resets the tracking of the highest `source`.
source (float) : (series int/float) Series of values to process. Optional. The default is `high`.
Returns: (float) The highest `source` value since the last time the `cond` was `true`.
lowestSince(cond, source)
Tracks the lowest value of a series since the last occurrence of a condition.
Parameters:
cond (bool) : (series bool) A condition which, when `true`, resets the tracking of the lowest `source`.
source (float) : (series int/float) Series of values to process. Optional. The default is `low`.
Returns: (float) The lowest `source` value since the last time the `cond` was `true`.
relativeVolume(length, anchorTimeframe, isCumulative, adjustRealtime)
Calculates the volume since the last change in the time value from the `anchorTimeframe`, the historical average volume using bars from past periods that have the same relative time offset as the current bar from the start of its period, and the ratio of these volumes. The volume values are cumulative by default, but can be adjusted to non-accumulated with the `isCumulative` parameter.
Parameters:
length (simple int) : (simple int) The number of periods to use for the historical average calculation.
anchorTimeframe (simple string) : (simple string) The anchor timeframe used in the calculation. Optional. Default is "D".
isCumulative (simple bool) : (simple bool) If `true`, the volume values will be accumulated since the start of the last `anchorTimeframe`. If `false`, values will be used without accumulation. Optional. The default is `true`.
adjustRealtime (simple bool) : (simple bool) If `true`, estimates the cumulative value on unclosed bars based on the data since the last `anchor` condition. Optional. The default is `false`.
Returns: ( [float, float, float ]) A tuple of three float values. The first element is the current volume. The second is the average of volumes at equivalent time offsets from past anchors over the specified number of periods. The third is the ratio of the current volume to the historical average volume.
rma2(source, length)
An alternate RMA function to the `ta.rma()` built-in, which allows a "series float" `length` argument.
Parameters:
source (float) : (series int/float) Series of values to process.
length (float) : (series int/float) Length for the smoothing parameter calculation.
Returns: (float) The rolling moving average of the `source`.
supertrend2(factor, atrLength, wicks)
An alternate SuperTrend function to `supertrend()`, which allows a "series float" `atrLength` argument.
Parameters:
factor (float) : (series int/float) Multiplier for the ATR value.
atrLength (float) : (series int/float) Length for the ATR smoothing parameter calculation.
wicks (simple bool) : (simple bool) Condition to determine whether to take candle wicks into account when reversing trend, or to use the close price. Optional. Default is `false`.
Returns: ( [float, int ]) A tuple of the superTrend value and trend direction.
vStop(source, atrLength, atrFactor)
Calculates an ATR-based stop value that trails behind the `source`. Can serve as a possible stop-loss guide and trend identifier.
Parameters:
source (float) : (series int/float) Series of values that the stop trails behind.
atrLength (simple int) : (simple int) Length for the ATR smoothing parameter calculation.
atrFactor (float) : (series int/float) The multiplier of the ATR value. Affects the maximum distance between the stop and the `source` value. A value of 1 means the maximum distance is 100% of the ATR value. Optional. The default is 1.
Returns: ( [float, bool ]) A tuple of the volatility stop value and the trend direction as a "bool".
vStop2(source, atrLength, atrFactor)
An alternate Volatility Stop function to `vStop()`, which allows a "series float" `atrLength` argument.
Parameters:
source (float) : (series int/float) Series of values that the stop trails behind.
atrLength (float) : (series int/float) Length for the ATR smoothing parameter calculation.
atrFactor (float) : (series int/float) The multiplier of the ATR value. Affects the maximum distance between the stop and the `source` value. A value of 1 means the maximum distance is 100% of the ATR value. Optional. The default is 1.
Returns: ( [float, bool ]) A tuple of the volatility stop value and the trend direction as a "bool".
Removed Functions:
allTimeHigh(src)
Tracks the highest value of `src` from the first historical bar to the current bar.
allTimeLow(src)
Tracks the lowest value of `src` from the first historical bar to the current bar.
trima2(src, length)
An alternate Triangular Moving Average (TRIMA) function to `trima()`, which allows a
"series int" length argument.

swinglibraryLibrary "swinglibrary"
This library is for calculating non-repainting swings for further calculation on them.
These swings can later be drawn, but drawing is not part of this library, only the calculation.
What do I need to use the library?
You better include the following constants into your script using this library:
int SWING_NO_ACTION = 0
int SWING_FLIP = 1
int SWING_FLIP_NEW_SWING = 2
int SWING_FLIP_UPDATED = 3
int RELATION_HIGHER = 1
int RELATION_EQUAL = 0
int RELATION_LOWER = -1
Choosing the function, that fits your needs
This library contains 4 functions for calculating swings, the difference between them are the data you get for every swing point and additional average values for length and duration:
swings()
swingsR()
swingsL()
swingsLDR()
The naming scheme of these functions is the following:
The base version swings() is only for the swings containing the following swingPoint type:
swingPoint
Fields:
x (integer) : bar index
y (float) : price
hilo (integer) 1 -> high, -1 -> low
and the return type:
swingReturn
Fields:
swings (array) : array of the last x swing points
newSwingHigh (integer) : flag to detect changes for swing highs see constants (SWING_NO_ACTION, SWING_FLIP_NEW_SWING, SWING_FLIP_UPDATED)
newSwingLow (integer) : flag to detect changes for swing lows see constants (SWING_NO_ACTION, SWING_FLIP_NEW_SWING, SWING_FLIP_UPDATED)
The R in swingsR() stands for relation where the previously shown types do also contain the relation between the swings of the same swing type (highs and lows respectively).
The same goes for L in swingsL() for length containing the price difference between the current and previous swing point in ticks.
And in the following version swingsLDR() there is also the duration between the current and previous point included.
The parameters for the other functions and type definitions include only the ones, that are needed, the "full" version of the function is described here:
swingsLDR(swingSize, dtbStrength, init, SWING_HISTORY_NUM)
Parameters:
swingSize (int) This parameter defines the size of the swings to look after, meaning higher values will lead to bigger swings
dtbStrength (int) Value between 0 and 100 is a factor (%) to the ATR that is used to calculate equal highs/lows (double tops / bottoms).
Higher values will result in a higher tolerance of price difference between the swings.
init (bool) This value is usually set to false on default.
It has a special use case, where we need to reduce memory usage and calculation time on the script using this library by start calculating at x bars back instead of the beginning of the chart.
In this case, we set init = true on the first bar we start calculating the swings on to perform the correct initialization.
SWING_HISTORY_NUM (int) This is the max number of swings that are stored in the array, so only the last SWING_HISTORY_NUM swings are stored in the array to reduce the memory usage.
New ones remove the oldest ones like in a ring buffer.
This is also influencing the average duration and average swing length.
swingPointLDR
Fields:
x (integer) : bar index
y (float) : price
hilo (integer) : 1 -> high, -1 -> low
length (float) : price difference to the previous swing point in ticks
duration (integer) : duration difference to the previous swing point in number of bars
relation (integer) : see constants RELATION_HIGHER, RELATION_EQUAL, RELATION_LOWER: reelation to the previous swing points of the same type (previous high or previous low respectively)
swingReturnLDR
Fields:
swings (array) : array of the last x swing points
newSwingHigh (integer) : flag to detect changes for swing highs see constants (SWING_NO_ACTION, SWING_FLIP_NEW_SWING, SWING_FLIP_UPDATED)
newSwingLow (integer) : flag to detect changes for swing lows see constants (SWING_NO_ACTION, SWING_FLIP_NEW_SWING, SWING_FLIP_UPDATED)
avSwLength (float) : average swing length for the last x swings (depending on the max number of swings)
avSwingDuration (float) : average swing duration for the last x swings (depending on the max number of swings)
MarketHolidaysLibrary "MarketHolidays"
The MarketHolidays library compiles market holidays (including historical special market closures) into arrays, which can then be utilized in TradingView indicators and strategies to account for non-trading days. The datasets were split into different libraries to overcome compiling limitations, streamline the process of removing specific time frames if not needed, and to enhance code execution speed. The timestamps are generated using a custom Python script that employs the 'pandas_market_calendars' library. To build your own set of arrays, you can find the script and instructions at github.com
getHolidays(_country)
The getHolidays function aggregates holiday data from different time periods to create a single array with market holidays for a specified country.
Parameters:
_country (string) : The country code for which to retrieve market holidays. Accepts syminfo.country or pre-set country code in ISO 3166-1 alpha-2 format.
Returns: An array of timestamps of market holidays \ non-trading days for the given country.

holidays_2020to2025Library "holidays_2020to2025"
This dataset is part of my "MarketHolidays" library. The datasets were split into different libraries to overcome compiling limitations, streamline the process of removing specific time frames if not needed, and to enhance code execution speed. The timestamps are generated using a custom Python script that employs the 'pandas_market_calendars' library. To build your own set of arrays, you can find the script and instructions at github.com
holidays(_country)
Parameters:
_country (string)

holidays_2015to2020Library "holidays_2015to2020"
This dataset is part of my "MarketHolidays" library. The datasets were split into different libraries to overcome compiling limitations, streamline the process of removing specific time frames if not needed, and to enhance code execution speed. The timestamps are generated using a custom Python script that employs the 'pandas_market_calendars' library. To build your own set of arrays, you can find the script and instructions at github.com
holidays(_country)
Parameters:
_country (string)

holidays_2010to2015Library "holidays_2010to2015"
This dataset is part of my "MarketHolidays" library. The datasets were split into different libraries to overcome compiling limitations, streamline the process of removing specific time frames if not needed, and to enhance code execution speed. The timestamps are generated using a custom Python script that employs the 'pandas_market_calendars' library. To build your own set of arrays, you can find the script and instructions at github.com
holidays(_country)
Parameters:
_country (string)

holidays_2005to2010Library "holidays_2005to2010"
This dataset is part of my "MarketHolidays" library. The datasets were split into different libraries to overcome compiling limitations, streamline the process of removing specific time frames if not needed, and to enhance code execution speed. The timestamps are generated using a custom Python script that employs the 'pandas_market_calendars' library. To build your own set of arrays, you can find the script and instructions at github.com
holidays(_country)
Parameters:
_country (string)

holidays_2000to2005Library "holidays_2000to2005"
This dataset is part of my "MarketHolidays" library. The datasets were split into different libraries to overcome compiling limitations, streamline the process of removing specific time frames if not needed, and to enhance code execution speed. The timestamps are generated using a custom Python script that employs the 'pandas_market_calendars' library. To build your own set of arrays, you can find the script and instructions at github.com
holidays(_country)
Parameters:
_country (string)
holidays_1990to2000Library "holidays_1990to2000"
This dataset is part of my "MarketHolidays" library. The datasets were split into different libraries to overcome compiling limitations, streamline the process of removing specific time frames if not needed, and to enhance code execution speed. The timestamps are generated using a custom Python script that employs the 'pandas_market_calendars' library. To build your own set of arrays, you can find the script and instructions at github.com
holidays(_country)
Parameters:
_country (string)

holidays_1980to1990Library "holidays_1980to1990"
This dataset is part of my "MarketHolidays" library. The datasets were split into different libraries to overcome compiling limitations, streamline the process of removing specific time frames if not needed, and to enhance code execution speed. The timestamps are generated using a custom Python script that employs the 'pandas_market_calendars' library. To build your own set of arrays, you can find the script and instructions at github.com
holidays(_country)
Parameters:
_country (string)

holidays_1970to1980Library "holidays_1970to1980"
This dataset is part of my "MarketHolidays" library. The datasets were split into different libraries to overcome compiling limitations, streamline the process of removing specific time frames if not needed, and to enhance code execution speed. The timestamps are generated using a custom Python script that employs the 'pandas_market_calendars' library. To build your own set of arrays, you can find the script and instructions at github.com
holidays(_country)
Parameters:
_country (string)

holidays_1962to1970Library "holidays_1962to1970"
This dataset is part of my "MarketHolidays" library. The datasets were split into different libraries to overcome compiling limitations, streamline the process of removing specific time frames if not needed, and to enhance code execution speed. The timestamps are generated using a custom Python script that employs the 'pandas_market_calendars' library. To build your own set of arrays, you can find the script and instructions at github.com
holidays(_country)
Parameters:
_country (string)

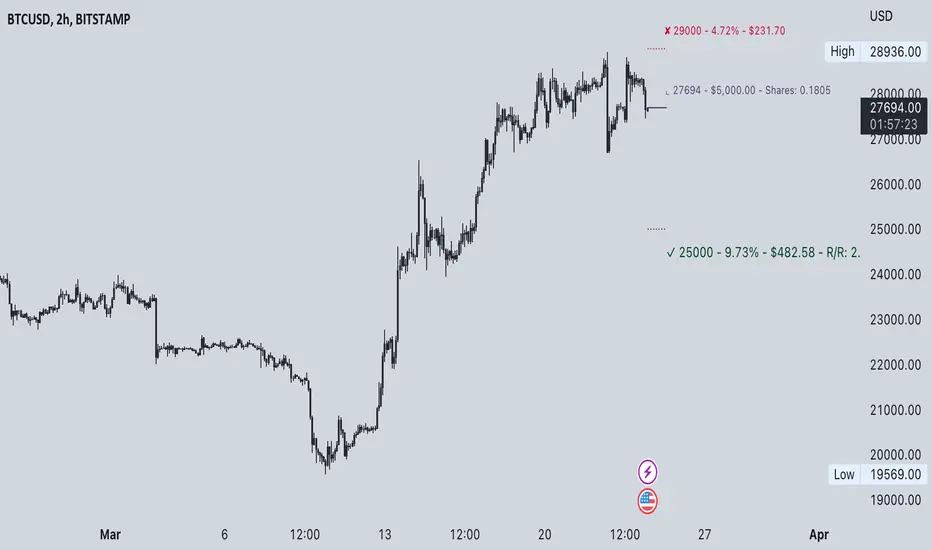
Commission-aware Trade LabelsCommission-aware Trade Labels
Description:
This library provides an easy way to visualize take-profit and stop-loss levels on your chart, taking into account trading commissions. The library calculates and displays the net profit or loss, along with other useful information such as risk/reward ratio, shares, and position size.
Features:
Configurable take-profit and stop-loss prices or percentages.
Set entry amount or shares.
Calculates and displays the risk/reward ratio.
Shows net profit or loss, considering trading commissions.
Customizable label appearance.
Usage:
Add the script to your chart.
Create an Order object for take-profit and stop-loss with desired configurations.
Call target_label() and stop_label() methods for each order object.
Example:
target_order = Order.new(take_profit_price=27483, stop_loss_price=28000, shares=0.2)
stop_order = Order.new(stop_loss_price=29000, shares=1)
target_order.target_label()
stop_order.stop_label()
This script is a powerful tool for visualizing your trading strategy's performance and helps you make better-informed decisions by considering trading commissions in your profit and loss calculations.
Library "tradelabels"
entry_price(this)
Parameters:
this : Order object
@return entry_price
take_profit_price(this)
Parameters:
this : Order object
@return take_profit_price
stop_loss_price(this)
Parameters:
this : Order object
@return stop_loss_price
is_long(this)
Parameters:
this : Order object
@return entry_price
is_short(this)
Parameters:
this : Order object
@return entry_price
percent_to_target(this, target)
Parameters:
this : Order object
target : Target price
@return percent
risk_reward(this)
Parameters:
this : Order object
@return risk_reward_ratio
shares(this)
Parameters:
this : Order object
@return shares
position_size(this)
Parameters:
this : Order object
@return position_size
commission_cost(this, target_price)
Parameters:
this : Order object
@return commission_cost
target_price
net_result(this, target_price)
Parameters:
this : Order object
target_price : The target price to calculate net result for (either take_profit_price or stop_loss_price)
@return net_result
create_take_profit_label(this, prefix, size, offset_x, bg_color, text_color)
Parameters:
this
prefix
size
offset_x
bg_color
text_color
create_stop_loss_label(this, prefix, size, offset_x, bg_color, text_color)
Parameters:
this
prefix
size
offset_x
bg_color
text_color
create_entry_label(this, prefix, size, offset_x, bg_color, text_color)
Parameters:
this
prefix
size
offset_x
bg_color
text_color
create_line(this, target_price, line_color, offset_x, line_style, line_width, draw_entry_line)
Parameters:
this
target_price
line_color
offset_x
line_style
line_width
draw_entry_line
Order
Order
Fields:
entry_price : Entry price
stop_loss_price : Stop loss price
stop_loss_percent : Stop loss percent, default 2%
take_profit_price : Take profit price
take_profit_percent : Take profit percent, default 6%
entry_amount : Entry amount, default 5000$
shares : Shares
commission : Commission, default 0.04%
cacheLibrary "cache"
A simple cache library to store key value pairs.
Fed up of injecting and returning so many values all the time?
Want to separate your code and keep it clean?
Need to make an expensive calculation and use the results in numerous places?
Want to throttle calculations or persist random values across bars or ticks?
Then you've come to the right place. Or not! Up to you, I don't mind either way... ;)
Check the helpers and unit tests in the script for further detail.
Detailed Interface
init(persistant) Initialises the syncronised cache key and value arrays
Parameters:
persistant : bool, toggles data persistance between bars and ticks
Returns: [string , float ], a tuple of both arrays
set(keys, values, key, value) Sets a value into the cache
Parameters:
keys : string , the array of cache keys
values : float , the array of cache values
key : string, the cache key to create or update
value : float, the value to set
has(keys, values, key) Checks if the cache has a key
Parameters:
keys : string , the array of cache keys
values : float , the array of cache values
key : string, the cache key to check
Returns: bool, true only if the key is found
get(keys, values, key) Gets a keys value from the cache
Parameters:
keys : string , the array of cache keys
values : float , the array of cache values
key : string, the cache key to get
Returns: float, the stored value
remove(keys, values, key) Removes a key and value from the cache
Parameters:
keys : string , the array of cache keys
values : float , the array of cache values
key : string, the cache key to remove
count() Counts how many key value pairs in the cache
Returns: int, the total number of pairs
loop(keys, values) Returns true for each value in the cache (use as the while loop expression)
Parameters:
keys : string , the array of cache keys
values : float , the array of cache values
next(keys, values) Returns each key value pair on successive calls (use in the while loop)
Parameters:
keys : string , the array of cache keys
values : float , the array of cache values
Returns: , tuple of each key value pair
clear(keys, values) Clears all key value pairs from the cache
Parameters:
keys : string , the array of cache keys
values : float , the array of cache values
unittest_cache(case) Cache module unit tests, for inclusion in parent script test suite. Usage: log.unittest_cache(__ASSERTS)
Parameters:
case : string , the current test case and array of previous unit tests (__ASSERTS)
unittest(verbose) Run the cache module unit tests as a stand alone. Usage: cache.unittest()
Parameters:
verbose : bool, optionally disable the full report to only display failures

SignificantFiguresLibrary "SignificantFigures"
sigFig(float _float, int _figures)
@description Takes a floating-point number - one that can, but doesn't have to, include a decimal point - and converts it to a floating-point number with only a certain number of digits left. For example, say you want to display a variable from your script to the user and it comes out to something like 45.366666666666666666666667 or whatever. That looks awful when you, for example, print it in a label. Now you could round it up to the nearest integer easily using a built-in function, or even to a certain number of decimal places using a reasonably simple custom function. But that's a bit arbitrary. Suppose you don't know what asset the script will be used on, and so you can't predict what the price is, and what the value will turn out to be. It could be 0.00045366666666666666666666667 instead. Now if you round it up to 3 decimal places it comes out as 0.000, which is useless. My function will round that number to 0.0004536 instead, if told to do it to 4 significant digits.
I think this is more friendly.
@function Converts float with arbitrary number of digits to one with a specified number of significant figures.
@param float _float is the floating-point number to manipulate.
@param int _figures is the number of significant figures you want.
@returns Returns a float with the specified number of significant figures

AssetCorrelationLibraryLibrary "AssetCorrelationLibrary™"
detectIndicesFutures(ticker)
Detects Index Futures (NQ/ES/YM/RTY + micro variants)
Parameters:
ticker (string) : The ticker string to check (typically syminfo.ticker)
Returns: AssetPairing with secondary and tertiary assets configured
detectMetalsFutures(ticker)
Detects Metal Futures (GC/SI/HG + micro variants)
Parameters:
ticker (string) : The ticker string to check
Returns: AssetPairing with secondary and tertiary assets configured
detectForexFutures(ticker)
Detects Forex Futures (6E/6B + micro variants)
Parameters:
ticker (string) : The ticker string to check
Returns: AssetPairing with secondary and tertiary assets configured
detectEnergyFutures(ticker)
Detects Energy Futures (CL/RB/HO + micro variants)
Parameters:
ticker (string) : The ticker string to check
Returns: AssetPairing with secondary and tertiary assets configured
detectTreasuryFutures(ticker)
Detects Treasury Futures (ZB/ZF/ZN)
Parameters:
ticker (string) : The ticker string to check
Returns: AssetPairing with secondary and tertiary assets configured
detectForexCFD(ticker, tickerId)
Detects Forex CFD pairs (EUR/GBP/DXY, USD/JPY/CHF triads)
Parameters:
ticker (string) : The ticker string to check
tickerId (string) : The full ticker ID (syminfo.tickerid) for primary asset
Returns: AssetPairing with secondary and tertiary assets configured
detectCrypto(ticker, tickerId)
Detects major Crypto assets (BTC, ETH, SOL, XRP, alts)
Parameters:
ticker (string) : The ticker string to check
tickerId (string) : The full ticker ID for primary asset
Returns: AssetPairing with secondary and tertiary assets configured
detectMetalsCFD(ticker, tickerId)
Detects Metals CFD (XAU/XAG/Copper)
Parameters:
ticker (string) : The ticker string to check
tickerId (string) : The full ticker ID for primary asset
Returns: AssetPairing with secondary and tertiary assets configured
detectIndicesCFD(ticker, tickerId)
Detects Indices CFD (NAS100/SP500/DJ30)
Parameters:
ticker (string) : The ticker string to check
tickerId (string) : The full ticker ID for primary asset
Returns: AssetPairing with secondary and tertiary assets configured
detectEUStocks(ticker, tickerId)
Detects EU Stock Indices (GER40/EU50) - Dyad only
Parameters:
ticker (string) : The ticker string to check
tickerId (string) : The full ticker ID for primary asset
Returns: AssetPairing with secondary asset configured (tertiary empty for dyad)
getDefaultFallback(tickerId)
Returns default fallback assets (chart ticker only, no correlation)
Parameters:
tickerId (string) : The full ticker ID for primary asset
Returns: AssetPairing with chart ticker as primary, empty secondary/tertiary (no correlation)
applySessionModifierWithBackadjust(tickerStr, sessionType)
Applies futures session modifier to ticker WITH back adjustment
Parameters:
tickerStr (string) : The ticker to modify
sessionType (string) : The session type (syminfo.session)
Returns: Modified ticker string with session and backadjustment.on applied
applySessionModifierNoBackadjust(tickerStr, sessionType)
Applies futures session modifier to ticker WITHOUT back adjustment
Parameters:
tickerStr (string) : The ticker to modify
sessionType (string) : The session type (syminfo.session)
Returns: Modified ticker string with session and backadjustment.off applied
isTriadMode(pairing)
Checks if a pairing represents a valid triad (3 assets)
Parameters:
pairing (AssetPairing) : The AssetPairing to check
Returns: True if tertiary is non-empty (triad mode), false for dyad
getAssetTicker(tickerId)
Extracts clean ticker string from full ticker ID
Parameters:
tickerId (string) : The full ticker ID (e.g., "BITGET:BTCUSDT.P")
Returns: Clean ticker string (e.g., "BTCUSDT.P")
resolveTriad(chartTickerId, pairing)
Resolves triad asset assignments with proper inversion flags
Parameters:
chartTickerId (string) : The current chart's ticker ID (syminfo.tickerid)
pairing (AssetPairing) : The detected AssetPairing
Returns: Tuple
resolveDyad(chartTickerId, pairing)
Resolves dyad asset assignment with proper inversion flag
Parameters:
chartTickerId (string) : The current chart's ticker ID
pairing (AssetPairing) : The detected AssetPairing (dyad: tertiary is empty)
Returns: Tuple
resolveAssets(ticker, tickerId, assetType, sessionType, useBackadjust)
Main auto-detection entry point. Detects asset category and returns fully resolved config.
Parameters:
ticker (string) : The ticker string to check (typically syminfo.ticker)
tickerId (string) : The full ticker ID (typically syminfo.tickerid)
assetType (string) : The asset type (typically syminfo.type)
sessionType (string) : The session type for futures (typically syminfo.session)
useBackadjust (bool) : Whether to apply back adjustment for futures session alignment
Returns: AssetConfig with fully resolved assets, inversion flags, and detection status
resolveCurrentChart()
Simplified auto-detection using current chart's syminfo values
Returns: AssetConfig with fully resolved assets, inversion flags, and detection status
AssetPairing
Core asset pairing structure for triad/dyad configurations
Fields:
primary (series string) : The primary (chart) asset ticker ID
secondary (series string) : The secondary correlated asset ticker ID
tertiary (series string) : The tertiary correlated asset ticker ID (empty for dyad)
invertSecondary (series bool) : Whether secondary asset should be inverted for divergence calc
invertTertiary (series bool) : Whether tertiary asset should be inverted for divergence calc
AssetConfig
Full asset resolution result with mode detection and computed values
Fields:
detected (series bool) : Whether auto-detection succeeded
isTriadMode (series bool) : True if triad (3 assets), false if dyad (2 assets)
primary (series string) : The resolved primary asset ticker ID
secondary (series string) : The resolved secondary asset ticker ID
tertiary (series string) : The resolved tertiary asset ticker ID (empty for dyad)
invertSecondary (series bool) : Computed inversion flag for secondary asset
invertTertiary (series bool) : Computed inversion flag for tertiary asset
assetCategory (series string) : String describing the detected asset category
Note to potential users.
I did not really intend to make this public but i have to in order to avoid any potential compliance issues with the TradingView Moderation Team and the House Rules.
However if you are to use this library, you cannot make your code closed source / invite only as it is intellectual property. The only exception to this is if I am credited in the header of your code and i explicitly give permission to do so.
As per the TradingView house rules, you are completely FREE to do with this as you like, provided the script stays private.
Use the @fstarcapital tag to give credits
❤️ from cephxs

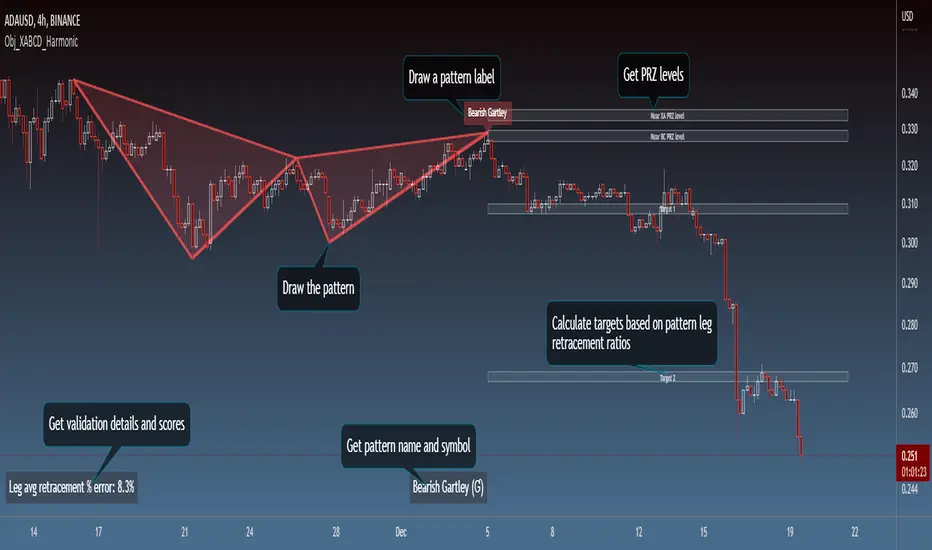
Obj_XABCD_HarmonicLibrary "Obj_XABCD_Harmonic"
Harmonic XABCD Pattern object and associated methods. Easily validate, draw, and get information about harmonic patterns. See example code at the end of the script for details.
init_params(pct_error, pct_asym, types, w_e, w_p, w_d)
Create a harmonic parameters object (used by xabcd_harmonic object for pattern validation and scoring).
Parameters:
pct_error : Allowed % error of leg retracement ratio versus the defined harmonic ratio
pct_asym : Allowed leg length/period asymmetry % (a leg is considered invalid if it is this % longer or shorter than the average length of the other legs)
types : Array of pattern types to validate (1=Gartley, 2=Bat, 3=Butterfly, 4=Crab, 5=Shark, 6=Cypher)
w_e : Weight of ratio % error (used in score calculation, dft = 1)
w_p : Weight of PRZ confluence (used in score calculation, dft = 1)
w_d : Weight of Point D / PRZ confluence (used in score calculation, dft = 1)
Returns: harmonic_params object instance. It is recommended to store and reuse this object for multiple xabcd_harmonic objects rather than creating new params objects unnecessarily.
init(xX, xY, aX, aY, bX, bY, cX, cY, dX, dY, params, tp, p)
Initialize an xabcd_harmonic object instance.
If the pattern is valid, an xabcd_harmonic object instance is returned. If you want to specify your
own validation and scoring parameters, you can do so by passing a harmonic_params object (params).
Or, if you prefer to do your own validation, you can explicitly pass the harmonic pattern type (tp)
and validation will be skipped. You can also pass in an existing xabcd_harmonic instance if you wish
to re-initialize it (e.g. for re-validation and/or re-scoring).
Parameters:
xX : Point X bar index
xY : Point X price/level
aX : Point A bar index
aY : Point A price/level
bX : Point B bar index
bY : Point B price/level
cX : Point C bar index
cY : Point C price/level
dX : Point D bar index
dY : Point D price/level
params : harmonic_params used to validate and score the pattern. Validation will be skipped if a type (tp) is explicitly passed in.
tp : Pattern type
p : xabcd_harmonic object instance to initialize (optional, for re-validation/re-scoring)
Returns: xabcd_harmonic object instance if a valid harmonic, else na
get_name(p)
Get the pattern name
Parameters:
p : Instance of xabcd_harmonic object
Returns: Pattern name (string)
get_symbol(p)
Get the pattern symbol
Parameters:
p : Instance of xabcd_harmonic object
Returns: Pattern symbol (1 byte string)
get_pid(p)
Get the Pattern ID. Patterns of the same type with the same coordinates will have the same Pattern ID.
Parameters:
p : Instance of xabcd_harmonic object
Returns: Pattern ID (string)
set_target(p, target, target_lvl, calc_target)
Set value for a target. Use the calc_target parameter to automatically calculate the target for a specific harmonic ratio.
Parameters:
p : Instance of xabcd_harmonic object
target : Target (1 or 2)
target_lvl : Target price/level (required if calc_target is not specified)
calc_target : Target to auto calculate (required if target is not specified)
Options:
Returns: Target price/level (float)
erase_pattern(p)
Erase the pattern
Parameters:
p : Instance of xabcd_harmonic object
Returns: p
draw_pattern(p)
Draw the pattern
Parameters:
p : Instance of xabcd_harmonic object
Returns: Pattern lines
erase_label(p)
Erase the pattern label
Parameters:
p : Instance of xabcd_harmonic object
Returns: p
draw_label(p, txt, tooltip, clr, txt_clr)
Draw the pattern label. Default text is the pattern name.
Parameters:
p : Instance of xabcd_harmonic object
txt : Label text
tooltip : Tooltip text
clr : Label color
txt_clr : Text color
Returns: Label
harmonic_params
Validation and scoring parameters for a Harmonic Pattern object (xabcd_harmonic)
Fields:
pct_error : Allowed % error of leg retracement ratio versus the defined harmonic ratio
pct_asym
types
w_e
w_p
w_d
xabcd_harmonic
Harmonic Pattern object
Fields:
bull : Bullish pattern flag
tp
xX
xY
aX
aY
bX
bY
cX
cY
dX
dY
r_xb
re_xb
r_ac
re_ac
r_bd
re_bd
r_xd
re_xd
score
score_eAvg
score_prz
score_eD
prz_bN
prz_bF
prz_xN
prz_xF
t1Hit : Target 1 flag
t1
t2Hit
t2
sHit : Stop flag
stop : Stop level
entry : Entry level
eHit
eX
eY
pLines
pLabel
pid
params