Simple Grid Lines VisualizerAbout Grid Bots
A grid bot is a type of trading bot or algorithm that is designed to automatically execute trades within a predefined price range or grid. It is commonly used in markets that exhibit ranging or sideways movement, where prices tend to fluctuate within a specific range without a clear trend.
The grid bot strategy involves placing a series of buy and sell orders at regular intervals within the predefined price range or grid. The bot essentially creates a grid of orders, hence the name. When the price reaches one of these levels, the bot will execute the corresponding trade. For example, if the price reaches a predefined lower level, the bot will buy, and if it reaches a predefined upper level, it will sell.
The purpose of the grid bot strategy is to take advantage of the price oscillations within the range. As the price moves up and down, the bot aims to generate profits by buying at the lower end of the range and selling at the higher end. By repeatedly buying and selling at these predetermined levels, the bot attempts to capture gains from the price fluctuations.
About this Script
Simple Grid Lines Visualizer is designed to assist traders in visualizing and implementing automated price grids on their charts. With just a few inputs, this script generates gridlines based on your specified top price, bottom price, and the number of grids or profit per grid.
How it Works:
Specify Top and Bottom Prices: Start by setting the top and bottom prices that define the range within which the gridlines will be generated. These prices can be based on support and resistance levels, historical data, or any other factors you consider relevant to your analysis.
Determine Grid Parameters: Choose either the number of grids or profit per grid, depending on your preference and trading strategy. If you select the number of grids, the script will evenly distribute the gridlines within the specified price range. Alternatively, if you opt for profit per grid, the script will calculate the price increment required to achieve your desired profit level per grid.
Note that when choosing Profit per Grid , an approximation usually is performed, as all grid lines must be evenly distributed. To achieve that, the script computes the grid distance using the mean price between top and bottom, then computes how many of those complete distances may enter the entire range, and lastly, creates a grid with evenly distributed distances as close as possible to the previously computed.
Customize Styling and Display: Adjust the line color, line style, transparency, and other visual aspects to ensure clear visibility on your charts.
Analyze and Trade: Once the gridlines are plotted on your chart, carefully observe how the market interacts with them. The gridlines can act as reference points for potential support and resistance levels, as well as simple buy/sell orders for a trading bot.
Try to find gridlines that intersect prices as frequently as possible from one to another.
A grid with too many lines will make lots of potential trades, but the amount traded will be minimal (as the total amount invested is divided over the number of grids).
A grid with too few lines will make lots of profits with each trade, but the trades will be less likely to occur (depending on the top/bottom distance).
This tool aims to help visually which grid parameters seem to optimize this problem.
Future versions may include automatic profit computation.
Search in scripts for "top"

AntaresLibrary "Antares"
this library contains some utility functions that I use in my open source scripts including moving average helpers, candlstick helpers, money management, formatters, convertors, webhook integration, analysis, filters and drawing helpers
ma(type, length, source)
Wraps all ma functions
Parameters:
type : Either SMA or EMA or RMA or WMA or VWMA
length : Number of bars (length).
source : Series of values to process.
Returns: Moving average of `source` for `length` bars back by the of MA.
bb(ma, length, mult, source)
Overwrites `ta.bb` duo to limitations of simple int.float mult. Bollinger Bands. A Bollinger Band is a technical analysis tool defined by a set of lines plotted two standard deviations (positively and negatively) away from a simple moving average (SMA) of the security's price, but can be adjusted to user preferences.
Parameters:
ma : Either SMA or EMA or RMA or WMA or VWMA
length : Number of bars (length).
mult : Standard deviation factor.
source : Series of values to process.
Returns: Bollinger Bands.
atr(length, h, l, c)
Overwrites `ta.atr` duo to limitations of simple int length. Function atr (average true range) returns the RMA of true range. True range is max(high - low, abs(high - close ), abs(low - close )).
Parameters:
length : Number of bars (length).
h : High price high price.
l : low price.
c : Close price close price.
Returns: Average true range.
rsi(length, source)
Overwrites `ta.rsi` duo to limitations of simple int length. Relative strength index. It is calculated using the `ta.rma()` of upward and downward changes of `source` over the last `length` bars.
Parameters:
length : Number of bars (length).
source : Series of values to process.
Returns: Relative strength index.
lowest(length, source, start)
Lowest value for a given number of bars back.
Parameters:
length : Number of bars (length).
source : Series of values to process.
start : Series number of bars that should be skipped before process.
Returns: Lowest value in the series.
highest(length, source, start)
Highest value for a given number of bars back.
Parameters:
length : Number of bars (length).
source : Series of values to process.
start : Series number of bars that should be skipped before process.
Returns: Highest value in the series.
atr_multiplier(rsi, atr_max_multiplier)
Dynamic atr multiplier calculated by RSI.
Parameters:
rsi : Relative strength index.
atr_max_multiplier : The maximum multiplier of atr
Returns: Dynamic multiplier of ATR
offset(atr, atr_multiplier)
Safe dynamic offset you need to use in your stoploss, stop buy/sell, etc.
Parameters:
atr : Average true range.
atr_multiplier : ATR multiplier got from `atr_multiplier(rsi, atr_max_multiplier)`
Returns: Dynamic offset
rsi_emotional(rsi, bottom, top)
Tells you if RSI is in emotional zone.
Parameters:
rsi : Relative Strength Index
bottom : The zone that below it market reacts emotionally
top : The zone that above it market reacts emotionally
Returns: false if RSI was between `bottom` and `top` otherwise true
rsi_signal(rsi, bottom, top)
Tells you if RSI is in good point to check your other strategy conditions.
Parameters:
rsi : Relative Strength Index
bottom : The zone that below it market reacts emotionally
top : The zone that above it market reacts emotionally
Returns: 1 if RSI crossed out 30, 50 or 70. -1 if RSI crossed under 70, 50, 30. otherwise is 0
Price Correction to fix data manipulation and mispricingPrice Correction corrects for index and security mispricing to the extent possible in TradingView on both daily and intraday charts. Price correction addresses mispricing issues for specific securities with known issues, or the user can build daily candles from intraday data instead of relying on exchange reported daily OHLC prices, which can include both legitimate special auction and off-exchange trades or illegitimate mispricing. The user can also detect daily OHLC prices that don’t reflect the intraday price action within a specified percent deviation. Price Correction functions as normal candles or bars for any time frame when correction is not needed.
On the 4th of October 2022, the AMEX exchange, owned by the New York Stock Exchange, decided to misprice the daily OHLC data for the SPY, the world’s largest ETF fund. The exchange eliminated the overnight gap that should have occurred in the daily chart that represents regular trading hours by showing a wick connecting near the close of the previous day. Neither the SPX, the SP500 cash index that the SPY ETF tracks, nor other SPX ETFs such as VOO or IVV show such a wick because significant price action at that level never occurred. The intraday SPY chart never shows the price drop below 372.31 that day, but there is a wick that extends to 366.57. On the 6th of October, they continued this practice of using a wick that connects with the close of the previous day to eliminate gaps in daily price action. The objective of this indicator is to fix such inconsistent mispricing practices in the SPY, NYA, and other indices or securities.
Price Correction corrects for the daily mispricing in the SPY to agree with the price action that actually occurred in the SPX index it tracks, as well as the other SPX ETFs, by using intraday data. The chart below compares the Price Correction of the SPY (top) to the SPX (middle) and the original mispriced SPY (bottom) with incorrect wicks. Price correction (top) removes those incorrect wicks (bottom) to match the SPX (middle).
The daily mispricing of the SPY follows after the successful deployment of the NYSE Composite Index mispricing, NYA, an index that represents all common stocks within the New York Stock Exchange, the largest exchange in the world. The importance of the NYA should not be understated. It is the price counterpart to NYSE’s market internals or statistics. Beginning in 2021, the New York Stock Exchange eliminated gaps in daily OHLC data for the NYA by using the close of the previous day as the open for the following day, in violation of their own NYSE Index Series Methodology. The Methodology states for the opening price that “The first index level is calculated and published around 09:30 ET, when the U.S. equity markets open for their regular trading session. The calculation of that level utilizes the most updated prices available at that moment.” You can verify for yourself that this is simply not the case. The first update of the NYA price for each day matches the close of the previous day, not the “most updated prices available at that moment”, causing data providers to often represent the first intraday bar with a huge sudden price change when an overnight price change occurred instead. For example, on 13 Jun 2022, TradingView shows a one-minute bar drop 2.3%. With a market capitalization of roughly 23 trillion dollars, the NYSE composite capitalization did not suddenly drop a half-trillion dollars in just one minute as the intraday chart data would have you believe. All major US indices, index ETFs, and even foreign indices like the Toronto TAX, the Australian ASXAL, the Bombay SENSEX, and German DAX had down gaps that day, except for the mispriced NYSE index. Price Correction corrects for this mispricing in daily OHLC data, as shown in the main chart at the top of this page comparing the original NYA (top) to the Price Corrected NYA (bottom).
Price Correction also corrects for the intraday mispricing in the NYA. The chart below shows how the Price Correction (top) replaces the incorrect first one-minute candles with gaps (bottom) from 22 Sep 2022 to 29 Sep 2022. TradingView is inconsistent in how intraday data is reported for overnight gaps by sometimes connecting the first intraday bar of the day to the close of the previous day, and other times not. This inconsistency may be due to manually changing the intraday data based on user support tickets. For example, after reporting the lack of a major gap in the NYA daily OHLC prices that existed intraday for 13 Jun 2022, TradingView opted to remove the true gap in intraday prices by creating a 2.3% half-a-trillion-dollar one-minute bar that connected the close of the previous day to show a sudden drop in price that didn’t occur, instead of adding the gap in the daily OHLC data that actually took place from overnight price action.
Price Correction allows users to detect daily OHLC data that does not reflect the intraday price action within a certain percent difference by changing the color of those candles or bars that deviate. The chart below clearly shows the start of the NYSE disinformation campaign for NYA that started in 2021 by painting blue those candles with daily OHLC values that deviated from the intraday values by 0.1%. Before 2021, the number of deviating candles is relatively sparse, but beginning in 2021, the chart is littered with deviating candles.
If there are other index or security mispricing or data issues you are aware of that can be incorporated into Price Correction, please let me know. Accurate financial data is indispensable in making accurate financial decisions. Assert your right to accurate financial data by reporting incorrect data and mispricing issues.
How to use the Price Correction
Simply add this “indicator” to your chart and remove the mispriced default candles or bars by right clicking on the chart, selecting Settings, and de-selecting Body, Wick, and Border under the Symbol tab. The Presets settings automatically takes care of mispricing in the NYA and SPY to the extent possible in TradingView. The user can also build their own daily candles based off of intraday data to address other securities that may have mispricing issues.

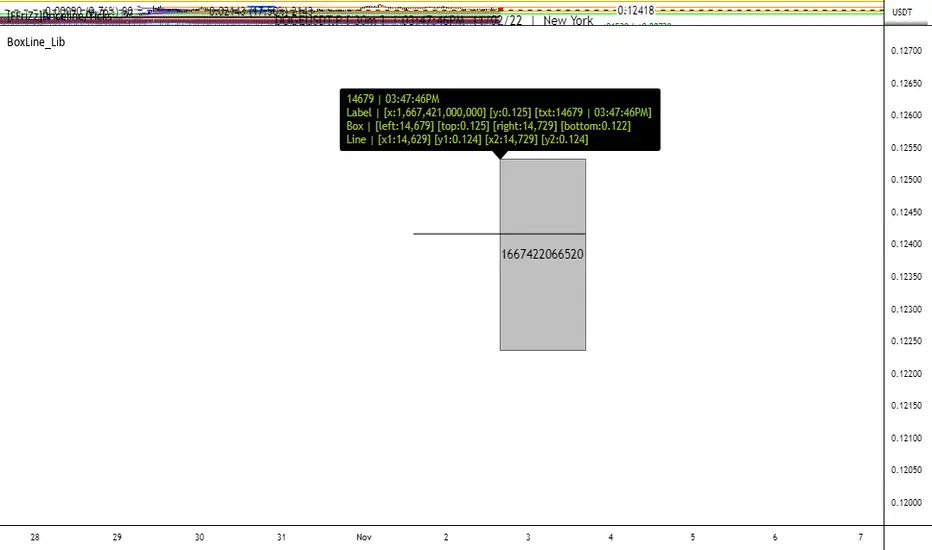
BoxLine_LibLibrary "BoxLine_Lib"
personal Library for line and box built in functions
lineXY(x)
get x1,y1,x2,y2 in a tuple
Parameters:
x : TODO: line
Returns: tuple of x1,y1,x2,y2
line(x)
Create line with only the y1 value(when line == na) or all
when line != na set x1,y1,x2,y2 individually just 1 or all
- use just the line value to set the x2 to current bar or time will set to time
- will auto pick xloc.bar_index or xloc.bar_time if not used
Parameters:
x : (line line,int x1,float y1,int x2,float y2,
string xloc,string extend,color color,string style,int width)
Returns: Line
boxXY(x)
get left,top,right,bottom in a tuple
Parameters:
x : box
Returns: tuple of left,top,right,bottom
box(x)
Create line with only the top,bottom value(when line == na) or all
when box != na set left,top,right,bottom individually just 1 or all
- use just the box value to set the right to current bar or time will set to time
- if right is above a number that a bar_index wouldnt be
Parameters:
x : box box,int left,float top,int right,
float bottom,color border_color, int border_width,
string border_style,string extend,string xloc,
color bgcolor,string text,string text_size, color text_color,
string text_halign,string text_valign,string text_wrap)
Returns: TODO: Box
McDonald's Pattern [LuxAlgo]Tradingview asked, we delivered. This script fits a cubic Bezier curve using tops/bottoms in order to approximate a McDonalds pattern, a popular meme pattern in the crypto trading community.
Traditionally the McDonalds pattern is described by an M pattern with deep retracement (> 50%), forming a McDonalds logo.
Please note that this indicator is a meme & should not be taken seriously. Some aspects of this indicator are not real-time and meant for descriptive analysis alongside other components of this script, in this case, for entertainment purposes. We suggest looking through our other open-source scripts if you’re looking for more serious tools.
🔶 USAGE
The script fits Bezier curves using specific tops/bottoms as control points. When the distance between tops and bottoms values is relatively small, the user can more easily identify the pattern.
A score is shown on the top right of the chart, aiming to return how close the returned pattern is to the original logo.
A regular Mcdonalds pattern would return a red background, while an inverted pattern would return a green one.
🔶 SETTINGS
Length: Sensitivity of tops/bottoms detection. The method does not make use of pivot points, using rolling maximums/minimums instead.
Use First Bar As Vertex: Use the price and bar index of the last bar as vertex.

Nearest Percentile Moving Average BandsWhile coding some filters into another indicator for Long/Short I noticed that ta.nearest.percentile might be the most useful tool in pinescript I've ever encountered.
While percentile_nearest can be used for all kind of things I decided to code moving averages from it and made bands for bottom percentage and top percentage.
The indicator will calculate the top % price of the given bar length.
Example settings:
length: 150
percentile: 99
So when using 99% it will draw a green line when price is moving above the top 1% price of the last 150 candles. It then calculates if the price is below the bottom 1% of the last 150 candles.
Trading use:
Use this indicator to check if the market is leaving normal territory. This signals a breakout move for example the dogecoin pump or the top of the range. I use this indicator to catch bull/bear moves for botting purposes. An other use would be to countertrend trade after the move has ended. With price being in top 1% for a while it is very probable that we see a large correction.
Below example of dogecoin pumps:

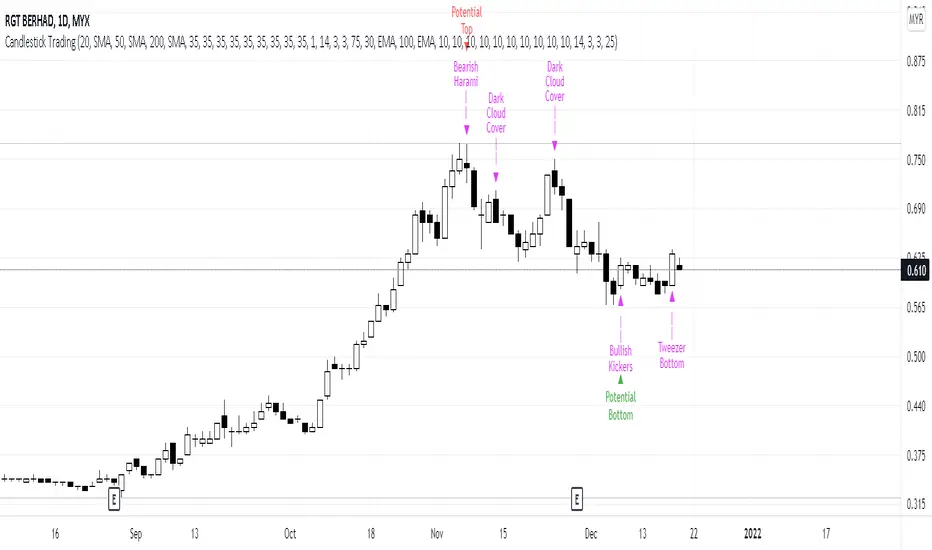
Candlestick Trading (Malaysia Stock Market)1. This indicator will indicate signals of bearish/bullish candlestick as below:
- 10 Bear Candles: Dark Cloud Cover, Bearish Kickers, Bearish Engulfing, Evening Star, Three Black Crows, Hanging Man, Shooting Star, Tweezer Top, Bearish Harami, Doji
- 10 Bull Candles: Piercing, Bullish Kickers, Bullish Engulfing, Morning Star, Three White Soldiers, Hammer, Inverted Hammer, Tweezer Bottom, Bearish Harami, Doji
2. In order for the Bear Candle signals to appear, these conditions should be met:
- Price must be above MA 1 (preset at SMA 20)
- Price must be above MA 2 (preset at SMA 50)
- Price must be above MA 3 (preset at SMA 200)
- In the range of specified trading days (preset at latest 10 days of trading)
3. For a strong bearish signal, a namely 'Potential Top' signal will appear on the top of the bearish candlestick signal. This 'Potential Top' signal will only appear under the condition of:
- Stochastic is at overbought area (preset at 75%)
4. In order for the Bull Candle signals to appear, these conditions should be met:
- Price must be in between MA 4 (preset at EMA 30) and MA 5 (preset at EMA 100)
- In the range of specified trading days (preset at latest 10 days of trading)
5. For a strong bullish signal, a namely 'Potential Bottom' signal will appear at the bottom of the bullish candlestick signal. This 'Potential Bottom' signal will only appear under the condition of:
- Stochastic is at oversold area (preset at 25%)
6. This indicator can help one to enter/exit a trade based on the bullish/bearish candlestick patterns that appear at the beginning/end of a trend, especially when the 'Potential Bottom/Top' appears with any of bullish/bearish candlestick signal.
7. However, this indicator is only designed for Malaysian Stocks Market as the script is based on the bids/pips calculation of the Malaysian Stocks Market. Nevertheless, I let the script open for everyone to modify it based on your own preference markets/instruments.
8. Hope you guys enjoy it. Thanks.
Bollinger Bands Touch MapThis simple script based on Bollinger Bands to collect Touch Point at bandsand display them on the map. Detail of rule as below:
1.Define Touch Point
1.1.Touch Point at Lower Band
+ Key bar:
- Open Price lower than BB lower band, Close Price higher than BB lower band
+ Touch Point:
- Median Price (HL2) of Key bar
1.2.Touch Point at Upper Band
+ Key bar:
- Open Price higher than BB upper band, Close Price lower than BB upper band
+ Touch Point:
- Median Price (HL2) of Key bar
1.3.Zero Point
- Close Price of Current bar
===================================
2.Touch Map
+ Last 5 Touch Point will be show on the map
+ Newest Touch point is numbered as (1) and show at the left of Zero Point
+ Each Point has a label show point's value
===================================
3.Fibonacci
+ Enable: Apply to number of Touch Points indicated
+ Style Up: 0 Level at the bottom
+ Style Down: 0 Level at the top
===================================
4.123 Pattern
+ Pattern: dot 2 and dot 3 at the Top and the Bottom of group 1234
+ M Pattern: dot 3 at the Top of group 135 and at the Bottom of group 234
+ W Pattern: dot 3 at the Bottom of group 135 and at the Top of group 234
===================================
5.Supply Demand Zone
5.1.Supply Zone
+ Supply Zone is area map structure change from upward to downward
+ Supply Zone is limited by 2 dots highest before upward structure broken
5.2.Demand Zone
+ Demand Zone is area map structure change from downward to upward
+ Demand Zone is limited by 2 dots lowest before downward structure broken
============================================================================
6.6.Over Block
6.1.Overbought Block
+ Overbought Block is location Long position covering
+ Ovb Block is limited by higest high and upper band at top of map
6.2.Oversold Block
+ Oversold Block is location Short position covering
+ Ovs Block is limited by lowest low and lower band at bottom of map
===================================
7.RSI Column
+ RSI Overbought is marked by Overbought color
+ RSI Oversold is marked by Oversold color
+ RSI Normal is marked by Normal color
+ Symbol ▲: RSI growing
+ Symbol ▼: RSI falling
===================================
8.Volume Direction
+ Volume growing is marked by Up Color
+ Volume falling is marked by Down Color
+ New Highest Volume on the map is marked by High Color and H Label
+ New Lowest Volume on the map is marked by Low Color and L Label
+ Volume higher than Median level is marked by Up Color and M Label
===================================
9.Useful features
+ Quickly find chart patter: 123, M, W...
+ Quickly find wave patter: I, V, N...
+ Quickly find Key level when moving between different Time Frame
+ Quickly recognize chart is trending or trendless
+ Quickly recognize divergence of Price and Volume
+ Quickly calculate Entry, Stoploss, Takeprofit by using Fibonacci

Bollinger Bands SRThis simple script base on Bollinger Bands to defined Support and Resistance and marked Bar False broken SR by Reversal Arrow. Detail of rule as below:
================================================
1.Defined Support and Resistance
1.1.Support
+ Key bar:
- Open Price lower than BB lower band, Close Price higher than BB lower band
+ Support Zone:
- Bottom Zone place at Low Price of Key bar
- Top Zone place at Median Price (HL2) of Key bar
1.2.Resistance
+ Key bar:
- Open Price higher than BB upper band, Close Price lower than BB upper band
+ Resistance Zone:
- Bottom Zone place at Median Price (HL2) of Key bar
- Top Zone place at High Price of Key bar
1.3.Median Line
+ Median Line place at half of Range limit by Support and Resistance
================================================
2.Defined False Break
2.1.Defined Bull Trap
+ High Price higher than Top of Resistance Zone
+ Close Price lower than Top of Resistance Zone
+ Open Price higher than Bottom of Resistance Zone
+ Bar Direction is downward
+ Body of current Bar greater than Body of previous bar
2.2.Defined Bear Trap
+ Low Price lower than Bottom of Support Zone
+ Close Price higher than Bottom of Support Zone
+ Open Price lower than Top of Support Zone
+ Bar Direction is upward
+ Body of current Bar greater than Body of previous bar
================================================
3.Defined Reversal Arrow and Alert
+ Arrow Down when Bull Trap appear
+ Arrow Up when Bear Trap appear
+ Alert when Reversal Arrow appear
================================================
4.Trading
4.1.Long Position
+ Consider open positon when Arrow Up appear
+ Stoploss place at Low Price of Arrow Bar
+ Take profit at Resistance Zone
+ Consider Exit Position when:
- Price moving above Median Line and has Bearish Reversal Pattern
4.2.Short Position
+ Consider open positon when Arrow Down appear
+ Stoploss place at High Price of Arrow Bar
+ Take profit at Support Zone
+ Consider Exit Position when:
- Price moving below Median Line and has Bullish Reversal Pattern

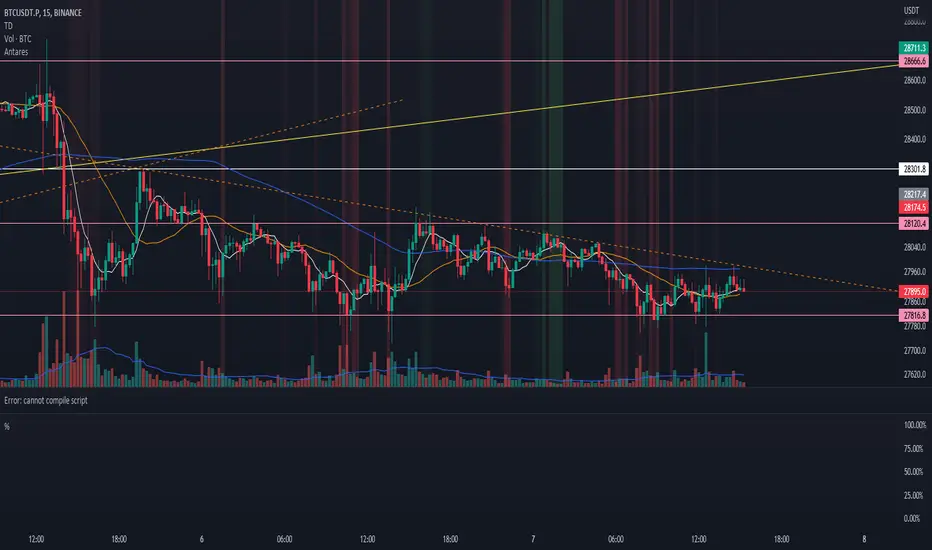
MY:TDI/STOCH█ MY TDI / STOCH INDICATOR
This indicator shows a panel to display the Oversold and Overbought zones based on TDI and STOCHASTIC
The panel contains multiple elements :
• The top straight band : The STOCHASTIC overbought area
• The bottom straight band : The STOCHASTIC oversold area
• The middle waving band : The TDI Bollinger Bands
• The RSI line in Yellow
• 6 STOCHASTIC Lines : Period 15, 32 and 50
Behavior :
• When the STOCHASTIC lines are in the overbought area, their color changes from GRAY to RED
• When the 6 STOCHASTIC lines are in the overbought area, the top band background changes from GRAY to RED
• When the STOCHASTIC lines are in the oversold area, their color changes from GRAY to GREEN
• When the 6 STOCHASTIC lines are in the overbought area, the top band background changes from GRAY to RED
• When the RSI line is BELOW the Bollinger Bands, and with an oversold RSI, the line's color changes from YELLOW to GREEN
• When the RSI line is BELOW the Bollinger Bands, and with an oversold RSI, the Bollinger Bands changes from GRAY to GREEN
• When the RSI line is ABOVE the Bollinger Bands, and with an overbought RSI, the line's color changes from YELLOW to RED
• When the RSI line is ABOVE the Bollinger Bands, and with an overbought, the Bollinger Bands changes from GRAY to RED
A buy signal is when both Bollinger Bands background and Top+Bottom bands background are GREEN
A sell signal is when both Bollinger Bands background and Top+Bottom bands background are RED
THIS INDICATOR IS NOT BULLET PROOF, IT ONLY GIVES AN INDICATION ON POTENTIAL REVERSAL DUE TO OVERSOLD OR OVERBOUGHT.
IT IS NOT BECAUSE IT TRIGGERS A BUY OR SELL SIGNAL, THAT THE PRICE WON'T CONTINUE IN THE SAME DIRECTION FOR A COUPLE MORE CANDLES.
DON'T USE THIS INDICATOR BLINDLY, FOLLOW YOUR OWN ANALYSIS, AND USE THIS INDICATOR AS CONFIRMATION.
Alerts are available to notify you when a market is about (5min) to close or open.
To create an alert
• Open your chart
• Right click on the chart window
• Add Alerts for...
• Condition: chose My:TDI/STOCH - {{ticker}} - {{interval}} - Buy (for example)
• Options : Once per bar
• (OPTIONAL) update the title and description
• Validate

Inverse BandsThis was the result of quite some time spent examining how much information could be gleamed by studying the interactions between Keltner Channels, STARC Bands and Bollinger Bands. I was surprised by the results.
First of all, there are four fills that are black. Set the transparency of those to 0 and you'll see this indicator the way that it's meant to be seen. Those fills belong to unused sections of the Bollinger Bands.
There are two clouds which represent STARC Bands and the Keltner Channel. There is some delay when they flip from bullish (green) to bearish (red), but they are indicative of the trend. The space between them is black and the narrower that space is, the greater volatility is. Because of this, we don't need the exterior Bollinger Bands.
The Bollinger Bands remain visible as the yellow interior clouds on the top cloud and the blue interior clouds on the bottom cloud. Often, the thicker the yellow or blue cloud is, the less severe a throwback from a given trend reversal will be. Often the thinner that yellow or blue cloud is, the more severe the trend reversal will be. If price is rising into a thin interior yellow cloud, the following dip will be substantial. If price action dips towards a thicker interior blue cloud, often the pump following that dump will be less enthusiastic.
We preserve the Keltner Channel and STARC bands as our cloud because the way that they interact with the three basis lines yields a lot of information.
The yellow Bollinger basis line tells us about trend strength. The closer the BB basis line is to the top of the top cloud or the bottom of the bottom cloud, the stronger the trend is. When it enters the cloud very close to the bottom of the bottom cloud, you know you're looking at a strong pump, and vice versa when it's close to the top of the top cloud.
The purple Keltner Channel basis line and orange STARC Band basis line can forecast short term trend changes one candlestick in advance by contacting any line in either cloud. The moment either basis line touches or crosses any boundary of the clouds, you know that the next candle will change directions. In an uptrend, a touch or cross means the next candle will have a lower high point. In a downtrend, a cross or touch means the next candle will have a higher high point. This is most useful in scalping.
It'd be pretty easy to slap some crossover alerts on to this and useful considering that they come a candle in advance. Feel free to further explore and develop this.

Simple Moving Average CrossThe script uses 3 simple moving averages that you can define (SMA Top, SMA Mid, SMA Long).
Once the SMA Top is above the SMA Mid and the SMA Mid is above the SMA Top a long position is entered.
Once the SMA Top is below the SMA Mid and the SMA Mid is below the SMA Top a short position is entered.
You may define how long before these positions are entered by adjusting the bars in the Inputs section.
A setting of 0 will enter a position as soon as the conditions are met,
whereas a setting of 5 will wait 5 bars after the conditions are met before entering the positions.
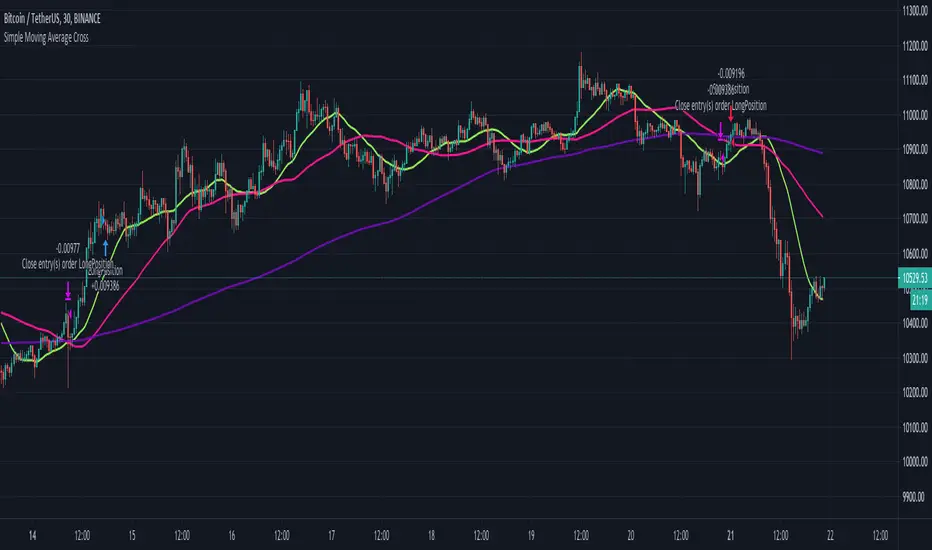
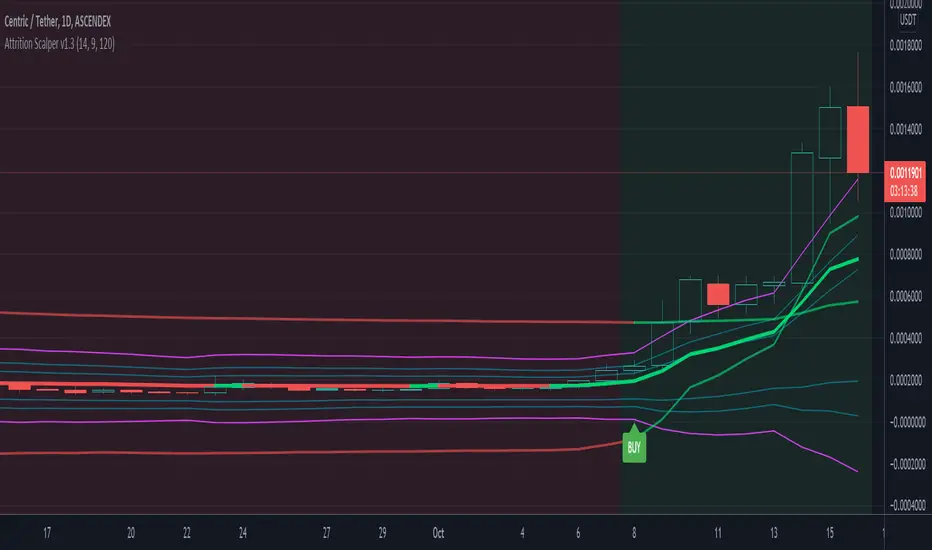
Attrition Scalper v1.0A weird indicator to catch tops/bottoms and scalp with the signals. You should buy/sell with the signals but you should also analyze the chart manually before jumping straight into the trade. One of the most important thing is the middle VIDYA line. It is a very strong support/resistance and if you've taken a long/short from top/bottom, you might want to target there to exit as the indicator will not give you a sell signal there probably.
You should also after trying the indicator for a bit. Make a proper SL/TP strategy for it.
By default the indicator will only load with charts up to 30 minute frame. If you want to load on higher timeframe charts you have to increase the Timeframe to Lookback and the Timeframe options in it's settings.
I really recommend lower timeframes though, the default settings with 5 minute chart is most likely the best.
Each of the lines you see are pretty strong support/resistance and pivot points . So if you've taken an entry for a quick scalp you should most likely start partially closing the position on each line.
I wouldn't really recommend a tight stop as we're most likely entering at or near the bottom and the price really can't stay that overextended unless it's a major/flash dump, at that point no indicator is safe anyways. So finding the sweet spot is up to you.
If more lines are on top of each other, be careful of that spot too as it's a great confluence of support/resistance . For example if the top VIDYA line is near the upper purple 4.236 line. That is a major resistance and if price is above it, it will almost certainly test it back or fall back inside the channel.
Another strategy is to not use the buy/sell signals but use the channel/lines yourself on higher timeframe for swing trading or just putting orders at the other extreme ends/lines in the channel to catch a nice entry in flash/major dumps/pumps.
Price will most likely retrace to the middle VIDYA line after touching or overextending from the top VIDYA and upper purple 4.236 line. Same also applies for the opposite side too. Any close above/below the VIDYA might mean continuation but that's better seen and confirmed on much higher timeframes, not 5 minutes probably.
Special thanks to: www.tradingview.com i got inspired from some of his indicators and even used some snippets of code which he allowed me to do.
In the near future i'm thinking of implementing new logic with Weis Waves and few other indicators to increase the signal count as i think it's currently very low. But overtrading might be bad anyways.
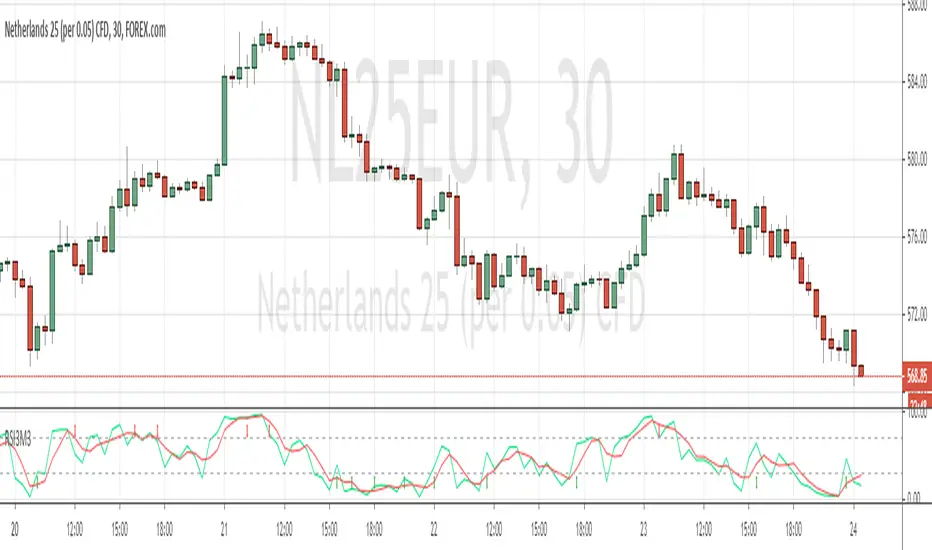
Study RSI3M3 from Walter J. BressertDear Trader,
Walter Bressert started with cycle trading and published is findings in different books.
In one off his documents "Timing is everything, The Cycle Trading Pattern" he's using a very simple oscillator.
This oscillator called RSI3M3.
The RSI3M3 is a 3-bar RSI smoothed with a 3-bar moving average.
Oscillator/Cycle Combinations that Identify Trading Cycle Tops and Bottoms.
Trading cycles show distinct tops and bottoms that are frequently accompanied by overbought and oversold levels of an oscillator that is derived from price activity.
This oscillator shows the ebb and flow of market energy, or the buying and selling power as it tops and bottoms.
Although not based on time, it quite frequently identifies cycle tops and bottoms with accuracy of 80-90% depending on the market and time frame.
With this kind of accuracy the oscillator can be used to identify high probability trading situations at tops and bottoms of cycles.
Even better, the oscillator can be used to generate mechanical buy and sell signals that take much of the judgment and stress out of trading.
In combination with other indicator, like the MACD, this could be a powerfull tool to make youre strategy more accurate.
Happy trading,
ADutchTourist
MAFIA CANDLESMafia Candles is a Exhaustion bar count and candle count indicator, Using the Leledc Candles and 1-3 counting candle play gives you a pretty good idea where a so called "top" will be or a so called "bottom" will be!
In this example, getting the transparent round circles ( either lime or red ) would mean that the move will be a good size move!
EXAMPLE=1 You see a down trend and then the Mafia Candles Flashes a Green Dot on the forming new red candle. This is where in theory you might want to consider going long on the market!
EXAMPLE=2 If you see a RED $ symbol, after a uptrend, this means in theory, there might be room for a short play or room for a small pullback in the price!
THE CIRCLES(RED OR LIME COLORED) ARE INDICATING BIGGER MOVES!
THE $ SYMBOLS (RED OR LIME COLORED) ARE INDICATING SMALLER PULLBACKS OR SMALLER PUMPS IN PRICE!
RED IS CONSIDERED TO BE A SELL!
LIME COLOR IS CONSIDERED TO BE A BUY!
AS MUCH IS BASED OF THE 1-3 CANDLE COUNT AND THE LEDLEC CANDLE DEVIATION STRATEGY, LET ME EXPLAIN THE THEORY ON BOTH THE 1-3 CANDLE COUNT AND THE LELEDC STRATEGY I COMBINE TO BRING YOU THIS ADDITION OF THE INDICATOR....
LELEDC THEORY USAGE...
An Exhaustion Bar is a bar which signals
the exhaustion of the trend in the current direction. In other words an
exhaustion bar is “A bar of last seller” in case of a downtrend and “A bar of
last buyer”in case of an uptrend.
Having said that when a party cannot take the price further in their direction,naturally the other party comes in , takes charge and reverses the direction of the trend.
TO EASIER UNDERSTAND I GIVE YOU A EASY EXAMPLE OF WHAT AN LELEDC EXHAUSTION BAR IS...
1. A wide range bar ( a bar with
long body!!!).
2. A long wick at the bottom of
the bar and no or negligible wick at the top of the bar in case of “Bear exhaustion bar” and
a long wick at the top and no or
negligible wick at the bottom of the bar in case of
“Bull exhuation bar”!!!
3. Extreme volume and.....
4. Bar forming at a key support or resistance
area including a Round Number (RN) and Big Round Number ( BRN ).THE PSYCHOLOGY BEHIND THIS!!!
Now let's assume that we have a group
of people,say 100 people who decides to go for a casual running. After running for few KM's few of
them will say “I am exhausted. I cannot run further”. They will quit running.
After running further, another bunch of runners will say “I am exhausted. I can’t run
further” and they also will quit running.
This goes on and on and then there will be a stage where only few will be left in the running. Now a stage will come where the last person left in the running will say “I
am exhausted” and he stops running. That means no one is left now in the
running.This means all are exhausted in the running.
The same way an exhaustion bar works and if we can figure out that
exhaustion bar with all the tools available on hand, we will be in a big trade
for sure!!.The reason is an exhaustion bar is formed at exact tops and bottoms most of the times.In forex with wide variety of pairs available at the counter ,one can trade this technique to make lifetime gains.
NOW LET ME EXPLAIN THE 1-3 CANDLE CORRECTION COUNT THEORY WHICH IS USED TO GET THE SUM UP SIGNALS FROM THIS INDICATOR FROM ITS INPUT LEVELS!!!
1-3 CANDLES....
The 1-3 Candlestick pattern is basically like sequential, aka a candle counting system!
1-3 CANDLE COUNT means you count the number of bullish=green candles or the bearish=red candles!
3 BULL/GREEN CANDLES in a row, each closing its close higher than the previous one before it is the 1-3 candle top count idea!
lets say you get 3 red bear candles, each candle after the first closes its body below the previous red candle before it, then you see 3 red candles with each closing lower bodies lower than the previous candle, THATS A POSSIBLE SIGN OF BEARISH EXHAUSTION, AND YOU MIGHT HAVE SOME BULLS STEP IN TO TAKE THE PRICE UP AFTER THE IMMEDIATE DOWNFALL OF THOSE 3 RED CANDLES!!
PLEASE IF ANYONE HAS QUESTIONS OR NEEDS ANY FURTHER EXPLANATION, DONT HESISITATE TO MESSAGE ME! CHALRES KNIGHT IS THE ORIGINAL AUTHOR OF THE 1-3 CANDLE COUNT AND THE LELEDC EXHAUSTION BAR INDICATOR ON METE-TRADER! R.IP CHARLES F KNIGHT!!! WE LOVE YOU AND MISS YOU BROTHER!
CHARLES KNIGHT PASSED DOWN ALL OF HIS INDICATORS AND SCRIPTS IN ORIGINAL CODE TO MYSELF WHEN HE PASSED AWAY AND I WILL CONTINUE TO HONOR HIS MEMORY BY ENHANCING HIS ORIGINAL SOURCE CODED SCRIPTS TO ENHANCE THE LIFE FOR ALL TRADERS!
CHARLIE LOVED WHEN I WOULD PUT MY OWN SWING ON HIS INDICATORS! HE TAUGHT ME EVERYTHING I KNOW AND I KNOW ONE DAY I WILL SEE HIM AGAIN!
TRADE IN PARADISE CHARLIE!!!
THE BEST TRADER IN THE WORLD!!!

Dual SuperTrend, Ichimoku and DMI Color Weighted by DGTThis study interprets SuperTrend with Ichimoku Cloud, one of the popular technical analysis indicator, and interprets Directional Movement (DMI), which is another quite valuable technical analysis indicator.
Then combines the interpreted SuperTrend with interpreted Directional Movement (DMI) and Volume Based Colored Bars indicator created by Kıvaç ÖZBİLGİÇ (permission has been granted from the author)
Here are details of the concept applied
1- SuperTrend Line colored based on Ichimoku Cloud
Definition
The Ichimoku Cloud, developed by Goichi Hosoda and published in the late 1960s, is a collection of technical indicators that give it a unique capacity to show support and resistance levels, momentum and trend direction
What Does the Ichimoku Cloud Tells?
The overall trend is up when price is above the cloud, known as Kumo Cloud, down when price is below the Kumo Cloud, and trendless or transitioning when price is in the Kumo Cloud
When Senkou Span A (Leading Span A) is rising and above Senkou Span B (Leading Span B), this helps confirm the uptrend and space between the lines is typically colored green. When Senkou Span A is falling and below Senkou Span B, this helps confirm the downtrend. The space between the lines is typically colored red
Traders often use the Kumo Cloud as an area of support and resistance depending on the relative location of the price. The Kumo Cloud provides support/resistance levels that can be projected into the future. This sets the Ichimoku Cloud apart from many other technical indicators that only provide support and resistance levels for the current date and time
Crossovers, also known as TK Cross among Ichimoku Cloud traders, are another way the indicator can be used. Watch for the Tenkan-Sen Line, or Conversion Line, to move above the Kijun-Sen Line, or Base Line, especially when price is above the Kumo cloud. This can be a powerful buy signal. One option is to hold the trade until the Tenkan-Sen drops back below the Kijun-Sen Line. Any of the other lines could be used as exit points as well.
With this study:
Allow Traders to use the Ichimoku Cloud in conjunction with other technical indicators to maximize their risk-adjusted returns
The Ichimoku Cloud can make a chart look busy with all the lines. To Remedy this a different approach is applied in this study showing the Price and the Kumo Cloud relation as well as TK Crosses displayed. The SuperTrend Indicator is chosen to display Ichimoku Indicator, where the SuperTrend is another trend following indicator.
How it works:
SuperTrend Line is colored as:
Green when the Price is above the Kumo Cloud
Red when the Price is below the Kumo Cloud
Black when the Price is within the Kumo Cloud
And Finally Blue when the Kumo Cloud Is not ready to be drawn or not Kumo Cloud available
Additionally intensity of the colors used in all cases above are defined by values of Tenkan-Sen and Kijun-Sen Line, which allows us to detect TK Crosses
2- Plots Colored Directional Movement Line
Definition
Directional Movement (DMI) (created by J. Welles Wilder ) is actually a collection of three separate indicators combined into one. Directional Movement consists of the Average Directional Index (ADX) , Plus Directional Indicator (+D I) and Minus Directional Indicator (-D I) . ADX's purposes is to define whether or not there is a trend present. It does not take direction into account at all. The other two indicators (+DI and -DI) are used to compliment the ADX. They serve the purpose of determining trend direction. By combining all three, a technical analyst has a way of determining and measuring a trend's strength as well as its direction.
This study combines all three lines in a single colored shapes series plotted on the top of the price chart indicating the trend strength with different colors and its direction with triangle up and down shapes.
What to look for
Trend Strength : Analyzing trend strength is the most basic use for the DMI. Wilder believed that a DMI reading above 25 indicated a strong trend, while a reading below 20 indicated a weak or non-existent trend
Crosses : DI Crossovers are the significant trading signal generated by the DMI
With this study
A Strong Trend is assumed when ADX >= 25
Bullish Trend is defined as (+D I > -DI ) and (ADX >= 25), which is plotted as green triangle up shape on top of the price chart
Bearish Trend is defined as (+D I < -DI ) and (ADX >= 25), which is plotted as red triangle down shape on top of the price chart
Week Trend is assumed when 17< ADX < 25, which is plotted as black triangles up or down shape, depending on +DI-DI values, on top of the price chart
Non-Existent Trend is assumed when ADX < 17, which is plotted as yellow triangles up or down shape, depending on +DI-DI values, on top of the price chart
Additionally intensity of the colors used in all cases above are defined by comparing ADX’s current value with its previous value
3- Volume Based Colored Bars indicator created by Kıvaç ÖZBİLGİÇ
Volume Based Colored Bars colors the bars into volume weighted signals increasing the visibility of the Volume changes. Intensity of the colors of the bars varies according to average value of the volume for given length of bars (default value set to 30 bars)
Disclaimer: The script is for informational and educational purposes only. Use of the script does not constitutes professional and/or financial advice. You alone the sole responsibility of evaluating the script output and risks associated with the use of the script. In exchange for using the script, you agree not to hold dgtrd tradingview user liable for any possible claim for damages arising from any decision you make based on use of the script

Colored Directional Movement and Bollinger Band's Cloud by DGTThis study combines Bollinger Bands, one of the most popular technical analysis indicators on the market, and Directional Movement (DMI), which is another quite valuable technical analysis indicator.
Bollinger Bands used in conjunction with Directional Movement (DMI) may help getting a better understanding of the ever changing landscape of the market and perform more advanced technical analysis
Here are details of the concept applied
1- Plots Bollinger Band’s (BB) Cloud colored based on Bollinger Band Width (BBW) Indicator’s value
Definition
Bollinger Bands (created by John Bollinger ) are a way to measure volatility . As volatility increases, the wider the bands become and similarly as volatility decreases, the gap between bands narrows
Bollinger Bands, in widely used approach, consist of a band of three lines. Likewise common usage In this study a band of five lines is implemented
The line in the middle is a Simple Moving Average (SMA) set to a period of 20 bars (the most popular usage). The SMA then serves as a base for the Upper and Lower Bands. The Upper and Lower Bands are used as a way to measure volatility by observing the relationship between the Bands and price. the Upper and Lower Bands in this study are set to two and three standard deviations (widely used form is only two standard deviations) away from the SMA (The Middle Line), hence there are two Upper Bands and two Lower Bands. The background between two Upper Bands is filled with a green color and the background between two Lower Bands is filled with a red color. In this we have obtained Bollinger Band’s (BB) Clouds (Upper Cloud and Lower Cloud)
Additionally the intensity of the color of the background is calculated with Bollinger Bands Width ( BBW ), which is a technical analysis indicator derived from the standard Bollinger Bands indicator. Bollinger Bands Width, quantitatively measures the width between the Upper and Lower Bands. In this study the intensity of the color of the background is increased if BBW value is greater than %25
What to look for
Price Actions : Prices are almost always within the bands especially at this study the bands of three standard deviations away from the SMA. Price touching or breaking the BB Clouds could be considered as buying or selling opportunity. However this is not always the case, there are exceptions such as Walking the Bands. “Walking the Bands” can occur in either a strong uptrend or a strong downtrend. During a strong trend, there may be repeated instances of price touching or breaking through the BB Clouds. Each time that this occurs, it is not a signal, it is a result of the overall strength of the move. In this study in order to get a better understanding of the trend and add ability to perform some advanced technical analysis Directional Movement Indicator (DMI) is added to be used in conjunction with Bollinger Bands.
Cycling Between Expansion and Contraction : One of the most well-known theories in regards to Bollinger Bands is that volatility typically fluctuates between periods of expansion (Bands Widening : surge in volatility and price breaks through the BB Cloud) and contraction (Bands Narrowing : low volatility and price is moving relatively sideways). Using Bollinger Bands in conjunction with Bollinger Bands Width may help identifying beginning of a new directional trend which can result in some nice buying or selling signals. Of course the trader should always use caution
2- Plots Colored Directional Movement Line
Definition
Directional Movement (DMI) (created by J. Welles Wilder ) is actually a collection of three separate indicators combined into one. Directional Movement consists of the Average Directional Index (ADX) , Plus Directional Indicator (+D I) and Minus Directional Indicator (-D I) . ADX's purposes is to define whether or not there is a trend present. It does not take direction into account at all. The other two indicators (+DI and -DI) are used to compliment the ADX. They serve the purpose of determining trend direction. By combining all three, a technical analyst has a way of determining and measuring a trend's strength as well as its direction.
This study combines all three lines in a single colored shapes series plotted on the top of the price chart indicating the trend strength with different colors and its direction with triangle up and down shapes.
What to look for
Trend Strength : Analyzing trend strength is the most basic use for the DMI. Wilder believed that a DMI reading above 25 indicated a strong trend, while a reading below 20 indicated a weak or non-existent trend
Crosses : DI Crossovers are the significant trading signal generated by the DMI
With this study
A Strong Trend is assumed when ADX >= 25
Bullish Trend is defined as (+D I > -DI ) and (ADX >= 25), which is plotted as green triangle up shape on top of the price chart
Bearish Trend is defined as (+D I < -DI ) and (ADX >= 25), which is plotted as red triangle down shape on top of the price chart
Week Trend is assumed when 17< ADX < 25, which is plotted as black triangles up or down shape, depending on +DI-DI values, on top of the price chart
Non-Existent Trend is assumed when ADX < 17, which is plotted as yellow triangles up or down shape, depending on +DI-DI values, on top of the price chart
Additionally intensity of the colors used in all cases above are defined by comparing ADX’s current value with its previous value
Summary of the Study:
Even more simplified and visually enhanced DMI drawing comparing to its classical usage (may require a bit practice to get used to it)
As said previously, to get a better understanding of the trend and add ability to perform some advanced technical analysis Directional Movement Indicator (DMI) is used in conjunction with Bollinger Bands.
PS: Analysis and tests are performed with high volatile Cryptocurrency Market
Source of References : definitions provided herein are gathered from TradingView’s knowledgebase/library
Disclaimer: The script is for informational and educational purposes only. Use of the script does not constitutes professional and/or financial advice. You alone the sole responsibility of evaluating the script output and risks associated with the use of the script. In exchange for using the script, you agree not to hold dgtrd tradingview user liable for any possible claim for damages arising from any decision you make based on use of the script

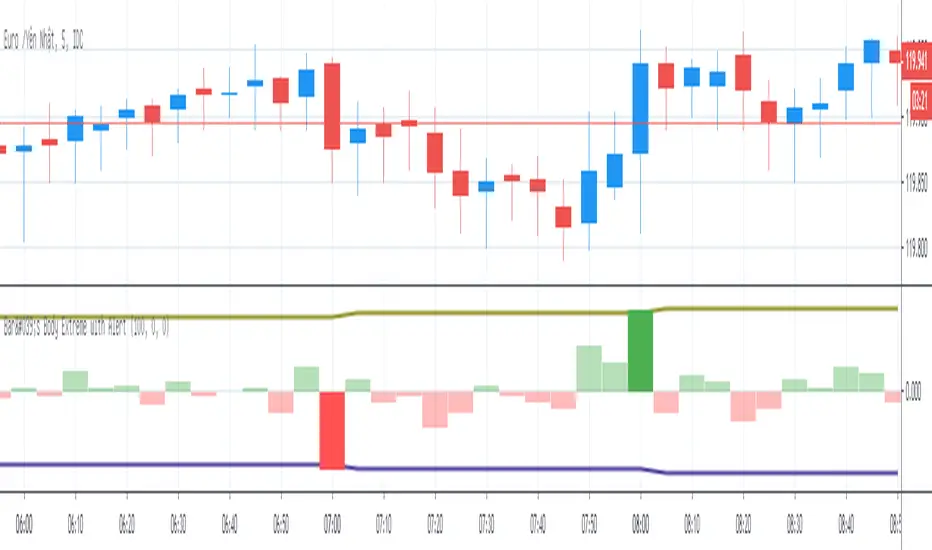
Bar's Body Extreme with AlertBar's Body Extreme with Alert measure volatility of bar's body and caculate extreme level in specified periods or custom level with alert. Detail options below:
1. Default Extreme Level
* Default level is the +/- highest volatility of bar's body in 100 periods
* Periods of bar to calculate default extreme adjustable
2. Custom Extreme
* Default Extreme Top auto disable if Custom Extreme Top >0
* Default Extreme Bottom auto disable if Custom Extreme Bottom <0
3. Alert
* Extreme alert: body's volatility > Extreme top level or body's volatility < Extreme bottom level
* Extreme Top Alert: body's volatility > Extreme top level
* Extreme Bottom Alert: body's volatility < Extreme bottom level
Point and Figure (PnF) ChartThis is live and non-repainting Point and Figure Charting tool. The tool has it’s own P&F engine and not using integrated function of Trading View.
Point and Figure method is over 150 years old. It consist of columns that represent filtered price movements. Time is not a factor on P&F chart but as you can see with this script P&F chart created on time chart.
P&F chart provide several advantages, some of them are filtering insignificant price movements and noise, focusing on important price movements and making support/resistance levels much easier to identify.
If you are new to Point & Figure Chart then you better get some information about it before using this tool. There are very good web sites and books. Please PM me if you need help about resources.
Options in the Script
Box size is one of the most important part of Point and Figure Charting. Chart price movement sensitivity is determined by the Point and Figure scale. Large box sizes see little movement across a specific price region, small box sizes see greater price movement on P&F chart. There are four different box scaling with this tool: Traditional, Percentage, Dynamic (ATR), or User-Defined
4 different methods for Box size can be used in this tool.
User Defined: The box size is set by user. A larger box size will result in more filtered price movements and fewer reversals. A smaller box size will result in less filtered price movements and more reversals.
ATR: Box size is dynamically calculated by using ATR, default period is 20.
Percentage: uses box sizes that are a fixed percentage of the stock's price. If percentage is 1 and stock’s price is $100 then box size will be $1
Traditional: uses a predefined table of price ranges to determine what the box size should be.
Price Range Box Size
Under 0.25 0.0625
0.25 to 1.00 0.125
1.00 to 5.00 0.25
5.00 to 20.00 0.50
20.00 to 100 1.0
100 to 200 2.0
200 to 500 4.0
500 to 1000 5.0
1000 to 25000 50.0
25000 and up 500.0
Default value is “ATR”, you may use one of these scaling method that suits your trading strategy.
If ATR or Percentage is chosen then there is rounding algorithm according to mintick value of the security. For example if mintick value is 0.001 and box size (ATR/Percentage) is 0.00124 then box size becomes 0.001.
And also while using dynamic box size (ATR or Percentage), box size changes only when closing price changed.
Reversal : It is the number of boxes required to change from a column of Xs to a column of Os or from a column of Os to a column of Xs. Default value is 3 (most used). For example if you choose reversal = 2 then you get the chart similar to Renko chart.
Source: Closing price or High-Low prices can be chosen as data source for P&F charting.
Chart Style: There are 3 options for chart style: “Candle”, “Area” or “Don’t show”.
As Area:
As Candle:
X/O Column Style: it can show all columns from opening price or only last Xs/Os.
Color Theme: different themes exist => Green/Red, Yellow/Blue, White/Yellow, Orange/Blue, Lime/Red, Blue/Red
Show Breakouts is the option to show Breakouts
This tool detects & shows following Breakouts:
Triple Top/Bottom,
Triple Top Ascending,
Triple Bottom Descending,
Simple Buy/Sell (Double Top/Bottom),
Simple Buy With Rising Bottom,
Simple Sell With Declining Top
Catapult bullish/bearish
Show Horizontal Count Targets: Finds the congestion or consolidation pattern and if there is breakout then it calculates the Target by using Horizontal Count method (based on the width of congestion pattern). It shows how many column exist on congestion area. There is no guarantee that prices will reach the target.
Show Vertical Count Targets: When Triple Top/Bottom Breakouts occured the script calculates the target by using Vertical Count Method (based on the length of the column). There is no guarantee that prices will reach the target.
For both methods there is auto target cancellation if price goes below congestion bottom or above congestion top.
trend is calculated by EMA of closing price of the P&F
Whipsaw protection:
Last options are “Show info panel” and Labeling Offset. Script shows current box size, reversal, and recommanded minimum and maximum box size. And also it shows the price level to reverse the column (Xs <-> Os) and the price level to add at least 1 more box to column. This is the option to put these labels 10, 20, 30, 50 or 100 bars away from the last bar. Labeling content and color change according to X/O column.
do not hesitate to comment.

ZigZag Volume Profile [Honestcowboy]The ZigZag Volume Profile Indicator is a combination of 2 very popular trading indicators, the volume profile and zigzag indicator. Instead of using predetermined sessions like traditional volume profile analysis. This indicator expands on zigzag indicators "legs" and draws a volume profile inside each zigzag leg.
What is a Volume Profile?
"Technical analysis tool showing trading volume at specific price levels, creating a horizontal histogram on the side of a chart to reveal areas of high buying/selling interest, unlike traditional volume bars showing volume over time. Key elements include the Point of Control (POC) for most traded price, the Value Area (VAH/VAL), identifying crucial support/resistance, and analyzing profile shapes (like D, B, P) to understand market balance and potential price targets, used by professionals to spot liquidity and market structure."
Key Differences
Does not have a value area but distinguishes each column in relation to the biggest column in percentage terms.
Does not take sessions into account instead using zigzag legs
🟦 CALCULATION
The zigzag volume profile first builds a standard zigzag indicator to find structure in the market. Using pivot points and a minimum % price move threshhold.
Then once it knows the zigzags it will use each leg as a time window to calculate a volume profile inside.
🔹Coloring each column:
The script will find the biggest column in the Profile and use that as a reference for all other columns. It will then decide for each column individually how big it is in % compared to the biggest column. It will use that percentage to decide which color to give it, top 20% will be red, top 40% purple, top 60% blue, top 80% green and all the rest yellow. The user is able to adjust these numbers for further customisation.
🟦 USAGE
The idea behind this indicator is, if you look at markets as different legs (moves) going in a zigzag pattern you might want to look deeper inside your previous moves and see where the actual liquidity/volume was during that move. The hypothesis here is you build trade ideas based on zigzags but then use the volume profiles.
Since volume and market structure are very well known concepts to discretionary traders I'm hoping this indicator might give some different perspective on this relation and help people create a trading approach based on it. Here's some quick cherry picked examples, just as a proof of concept:
🟦 SETTINGS
🔹ZIGZAG SETTINGS
Price Deviotion % : This is the minimum price move in % term from last pivot price needs to move to form a new pivot for the zigzag.
Pivot Legs (Left/Right): The amount of bars a high or a low needs to be higher/lower than to the left and right of the bar. 10 By default to create medium term zigzag
🔹Volume Profile
Profile Rows: The amount of rows in Y axis the zigzag is going to be sliced into to create the volume profile. Higher number is more detailed volume profile but also uses more box objects which is maxed at 500. 25 by default
Profiles to Display: The amount of volume profiles the indicator will draw back in time. Higher number means more history but also longer loading time. 20 by default
🔹Visual Settings
This part is pretty self explanatory and you have can manually select the colors used to create the volume profile. Refer back the the explanation about the "🔹coloring each column" section.

TJR asia session sweep//@version=5
strategy("TJR asia session sweep", "TJR Asia Sweep", overlay=true, max_lines_count=500, max_labels_count=500)
// Input settings
show_asian = input.bool(true, "Show Asian Session", group="Visual Settings")
show_london = input.bool(true, "Show London Session", group="Visual Settings")
show_swing_points = input.bool(true, "Show Asian Swing Points", group="Visual Settings")
show_market_structure = input.bool(true, "Show Market Structure", group="Visual Settings")
show_bos = input.bool(true, "Show Break of Structure", group="Visual Settings")
// Session Time Settings
asian_start_hour_input = input.int(22, "Asian Session Start Hour", minval=0, maxval=23, group="Session Times")
asian_end_hour_input = input.int(3, "Asian Session End Hour", minval=0, maxval=23, group="Session Times")
london_start_hour_input = input.int(3, "London Session Start Hour", minval=0, maxval=23, group="Session Times")
london_end_hour_input = input.int(8, "London Session End Hour", minval=0, maxval=23, group="Session Times")
session_timezone = input.string("America/New_York", "Session Timezone", options= , group="Session Times")
// Risk Management Settings
use_atr_sl = input.bool(false, "Use ATR Multiplier for Stop Loss", group="Risk Management")
atr_length = input.int(14, "ATR Length", minval=1, maxval=50, group="Risk Management")
atr_multiplier = input.float(2.0, "ATR Multiplier for Stop Loss", minval=0.5, maxval=10.0, group="Risk Management")
force_london_close = input.bool(true, "Force Close at London Session End", group="Risk Management")
cutoff_minutes = input.int(60, "Minutes Before Session End to Stop New Trades", minval=0, maxval=300, group="Risk Management")
// Position Sizing Settings
position_sizing_method = input.string("USD Risk", "Position Sizing Method", options= , group="Position Sizing")
usd_risk_per_trade = input.float(100.0, "USD Risk Per Trade", minval=1.0, maxval=10000.0, group="Position Sizing")
fixed_contracts = input.float(1.0, "Fixed Number of Contracts", minval=0.01, maxval=1000.0, step=0.01, group="Position Sizing")
// Color settings
asian_color = input.color(color.red, "Asian Session Color")
london_color = input.color(color.blue, "London Session Color")
swing_high_color = input.color(color.orange, "Swing High Color")
swing_low_color = input.color(color.lime, "Swing Low Color")
bullish_structure_color = input.color(color.green, "Bullish Structure Color")
bearish_structure_color = input.color(color.red, "Bearish Structure Color")
bos_color = input.color(color.orange, "Break of Structure Color")
// Line settings
line_width = input.int(2, "Line Width", minval=1, maxval=5)
// ATR calculation for stop loss
atr = ta.atr(atr_length)
// Position size calculation function
calculate_position_size(entry_price, stop_loss_price) =>
var float position_size = na
if position_sizing_method == "Fixed Contracts"
position_size := fixed_contracts
else // USD Risk method
stop_distance = math.abs(entry_price - stop_loss_price)
if stop_distance > 0
// Calculate position size based on USD risk per trade
// For forex: position_size = risk_amount / (stop_distance * point_value)
// For most forex pairs, point value = 1 (since we're dealing with price differences directly)
position_size := usd_risk_per_trade / stop_distance
else
position_size := fixed_contracts // Fallback to fixed contracts if stop distance is 0
position_size
// Session time definitions (using input variables)
asian_start_hour = asian_start_hour_input
asian_end_hour = asian_end_hour_input
london_start_hour = london_start_hour_input
london_end_hour = london_end_hour_input
// Get current hour using selected timezone
current_hour = hour(time, session_timezone)
// Previous hour for transition detection
prev_hour = hour(time , session_timezone)
// Session transition detection
asian_start = current_hour == asian_start_hour and prev_hour != asian_start_hour
asian_end = current_hour == asian_end_hour and prev_hour != asian_end_hour
london_start = current_hour == london_start_hour and prev_hour != london_start_hour
london_end = current_hour == london_end_hour and prev_hour != london_end_hour
// Session activity detection
asian_active = (current_hour >= asian_start_hour) or (current_hour < asian_end_hour)
london_active = (current_hour >= london_start_hour) and (current_hour < london_end_hour)
// Session boxes - keep previous sessions visible
var box asian_session_box = na
var box london_session_box = na
// Create Asian session box
if show_asian and asian_start
// Create new box at session start (previous box remains visible)
asian_session_box := box.new(bar_index, high, bar_index + 1, low,
border_color=asian_color, bgcolor=color.new(asian_color, 90),
border_width=2, border_style=line.style_solid)
// Pre-calculate session highs and lows for consistency
asian_session_length = asian_active and not na(asian_session_box) ? bar_index - box.get_left(asian_session_box) + 1 : 1
current_asian_high = ta.highest(high, asian_session_length)
current_asian_low = ta.lowest(low, asian_session_length)
// Update Asian session box continuously during session
if show_asian and asian_active and not na(asian_session_box)
box.set_right(asian_session_box, bar_index)
// Update box to contain session highs and lows
box.set_top(asian_session_box, current_asian_high)
box.set_bottom(asian_session_box, current_asian_low)
// Create London session box
if show_london and london_start
// Create new box at session start (previous box remains visible)
london_session_box := box.new(bar_index, high, bar_index + 1, low,
border_color=london_color, bgcolor=color.new(london_color, 90),
border_width=2, border_style=line.style_solid)
// Pre-calculate London session highs and lows for consistency
london_session_length = london_active and not na(london_session_box) ? bar_index - box.get_left(london_session_box) + 1 : 1
current_london_high = ta.highest(high, london_session_length)
current_london_low = ta.lowest(low, london_session_length)
// Update London session box continuously during session
if show_london and london_active and not na(london_session_box)
box.set_right(london_session_box, bar_index)
// Update box to contain session highs and lows
box.set_top(london_session_box, current_london_high)
box.set_bottom(london_session_box, current_london_low)
// Asian Session Swing Points Detection
var float asian_session_high = na
var float asian_session_low = na
var int asian_high_bar = na
var int asian_low_bar = na
// Asian Session Absolute High/Low for TP levels
var float asian_absolute_high = na
var float asian_absolute_low = na
var line asian_high_line = na
var line asian_low_line = na
var label asian_high_label = na
var label asian_low_label = na
var bool high_broken = false
var bool low_broken = false
// London Session High/Low tracking for stop loss
var float london_session_high = na
var float london_session_low = na
// Market structure tracking variables
var string breakout_direction = na // "bullish" or "bearish"
var float last_hh_level = na // Last Higher High level
var float last_hl_level = na // Last Higher Low level
var float last_ll_level = na // Last Lower Low level
var float last_lh_level = na // Last Lower High level
var int structure_count = 0
var string last_structure_type = na // "HH", "HL", "LL", "LH"
// Legacy variables for compatibility
var float last_swing_high = na
var float last_swing_low = na
var int last_high_bar = na
var int last_low_bar = na
// Market structure state tracking
var float pending_high = na
var float pending_low = na
var int pending_high_bar = na
var int pending_low_bar = na
var bool waiting_for_confirmation = false
// Break of Structure tracking variables
var float most_recent_hl = na
var float most_recent_lh = na
var int most_recent_hl_bar = na
var int most_recent_lh_bar = na
var bool bos_detected = false
// Trading variables
var bool trade_taken = false
// Trade visualization boxes (based on Casper strategy approach)
var box current_profit_box = na
var box current_sl_box = na
// Update swing points during Asian session
if asian_active and show_swing_points
// Always track absolute high/low for both TP levels and breakout detection
if na(asian_absolute_high) or high > asian_absolute_high
asian_absolute_high := high
if na(asian_absolute_low) or low < asian_absolute_low
asian_absolute_low := low
// Use absolute high/low for breakout levels (simplified logic)
if na(asian_session_high) or high > asian_session_high
asian_session_high := high
asian_high_bar := bar_index
if na(asian_session_low) or low < asian_session_low
asian_session_low := low
asian_low_bar := bar_index
// Track London session high/low for stop loss levels
if london_active
if na(london_session_high) or high > london_session_high
london_session_high := high
if na(london_session_low) or low < london_session_low
london_session_low := low
// Draw initial lines when Asian session ends
if asian_end and show_swing_points
if not na(asian_session_high) and not na(asian_high_bar)
// Draw extending line for high
asian_high_line := line.new(asian_high_bar, asian_session_high, bar_index + 200, asian_session_high,
color=swing_high_color, width=2, style=line.style_dashed, extend=extend.right)
asian_high_label := label.new(bar_index + 5, asian_session_high, "Asian High: " + str.tostring(asian_session_high, "#.####"), style=label.style_label_left, color=swing_high_color, textcolor=color.white, size=size.small)
if not na(asian_session_low) and not na(asian_low_bar)
// Draw extending line for low
asian_low_line := line.new(asian_low_bar, asian_session_low, bar_index + 200, asian_session_low,
color=swing_low_color, width=2, style=line.style_dashed, extend=extend.right)
asian_low_label := label.new(bar_index + 5, asian_session_low, "Asian Low: " + str.tostring(asian_session_low, "#.####"), style=label.style_label_left, color=swing_low_color, textcolor=color.white, size=size.small)
// Reset break flags for new session
high_broken := false
low_broken := false
// Check for breakouts during London session
if london_active and show_swing_points and not na(asian_session_high) and not na(asian_session_low)
// Check if Asian high is broken
if not high_broken and not low_broken and high > asian_session_high
high_broken := true
// Update high line to end at break point
if not na(asian_high_line)
line.set_x2(asian_high_line, bar_index)
line.set_extend(asian_high_line, extend.none)
// Remove the low line (first break wins)
if not na(asian_low_line)
line.delete(asian_low_line)
if not na(asian_low_label)
label.delete(asian_low_label)
// Add break marker
label.new(bar_index, asian_session_high * 1.001, "HIGH BREAK!",
style=label.style_label_down, color=color.red, textcolor=color.white, size=size.normal)
// Set breakout direction and initialize structure tracking
breakout_direction := "bullish"
last_swing_high := asian_session_high
last_swing_low := asian_session_low
last_high_bar := bar_index
structure_count := 0
// Check if Asian low is broken
if not low_broken and not high_broken and low < asian_session_low
low_broken := true
// Update low line to end at break point
if not na(asian_low_line)
line.set_x2(asian_low_line, bar_index)
line.set_extend(asian_low_line, extend.none)
// Remove the high line (first break wins)
if not na(asian_high_line)
line.delete(asian_high_line)
if not na(asian_high_label)
label.delete(asian_high_label)
// Add break marker
label.new(bar_index, asian_session_low * 0.999, "LOW BREAK!",
style=label.style_label_up, color=color.red, textcolor=color.white, size=size.normal)
// Set breakout direction and initialize structure tracking
breakout_direction := "bearish"
last_swing_high := asian_session_high
last_swing_low := asian_session_low
last_low_bar := bar_index
structure_count := 0
// Stop extending lines when London session ends (if not already broken)
if london_end and show_swing_points
if not high_broken and not na(asian_high_line)
line.set_x2(asian_high_line, bar_index)
line.set_extend(asian_high_line, extend.none)
if not low_broken and not na(asian_low_line)
line.set_x2(asian_low_line, bar_index)
line.set_extend(asian_low_line, extend.none)
// Force close all trades at London session end (if enabled)
if london_end and force_london_close
if strategy.position_size != 0
// Extend boxes immediately before session close to prevent timing issues
if not na(current_profit_box)
// Ensure minimum 8 bars width or extend to current bar, whichever is longer
box_left = box.get_left(current_profit_box)
min_right = box_left + 8
final_right = math.max(min_right, bar_index)
box.set_right(current_profit_box, final_right)
current_profit_box := na // Clear reference after extending
if not na(current_sl_box)
// Ensure minimum 8 bars width or extend to current bar, whichever is longer
box_left = box.get_left(current_sl_box)
min_right = box_left + 8
final_right = math.max(min_right, bar_index)
box.set_right(current_sl_box, final_right)
current_sl_box := na // Clear reference after extending
strategy.close_all(comment="London Close")
trade_taken := false // Reset trade flag for next session
// Market structure detection after breakout (only during London session and before first BoS)
if show_market_structure and not na(breakout_direction) and london_active and not bos_detected
// Bullish structure tracking (HH, HL alternating)
if breakout_direction == "bullish"
// Check for Higher High pattern: Bullish candle followed by bearish candle
pattern_high = math.max(high , high)
prev_hh = na(last_hh_level) ? last_swing_high : last_hh_level
// HH Detection: Only if we expect HH next (no last structure or last was HL)
if (na(last_structure_type) or last_structure_type == "HL") and close > open and close < open and pattern_high > prev_hh and close > prev_hh
// Check consolidation
is_too_close = not na(last_high_bar) and (bar_index - last_high_bar) <= 4
should_create_hh = true
if is_too_close and structure_count > 0 and pattern_high <= last_hh_level
should_create_hh := false
if should_create_hh
structure_count := structure_count + 1
label.new(bar_index - 1, high + (high * 0.0003), "HH" + str.tostring(structure_count),
style=label.style_none, color=color.new(color.white, 100),
textcolor=color.white, size=size.small)
last_hh_level := pattern_high
last_swing_high := pattern_high
last_high_bar := bar_index
last_structure_type := "HH"
// HL Detection: Only if we expect HL next (last was HH)
pattern_low = math.min(low , low)
prev_hl = na(last_hl_level) ? last_swing_low : last_hl_level
if last_structure_type == "HH" and close < open and close > open and pattern_low > prev_hl and close > prev_hl
// Check consolidation
is_too_close = not na(last_low_bar) and (bar_index - last_low_bar) <= 4
should_create_hl = true
if is_too_close and pattern_low <= last_hl_level
should_create_hl := false
if should_create_hl
structure_count := structure_count + 1
label.new(bar_index - 1, low - (low * 0.0003), "HL" + str.tostring(structure_count),
style=label.style_none, color=color.new(color.white, 100),
textcolor=color.white, size=size.small)
last_hl_level := pattern_low
most_recent_hl := pattern_low // Update most recent HL for BoS detection
most_recent_hl_bar := bar_index - 1 // Store HL bar position
last_low_bar := bar_index
last_structure_type := "HL"
// Bearish structure tracking (LL, LH alternating)
if breakout_direction == "bearish"
// Check for Lower Low pattern: Bearish candle followed by bullish candle
pattern_low = math.min(low , low)
prev_ll = na(last_ll_level) ? last_swing_low : last_ll_level
// LL Detection: Only if we expect LL next (no last structure or last was LH)
if (na(last_structure_type) or last_structure_type == "LH") and close < open and close > open and pattern_low < prev_ll and close < prev_ll
// Check consolidation
is_too_close = not na(last_low_bar) and (bar_index - last_low_bar) <= 4
should_create_ll = true
if is_too_close and structure_count > 0 and pattern_low >= last_ll_level
should_create_ll := false
if should_create_ll
structure_count := structure_count + 1
label.new(bar_index - 1, low - (low * 0.0003), "LL" + str.tostring(structure_count),
style=label.style_none, color=color.new(color.white, 100),
textcolor=color.white, size=size.small)
last_ll_level := pattern_low
last_swing_low := pattern_low
last_low_bar := bar_index
last_structure_type := "LL"
// LH Detection: Only if we expect LH next (last was LL)
pattern_high = math.max(high , high)
prev_lh = na(last_lh_level) ? last_swing_high : last_lh_level
if last_structure_type == "LL" and close > open and close < open and pattern_high < prev_lh and close < prev_lh
// Check consolidation
is_too_close = not na(last_high_bar) and (bar_index - last_high_bar) <= 4
should_create_lh = true
if is_too_close and pattern_high >= last_lh_level
should_create_lh := false
if should_create_lh
structure_count := structure_count + 1
label.new(bar_index - 1, high + (high * 0.0003), "LH" + str.tostring(structure_count),
style=label.style_none, color=color.new(color.white, 100),
textcolor=color.white, size=size.small)
last_lh_level := pattern_high
most_recent_lh := pattern_high // Update most recent LH for BoS detection
most_recent_lh_bar := bar_index - 1 // Store LH bar position
last_high_bar := bar_index
last_structure_type := "LH"
// Check if we're within the cutoff period before London session end
current_minute = minute(time, session_timezone)
london_end_time_minutes = london_end_hour * 60 // Convert London end hour to minutes
current_time_minutes = current_hour * 60 + current_minute // Current time in minutes
// Calculate minutes remaining in London session
london_session_minutes_remaining = london_end_time_minutes - current_time_minutes
// Handle day rollover case (e.g., if london_end is 8:00 (480 min) and current is 23:30 (1410 min))
if london_session_minutes_remaining < 0
london_session_minutes_remaining := london_session_minutes_remaining + (24 * 60) // Add 24 hours in minutes
// Only allow trades if more than cutoff_minutes remaining in London session
allow_new_trades = london_session_minutes_remaining > cutoff_minutes
// Break of Structure (BoS) Detection and Trading Logic - Only first BoS per London session and outside cutoff period
if show_bos and london_active and show_market_structure and not bos_detected and not trade_taken and allow_new_trades
// Bullish BoS: Price closes below the most recent HL (after bullish breakout) - SELL SIGNAL
if breakout_direction == "bullish" and not na(most_recent_hl) and not na(most_recent_hl_bar)
// Check minimum distance requirement (at least 4 candles between BoS and HL)
if close < most_recent_hl and (bar_index - most_recent_hl_bar) >= 4
// Draw dotted line from HL position to BoS point
line.new(most_recent_hl_bar, most_recent_hl, bar_index, most_recent_hl,
color=bos_color, width=2, style=line.style_dotted, extend=extend.none)
// Calculate center position for BoS label
center_bar = math.round((most_recent_hl_bar + bar_index) / 2)
// Draw BoS label below the line for HL break
label.new(center_bar, most_recent_hl - (most_recent_hl * 0.0005), "BoS",
style=label.style_none, color=color.new(color.white, 100),
textcolor=bos_color, size=size.normal)
// SELL ENTRY
if not na(london_session_high) and not na(asian_absolute_low)
// Calculate stop loss based on settings
stop_loss_level = use_atr_sl ? close + (atr * atr_multiplier) : london_session_high
take_profit_level = asian_absolute_low
entry_price = close
// Calculate position size based on user settings
position_size = calculate_position_size(entry_price, stop_loss_level)
strategy.entry("SELL", strategy.short, qty=position_size, comment="BoS Sell")
strategy.exit("SELL EXIT", "SELL", stop=stop_loss_level, limit=take_profit_level, comment="SL/TP")
// Create trade visualization boxes (TradingView style) - minimum 8 bars width
// Blue profit zone box (from entry to take profit)
current_profit_box := box.new(left=bar_index, top=take_profit_level, right=bar_index + 8, bottom=entry_price,
bgcolor=color.new(color.blue, 70), border_width=0)
// Red stop loss zone box (from entry to stop loss)
current_sl_box := box.new(left=bar_index, top=entry_price, right=bar_index + 8, bottom=stop_loss_level,
bgcolor=color.new(color.red, 70), border_width=0)
trade_taken := true
bos_detected := true // Mark BoS as detected for this session
// Bearish BoS: Price closes above the most recent LH (after bearish breakout) - BUY SIGNAL
if breakout_direction == "bearish" and not na(most_recent_lh) and not na(most_recent_lh_bar)
// Check minimum distance requirement (at least 4 candles between BoS and LH)
if close > most_recent_lh and (bar_index - most_recent_lh_bar) >= 4
// Draw dotted line from LH position to BoS point
line.new(most_recent_lh_bar, most_recent_lh, bar_index, most_recent_lh,
color=bos_color, width=1, style=line.style_dotted, extend=extend.none)
// Calculate center position for BoS label
center_bar = math.round((most_recent_lh_bar + bar_index) / 2)
// Draw BoS label above the line for LH break
label.new(center_bar, most_recent_lh + (most_recent_lh * 0.0005), "BoS",
style=label.style_none, color=color.new(color.white, 100),
textcolor=bos_color, size=size.normal)
// BUY ENTRY
if not na(london_session_low) and not na(asian_absolute_high)
// Calculate stop loss based on settings
stop_loss_level = use_atr_sl ? close - (atr * atr_multiplier) : london_session_low
take_profit_level = asian_absolute_high
entry_price = close
// Calculate position size based on user settings
position_size = calculate_position_size(entry_price, stop_loss_level)
strategy.entry("BUY", strategy.long, qty=position_size, comment="BoS Buy")
strategy.exit("BUY EXIT", "BUY", stop=stop_loss_level, limit=take_profit_level, comment="SL/TP")
// Create trade visualization boxes (TradingView style) - minimum 8 bars width
// Blue profit zone box (from entry to take profit)
current_profit_box := box.new(left=bar_index, top=entry_price, right=bar_index + 8, bottom=take_profit_level,
bgcolor=color.new(color.blue, 70), border_width=0)
// Red stop loss zone box (from entry to stop loss)
current_sl_box := box.new(left=bar_index, top=stop_loss_level, right=bar_index + 8, bottom=entry_price,
bgcolor=color.new(color.red, 70), border_width=0)
trade_taken := true
bos_detected := true // Mark BoS as detected for this session
// Position close detection for extending boxes (based on Casper strategy)
if barstate.isconfirmed and strategy.position_size == 0 and strategy.position_size != 0
// Extend trade visualization boxes to exact exit point when position closes
if not na(current_profit_box)
// Ensure minimum 8 bars width or extend to current bar, whichever is longer
box_left = box.get_left(current_profit_box)
min_right = box_left + 8
final_right = math.max(min_right, bar_index)
box.set_right(current_profit_box, final_right)
current_profit_box := na // Clear reference after extending
if not na(current_sl_box)
// Ensure minimum 8 bars width or extend to current bar, whichever is longer
box_left = box.get_left(current_sl_box)
min_right = box_left + 8
final_right = math.max(min_right, bar_index)
box.set_right(current_sl_box, final_right)
current_sl_box := na // Clear reference after extending
// Backup safety check - extend boxes if position is closed but boxes still active
if not na(current_profit_box) and strategy.position_size == 0
box_left = box.get_left(current_profit_box)
min_right = box_left + 8
final_right = math.max(min_right, bar_index)
box.set_right(current_profit_box, final_right)
current_profit_box := na
if not na(current_sl_box) and strategy.position_size == 0
box_left = box.get_left(current_sl_box)
min_right = box_left + 8
final_right = math.max(min_right, bar_index)
box.set_right(current_sl_box, final_right)
current_sl_box := na
// Reset everything when new Asian session starts
if asian_start and show_swing_points
asian_session_high := na
asian_session_low := na
asian_high_bar := na
asian_low_bar := na
// Reset absolute levels
asian_absolute_high := na
asian_absolute_low := na
asian_high_line := na
asian_low_line := na
asian_high_label := na
asian_low_label := na
high_broken := false
low_broken := false
// Reset London session levels
london_session_high := na
london_session_low := na
// Reset market structure tracking
breakout_direction := na
last_hh_level := na
last_hl_level := na
last_ll_level := na
last_lh_level := na
last_swing_high := na
last_swing_low := na
last_high_bar := na
last_low_bar := na
structure_count := 0
last_structure_type := na
pending_high := na
pending_low := na
pending_high_bar := na
pending_low_bar := na
waiting_for_confirmation := false
// Reset BoS tracking
most_recent_hl := na
most_recent_lh := na
most_recent_hl_bar := na
most_recent_lh_bar := na
bos_detected := false
// Reset trading
trade_taken := false
// Reset current trade boxes
current_profit_box := na
current_sl_box := na
// Debug info (optional)
show_debug = input.bool(false, "Show Debug Info")
if show_debug
var table debug_table = table.new(position.top_right, 2, 3, bgcolor=color.white, border_width=1)
if barstate.islast
table.cell(debug_table, 0, 0, "Current Hour:", text_color=color.black)
table.cell(debug_table, 1, 0, str.tostring(current_hour), text_color=color.black)
table.cell(debug_table, 0, 1, "Asian Active:", text_color=color.black)
table.cell(debug_table, 1, 1, str.tostring((current_hour >= asian_start_hour) or (current_hour < asian_end_hour)), text_color=color.black)
table.cell(debug_table, 0, 2, "London Active:", text_color=color.black)
table.cell(debug_table, 1, 2, str.tostring((current_hour >= london_start_hour) and (current_hour < london_end_hour)), text_color=color.black)

BarCoreLibrary "BarCore"
BarCore is a foundational library for technical analysis, providing essential functions for evaluating the structural properties of candlesticks and inter-bar relationships.
It prioritizes ratio-based metrics (0.0 to 1.0) over absolute prices, making it asset-agnostic and ideal for robust pattern recognition, momentum analysis, and volume-weighted pressure evaluation.
Key modules:
- Structure & Range: High-precision bar and body metrics with relative positioning.
- Wick Dynamics: Absolute and relative wick analysis for identifying price rejection.
- Inter-bar Logic: Containment, coverage, and quantitative price overlap (Ratio-based).
- Gap Intelligence: Real body and price gaps with customizable significance thresholds.
- Flow & Pressure: Volume-weighted buying/selling pressure and Money Flow metrics.
isBuyingBar()
Checks if the bar is a bullish (up) bar, where close is greater than open.
Returns: bool True if the bar closed higher than it opened.
isSellingBar()
Checks if the bar is a bearish (down) bar, where close is less than open.
Returns: bool True if the bar closed lower than it opened.
barMidpoint()
Calculates the absolute midpoint of the bar's total range (High + Low) / 2.
Returns: float The midpoint price of the bar.
barRange()
Calculates the absolute size of the bar's total range (High to Low).
Returns: float The absolute difference between high and low.
barRangeMidpoint()
Calculates half of the bar's total range size.
Returns: float Half the bar's range size.
realBodyHigh()
Returns the higher price between the open and close.
Returns: float The top of the real body.
realBodyLow()
Returns the lower price between the open and close.
Returns: float The bottom of the real body.
realBodyMidpoint()
Calculates the absolute midpoint of the bar's real body.
Returns: float The midpoint price of the real body.
realBodyRange()
Calculates the absolute size of the bar's real body.
Returns: float The absolute difference between open and close.
realBodyRangeMidpoint()
Calculates half of the bar's real body size.
Returns: float Half the real body size.
upperWickRange()
Calculates the absolute size of the upper wick.
Returns: float The range from high to the real body high.
lowerWickRange()
Calculates the absolute size of the lower wick.
Returns: float The range from the real body low to low.
openRatio()
Returns the location of the open price relative to the bar's total range (0.0 at low to 1.0 at high).
Returns: float The ratio of the distance from low to open, divided by the total range.
closeRatio()
Returns the location of the close price relative to the bar's total range (0.0 at low to 1.0 at high).
Returns: float The ratio of the distance from low to close, divided by the total range.
realBodyRatio()
Calculates the ratio of the real body size to the total bar range.
Returns: float The real body size divided by the bar range. Returns 0 if barRange is 0.
upperWickRatio()
Calculates the ratio of the upper wick size to the total bar range.
Returns: float The upper wick size divided by the bar range. Returns 0 if barRange is 0.
lowerWickRatio()
Calculates the ratio of the lower wick size to the total bar range.
Returns: float The lower wick size divided by the bar range. Returns 0 if barRange is 0.
upperWickToBodyRatio()
Calculates the ratio of the upper wick size to the real body size.
Returns: float The upper wick size divided by the real body size. Returns 0 if realBodyRange is 0.
lowerWickToBodyRatio()
Calculates the ratio of the lower wick size to the real body size.
Returns: float The lower wick size divided by the real body size. Returns 0 if realBodyRange is 0.
totalWickRatio()
Calculates the ratio of the total wick range (Upper Wick + Lower Wick) to the total bar range.
Returns: float The total wick range expressed as a ratio of the bar's total range. Returns 0 if barRange is 0.
isBodyExpansion()
Checks if the current bar's real body range is larger than the previous bar's real body range (body expansion).
Returns: bool True if realBodyRange() > realBodyRange() .
isBodyContraction()
Checks if the current bar's real body range is smaller than the previous bar's real body range (body contraction).
Returns: bool True if realBodyRange() < realBodyRange() .
isWithinPrevBar(inclusive)
Checks if the current bar's range is entirely within the previous bar's range.
Parameters:
inclusive (bool) : If true, allows equality (<=, >=). Default is false.
Returns: bool True if High < High AND Low > Low .
isCoveringPrevBar(inclusive)
Checks if the current bar's range fully covers the entire previous bar's range.
Parameters:
inclusive (bool) : If true, allows equality (<=, >=). Default is false.
Returns: bool True if High > High AND Low < Low .
isWithinPrevBody(inclusive)
Checks if the current bar's real body is entirely inside the previous bar's real body.
Parameters:
inclusive (bool) : If true, allows equality (<=, >=). Default is false.
Returns: bool True if the current body is contained inside the previous body.
isCoveringPrevBody(inclusive)
Checks if the current bar's real body fully covers the previous bar's real body.
Parameters:
inclusive (bool) : If true, allows equality (<=, >=). Default is false.
Returns: bool True if the current body fully covers the previous body.
isOpenWithinPrevBody(inclusive)
Checks if the current bar's open price falls within the real body range of the previous bar.
Parameters:
inclusive (bool) : If true, includes the boundary prices. Default is false.
Returns: bool True if the open price is between the previous bar's real body high and real body low.
isCloseWithinPrevBody(inclusive)
Checks if the current bar's close price falls within the real body range of the previous bar.
Parameters:
inclusive (bool) : If true, includes the boundary prices. Default is false.
Returns: bool True if the close price is between the previous bar's real body high and real body low.
isPrevOpenWithinBody(inclusive)
Checks if the previous bar's open price falls within the current bar's real body range.
Parameters:
inclusive (bool) : If true, includes the boundary prices. Default is false.
Returns: bool True if open is between the current bar's real body high and real body low.
isPrevCloseWithinBody(inclusive)
Checks if the previous bar's closing price falls within the current bar's real body range.
Parameters:
inclusive (bool) : If true, includes the boundary prices. Default is false.
Returns: bool True if close is between the current bar's real body high and real body low.
isOverlappingPrevBar()
Checks if there is any price overlap between the current bar's range and the previous bar's range.
Returns: bool True if the current bar's range has any intersection with the previous bar's range.
bodyOverlapRatio()
Calculates the percentage of the current real body that overlaps with the previous real body.
Returns: float The overlap ratio (0.0 to 1.0). 1.0 means the current body is entirely within the previous body's price range.
isCompletePriceGapUp()
Checks for a complete price gap up where the current bar's low is strictly above the previous bar's high, meaning there is zero price overlap between the two bars.
Returns: bool True if the current low is greater than the previous high.
isCompletePriceGapDown()
Checks for a complete price gap down where the current bar's high is strictly below the previous bar's low, meaning there is zero price overlap between the two bars.
Returns: bool True if the current high is less than the previous low.
isRealBodyGapUp()
Checks for a gap between the current and previous real bodies.
Returns: bool True if the current body is completely above the previous body.
isRealBodyGapDown()
Checks for a gap between the current and previous real bodies.
Returns: bool True if the current body is completely below the previous body.
gapRatio()
Calculates the percentage difference between the current open and the previous close, expressed as a decimal ratio.
Returns: float The gap ratio (positive for gap up, negative for gap down). Returns 0 if the previous close is 0.
gapPercentage()
Calculates the percentage difference between the current open and the previous close.
Returns: float The gap percentage (positive for gap up, negative for gap down). Returns 0 if previous close is 0.
isGapUp()
Checks for a basic gap up, where the current bar's open is strictly higher than the previous bar's close. This is the minimum condition for a gap up.
Returns: bool True if the current open is greater than the previous close (i.e., gapRatio is positive).
isGapDown()
Checks for a basic gap down, where the current bar's open is strictly lower than the previous bar's close. This is the minimum condition for a gap down.
Returns: bool True if the current open is less than the previous close (i.e., gapRatio is negative).
isSignificantGapUp(minRatio)
Checks if the current bar opened significantly higher than the previous close, as defined by a minimum percentage ratio.
Parameters:
minRatio (float) : The minimum required gap percentage ratio. Default is 0.03 (3%).
Returns: bool True if the gap ratio (open vs. previous close) is greater than or equal to the minimum ratio.
isSignificantGapDown(minRatio)
Checks if the current bar opened significantly lower than the previous close, as defined by a minimum percentage ratio.
Parameters:
minRatio (float) : The minimum required gap percentage ratio. Default is 0.03 (3%).
Returns: bool True if the absolute value of the gap ratio (open vs. previous close) is greater than or equal to the minimum ratio.
trueRangeComponentHigh()
Calculates the absolute distance from the current bar's High to the previous bar's Close, representing one of the components of the True Range.
Returns: float The absolute difference: |High - Close |.
trueRangeComponentLow()
Calculates the absolute distance from the current bar's Low to the previous bar's Close, representing one of the components of the True Range.
Returns: float The absolute difference: |Low - Close |.
isUpperWickDominant(minRatio)
Checks if the upper wick is significantly long relative to the total range.
Parameters:
minRatio (float) : Minimum ratio of the wick to the total bar range. Default is 0.7 (70%).
Returns: bool True if the upper wick dominates the bar's range.
isUpperWickNegligible(maxRatio)
Checks if the upper wick is very small relative to the total range.
Parameters:
maxRatio (float) : Maximum ratio of the wick to the total bar range. Default is 0.05 (5%).
Returns: bool True if the upper wick is negligible.
isLowerWickDominant(minRatio)
Checks if the lower wick is significantly long relative to the total range.
Parameters:
minRatio (float) : Minimum ratio of the wick to the total bar range. Default is 0.7 (70%).
Returns: bool True if the lower wick dominates the bar's range.
isLowerWickNegligible(maxRatio)
Checks if the lower wick is very small relative to the total range.
Parameters:
maxRatio (float) : Maximum ratio of the wick to the total bar range. Default is 0.05 (5%).
Returns: bool True if the lower wick is negligible.
isSymmetric(maxTolerance)
Checks if the upper and lower wicks are roughly equal in length.
Parameters:
maxTolerance (float) : Maximum allowable percentage difference between the two wicks. Default is 0.15 (15%).
Returns: bool True if wicks are symmetric within the tolerance level.
isMarubozuBody(minRatio)
Candle with a very large body relative to the total range (minimal wicks).
Parameters:
minRatio (float) : Minimum body size ratio. Default is 0.9 (90%).
Returns: bool True if the bar has minimal wicks (Marubozu body).
isLargeBody(minRatio)
Candle with a large body relative to the total range.
Parameters:
minRatio (float) : Minimum body size ratio. Default is 0.6 (60%).
Returns: bool True if the bar has a large body.
isSmallBody(maxRatio)
Candle with a small body relative to the total range.
Parameters:
maxRatio (float) : Maximum body size ratio. Default is 0.4 (40%).
Returns: bool True if the bar has small body.
isDojiBody(maxRatio)
Candle with a very small body relative to the total range (indecision).
Parameters:
maxRatio (float) : Maximum body size ratio. Default is 0.1 (10%).
Returns: bool True if the bar has a very small body.
isLowerWickExtended(minRatio)
Checks if the lower wick is significantly extended relative to the real body size.
Parameters:
minRatio (float) : Minimum required ratio of the lower wick length to the real body size. Default is 2.0 (Lower wick must be at least twice the body's size).
Returns: bool True if the lower wick's length is at least `minRatio` times the size of the real body.
isUpperWickExtended(minRatio)
Checks if the upper wick is significantly extended relative to the real body size.
Parameters:
minRatio (float) : Minimum required ratio of the upper wick length to the real body size. Default is 2.0 (Upper wick must be at least twice the body's size).
Returns: bool True if the upper wick's length is at least `minRatio` times the size of the real body.
isStrongBuyingBar(minCloseRatio, maxOpenRatio)
Checks for a bar with strong bullish momentum (open near low, close near high), indicating high conviction.
Parameters:
minCloseRatio (float) : Minimum required ratio for the close location (relative to range, e.g., 0.7 means close must be in the top 30%). Default is 0.7 (70%).
maxOpenRatio (float) : Maximum allowed ratio for the open location (relative to range, e.g., 0.3 means open must be in the bottom 30%). Default is 0.3 (30%).
Returns: bool True if the bar is bullish, opened in the low extreme, and closed in the high extreme.
isStrongSellingBar(maxCloseRatio, minOpenRatio)
Checks for a bar with strong bearish momentum (open near high, close near low), indicating high conviction.
Parameters:
maxCloseRatio (float) : Maximum allowed ratio for the close location (relative to range, e.g., 0.3 means close must be in the bottom 30%). Default is 0.3 (30%).
minOpenRatio (float) : Minimum required ratio for the open location (relative to range, e.g., 0.7 means open must be in the top 30%). Default is 0.7 (70%).
Returns: bool True if the bar is bearish, opened in the high extreme, and closed in the low extreme.
isWeakBuyingBar(maxCloseRatio, maxBodyRatio)
Identifies a bar that is technically bullish but shows significant weakness, characterized by a failure to close near the high and a small body size.
Parameters:
maxCloseRatio (float) : Maximum allowed ratio for the close location relative to the range (e.g., 0.6 means the close must be in the bottom 60% of the bar's range). Default is 0.6 (60%).
maxBodyRatio (float) : Maximum allowed ratio for the real body size relative to the bar's range (e.g., 0.4 means the body is small). Default is 0.4 (40%).
Returns: bool True if the bar is bullish, but its close is weak and its body is small.
isWeakSellingBar(minCloseRatio, maxBodyRatio)
Identifies a bar that is technically bearish but shows significant weakness, characterized by a failure to close near the low and a small body size.
Parameters:
minCloseRatio (float) : Minimum required ratio for the close location relative to the range (e.g., 0.4 means the close must be in the top 60% of the bar's range). Default is 0.4 (40%).
maxBodyRatio (float) : Maximum allowed ratio for the real body size relative to the bar's range (e.g., 0.4 means the body is small). Default is 0.4 (40%).
Returns: bool True if the bar is bearish, but its close is weak and its body is small.
balanceOfPower()
Measures the net pressure of buyers vs. sellers within the bar, normalized to the bar's range.
Returns: float A value between -1.0 (strong selling) and +1.0 (strong buying), representing the strength and direction of the close relative to the open.
buyingPressure()
Measures the net buying volume pressure based on the close location and volume.
Returns: float A numerical value representing the volume weighted buying pressure.
sellingPressure()
Measures the net selling volume pressure based on the close location and volume.
Returns: float A numerical value representing the volume weighted selling pressure.
moneyFlowMultiplier()
Calculates the Money Flow Multiplier (MFM), which is the price component of Money Flow and CMF.
Returns: float A normalized value from -1.0 (strong selling) to +1.0 (strong buying), representing the net directional pressure.
moneyFlowVolume()
Calculates the Money Flow Volume (MFV), which is the Money Flow Multiplier weighted by the bar's volume.
Returns: float A numerical value representing the volume-weighted money flow. Positive = buying dominance; negative = selling dominance.
isAccumulationBar()
Checks for basic accumulation on the current bar, requiring both positive Money Flow Volume and a buying bar (closing higher than opening).
Returns: bool True if the bar exhibits buying dominance through its internal range location and is a buying bar.
isDistributionBar()
Checks for basic distribution on the current bar, requiring both negative Money Flow Volume and a selling bar (closing lower than opening).
Returns: bool True if the bar exhibits selling dominance through its internal range location and is a selling bar.

Daily Floor PivotsDaily Floor Pivots with Comprehensive Statistical Analysis
Overview
This indicator combines traditional floor pivot levels with golden zone analysis and comprehensive statistical insights derived from 15 years of historical NQ futures data. While the pivot levels and golden zones can be applied to any instrument, the statistical tables are specifically calibrated for NQ/MNQ futures based on analysis of 2,482 NY Regular Trading Hours (RTH) sessions from 2010-2025.
What Makes This Indicator Original
Unlike standard pivot indicators that merely plot levels, this tool provides:
Enhanced Golden Zone Analysis: Calculates not only the main golden zone (0.5-0.618 retracement of previous day's range) but also golden zones between each pivot pair (PP-R1, R1-R2, R2-R3, PP-S1, S1-S2, S2-S3)
Data-Driven Statistical Tables: Two comprehensive tables displaying real statistics from 2,482 trading days of NQ analysis, including:
Probability-based touch rates and continuation patterns
Context-aware statistics based on opening position
Gap analysis and behavioral patterns
First touch dynamics and time-to-reach averages
Granular Customization: Every visual element and statistical section can be independently toggled, allowing traders to focus on what matters most to their strategy
How It Works
Pivot Calculation Methodology
The indicator uses the standard floor pivot formula based on the previous day's price action:
Pivot Point (PP) = (Previous High + Previous Low + Previous Close) / 3
Resistance Levels: R1, R2, R3 calculated from PP and previous range
Support Levels: S1, S2, S3 calculated from PP and previous range
Golden Zone Calculations
Main Golden Zone: The 0.5 to 0.618 Fibonacci retracement of the previous day's range, representing a key reversal and continuation area.
Inter-Pivot Golden Zones: For each adjacent pivot pair, golden zones are calculated as:
Resistance pairs (PP→R1, R1→R2, R2→R3): 0.5-0.618 range from the lower pivot
Support pairs (PP→S1, S1→S2, S2→S3): 0.382-0.5 range from the upper pivot
These zones represent high-probability areas where price tends to react when moving between pivot levels.
Statistical Analysis Source
All statistics displayed in the tables are derived from external Python analysis of 15 years of 1-minute NQ futures data (2010-2025), specifically analyzing NY RTH sessions (9:30 AM - 4:00 PM EST). The analysis tracked:
2,482 complete trading days
Intraday pivot touches and closes
Opening position context
Gap behavior relative to previous day
Time-of-day patterns
Sequential pivot interactions
IMPORTANT: While the pivot levels and golden zones are universally applicable mathematical calculations that work on any instrument, the statistical percentages shown in the tables are specific to NQ/MNQ behavior only. Do not assume these statistics transfer to other instruments.
Configuration Guide
Basic Settings
Number of Periods Back (1-20, default: 3)
Controls how many historical pivot periods are displayed on the chart
Setting to 1 shows only current day's pivots
Higher values show more historical context
Labels Position (Left/Right)
Choose whether pivot labels appear on the left or right side of each level line
Line Width (1-5, default: 2)
Adjust the thickness of all pivot and golden zone lines
Golden Zone Customization
Show Daily Golden Zone (0.5-0.618)
Toggle the main golden zone on/off
When enabled, displays a shaded box between the 0.5 and 0.618 retracement levels
Line Color / Fill Color
Customize the appearance of the main golden zone
Fill color determines the shaded box transparency
Show Labels / Show Prices
Control whether "0.5" and "0.618" labels appear
Control whether price values are displayed on labels
Inter-Pivot Golden Zones
Six toggle options allow you to show/hide individual golden zones:
PP to R1 / PP to S1: Most frequently touched (60.8% / 50.9%)
R1 to R2 / S1 to S2: Moderately touched (25.2% / 24.0%)
R2 to R3 / S2 to S3: Rarely touched (9.4% / 10.5%)
Line Color / Fill Color: Customize appearance of all inter-pivot zones
Show Labels / Show Prices: Control labeling for inter-pivot zones
Usage Tip: Disable outer zones (R2-R3, S2-S3) on lower volatility days to reduce chart clutter.
Pivot Display
Show Support/Resistance Levels: Master toggle for all pivot lines
Show SR Labels / Show SR Prices: Control labeling on pivot levels
Individual level toggles and colors:
PP (Pivot Point): The central reference point
R1/S1: Primary resistance/support (38.9% / 35.4% touch rate)
R2/S2: Secondary levels (15.6% / 16.1% touch rate)
R3/S3: Extended levels (5.1% / 7.3% touch rate)
Color Customization: Each level's color can be independently set
Overall Statistics Table
Show Overall Statistics Table: Master toggle
Table Size: tiny/small/normal/large/huge/auto
Table Position: Top Left/Top Right/Bottom Left/Bottom Right
Section Toggles (enable/disable individual sections):
Current Session Info
Touch & Close Rates
Continue & Reject Rates
First Touch Statistics
Golden Zone Statistics
Daily Close Distribution
Highest/Lowest Levels Reached
Context Statistics Table
Show Context Statistics Table: Master toggle
Table Size: tiny/small/normal/large/huge/auto
Table Position: Top Left/Top Right/Bottom Left/Bottom Right
Section Toggles:
Current Opening Zone
Opening Zone Statistics
Previous Day Gap Context
Understanding the Statistical Tables
TABLE 1: OVERALL STATISTICS
This table presents universal statistics from 2,482 days of NQ analysis.
Current Session Info
Displays real-time context for the active session:
Open: Where the current RTH session opened relative to pivots (e.g., "GZ_TO_R1" means opened between the PP-R1 golden zone and R1)
Now: Current price position relative to pivots
Direction: Bull (close > open), Bear (close < open), or Flat
How to use: This section helps you quickly understand where price opened and where it currently is, providing immediate context for the day's action.
Touch & Close Rates
Shows probability that each pivot level will be reached during RTH:
Touch %: Percentage of days where price touched this level at any point
Example: R1 touched 38.9% of days, PP touched 57.5% of days
Close %: Percentage of days where price closed beyond this level
Example: R1 close beyond happened 39.8% of days
How to interpret:
Higher touch rates indicate more reliable levels for intraday targeting
The difference between touch and close rates shows rejection frequency
PP has the highest touch rate (57.5%), making it the most magnetic level
Outer levels (R3/S3) have low touch rates (5.1%/7.3%), indicating rare extension days
Continue & Reject Rates
When a level is touched, these statistics show what happens next:
Continue %: Probability price continues through the level
Example: When PP is touched, price continues 88.1% of the time
Reject %: Probability price rejects from the level and reverses
Example: When R1 is touched, price rejects 50.9% of the time
How to interpret:
PP shows highest continuation (88.1%), confirming it's a poor reversal level
Support levels (S1/S2/S3) show strong rejection rates (62.5%/60.7%/56.1%), making them better reversal candidates
Continuation rates above 80% suggest the level is better as a target than an entry
First Touch Statistics
Analyzes which pivot is typically touched first during RTH:
1st Touch %: Probability this level is the first pivot encountered
PP is first touched 37.1% of days (most common)
R1 is first touched 26.0% of days
S1 is first touched 10.9% of days
1st→Continue: If this level is touched first, probability of continuation
S1-S3 show 95.6%-100% continuation when touched first
This means when price reaches support first, it usually continues lower
Avg Time: Minutes after 9:30 AM EST before first touch
PP: 1h 6m average
S3: 19m average (when bearish)
R3: 3h 19m average (when bullish)
How to interpret:
Opening away from PP means higher probability of reaching extremes (R2/R3 or S2/S3)
When support is touched first (within first 2 hours), expect continuation lower
Late-day first touches (after 2 PM) often indicate strong trending days
Multi-Touch: Shows how often levels are tested multiple times (92.8%-95.0% across all levels)
Golden Zone Statistics
Main GZ: 58.5% touch rate for the 0.5-0.618 zone
Inter-Pivot zones:
PP-R1: 60.8% (highest probability)
PP-S1: 50.9%
R1-R2: 25.2%
S1-S2: 24.0%
R2-R3: 9.4%
S2-S3: 10.5%
How to interpret:
Main GZ is touched more often than any individual resistance level
PP-R1 and PP-S1 golden zones are high-probability mean reversion areas
Outer golden zones (R2-R3, S2-S3) are only relevant on high volatility days
Daily Close Distribution
Shows where RTH sessions typically close:
Above/Below PP: 58.5% close above, 41.5% below (slight bullish bias)
Above R1: 24.5% of days
Below S1: 18.7% of days
In GZ: Only 6.3% close in the golden zone (typically transits through it)
How to interpret:
Most days (58.5%) have bullish bias (close above PP)
Less than 25% of days are strong trending days (beyond R1/S1)
Golden zone is an action area, not a resting area
Highest/Lowest Levels Reached
Distribution of the most extreme level reached:
High Resist: R1 (26.0%), R2 (10.8%), R3 (5.1%)
Low Support: S1 (35.4%), S2 (1.9%), S3 (0.6%)
How to interpret:
Most days don't reach beyond R1 or S1
R3/S3 are rare events (5.1%/0.6%), indicating major trending days
S1 is reached as lowest level more often than R1 as highest, suggesting downside is more frequently tested
TABLE 2: CONTEXT STATISTICS
This table provides conditional statistics based on how the session opened.
Current Opening Zone
Displays which of 13 possible zones the RTH session opened in:
ABOVE_R3, R2_TO_R3, R1_TO_R2, GZ_TO_R1, IN_GZ, PP_TO_GZ, AT_PP, GZ_TO_PP, S1_TO_GZ, S2_TO_S1, S3_TO_S2, BELOW_S3
How to use: This immediately tells you the market structure and what type of day to expect.
Opening Zone Statistics
Detailed statistics for the current opening zone (only shows for 6 major zones):
For each zone, you see:
Occurs: How often this opening scenario happens
GZ_TO_R1: 38.4% (most common)
AT_PP: 12.8%
S1_TO_GZ: 24.2%
R1_TO_R2: 9.4%
S2_TO_S1: 6.3%
IN_GZ: 3.8%
Bull/Bear %: Close direction probability
Example: GZ_TO_R1 is perfectly balanced (50.0% bull / 49.6% bear)
R1_TO_R2 is bullish (58.1% bull / 41.0% bear)
Levels Hit: Probability of reaching each pivot level from this opening
Helps identify high-probability targets
Example: From GZ_TO_R1, PP is hit 52.9%, R1 is hit 49.0%, S1 is hit 21.6%
How to interpret:
GZ_TO_R1 (most common): Balanced day, watch PP and GZ for direction clues
AT_PP: Slight bullish bias (56.9%), high chance of touching both PP (92.8%) and GZ (90.3%)
R1_TO_R2: Bullish bias (58.1%), expect continuation to R2 (58.1% chance)
S2_TO_S1: Bullish reversal setup (59.9%), very high chance of S1 touch (82.8%)
IN_GZ: Rare opening (3.8%), bullish bias, virtually guaranteed GZ touch (100%)
Previous Day Gap Context
Shows current gap scenario and typical behavior:
Three scenarios:
GAP UP: Opened Above Yesterday's High (20.5% of days)
R1 Touch: 65.9% (high probability)
R2 Touch: 42.1%
S1 Touch: 15.0% (low probability)
Bias: Bullish continuation
GAP DOWN: Opened Below Yesterday's Low (11.3% of days)
S1 Touch: 71.5% (high probability)
S2 Touch: 55.2%
R1 Touch: 12.1% (low probability)
Bias: Bearish continuation
NO GAP: Opened Within Yesterday's Range (68.2% of days)
PP Touch: 69.5%
GZ Touch: 71.7%
R1 Touch: 35.2%
Bias: Balanced (watch for direction at PP/GZ)
How to interpret:
Gap days (up or down) tend to continue in the gap direction
When gapping, fade trades are low probability (15.0% and 12.1%)
Most days (68.2%) open within previous range, making PP and GZ critical decision zones
The "bias" line provides clear directional guidance for trade selection
Practical Application Examples
Example 1: Standard Day Setup
Scenario: RTH opens at 20,450
PP: 20,400
GZ: 20,390-20,395
R1: 20,425
Previous day high: 20,460
What the tables tell you:
Opening Zone: "GZ_TO_R1" (38.4% occurrence)
Gap Context: "NO GAP" (68.2% occurrence)
Expected behavior: Balanced (50/50 bull/bear)
High probability: PP touch (52.9%), GZ touch (56.8%)
Moderate probability: R1 touch (49.0%), S1 touch (21.6%)
Trade plan:
Wait for price to reach PP (52.9% chance) or GZ (56.8% chance)
Look for directional confirmation at these levels
First target R1 if bullish, S1 if bearish
Avoid assuming direction without confirmation (perfectly balanced opening)
Example 2: Gap Up Day
Scenario: RTH opens at 20,510
Previous day high: 20,460
R1: 20,425
R2: 20,475
What the tables tell you:
Gap Context: "GAP UP" (20.5% occurrence)
R1 touch: 65.9% probability
R2 touch: 42.1% probability
S1 touch: Only 15.0% probability
Bias: Bullish continuation
Trade plan:
Favor long setups
Target R1 first (65.9% chance), then R2 (42.1%)
If R1 breaks, R2 becomes likely target
Shorting is low probability (only 15.0% reach S1)
Example 3: Opening in Golden Zone
Scenario: RTH opens at 20,393
PP: 20,400
GZ: 20,390-20,395
What the tables tell you:
Opening Zone: "IN_GZ" (rare, only 3.8% occurrence)
Bullish bias: 58.1%
GZ touch: 100% (guaranteed - already there)
PP touch: 75.3%
R1 touch: 41.9%
Trade plan:
Expect price to test PP (75.3% chance)
Slight bullish bias suggests long setups better than shorts
Watch how price reacts at PP - likely to continue to R1 (41.9%)
This is an uncommon opening, suggesting potential for larger moves
Best Practices
Match Your Instrument: Remember, statistics are NQ-specific. If trading other instruments, use the levels but disregard the statistical percentages.
Combine with Price Action: Use the statistics for probability context, not as standalone signals. Always confirm with price action, volume, and your trading methodology.
Adapt Table Display: Don't display all sections all the time. Toggle based on your trading phase:
Pre-market: Focus on "Gap Context" to understand the setup
Market open: Watch "Opening Zone Statistics" for directional bias
Intraday: Monitor "Current Session Info" for position tracking
Understand Context: A 60% touch rate doesn't mean guaranteed—it means 40% of days don't touch. Use these probabilities to size positions and manage expectations.
Inter-Pivot Golden Zones: These are most useful when price is already in motion toward a level. For example, if price breaks above PP heading to R1, the PP-R1 golden zone (60.8% touch rate) becomes a high-probability pullback area.
Time Awareness: The "Avg Time" statistics help you understand urgency. If it's 10:30 AM and S1 hasn't been touched (average is 55 minutes), the window for bearish moves is closing.
Technical Notes
Time Zone: All times referenced are NY/EST
Session Definition: RTH is 9:30 AM - 4:00 PM EST
Calculation Period: Pivots update daily based on previous 24-hour period (18:00 previous day to 17:00 current day)
Data Source: Statistics derived from 12 years of NQ 1-minute futures data (2013-2025)
Sample Size: 2,482 complete RTH trading sessions
Disclaimer
This indicator provides statistical probabilities based on historical NQ futures data. Past performance does not guarantee future results. The statistical tables are educational tools and should not be the sole basis for trading decisions. Always:
Use proper risk management
Combine with your own analysis
Understand that probabilities are not certainties
Remember that statistics are instrument-specific (NQ/MNQ only)
Credits
Statistical analysis performed using Python analysis of 12 years of historical NQ futures data. All pivot and golden zone calculations use standard mathematical formulas applicable to any instrument.
