YinYang RSI Volume Trend StrategyThere are many strategies that use RSI or Volume but very few that take advantage of how useful and important the two of them combined are. This strategy uses the Highs and Lows with Volume and RSI weighted calculations on top of them. You may be wondering how much of an impact Volume and RSI can have on the prices; the answer is a lot and we will discuss those with plenty of examples below, but first…
How does this strategy work?
It’s simple really, when the purchase source crosses above the inner low band (red) it creates a Buy or Long. This long has a Trailing Stop Loss band (the outer low band that's also red) that can be adjusted in the Settings. The Stop Loss is based on a % of the inner low band’s price and by default it is 0.1% lower than the inner band’s price. This Stop Loss is not only a stop loss but it can also act as a Purchase Available location.
You can get back into a trade after a stop loss / take profit has been hit when your Reset Purchase Availability After condition has been met. This can either be at Stop Loss, Entry or None.
It is advised to allow it to reset in case the stop loss was a fake out but the call was right. Sometimes it may trigger stop loss multiple times in a row, but you don’t lose much on stop loss and you gain lots when the call is right.
The Take Profit location is the basis line (white). Take Profit occurs when the Exit Source (close, open, high, low or other) crosses the basis line and then on a different bar the Exit Source crosses back over the basis line. For example, if it was a Long and the bar’s Exit Source closed above the basis line, and then 2 bars later its Exit Source closed below the basis line, Take Profit would occur. You can disable Take Profit in Settings, but it is very useful as many times the price will cross the Basis and then correct back rather than making it all the way to the opposing zone.
Longs:
If for instance your Long doesn’t need to Take Profit and instead reaches the top zone, it will close the position when it crosses above the inner top line (green).
Please note you can change the Exit Source too which is what source (close, open, high, low) it uses to end the trades.
The Shorts work the same way as the Long but just opposite, they start when the purchase source crosses under the inner upper band (green).
Shorts:
Shorts take profit when it crosses under the basis line and then crosses back.
Shorts will Stop loss when their outer upper band (green) is crossed with the Exit Source.
Short trades are completed and closed when its Exit Source crosses under the inner low red band.
So, now that you understand how the strategy works, let’s discuss why this strategy works and how it is profitable.
First we will discuss Volume as we deem it plays a much bigger role overall and in our strategy:
As I’m sure many of you know, Volume plays a huge factor in how much something moves, but it also plays a role in the strength of the movement. For instance, let’s look at two scenarios:
Bitcoin’s price goes up $1000 in 1 Day but the Volume was only 10 million
Bitcoin’s price goes up $200 in 1 Day but the Volume was 40 million
If you were to only look at the price, you’d say #1 was more important because the price moved x5 the amount as #2, but once you factor in the volume, you know this is not true. The reason why Volume plays such a huge role in Price movement is because it shows there is a large Limit Order battle going on. It means that both Bears and Bulls believe that price is a good time to Buy and Sell. This creates a strong Support and Resistance price point in this location. If we look at scenario #2, when there is high volume, especially if it is drastically larger than the average volume Bitcoin was displaying recently, what can we decipher from this? Well, the biggest take away is that the Bull’s won the battle, and that likely when that happens we will see bullish movement continuing to happen as most of the Bears Limit Orders have been fulfilled. Whereas with #2, when large price movement happens and Bitcoin goes up $1000 with low volume what can we deduce? The main takeaway is that Bull’s pressured the price up with Market Orders where they purchased the best available price, also what this means is there were very few people who were wanting to sell. This generally dictates that Whale Limit orders for Sells/Shorts are much higher up and theres room for movement, but it also means there is likely a whale that is ready to dump and crash it back down.
You may be wondering, what did this example have to do with YinYang RSI Volume Trend Strategy? Well the reason we’ve discussed this is because we use Volume multiple times to apply multiplications in our calculations to add large weight to the price when there is lots of volume (this is applied both positively and negatively). For instance, if the price drops a little and there is high volume, our strategy will move its bounds MUCH lower than the price actually dropped, and if there was low volume but the price dropped A LOT, our strategy will only move its bounds a little. We believe this reflects higher levels of price accuracy than just price alone based on the examples described above.
Don’t believe us?
Here is with Volume NOT factored in (VWMA = SMA and we remove our Volume Filter calculation):
Which produced -$2880 Profit
Here is with our Volume factored in:
Which produced $553,000 (55.3%)
As you can see, we wen’t from $-2800 profit with volume not factored to $553,000 with volume factored. That's quite a big difference! (Please note previous success does not predict future success we are simply displaying the $ amounts as example).
Now how about RSI and why does it matter in this strategy?
As I’m sure most of you are aware, RSI is one of the leading indicators used in trading. For this reason we figured it would only make sense to incorporate it into our calculations. We fiddled with RSI for quite awhile and sometimes what logically seems to be the right way to use it isn’t. Now, because of this, our RSI calculation is a little odd, but basically what we’re doing is we calculate the RSI, then turn it into a percentage (between 0-1) that can easily be multiplied to the price point we need. The price point we use is the difference between our high purchase zone and our low purchase zone. This allows us to see how much price movement there is between zones. We multiply our zone size with our RSI multiplication and we get the amount we will add +/- to our basis line (white line). This officially creates the NEW high and low purchase zones that we are actually using and displaying in our trades.
If you found that confusing, here are some examples to why it is an important calculation for this strategy:
Before RSI factored in:
Which produced 27.8% Profit
After RSI factored in:
Which produced 553% Profit
As you can see, the RSI makes not only the purchase zones more accurate, but it also greatly increases the profit the strategy is able to make. It also helps ensure an relatively linear profit slope so you know it is reliable with its trades.
This strategy can work on pretty much anything, but you should tweak the values a bit for each pair you are trading it with for best results.
We hope you can find some use out of this simple but effective strategy, if you have any questions, comments or concerns please let us know.
HAPPY TRADING!
Search in scripts for "trend"

Crunchster's Turtle and Trend SystemThis is a combination of two popular systematic trading strategies - in the trend following category.
The strategy is designed for use on the daily timeframe. Specific features of this system are outlined below:
1. Two different strategies to choose from, "Trend" which is a volatility adjusted Exponential Moving Average (EMA) crossover strategy and "Breakout" which is my adaptation of the well documented "Turtle Strategy"
2. Uses advanced position sizing and risk management, usually reserved for institutional portfolio management, a proven technique utilised by Commodity Trading Advisors and Managed Futures funds (Algo/Quant funds).
"Trend" uses a fast (user defined) and slow EMA crossover, where the slow length is 5 times the fast length. The resulting signal is adjusted for the volatility of returns over a 252 lookback period, which helps to normalise the signal across different assets. The system goes long or short when it detects a new trend has formed.
"Break" uses the highest high or lowest low over a user defined lookback period to define the recent range. This is converted into a price normalised signal to allow the system to detect when a breakout occurs. The system goes long or short based off the breakout signal.
Position sizing is based on recent price volatility and the user defined annualised risk target. In essence positions are inverse volatility weighted, so larger size is opened during lower volatility and smaller size during increased volatility. Recent volatility is calculated as the standard deviation of returns with 14 period lookback, then extrapolated into an annualised volatility of expected returns. Annualised recent volatility is then referenced to the risk target set by the user to adjust the position size. The default settings are a conservative 15% annual risk target/volatility. Initial capital should be set as the maximum risk capital per trade (ie if $10,000 total capital and 10% risk per trade, initial capital should be $1000). Maximum leverage per position can be set independently, to facilitate hitting risk targets that are greater than the natural volatility of the traded asset, and to accommodate low volatility conditions, whilst maintaining overall risk controls. Direction (long or short) is at the user's discretion.
Hard stop losses are based on multiples of the average true range of recent price (14 period lookback), user configurable.
Strategy trailing stops are based off recent highest highs or lowest lows (user defined lookback) to cut the position if the trend or momentum is lost.
Although both strategies can be run simultaneously, optimal diversification will be achieved if ran separately/individually to avoid masking of entries.

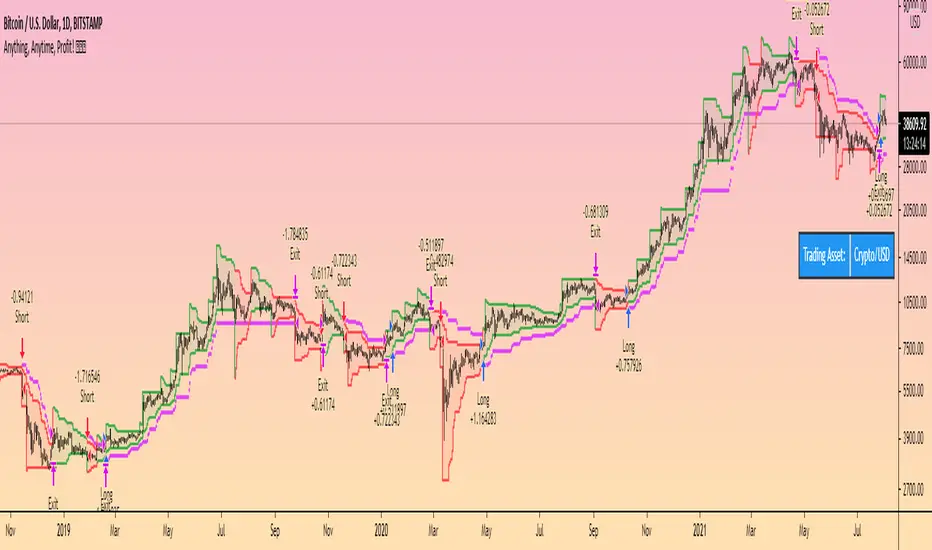
Crunchster's Normalised Trend StrategyThis is a unique rules-based, systematic trading strategy - in the trend following category.
The strategy is designed for use on the daily timeframe. Specific features of this strategy are outlined below:
1. Uses a transformed price series (which I dub "real price") to generate signals rather than ticker price
2. Uses advanced position sizing and risk management, usually reserved for institutional portfolio management, a proven technique utilised by Commodity Trading Advisors and Managed Futures funds (Algo/Quant funds).
"Real Price" is a transformed price series derived from the sum of volatility adjusted (daily) returns, over the entire price series of an asset. The lookback period of the volatility adjustment is user defined.
A Hull moving average (HMA) is derived from the real price, and used as the main trend determinant. The lookback period of the HMA is user defined. Default lookback of 100 periods (days) ensures a responsive trend indicator, but without leading to over-trading from frequent crossovers (average holding period 14 days on BTC).
The core strategy is very simple, go long when real price crosses over HMA, go short when real price crosses under HMA. New position triggers automatically close open positions in the counter direction.
Position sizing is based on recent price volatility and the user defined annualised risk target. In essence positions are inverse volatility weighted, so larger size is opened during lower volatility and smaller size during increased volatility. Recent volatility is calculated as the standard deviation of returns with 14 period lookback, then extrapolated into an annualised volatility of expected returns. Annualised recent volatility is then referenced to the risk target set by the user to adjust the position size. The default settings are a very conservative 10% annual risk target. Initial capital should be set as the maximum risk capital per trade (ie if $10,000 total capital and 10% risk per trade, initial capital should be $1000). Maximum leverage per position can be set independently, to facilitate hitting risk targets that are greater than the natural volatility of the traded asset, and to accommodate low volatility conditions, whilst maintaining overall risk controls.
Hard stop losses are based on multiples of the average true range of recent price (14 period lookback), user configurable.
Please leave comments regarding further features or refinements. I plan to develop further adding alternative moving average selections and the ability to select/deselect long and short strategies.
3 hours ago
Release Notes:
Added option to compound profits versus using a fixed position capital. Be mindful that compounding will potentially increase profits, but also increase drawdowns and overall risk. Leverage will still cap overall exposure with compounding and therefore provides an additional layer of risk control.
2 hours ago
Release Notes:
Added function to toggle long/short strategy legs on and off.

Advanced Trend Detection StrategyThe Advanced Trend Detection Strategy is a sophisticated trading algorithm based on the indicator "Percent Levels From Previous Close".
This strategy is based on calculating the Pearson's correlation coefficient of logarithmic-scale linear regression channels across a range of lengths from 50 to 1000. It then selects the highest value to determine the length for the channel used in the strategy, as well as for the computation of the Simple Moving Average (SMA) that is incorporated into the strategy.
In this methodology, a script is applied to an equity in which multiple length inputs are taken into consideration. For each of these lengths, the slope, average, and intercept are calculated using logarithmic values. Deviation, the Pearson's correlation coefficient, and upper and lower deviations are also computed for each length.
The strategy then selects the length with the highest Pearson's correlation coefficient. This selected length is used in the channel of the strategy and also for the calculation of the SMA. The chosen length is ultimately the one that best fits the logarithmic regression line, as indicated by the highest Pearson's correlation coefficient.
In short, this strategy leverages the power of Pearson's correlation coefficient in a logarithmic scale linear regression framework to identify optimal trend channels across a broad range of lengths, assisting traders in making more informed decisions.
Wunder Trend Reversal botWunder Trend Reversal bot
1. Wunder Trend Reversal Bot - this has only one goal to find a reversal of the trend.
2. The strategy determines, based on the specified value for the filter, a market reversal based on the price actions of the previous bars.
3. A short EMA is used to filter false signals after the reversal signal was received. Crossing the EMA and changing its direction confirms the trend change.
4. There are 2 ways to calculate stop loss and take profit. You can choose one of them:
- Classic stop loss and take profit in a fixed percentage
- ATR stop loss and take pro
5. ATR uses risk reward (R:R) to calculate take profit. The script calculates the risk-reward based on a certain stop loss level and uses it to calculate the take profit
6. A function for calculating risk on the portfolio (your deposit) has been added to the script. When this option is enabled, you get a calculation of the entry amount in dollars relative to your Stop Loss. In the settings, you can select the risk percentage on your portfolio. The loss will be calculated from the amount that will be displayed on the chart.
For example. Deposit - $1000, you set the risk to 1%. SL 5%. Entry volume will be $200. The loss at SL will be $10.10$ this is your 1% risk or 1% of the deposit.
Important! The risk per trade must be less than the Stop Loss value. If the risk is greater than SL, then you should use leverage.
The amount of funds entering the trade is calculated in dollars. This option was created if you want to send the dollar amount from Tradingview to the exchange. However, putting your volume in dollars you get the incorrect net profit and drawdown indication in the backtest results, as TradingView calculates the backtest volume in contracts.
To display the correct net profit and drawdown values in Tradingview Backtest results, use the ”Volume in contracts” option.

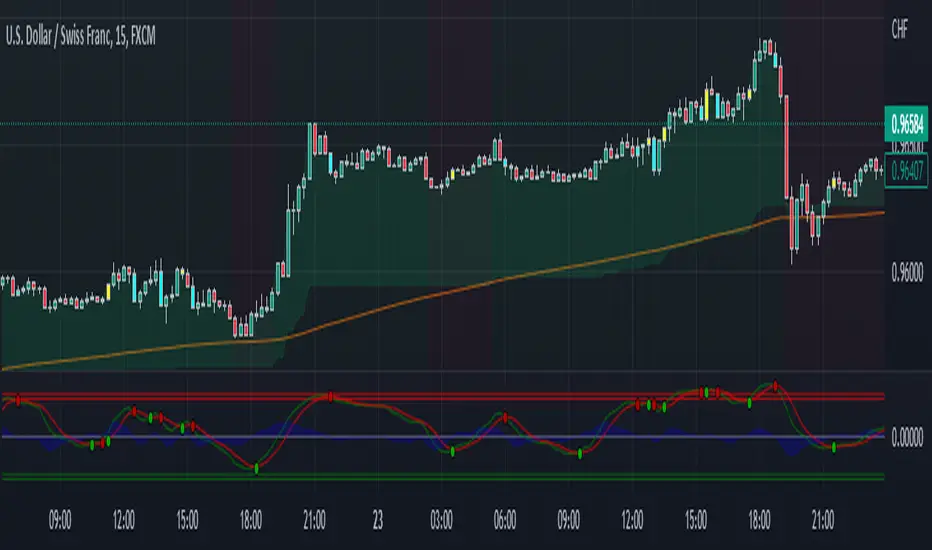
QG-Trend Pullback StrategyI wanted to test the pullback strategy shown by TradePro and 5 minute scalping channels on the YT.
So here it is, worked on USDCHF pair best and not so much on other forex pairs on 15 min or 5 min charts as shown in strategy.
Entry rules for Long:
Price above EMA200 or G channel as trend filter
Donchian trend ribbon in retracement or red in color
Wavetrend cross below a threshold level below zeroline.
Opposite rules for Shorts.
The SL and TP based on the ATR multiplier and a TP as RR ratio to SL.
Attaching the equity curve on USDCHF 15 min chart where it worked best.
Swing Trend StrategyThis script is a trend following system which uses a long term Moving Average to spot the trend in combination with the Average True Range to filter out Fakeouts, limiting the overall drawdown.
Default Settings and Calculation:
- The trend is detected using the Exponential Moving Average on 200 periods.
- The Average True Range is calculated on 10 periods.
- The Market is considered in an Uptrend when the price closes above the EMA + ATR.
- The Market is considered in a Downtrend when the price closes below the EMA - ATR.
- The strategy will open a LONG position when the market is in an Uptrend.
- The strategy will close its LONG positions when the price closes below the EMA.
- The strategy will open a SHORT position when the market is in a Downtrend.
- The strategy will close its SHORT positions when the price closes above the EMA.
This script is best suited for the 4h timeframe, and shows good results on BTC and ETH especially.
The options allow to modify the type of moving average to use, the period of the moving average, the ATR multiplier to add as well as the possibility to open short trades or not.

Smoothed Heikin Ashi Trend on Chart - TraderHalai BACKTESTSmoothed Heikin Ashi Trend on chart - Backtest
This is a backtest of the Smoothed Heikin Ashi Trend indicator, which computes the reverse candle close price required to flip a Heikin Ashi trend from red to green and vice versa. The original indicator can be found in the scripts section of my profile.
This particular back test uses this indicator with a Trend following paradigm with a percentage-based stop loss.
Note, that backtesting performance is not always indicative of future performance, but it does provide some basis for further development and walk-forward / live testing.
Testing was performed on Bitcoin , as this is a primary target market for me to use this kind of strategy.
Sample Backtesting results as of 10th June 2022:
Backtesting parameters:
Position size: 10% of equity
Long stop: 1% below entry
Short stop: 1% above entry
Repainting: Off
Smoothing: SMA
Period: 10
8 Hour:
Number of Trades: 1046
Gross Return: 249.27 %
CAGR Return: 14.04 %
Max Drawdown: 7.9 %
Win percentage: 28.01 %
Profit Factor (Expectancy): 2.019
Average Loss: 0.33 %
Average Win: 1.69 %
Average Time for Loss: 1 day
Average Time for Win: 5.33 days
1 Day:
Number of Trades: 429
Gross Return: 458.4 %
CAGR Return: 15.76 %
Max Drawdown: 6.37 %
Profit Factor (Expectancy): 2.804
Average Loss: 0.8 %
Average Win: 7.2 %
Average Time for Loss: 3 days
Average Time for Win: 16 days
5 Day:
Number of Trades: 69
Gross Return: 1614.9 %
CAGR Return: 26.7 %
Max Drawdown: 5.7 %
Profit Factor (Expectancy): 10.451
Average Loss: 3.64 %
Average Win: 81.17 %
Average Time for Loss: 15 days
Average Time for Win: 85 days
Analysis:
The strategy is typical amongst trend following strategies with a less regular win rate, but where profits are more significant than losses. Most of the losses are in sideways, low volatility markets. This strategy performs better on higher timeframes, where it shows a positive expectancy of the strategy.
The average win was positively impacted by Bitcoin’s earlier smaller market cap, as the percentage wins earlier were higher.
Overall the strategy shows potential for further development and may be suitable for walk-forward testing and out of sample analysis to be considered for a demo trading account.
Note in an actual trading setup, you may wish to use this with volatility filters, combined with support resistance zones for a better setup.
As always, this post/indicator/strategy is not financial advice, and please do your due diligence before trading this live.
Original indicator links:
On chart version -
Oscillator version -
Update - 27/06/2022
Unfortunately, It appears that the original script had been taken down due to auto-moderation because of concerns with no slippage / commission. I have since adjusted the backtest, and re-uploaded to include the following to address these concerns, and show that I am genuinely trying to give back to the community and not mislead anyone:
1) Include commission of 0.1% - to match Binance's maker fees prior to moving to a fee-less model.
2) Include slippage of 10 ticks (This is a realistic slippage figure from searching online for most crypto exchanges)
3) Adjust account balance to 10,000 - since most of us are not millionaires.
The rest of the backtesting parameters are comparable to previous results:
Backtesting parameters:
Initial capital: 10000 dollars
Position size: 10% of equity
Long stop: 2% below entry
Short stop: 2% above entry
Repainting: Off
Smoothing: SMA
Period: 10
Slippage: 10 ticks
Commission: 0.1%
This script still remains to shows viability / profitablity on higher term timeframes (with slightly higher drawdown), and I have included the backtest report below to document my findings:
8 Hour:
Number of Trades: 1082
Gross Return: 233.02%
CAGR Return: 14.04 %
Max Drawdown: 7.9 %
Win percentage: 25.6%
Profit Factor (Expectancy): 1.627
Average Loss: 0.46 %
Average Win: 2.18 %
Average Time for Loss: 1.33 day
Average Time for Win: 7.33 days
Once again, please do your own research and due dillegence before trading this live. This post is for education and information purposes only, and should not be taken as financial advice.

Adaptive, Zero lag Schaff Trend Cycle Backtest (Simple) [Loxx]Simple backtest for "Adaptive, Zero lag Schaff Trend Cycle" found here:
What this backtest includes:
-Customization of inputs for Schaff Trend Cycle calculation
-Take profit 1 (TP1), and Stop-loss (SL), calculated using standard RMA-smoothed true range
-Activation of TP1 after entry candle closes
-Zero-cross entry signal plots
-Longs and shorts
-Continuation longs and shorts
Happy trading!

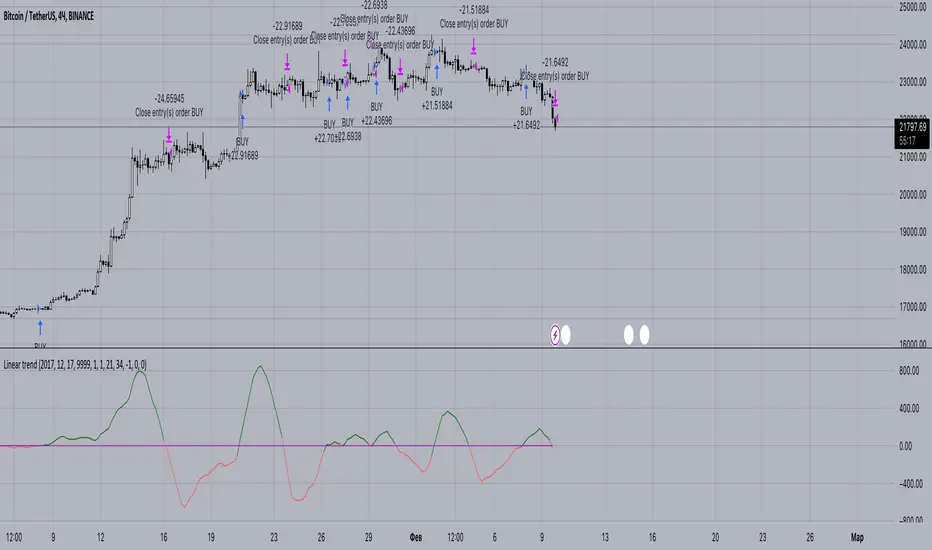
Linear trendSimple way how to use Linear Regression for trading.
What we use:
• Linear Regression
• EMA 200 as a trend filter
Logic:
Firstly we make two different linear regression movings as oscillator. For this we need to subtract slow moving from fast moving, so we get the single moving around zero. This is the green/red line which appears on the chart.
The trade open when LR cross over the threshold. The trade close when LR cross under the threshold below. Crossing over the threshold is the same as faster moving cross over slower moving.
Also we use EMA as a filter. The trades would be only when the price is over than EMA 200.

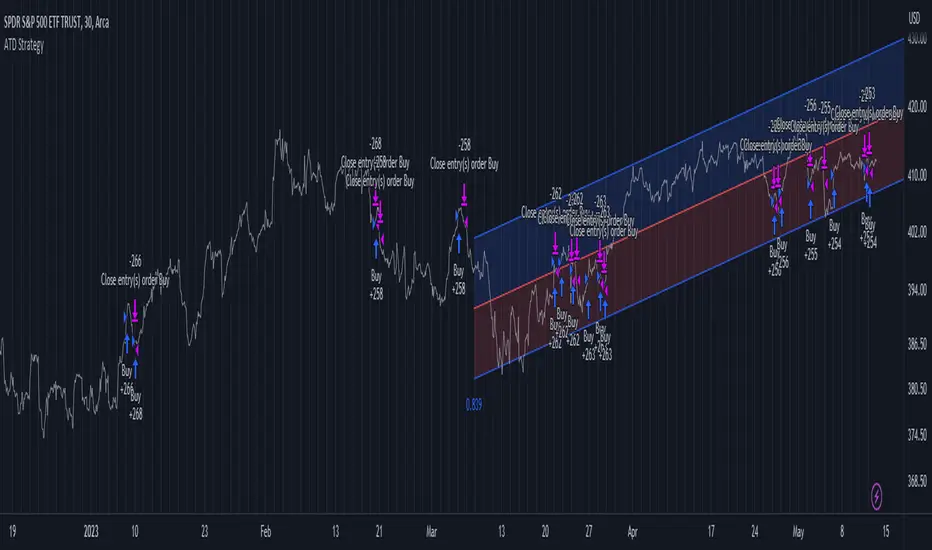
[BTCUSD] Folow Trend & Autotrade Binance FutureCommission = 4 USD per order >>> check in the Performance Summary
Slippage = 2 ticks
- I see from Kodify (tradingview.com/pine-wizards)
Risk: 1% per trade >>> check at the "List of trades"
* Auto trade BINANCE FUTURE by Webhook + Pro, Pro+, Premium Tradingview user.
1. H3 timeframe: Supertrend indicator.
- Long when the closes candle is above Green line.
- Short when the closes candle is below Red line.
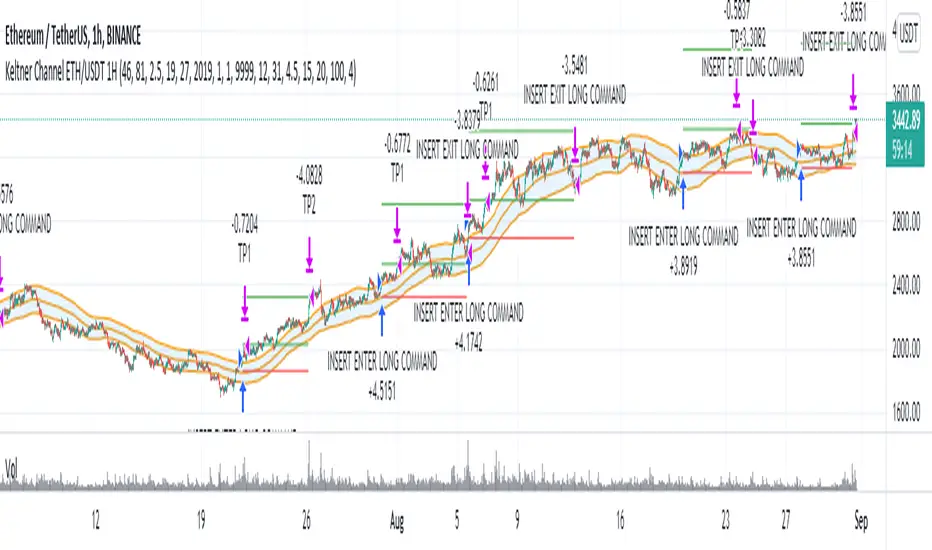
2. H1 timeframe: Keltner channels indicator.
* Keltner channels setting:
+ Length = 50
+ Multiplier = 1
+ Use Exponential MA: true
+ Band style: Average true range.
- Long when the close candle crossover the Keltner Upper
- Short when the close candle crossunder the Keltner Lower
3. Entry rule:
Open Buy: Supertrend & Keltner channels are Long. Buy when closes candle crossunder Basis line and closed above Lower Keltner
Open Sell: Supertrend & Keltner channels are Short. Sell when closes candle crossover Basis line and closed below Upper Keltner
4. Stoploss is moving the trend.
Stoploss = Height of Keltner * 1.2.
5. Not repainting
6. Overview result backtesting:
a. Longterm: Every 2 years
2018 to 31/12/2020
2017 to 31/12/2019
2016 to 31/12/2018
2015 to 31/12/2017
2014 to 31/12/2016
2013 to 31/12/2015
2012 to 31/12/2014
b. Midterm: every year.
2020-2021
2019-2020
2018-2019
2017-2018
2016-2017
2015-2016
2014-2015
2013-2014
2012-2013
c. Shorterm:
2020 to today 13/11/2021

Low-High-Trend StrategyWhen asked what the key to successful investing was, Warren Buffet famously said “buy low, sell high.” Was he onto something? Today I am sharing with the community a simple “buy low, sell high” strategy with an optional trend filter and take-profit target. I’ve found that this strategy works well in a variety of markets but has a higher tendency to out-perform buy & hold in markets that are ranging sideways.
How it works:
The strategy tracks the highest and lowest price over the last X number of bars (you select the look-back period). The highest price line is plotted in green and the lowest price line is potted in red. If the price crosses over the lowest price in the last X number of bars, then a buy signal is generated. Exit options include a take-profit % or selling when the price crosses over the highest price in the last X amount of bars. I.e. “Buy low, sell high.” An EMA is also plotted as a blue trend line, and there is an option to only trade if the price is above the EMA trend line.
Disclaimer: Open source scripts I publish in the community are largely meant to spark ideas that can be used as building blocks for part of a more robust trade management strategy. Even though this example script beats buy and hold over the back-test time-frame, I wouldn't advise using it as a stand-alone strategy without significant additions/modifications to the strategy and risk management functions. In this example the script is being used as a medium-term strategy with just 10% leverage over account equity, a $25k start balance, and back-testing 10+ years. Modifiable slippage and commissions are included in the model.
Green line = Highest price in the look-back period
Red line = Lowest price in the look-back period
Blue line = EMA Trend

[astropark] Trend Skywalker V2 [strategy]Dear Followers,
today I'm glad to present you Trend Skywalker V2 , the evolution of Trend Skywalker V1 indicator that you can see here below:
This indicator works on every timeframe and market, it's quite responsive to market movements, so it's especially good on volatile markets.
In this new version you have 3 trend clouds available :
a short-term one (yellow)
a mid-term one (green)
a long-term one (blue)
You can also enable an option to show all trend clouds as one, the result will be similar to a special bollinger bands tool.
Of course you can edit trend clouds analysis period and color, also you can turn on or off the cloud that you prefer.
The indicator can run 4 different kinds of strategy : one for each trend cloud individually or a mixed one.
Also the indicator tracks for you a peak profit from entry: this tracker is a suggestion for you to take profits while price goes up!
All red-green circles you see in the chart is a reminder that a peak profit label was there in the past: what does this tell you?
if price starts losing the short-term trend and you had a lot of TP suggestions, maybe trend ended and you should start consider closing your trade before you give back all your profit.
On backtesting you can you test long and short setups individually or both, as well as performance in a specific time window.
This is a premium indicator , so send me a private message in order to get access to this script.

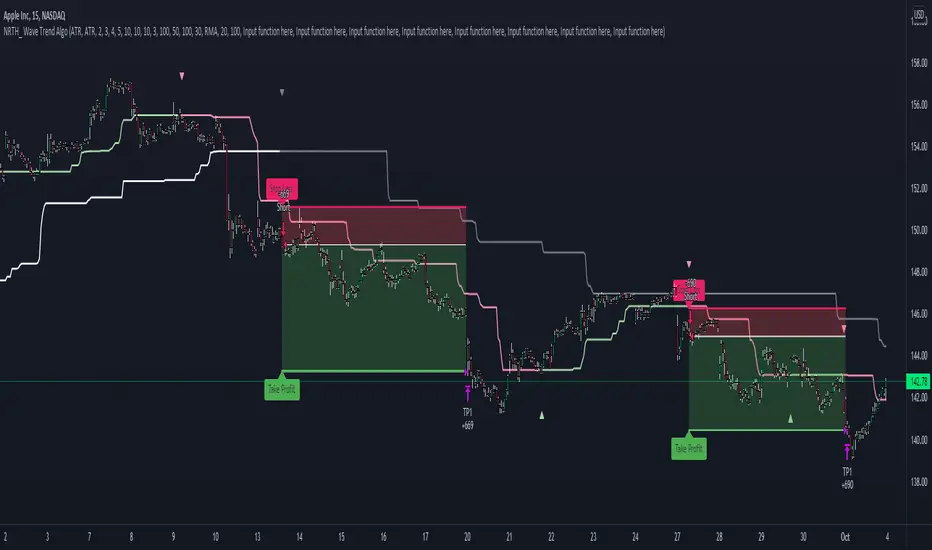
Wave Trend AlgoA NRTH_ Premium Double Trend Confirmation Algo
Comes included with the Premium Package.
Indicator features
Built-In Alerts
Visual Risk Management
Customizable Entry Rules
Usage Tips
This strategy works on timeframes as low as 15m, however not recommended for scalping with high fees.
Best performance with high Risk/Reward Ratios
The double trend confirmation (1 slow, 1 fast) uses lagging trend confirmation to your advantage, Identify confirmed moves and enter trades with high RR for the best results.
Works for all markets with the ability to customize to your liking.
Backtesting Results Info
Period 1/1/2021-1/10/2021
Entry value at $1000 with 100x leverage
ATR Exits : 1:3.3 RR
-------------------------------------------
Disclaimer
Copyright NRTH_ Indicators 2021.
NRTH_ and all affiliated parties are not registered as financial advisors. The products & services NRTH_ offers are for educational purposes only and should not be construed as financial advice. You must be aware of the risks and be willing to bear any level of risk to invest in financial markets. Past performance is not necessarily indicative of future results. NRTH_ and all individuals associated assume no responsibility for your trading results or investments.
All investments involve risk, and the past performance of a security, industry, sector, market, financial product, trading strategy, or individual’s trading does not guarantee future results or returns. Investors are fully responsible for any investment decisions they make. Such decisions should be based solely on an evaluation of their financial circumstances, investment objectives, risk tolerance, and liquidity needs.
Keltner Channel - Trend Based StrategyThis strategy is based on 3 main indicators.
1st indicator is a trend indicator, which consists of SMA and EMA
2nd is Keltner Channel
3rd is DM indicator.
The conditions for the entry of this strategy are following:
First of all the assets need to be in an upward trend, this will occur when the EMA will cross SMA. The next condition for the entry is the opening and the closure of the candle. The open price of the candle should be in the upper part of the Keltner Channel and the close price should be above the Keltner channel. The third condition for the DM indicator is to be above a certain benchmakr. This benchmark can be set in the settings of the strategy.
The strategy has two potential Take Profit levels and single stop-loss levels. For the more efficient way you may try an use the trailing stop or extend the number of take-profit levels.
HYE Combo Market [Strategy] (Vwap Mean Reversion + Trend Hunter)In this strategy, I used a combination of trend hunter and vwap mean reversion strategies that I published before.
Trend Hunter Strategy:
Mean Reversion Vwap Strategy:
The results are quite impressive, especially for bitcoin.
While the hodl return for bitcoin was 13419%, the strategy's return in the same period was about 5 times (65000%) of this.
s3.tradingview.com
In this combo strategy, I made some changes to the original settings of the strategies used together and added some more new features.
Trend Hunter Strategy Settings: (Original / Combo)
- Slow Tenkansen Period : 9 / 9
- Slow Kijunsen Period : 26 / 13
- Fast Tenkansen Period : 5 / 3
- Fast Kijunsen Period : 13 / 7
- BB Length : 20 / 20
- BB Stdev : 2 / 2
- TSV Length : 13 / 20
- TSV Ema Length : 7 / 7
* I also added a "vidya moving average" to be used as a confirmation tool to open a long position. (Candle close must be above the vidya line.)
Vwap Mean Reversion Strategy Settings: (Original / Combo)
- Small Vwap : 2 / 8
- Big Vwap : 5 / 10
- Percent Below to Buy : 3 / 2
- RSI Period : 2 / 2
- RSI Ema Period : 5 / 5
- Maximum RSI Level for Buy : 30
* I also added a "mean vwap line" to be used for exits in this part of the strategy. In the original version, when small vwap crossovers big vwap, we close the position, but in this strategy we will wait for the close above the mean vwap.
TIPS AND WARNINGS
1-) The standard settings of this combo strategy is designed and tested with daily timeframe. For lower timeframes, you should change the strategy settings and find the best value for yourself.
2-) Only the mean vwap line is displayed on the graph. For a detailed view, you can delete the "//" marks from the plot codes in the strategy code.
3-) This is a strategy for educational and experimental purposes. It cannot be considered as investment advice. You should be careful and make your own risk assessment when opening real market trades using this strategy.
________________________________________________________
Bu stratejide, daha önce yayınladığım trend avcısı ve vwap ortalamaya geri dönüş stratejilerinin bir kombinasyonunu kullandım.
Sonuçlar özellikle bitcoin için oldukça etkileyici.
Bitcoin için hodl getirisi %13419 iken, stratejinin aynı dönemdeki getirisi bunun yaklaşık 5 katı (%65000) idi.
Bu kombo stratejide, birlikte kullanılan stratejilerin orijinal ayarlarında bazı değişiklikler yaptım ve bazı yeni özellikler ekledim.
Trend Avcısı Strateji Ayarları: (Orijinal / Combo)
- Yavaş Tenkansen Periyodu : 9 / 9
- Yavaş Kijunsen Periyodu : 26 / 13
- Hızlı Tenkansen Periyodu : 5 / 3
- Hızlı Kijunsen Periyodu : 13 / 7
- BB Uzunluğu : 20 / 20
- BB Standart Sapması : 2 / 2
- TSV Uzunluğu : 13 / 20
- TSV Ema Uzunluğu : 7 / 7
* Ayrıca long pozisyon açmak için onay aracı olarak kullanılmak üzere "vidya hareketli ortalama" ekledim. (Mum kapanışı vidya çizgisinin üzerinde olmalıdır.)
Vwap Ortalamaya Dönüş Stratejisi Ayarları: (Orijinal / Combo)
- Küçük Vwap : 2 / 8
- Büyük Vwap : 5 / 10
- Alış İçin Gerekli Fark Oranı : 3 / 2
- RSI Periyodu : 2 / 2
- RSI Ema Periyodu: 5 / 5
- Alış için gerekli maksimum RSI seviyesi : 30
* Stratejinin bu bölümünde pozisyondan çıkışlar için kullanılacak bir "ortalama vwap çizgisi" de ekledim. Orijinal versiyonda, küçük vwap, büyük vwap'ı yukarı kestiğinde pozisyonu kapatıyoruz, ancak bu stratejide, ortalama vwap'ın üzerindeki kapanışı bekleyeceğiz.
İPUÇLARI VE UYARILAR
1-) Bu birleşik stratejinin standart ayarları, günlük zaman dilimi ile tasarlanmış ve test edilmiştir. Daha düşük zaman dilimleri için strateji ayarlarını değiştirmeli ve kendiniz için en iyi değeri bulmalısınız.
2-) Grafikte sadece ortalama vwap çizgisi görüntülenir. Ayrıntılı bir görünüm için strateji kodundaki "plot" ile başlayan satırlarda grafikte görünmesini istediğiniz özelliğin önündeki "//" işaretlerini silebilirsiniz.
3-) Eğitim ve deneysel amaçlı bir stratejidir. Yatırım tavsiyesi olarak değerlendirilemez. Bu stratejiyi kullanarak gerçek piyasa işlem açarken dikkatli olmalı ve kendi risk değerlendirmenizi yapmalısınız.

Stochastic TrendDear community,
I've made another simple trading bot for you to use. This bot is based on the Stochastic Oscillator. It only produces long trades currently.
I changed the oscillation period to a much longer one, which in turn creates opportunities to trade long term trends.
The bot goes long when the Entry lines is crossed from below and it will close its long position once the Exit line has been crossed from above.

Fibonacci DCA TrendThis bot makes use of an algorithm which detects new heights and places limit orders according to the Fibonacci retracement theory. By placing limit orders under the current price, the bot allows itself to catch smaller and larger dips. This is also known as “Dollar-Cost-Averaging”, DCA in short. This bot is ideal for bull markets, both on crypto and stock indices.
The green lines are the limit orders. As soon as the price touches the limit order, a position is entered.
The settings of the back test as follows:
starting capital = 100k
leverage = 1
commission = 0.2%
Equity per trade = 5%, a realistic investment strategy when trading 2-3 assets with this bot.
It’s advised to trade this bot with futures for potential leverage. On time frames lower than H1 I’d use 2x-3x leverage for better results, especially in trending markets. On larger time frames I wouldn’t use any leverage.
This bot has very strong results on a multitude of assets. The best results are on the M15 time frame.
To give you a few ideas, this bot is tested on the assets below. All the results are very similar. You can contact me for a back-test on a specific asset. You can find the back-test results on my website.
BTC
ETH
SPX500
NAS100
The standard inputs are generally the best all-round inputs. Feel free to change the inputs to your liking.
I've also made a study-script for easy implementation on the exchange. You get that script once you get access to this bot.

RSI Trend CryptoDear community,
Today I want to present you one of my favorite and simple trading bots: The RSI Trend.
This bot is based on the RSI, which normally is used as a trend reversal indicator. However, here it’s used as a trend finding indicator, often with great success. This bot making long-only trades, which is quite successful in bull-markets like the one we’re currently in.
In case you want to use an emergency exit for your trade, toggle the Emergency Exit parameter. During bull-markets it’s better in the long term to keep this option off.
Currently the bot only makes one trade at a time (pyramiding = 1), for higher risk and higher rewards you can increase this parameter. More than 5 is not advised.
I’ve optimized this bot on 15min time frame. It has some decent results for most cryptos on this TF, feel free to test this out.
In case you want to hook this bot up to your exchange, feel free to edit the ALERT messages in the code.
Default Trading Rules:
Long: RSI crosses over 35
Close Long: RSI crosses under 75
Emergency Exit: RSI crosses under 10

Linear trendThis oscillator based on linear regression . By subtracting the slower LMA from the faster LMA we can get a value, which we will further compare with zero. If the resulting difference is greater than 0, then we can assume that the trend is upward. Also by using offset we could increase the expected profit (focusing on backtest data).
You could get access for this script by the link below.
Bull Market Trend Following StrategyThis Bull Market Trend Following Strategy is perfect for long or short term Crypto or traditional market trading and investing.
It is based mainly on the ATR indicator and will therefore adapt to any market conditions and volatility.
It has a number of variable options to try and maximise gains, including stop loss and take profit points, and the ability to wait for pullbacks.
Please let me know if you find any optimal settings, and don't hesitate to ask any questions I'm always happy to help.
Thanks a lot.
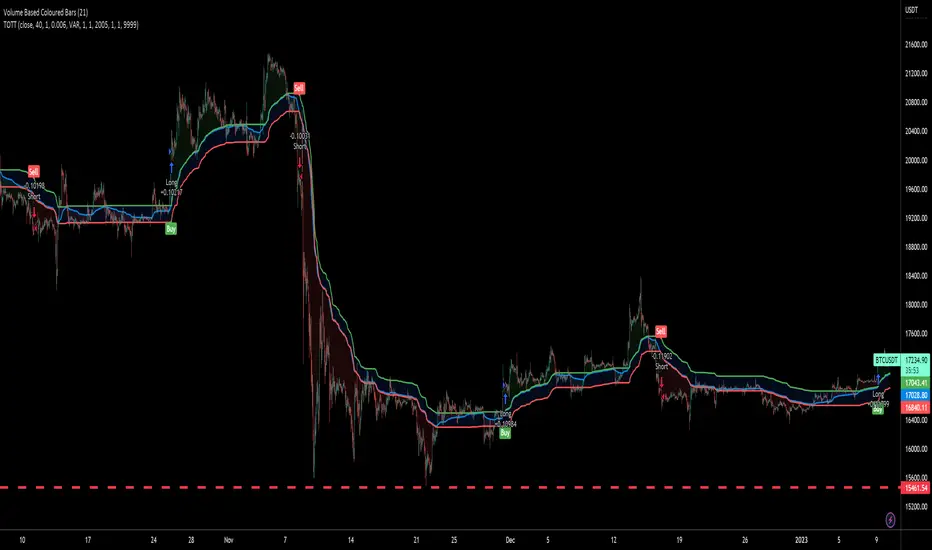
Twin Optimized Trend Tracker Strategy TOTTAnıl Özekşi's new strategy which is a combination of 2 Optimized Trend Tracker lines which are vertical displaced from original version with a COEFFICIENT to cope with sideways' false signals which he explained in "Toy Borsacı İçin OTT Kullanım Kılavuzu 2"
original version of OTT:
OTT Strategy and Screener:
You can find a detailed explanation with subtitles from the developer of OTT Anıl Özekşi himself as: "Toy Borsacı İçin OTT Kullanım Kılavuzu 2"
BTCUSD 30MIN TREND STRATEGYBTCUSD 30MIN TREND STRATEGY.
This strategy signals is based on the market close price and calculate for buy and sell signals. it uses composite technical algorithm to filter out the best buying and selling points.This indicator should be used to see trend, range zones, evaluate the best areas to enter the market, use only 30 MINUTES and BTCUSD and only bitcoin derivatives BTCUSDT perpetual or inverse etc. Can use spot or future markets
It designed for automatic crypto trade bot systems. You can use alarms from webhook setting up for your bot.
For use message me.
