Trend Regime Bands (EMA 50 / 150 / 200)📘 Trend Regime Bands – EMA 50·150·200
Overview
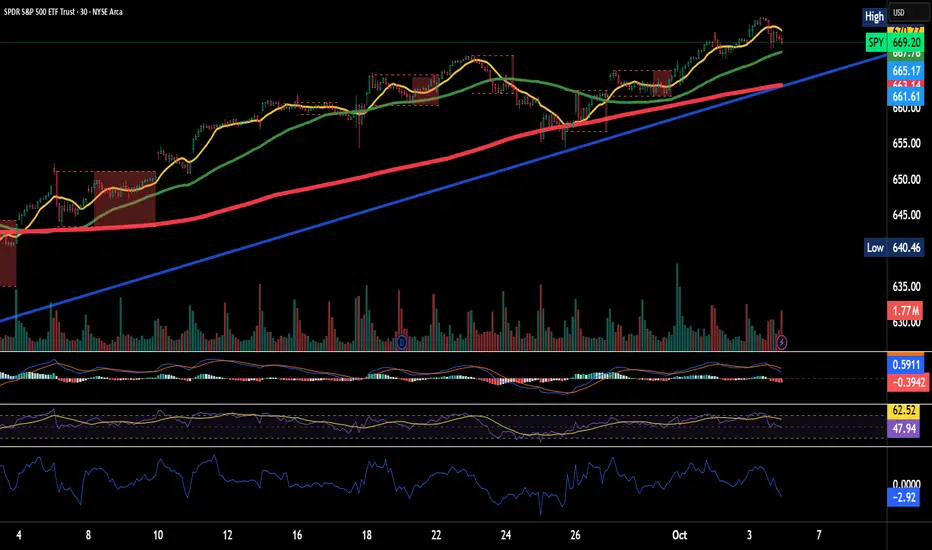
Trend Regime Bands is a visual trend-context indicator designed to help users quickly understand whether the market is in a bullish or bearish regime. The indicator uses the alignment of EMA 50, EMA 150, and EMA 200 to determine overall trend direction, while additional EMAs are used only to create color-based bands for visual context. No buy or sell signals are generated.
How Trend Direction Is Determined
Trend direction is derived exclusively from the relative positioning of: EMA 50 (short-term trend) , EMA 150 (medium-term trend) , EMA 200 (long-term trend) . Bullish regime: EMA 50 ≥ EMA 150 ≥ EMA 200 . Bearish regime: EMA 50 < EMA 150 < EMA 200. These three EMAs act as the decision framework for the indicator.
What the Color Bands Represent : The indicator displays two visual bands on the chart:
Fast Band (Momentum Context) - Built using faster EMAs, Represents short-term momentum and pullback behavior. Brighter color intensity reflects stronger momentum
Slow Band (Regime Context) - Built using slower EMAs. Represents broader trend structure and regime stability.Deeper color intensity reflects stronger trend alignment
The color of both bands follows the trend direction determined by EMA 50/150/200:
Green shades indicate a bullish regime. Red shades indicate a bearish regime. Color intensity increases or decreases smoothly based on trend strength.
How to Use This Indicator
Use the bands to understand market context, not as entry or exit signals. Strong, bright bands suggest a well-established trend. Lighter bands indicate weaker or transitioning trends. The indicator works across intraday, swing, and higher timeframes. This tool is best used alongside price action, support/resistance, or other confirmation methods.
Important Notes
This indicator does not provide buy or sell signals. It does not predict future price movement. It is intended solely as a visual trend-regime and context tool
Summary
Trend Regime Bands offers a clean, distraction-free way to visualize bullish and bearish market regimes using EMA structure and color intensity, helping traders maintain directional awareness and discipline.
Pine Script® indicator