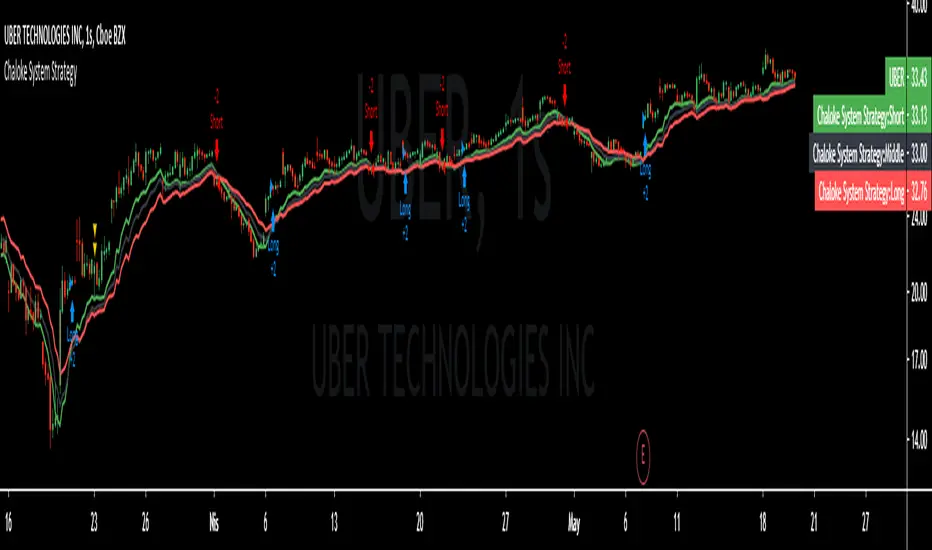
Chaloke System StrategyChaloke System Strategy
This is a trend indicator
Atr and 3 moving averages are used
Short 9-day moving average,Medium 15-day moving average,Calculated with a long 24-day moving average.
Atr period : 5
Sht,Mid,Lng calculation method is different
Buying Strategy
long = crossover(Sht,Mid) and close > Sht
Selling Strategy
short = crossunder(Sht, Lng ) or close < Lng
Buy should be done when the barcolor turns green
Sell should be done when barcolor is red
When the barcolor is black, there may be change.
Search in scripts for "trend"
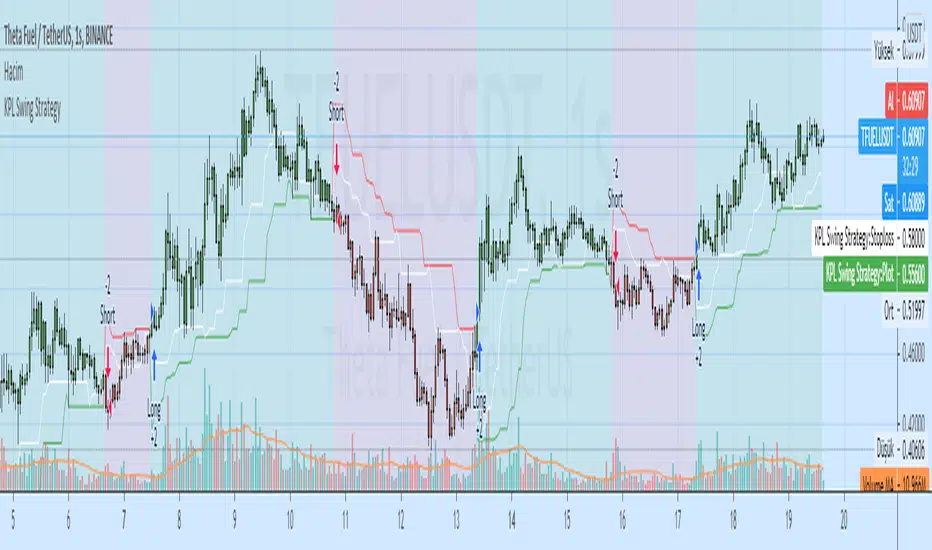
KPL Swing StrategyThe KPLSwing indicator is a simple trend following mechanical trading system which automates the entry and exit.
The trading system is extremely simple and easy to use and removes emotions from trading.
The trading or investing logic is simple.... buy on close above 20 days high and sell on close below 20 days low.
No targets are given as profits are unknown and is whatever the market gives. Losses are limited via position sizing.
TBO Backtesting StrategyThe TBO Backtesting Strategy is the TBO Indicator equivalent but gives you the ability to backtest data on different charts.
How Does This Work?
You will initially see the original settings for the TBO, those are unchanged and will feel familiar. Below that is where the backtesting options come into play.
There are two sections: BUY & SELL
BUY
Checking a buy option means you are now including that buy trigger as an additional BUY signal. If you have LONG checked, then only the TBO LONG signal will be sent to open a buy order. Likewise, if you have LONG and CLOSE SHORT checked, both of those will be sending buy orders in the backtest.
SELL
The SELL section offers the ability to toggle sell orders. Additionally, you are able to specify what KIND of relationship it has with the buy orders. By default, each sell order has a direct relationship to its counterpart buy signal:
Example 1:
BUY: LONG Signal
SELL: SHORT Signal || Mapping: "Long" || Result: Will close LONG orders
Example 2:
BUY: CLOSE SHORT Signal
SELL: TBO SELL Signal || Mapping: "CLOSE SHORT" || Result: Will close CLOSE SHORT orders
Example 3:
BUY: LONG Signal
BUY: CLOSE SHORT Signal
SELL: TBO Sell || Mapping: "Long" || Result: Will close LONG orders
SELL: SHORT Signal || Mapping: "All" || Result: Will close ALL orders
Example 4:
BUY: LONG Signal
BUY: CLOSE SHORT Signal
SELL: SHORT Signal || Mapping: "LONG" || Result: Will close LONG orders
SELL: TBO Sell || Mapping: "CLOSE SHORT" || Result: Will close CLOSE SHORT orders
Hopefully, you get the idea buy now. You can map the closing orders to different buy orders to find the best types of entry and exit points.
Please note this is invite-only and requires an active Poobah Crypto Services subscription. If you are interested in using the strategy or TBO Indicator please visit the website in my signature below. Thanks!

Swing Algo V1This indicator can be used for e.g. swing algorithmic trading. It will give Buy/Long and Sell/Short signals on the chart. This algorithm uses a combination of several (custom) functions and rules to find good entry points for trend trading. After many iterations and tests I came up with this particular setup, which is highly optimized for the $ETH/$USD trading pair on the daily (D) timeframe. It is however possible to change algorithmic parameters within the indicator settings to tune this swing algorithm for other assets and timeframes. You don't need any programming skills or similar abilities to navigate this indicator.
Also you can choose the backtest time interval to test the perfomance of this algorithm for different time windows and different trading pairs. Here various backtesting parameters (e.g. trading fees) can be customized. Additionally to the TradingView Strategy Tester you can also plot your equity directly on the chart to get a sense for the performance. For this you can also scale the equity graph to e.g. match the starting point of your equity with some price point on the chart to get a direct comparison to 'Buy & Hold' strategies over time.
Note: In general it seems that cryptocurrencies are rather swing-algorithm-friendly, while I cannot recommend trading classical assets like stock or indices (e.g. S&P 500) with this indicator (although you can of course try to find good setups).
This indicator (and all other content I provide) is no financial advice. If you use this indicator you agree to my Terms and Conditions which can be found on my twitter profile linked in my signature.

hamster-bot REP strategyThe strategy basically contains RSI + EMA + Parabolic = REP.
Entry: RSI
Trend Filter: EMA
Exit: Trailing Stop Parabolic

FRAMA - Supertrend strategyFRAMA Strategy
I found this strategy on internet, in a well-known forex forum.
I have translated the two indicators mentioned in that strategy (originally in mq4) in pine script.
Thanks to Fractured and Shizaru for the FRAMA snippets, to mejialucas for Supertrend snippet, to JayRogers for trade management snippet and to Trost for backtesting snippet.
I also added some code to have FRAME with a deiiferent timeframe
Indicators set-up:
FRAMA period 24 (it was originally 25 but it's better to use an even number)
FRAMA timefarme lower then chart timeframe (e.g. daily chart and weekly FRAMA)
Supertrend indicator as it is.
Of course, it is better to adapt above setting to traded instrument.
Long/Buy rules:
1 - Enter at crossover between FRAMA and its signal
2 - Option to filter entries based on supertrend signal
3 - Exit when Supertrend change direction;
4 - Exit long when short signal occurs;
Short/Sell rules:
1 - Enter at crossunder between FRAMA and its signal
2 - Option to filter entries based on supertrend signal
3 - Exit when Supertrend change direction;
4 - Exit short when long signal occurs;
VERY IMPORTANT NOTE: this is a trend following strategy, so the target is to stay in the trade as much as possible (drawdown my be high). If your trading style is more focused on scalping and/or pullbaks, this strategy is not for you.
Credits to who developed this startegy (google it).
Thanks to all pinescripters mentined in the code for their snippets.
I have also a study with alerts.
Please use comment section for any feedback or contact me if you need support.

Combo Backtest 123 Reversal & Donchian Channel Width This is combo strategies for get a cumulative signal.
First strategy
This System was created from the Book "How I Tripled My Money In The
Futures Market" by Ulf Jensen, Page 183. This is reverse type of strategies.
The strategy buys at market, if close price is higher than the previous close
during 2 days and the meaning of 9-days Stochastic Slow Oscillator is lower than 50.
The strategy sells at market, if close price is lower than the previous close price
during 2 days and the meaning of 9-days Stochastic Fast Oscillator is higher than 50.
Second strategy
The Donchian Channel was developed by Richard Donchian and it could be compared
to the Bollinger Bands. When it comes to volatility analysis, the Donchian Channel
Width was created in the same way as the Bollinger Bandwidth technical indicator was.
As was mentioned above the Donchian Channel Width is used in technical analysis to measure
volatility. Volatility is one of the most important parameters in technical analysis.
A price trend is not just about a price change. It is also about volume traded during this
price change and volatility of a this price change. When a technical analyst focuses his/her
attention solely on price analysis by ignoring volume and volatility, he/she only sees a part
of a complete picture only. This could lead to a situation when a trader may miss something and
lose money. Lets take a look at a simple example how volatility may help a trader:
Most of the price based technical indicators are lagging indicators.
When price moves on low volatility, it takes time for a price trend to change its direction and
it could be ok to have some lag in an indicator.
When price moves on high volatility, a price trend changes its direction faster and stronger.
An indicator's lag acceptable under low volatility could be financially suicidal now - Buy/Sell signals could be generated when it is already too late.
Another use of volatility - very popular one - it is to adapt a stop loss strategy to it:
Smaller stop-loss recommended in low volatility periods. If it is not done, a stop-loss could
be generated when it is too late.
Bigger stop-loss recommended in high volatility periods. If it is not done, a stop-loss could
be triggered too often and you may miss good trades.
WARNING:
- For purpose educate only
- This script to change bars colors.

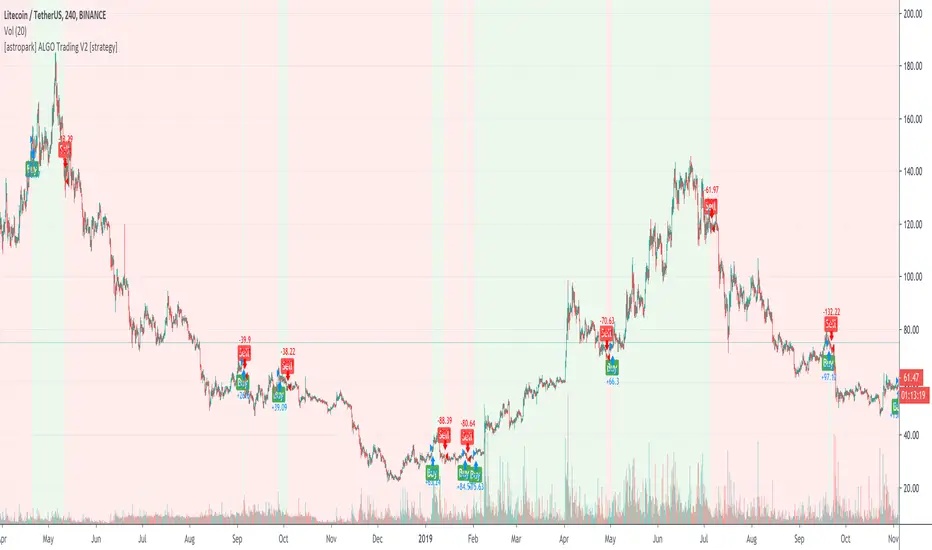
[astropark] ALGO Trading V2 [strategy]Dear Followers,
today another awesome Swing and Scalping Trading Strategy indicator, runnable on a bot , which works great on many timeframes (ones between 1h and 1D are suggested, but just write me in order to help you find correct settings).
It must be said that this strategy works even better on 1m Renko chart!
If you are a scalper or you are a swing trader, you will love suggested entries for fast and long-lasting profit.
Keep in mind that a proper trailing stop strategy and risk management and money management strategies are very important (DM me if you need any clarification on these points).
This is not an evolution of "ALGO Trading V1" or "ALGO Trading V3" , but a twin sister of them. Search them on TradingView to know them better.
Here you can find ALGO Trading V1
This strategy has the following options:
enable/disable signals on chart
enable/disable bars and background coloring based on trend
enable/disable a "filter noise" option , which try to reduce overtrading (you can easily check it on backtesting)
enable/disable a Take Profit / Stop Loss option (you can easily check it on backtesting too)
enable/disable a secret SmartOption which may improve profit on your chart (again, check it on you chart if it helps or not)
This strategy only trigger 1 buy or 1 sell. If you enable Take Profit / Stop Loss option, consider that many TP can be triggered before trend reversal, so take partial profit on every TP an eventually buy/sell back lower/higher to maximize your profit.
In order to get notified when a signal is triggered, you need to use the "alarms" version of this indicator (just search for astropark's "ALGO Trading V2" indicator and choose the one with "alarms" suffix).
Strategy results are calculated on the time window from January 2019 to now, so on more than 1 year, using 1000$ as initial capital and working at 1x leverage (so no leverage at all! If you like to use leverage, be sure to use a safe option, like 3x or 5x at most in order to have liquidation price very far).
This is not the "Holy Grail", so use a proper risk management strategy.
This script will let you backtest how the indicator will perform on any chart and timeframe you may like to test and/or trade. Of course results will be very different depending on the chart and timeframe you will open. I tested a lot of charts and always you can find a combination that keep this strategy in profit on swing trading style (and this means that if you can have a daily look at the chart you can always manage to maximize your profit on each trade!)
This is a premium indicator , so send me a private message in order to get access to this script.
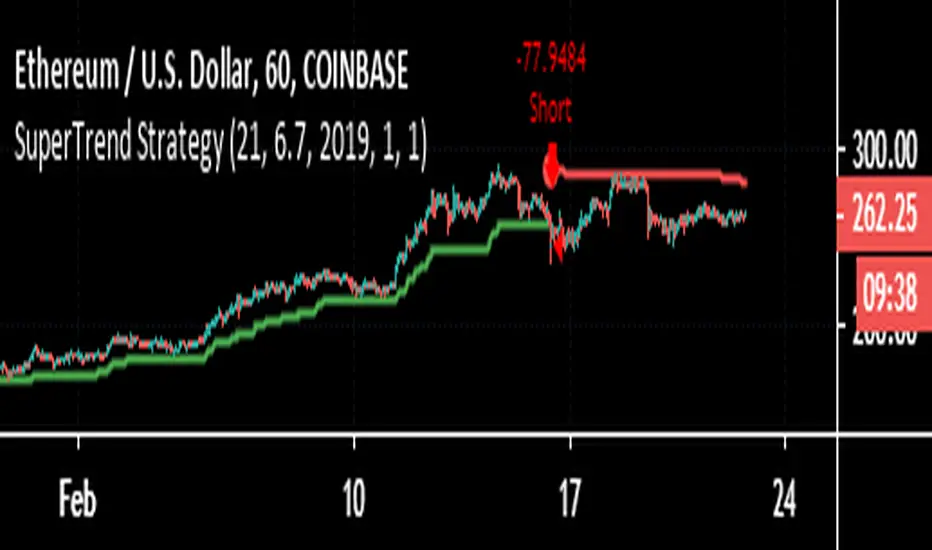
ETHUSD_SuperTrend Strategy_CoinbaseETHUSD SuperTrend Strategy for COINBASE 1HR
This will allow for traders to better visuals entries and exits in a trending ETHUSD market on COINBASE
Trend Artificial Intelligence Hello Everybody,
One thing that is important to understand is that every strategy needs to be tuned: for underlying, exchange, time frame etc.
There are so many indicators and tools ( moving average, Renko, RSI etc etc...) well proven and accepted by traders but you pick any of them and apply to any underlying it will not work. Why because they need to be tuned to specific factors.
This strategy is tuned using Artificial Intelligence models for Oanda Exchange for Euro/USD currency with time frame of 1 min ( this is very important)
Don't trust me check out its performance and you will know. Getting 10-20% return per month is not impossible.

Silver Long/Short Combines Gold and Silver price ratio with SMA trend indicators for buy and sell signals.

Strategy - Backtest Uber Baseline [UTS]Backtesting of Uber Baseline
equity 50k
2% Risk
optimized on USD pairs
start year and month input
ATR based Stop-Loss
no trade on Overshoot Up/Down
no trade against the trend
---
DM / Tip / Subscribe for access

Bio's LRL Straty
Its a strategy, in contrast with the last study I posted.
You have a FAST/SLOW Ma/Emas, and a LRL which is made of 2 different lenghts aswell.
Its backtested on Daily frames, and I advice to not blindy trust the signals, but consider using the buy signals as spot price opportunity for buy and hold.
LRL gives you the dominating trend.
SLOW EMA66 a LIME/RED signal, which you have to interpret in function of the LRL line.
The fast MA33 is useful as a moving Support/Resistance line.
Im still optimizing it, so you might find updates to this script.
I also made a strategy, which Im perfecting so I will give u an even easier tool if I find the holy grail :P
If you have any doubt, please consider asking.
Otherwise you will be helping me by leaving a feedback.

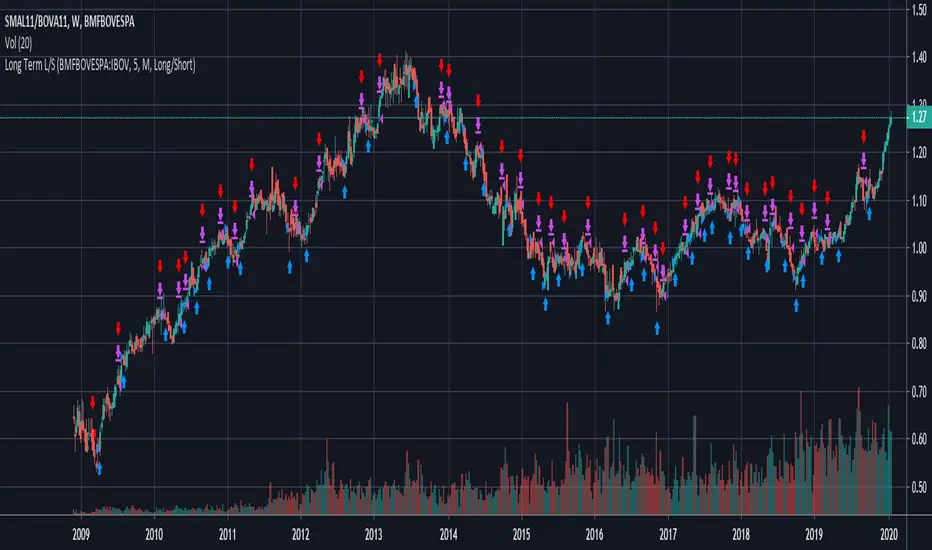
Long Term Long/Short Strategy (Pair Trading)Longing or shorting an asset ratio depending on long term trend.
Long term trend is defined by crossing of an asset or index and its SMA.
Input values:
* trend asset
* SMA configuration (periods, resolution)
* strategy: long only, long/short, short only
THE HITMAN - Market Momentum FinderThe Hitman indicator is a tool to detect momentum swings in the market. Its intention is to identify good entry and exit points and alert you to have a closer look at the charts. It can be used on any chart, timeframe or market.
In detail we measure the strength of a trend by different values like volatility , price averages and trend momentum and calculates for every candle, if a change in trend appears or not.
Be aware, that all results will be based on data from the past. There is no guarantee that the results you get by back testing, will also be achieved in the future.
How to use it?
We recommend to use the signal only in direction of the trend. It can be used to scalp against the trend but for Risk Management reasons we advise not to do so. In sideways movement we recommend to look out for channels or levels of resistance and support and use the signal of the script as confirmation.

The 100% - Bitcoin BeatsHello, Hello, Hello,
And welcome back, to Bitcoin Beats.
This is a strategy & Indicator that's essentially supertrend. However, we have used machine learning and AI to determine the best parameters in order to never lose money.
Yes you read that correctly, this Algo has NEVER lost a trade. All trades have come through successfully based on % moves.
A 'Supertrend' indicator is one, which can give you precise buy or sell signal in a trending market. ... The buy and sell signals are generated when the indicator starts plotting either on top of the closing price or below the closing price.
This strategy finds the best exit point without ever having to take a loss. This means you can use Cross leverage if the risk management is good enough and not worry about your account getting REKT as the trade always comes through in the end.
Trade at your own risk.
Thanks you and Goodbye, From Bitcoin Beats.

SMA Cross Entry & Exit StrategyThis is a TradingView Strategy Script meaning you can't execute real trades using your exchange API connected to your TradingView account, it is designed for backtesting only
This is a basic backtesting script for charting the bullish and bearish cross of two user defined simple moving averages, select the cog next to the name of the script ON the price chart in the left hand corner. The script will print to the screen either "Long Entry" or "Short Entry" depending on the direction of the cross. The script using TradingView strategies will subsequently close the opposite of the position that is executed when the bullish or bearish cross occurs. Simply put, if you are short and a bullish cross occurs, your short trade will close and be logged in strategies and the long will fire. You can pyramid the long and short positions to continue entering as long as the trend doesn't flip. You will find this in the script settings. Since this script is for backtesting you can manually set the "backtesting range" for TradingView Strategies and firing the "Long Entry" and "Short Entry". This as well, is in the settings.
Notice: When the SMA cross occurs, you have to wait till the next candle before TradingView Strategy will print the "Long Entry" or "Short Entry" to the screen
TradingView - How To Use Strategies: www.tradingview.com

Hermes v1.0Hello
Today, I'm releasing Hermès my Eth Trading Script.
Hermès is a variation of my BTCUSDT Script Hadès.
It's looking for specific money/price patterns and compares the results with the "retails sentiment" then, the potential signals are filtered out with an advance/exclusive trend detector. ("Apóllôn" module).
Because this script is expected to be used with Bitmex, you should have a solid trading knowledge(money/Risk Management) .
On the last 4 Months:
* High Profits (~242% fees included)
* Extreme Accuracy (~92.86%)
* Very Low drawdown (-6%)
* About 4-5 Trades a month.
This indicator has been developed for BITMEX:ETHUSD /15Mins/Candles only.
As usual with my scripts:
- No repaint.
- Two Weeks of trial. (Minimum 1 Full trade/nothing to lose!)
Don't hesitate to claim your trial to check on its performance.
More information in my signature.(again don't hesitate to send me a message if you have questions)
Have a Good Day!

CLI : micro variations strategyDisclaimer :
This script is exclusively reserved to business customers.
There's no free trial.
For any request, drop us a private message.
_____________________________________________________________
Hello TV community,
Let us present our internal script strategy :
The core algorithm focuses on micro-variations (μ.var feature) calculations.
It has been developed in order to be timeframe independent : as a consequence, μ.var feature will keep a similar value scale amongst timeframes.
Preventing from any lags, the core algorithm detects any minimal and to be considered trend change (signal feature).
It's definitely a great tool for scalpers due to its core feature (micro-variations focused).
Sincerely,
SECURIX
________________________
Risk Warning : The value of your investments can go down as well as up, so you could get back less than you invested. Past performance is no guarantee of future returns.

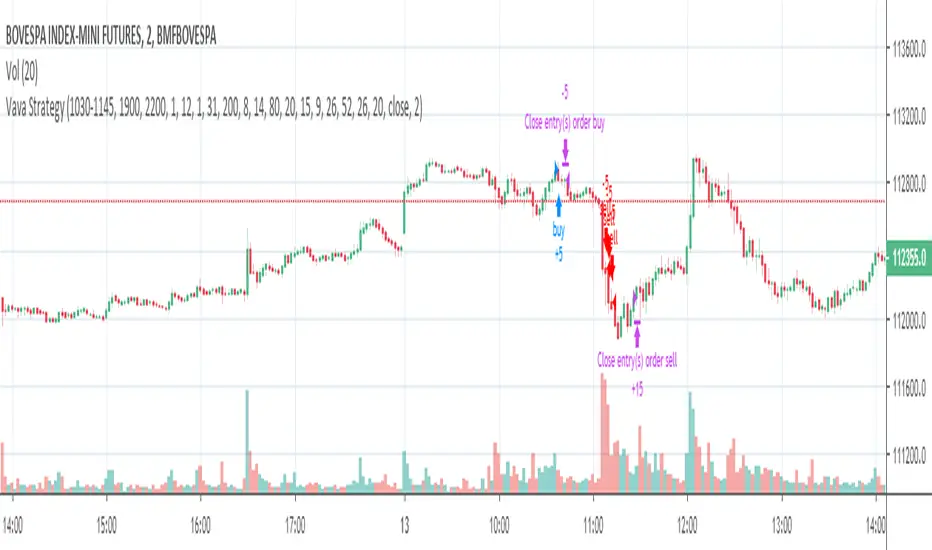
Vava Strategy - Ichimoku Kinko Hyo AdaptedCandlestick
Setup BOVESPA index or mini index, timeframe 2min, Senssion Star: 10:00, Session End:11:45, BB Lenght = 56, pyramiding: 3
Strategy use Ichimoku Cloud, Mfi, trend SMA short and Bollinger Bandas.
Aroon Oscillator strategy by SauciusThis strategy suits better for stock, indexes and commodities sufficiently volatile but with not so strong trend, where perspective of future quotations are not so certain.
For these financial instruments this system works better than others based on classical trend oscillator (like Supertrend)
This strategy starts from the idea of the creator of Aroon lines, Tushar Chande, whose suggested to an unique Aroon Oscillator (defined as Aroon Up - Aroon Down), instead of 2 lines (for reference, original article avaible in:" Stocks & Commodities , V. 13:9 : A Time Price Oscillator by Tushar Chande, Ph .D."" - paragraph: "more patterns").
Use middle line for taking position, and the extreme ones (high and low) for exiting from long/short position. Extreme lines are not use for opening position against the trend.
Best values are for EU stocks and indexes: 19 periods, middle line = - 25 (ecxpecially for shares, give the general tendency of growing). Therefore also levels for exiting long/short position are not specular (levelhigh stops at + 75, low at -85 since stocks when go down, fall often heavily)
Please give feedback for improving this strategy! All the best,
MS .

OnePunch Algo Hard BUY/SELL and Date Range - Version 1~~~ How to Detect Sell Signals ~~~
The First Red Outlined Yellow Bar after a purple "close entry order long" signal : then that is a SELL
~~ What is Purple Signal~~~
Purple "Close Entry Order Long" is a warning for a trend reversal. Normally this is given when the upward trend is reversed.
~~~ How to Detect Buy Signals ~~~
Like in the screenshot, the 1st blue "long" signal after 1 or couple of white bars; then it is a BUY.
Note: This is only available for invited members only. This is a new strategy with Dates ranges.

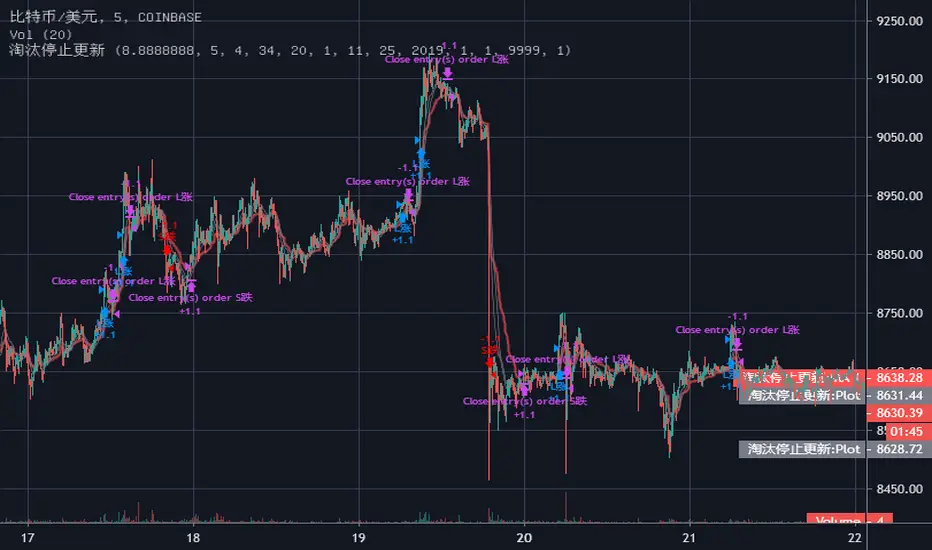
5m Bithanos Channel pro 0.1(灭霸比特币2847198141 战队内测)"enter L" means enter long
"enter S" means enter short
"close enter L" means close enter long order
"close enter S" means close enter short order
This is Channels strategy,
when the price crossover the upper line ,may be there is new up trend.
when the price crossunder the lower line ,may be there is new down trend.
you can set the middle line to be the stop loss level .
just for bitcoin 5m.
"enter L" means 看多
"enter S" means 看空
"close enter L" 停止看多
"close enter S" 停止看空
这是通道策略
当价格上穿上轨时候,也许新的上涨趋势即将出现。
当价格下穿下轨时候,也许新的下跌趋势即将出现。
你可以将中轨设置为止损位置。
仅适用于比特币5分钟级别。
价格选择:建议COINBASE/BITSTAMP
止损分享:0.25%-1% 幅度酌情根据杠杆止损,或者中轨硬止损。
友情提醒:默认参数不合适,非战队无法获得优化参数。