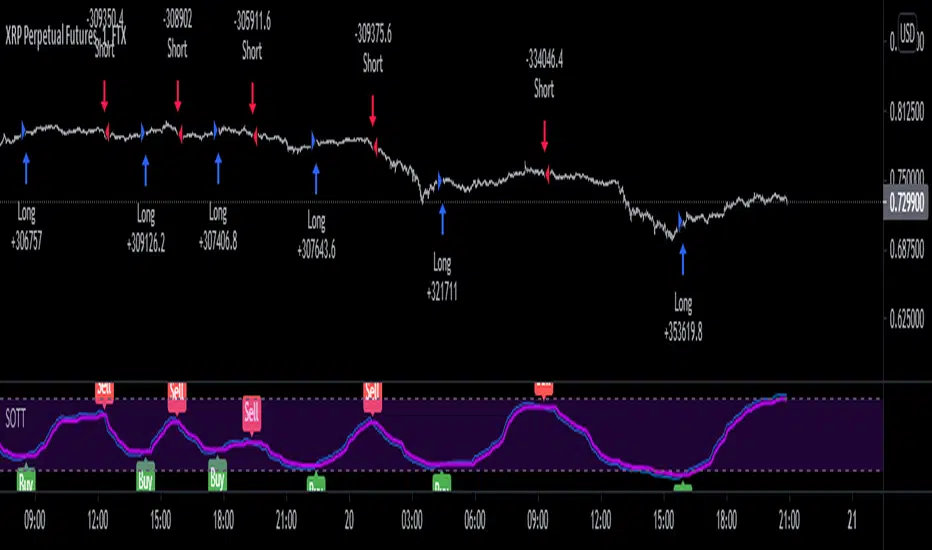
Stochastic Optimized Trend Tracker *Strategy*Stochastic OTT is Anıl Özekşi's latest derived version of Optimized Trend Tracker on Stochastic Oscillator.
He tried to solve the fake signals of Stochastic Oscillator by adopting OTT on the indicator.
He advised users to set the stochastic smoothing parameters to 500 and 200 on his latest video about SOTT.
He personally uses 1 min charts on stock market so the parameters of the indicator might have to be optimized for other time frames nad markets.
He exaggerated the Stochastic to 1000's to have better signals of percent values of OTT .
Also hes used VIDYA in both calculations of OTT and Stochastic smoothing.
Said, Kıvanç Özbilgiç.
I just made a Strategy version of the script so that we lads can backtest it. The codes for that are yet again from Kıvanç Özbilgiç :) I just copy-pasted a few and did some adjustments. Hope you enjoy!
#betonyetmez
Search in scripts for "trend"
Smoothed Trend Wave (Strategy)
This is a the Final version of Smooth Trend Wave
* Average Trend is show
* Calculation of different period of moving average
* Candlestick Pattern
* Background color is based on candle color.
Use Strategy Format to show back-test result. When I create this indicator is based on daily chart. (lower timeframe, result might be different)
7 type of strategy (can be select)
Strategy 1 & 2 : long/short according the trend
Strategy 3 & 4 : long/short according retracement in same trend
Strategy 5 & 6 : long/short bet for rebound
Strategy 7 : potential buying point (low chance happens)
Example of back-testing is use crypto between 1-1-2019 to 30-7-2020 (after JULY is a bullish momentum will causing *repaint" of strategy result)
* Strategy is set initial equity of 10000usd
* Each order is only 30% of equity, to make risk management
* Maximum 5 order is allow in strategy
Kindly PM or comment below if you have any question.

Follow the Trend - Trade PullbacksKindly follow the rules stated below for entry, exit and stop loss. Not every Buy / Sell signal will be profitable.
Timeframe of the chart acts as current timeframe. You need to choose 2 more as middle and higher timeframes.
This indicator is based on candlesticks, ATR and CCI indicators and the logic provides buy / sell signals at the pullbacks of the trend depicted by higher timeframe, that must be respected throughout.
Enter the long / short trade respectively when the indicator gives buy / sell signal after price has gone below the green / above the red line for higher timeframe.
Stop loss shall be low / high of recent swing. Exit when the price closes below / above the middle timeframe, to be used as trailing target.
Use it for any instrument for any timeframe of your choice.
For example, check the shared chart. It is a 1 min intraday, but the indicator can be used for short or long term positional trades as well.
Enter long at 14102, with stop loss 14077. Trailing target is achieved at 14156 giving a Risk:Reward ratio of 1:2.
Another Buy signal is observed around same level and uptrend continues till day end, again for a Risk:Reward ratio of approx. 1:2.
Rules to follow for Long trades -
Enter long position at Buy signal given after price has moved below green line of higher timeframe.
Exit the position when price closes below orange / blue line of middle timeframe.
Stop loss must be at low of recent swing, appearing just before the Buy signal.
Rules to follow for Short trades -
Enter short position at Sell signal given after price has moved above red line of higher timeframe.
Exit the position when price closes above orange / blue line of middle timeframe.
Stop loss must be at high of recent swing, appearing just before the Sell signal.

Optimized Trend Tracker STRATEGY & SCREENEROptimized Trend Tracker - OTT STRATEGY & SCREENER screens the BUY and SELL signals (trend reversals) for 20 user defined different tickers in Tradingview charts.
Simply input the name of the ticker in Tradingview that you want to screen.
Terminology explanation:
Confirmed Reversal: OTT reversal that happened in the last bar and cannot be repainted.
Potential Reversal: OTT reversal that might happen in the current bar but can also not happen depending upon the timeframe closing price.
Downtrend: Tickers that are currently in the sell zone
Uptrend: Tickers that are currently in the buy zone
Screener has also got a built in OTT indicator which users can confirm the reversals on graphs.
Screener explores the 20 tickers in current graph's time frame and also in desired parameters of the OTT indicator.
Also you can optimize the parameters manually with the built in STRATEGY version.
Optimized Trend Tracker indicator :
Built in Moving Average type defaultly set as VAR but users can choose from 8 different Moving Average types like:
SMA : Simple Moving Average
EMA : Exponential Movin Average
WMA : Weighted Moving Average
TMA : Triangular Moving Average
VAR : Variable Index Dynamic Moving Average aka VIDYA
WWMA : Welles Wilder's Moving Average
ZLEMA : Zero Lag Exponential Moving Average
TSF : True Strength Force
Tip: In sideways VAR would be a good choice
You can use OTT default alarms and Buy Sell signals like:
1-
BUY when Prices are above OTT
SELL when Prices are below OTT
2-
BUY when OTT support Line crosses over OTT line.
SELL when OTT support Line crosses under OTT line.
3-
BUY when OTT line is Green and makes higher highs.
SELL when OTT line is Red and makes lower lows.
IMPORTANT: SCREENER ONLY EXPLORES AND SCREENS FOR THE 2nd SIGNAL TYPE:
BUY when OTT support Line crosses over OTT line.
SELL when OTT support Line crosses under OTT line.

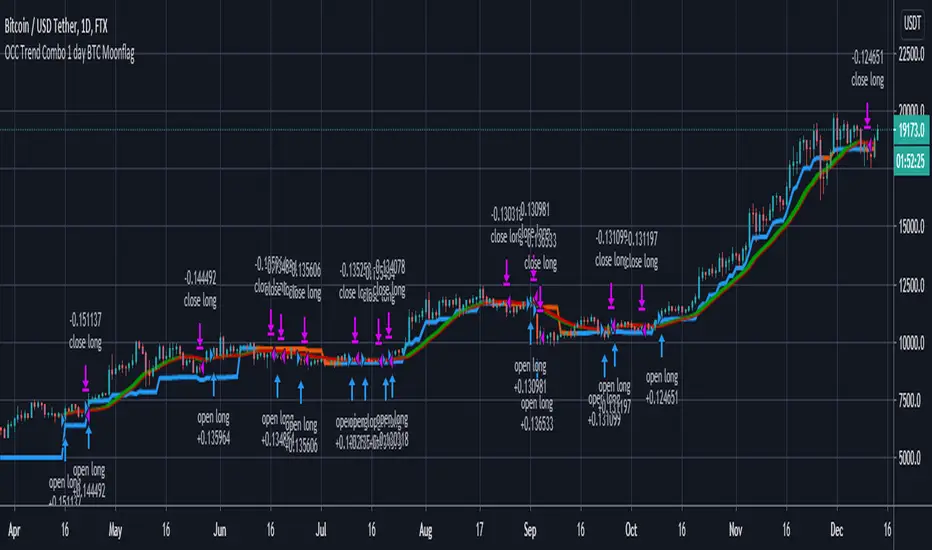
OCC Trend Combo 1 day BTC MoonflagRuns on BTC 1 DAY (NOTE USE THIS NOT THE PREVIOUS VERSION - DEFAULTS TUNED TO 1 day BTC HERE)
USE DEFAULT SETTINGS
The strategy is to maximise the profit for OCC longs (ALMA algo)
Longs start when the price action settles around the ALMA OCC, then typically breaks up
Then follow the trend indcator (blue/orange)
Shorts normally happen when the price action crosses below the ALMA OCC, although these initiate faster than the 1 day time setting - so watchout for shorts - are harder to predict than longs
So this catches most of the big move longs at their initiation
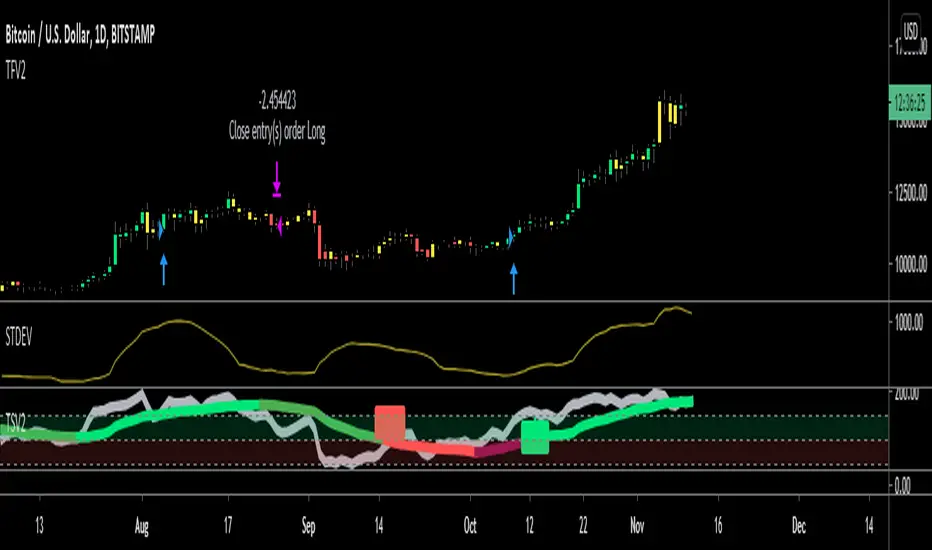
Trend Finder V2A variation of a previous indicator i made using two stochastics and a volume weighted moving average to look for trend, 10% equity used per trade at 0.1% commission
The close can be used more of a stop loss if volatility is used to take profit
Strategy Super Trend v0.4This strategy is written for trading cryptocurrencies using the super trend indicator. The main parameters of the strategies include the super trend indicator settings, as well as the testing period. An important advantage of strategies is the use of a martingale to close positions, which increases profitability!

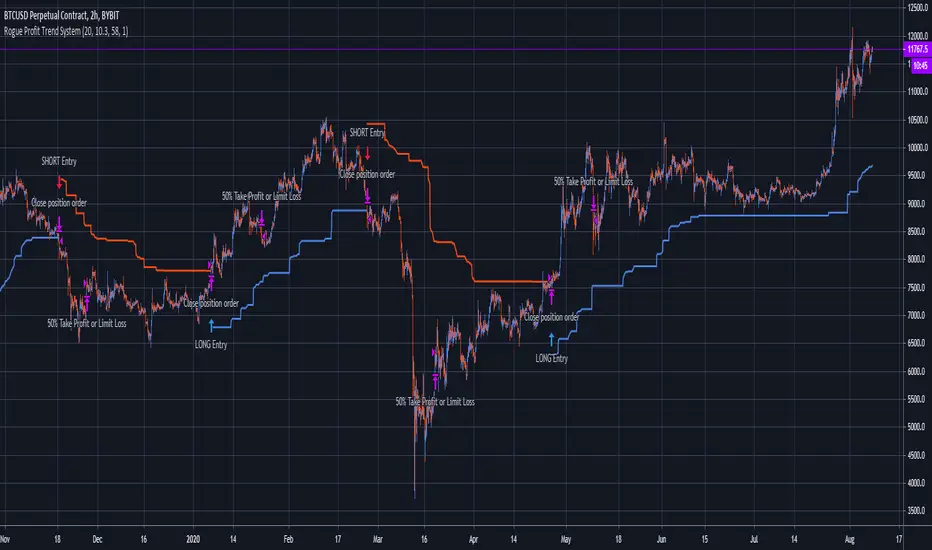
Rogue Profit Trend SystemThis system can be used for all assets. This script identifies trends and when to enter and exit. There is also built in risk management in the form of a take profit target or a reduction of risk to limit a losing trade. Inputs are variable and can be changed to better suit the asset and time frame you are trading. Since the risk management (take profit or limit loss) is calculated by 50% of your position, this system is designed to trade in multiples of two's. For example, you enter into a position with $100 at risk, when your risk management signal fires, it will reduce your position by 50% to either snag some profit or limit a loser leaving you with $50 in the position. Close the trade completely when the trend reverses for either a profit or loss.
Nothing about trading is easy. You will have losing trades. Managing your risk is the key to success which is why this system is so powerful. Markets are fluid and random so you will have to put some time and effort into adjusting the system inputs for each asset and the respective time frame you are trading and continue to adjust as time passes. This system will make you money if you manage it correctly and systematically.
Message me for two day trial access. Happy trading!
Combo Backtest 123 Reversal & Extracting The Trend This is combo strategies for get a cumulative signal.
First strategy
This System was created from the Book "How I Tripled My Money In The
Futures Market" by Ulf Jensen, Page 183. This is reverse type of strategies.
The strategy buys at market, if close price is higher than the previous close
during 2 days and the meaning of 9-days Stochastic Slow Oscillator is lower than 50.
The strategy sells at market, if close price is lower than the previous close price
during 2 days and the meaning of 9-days Stochastic Fast Oscillator is higher than 50.
Second strategy
Extracting The Trend
The related article is copyrighted material from Stocks & Commodities Mar 2010
WARNING:
- For purpose educate only
- This script to change bars colors.

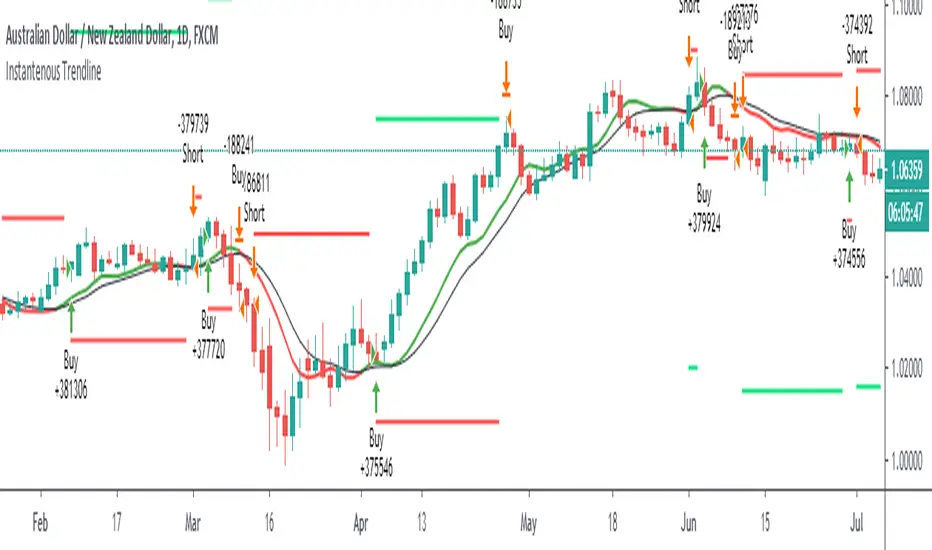
Etlers Instantenous TrendlineThis script uses @cheatcountry script to calculate Ehlers Instantenous Trendline .
Backtest offers 3 capital management tools. One that will always calculate order size as initial capital/close, one that uses the same calculation but adds or substracts profit. The last one allows you to enter manually the size you want to trade.
Green and red horizontal lines are profit/stop values.
Optimized Trend Tracker - Strategy VersionA brand new indicator from the developer of MOST (Moving Stop Loss) indicator Anıl Özekşi.
Optimized Trend Tracker OTT is an indicator that provides traders to find an existing trend or in another words to ser which side of the current trend we are on.
The original indicator was coded and published by Kıvanç Özbilgiç. You can access it from this link:
I transformed the indicator into a strategy and made some changes:
- You can run two different strategies. In the Settings section, you can test two different strategies, "Support Line Crossing Signals" and "Price / OTT Crossing Signals".
- Fixed the issue where BUY/SELL labels from the indicator script would hang in the air.
- I added a setting where you can hide BUY/SELL labels if you want.
- I painted the bars for BUY/SELL states, you can open and close in the settings section.
- As I do with every strategy script, I added a start and end date for the strategy test. You can specify the range you want to see working in the Settings section.
In addition, there were cases when the OTT line was reduced to zero in non-voluminous symbols; I changed this situation by making a small change in the code. I asked Kıvanç about the subject, I can update according to his answer.
Note : Strategy BUY / SELL tags and indicator BUY / SELL tags do not operate in the same bar because indicator tags are added when the next bar occurs. If you replay bars, you can observe label formations.
TÜRKÇE AÇIKLAMA
Orjinal indikatör Kıvanç Özbilgiç tarafından kodlanmış ve yayımlanmıştır. Bu linkten erişebilirsiniz:
İndikatörü strateji dönüştürdüm ve bazı değişiklikler yaptım:
- İki farklı strateji çalıştırabilirsiniz. Ayarlar kısmında Condition bölümünde "Support Line Crossing Signals" ve "Price/OTT Crossing Signals" olarak iki farklı stratejiyi test edebilirsiniz.
- İndikatör scriptinden gelen BUY/SELL etiketlerinin havada durması sorununu düzelttim.
- İsterseniz BUY/SELL etiketleri gizleyebileceğiniz bir ayar ekledim.
- BUY/SELL durumları için barları boyadım, ayarlar bölümünden açıp kapatabilirsiniz.
- Her strateji scriptinde yaptığım gibi, strateji testi için başlangıç ve bitiş tarihi ekledim. Ayarlar bölümünden çalışmasını görmek istediğiniz aralığı belirleyebilirsiniz.
- Ek olarak hacimsiz sembollerde OTT çizgisinin sıfıra indiği durumlar mevcuttu; kodda ufak bir değişiklik yaparak bu durumu değiştirdim. Kıvanç Bey'e konu ile ilgili soru sordum, cevabına göre güncelleme yapabilirim.
Not : Strateji BUY/SELL etiketleri ile indikatör BUY/SELL etiketleri aynı barda işlem yapmamaktadır çünkü indikatör etiketleri kendisinden sonraki bar oluşunca eklenmektedir. Barları replay yaptırırsanız oluşumlarını gözlemleyebilirsiniz.

MystockMoney Trend Trading Tool 0.2THIS INDICATOR IS ADVANCE VERSION OF MystockMoney Trend Trading Tool
This indicator is a trend following indicator its a mix of CPR , VOLUME + TREND INDICATOR. This will help You to understand Market Trend.
CPR Frank Ochoa call it It Pivot Range Histogram in his book.
Use it in conjunction with the Central Pivot Range indicator.
Once the trigger of the trend direction is made, the FollowLine will be placed at High or Low (depending of the trend).

EMA Slope Trend Follower StrategyThis strategy is based on the slope of the EMA130.
Over that slope, the script calculates two EMAs (9,21) which are used to generate the main entry and exit signal.
In particular, the strategy enters a LONG position when EMA9 > EMA21. On the contrary, it closes the LONG and opens a SHORT when EMA9 < EMA21.
When the slope of the EMA130 is rising, it means that the price is accelerating upwards, fueling an uptrend. Conversely, when the slope is falling, it means that the price is slowing down, falling into a possible downtrend.
Calculating and analyzing two EMAs (fast and slow) over the slope of a medium length EMA instead of the price anticipates a lot the signal. In this way, the strategy never miss a trend.
In order to minimize false positives (entering useless positions), I included two filters, which can be optionally turned on:
- Trend Filter: When the price is above EMA200, the strategy opens ONLY LONG positions. If price < EMA200, only shorts allowed. If the slope gives a long signal and price is below EMA200, for example, the eventual SHORT position is closed, but the LONG entry is postponed to the moment when both conditions (slope uptrending and price > ema200) are met.
I recommend always turning on this filter, as it dramatically decreases drawdown.
- Volatility Filter: When the standard deviation of the last 20 candles is below its 50 samples moving average, no positions are opened, as market is going sideways. The purpose of this filter is to prevent false positives (positions which open and close in a matter of candles due to false signals in sideways market).
I recommend turning on this filter only on low time frames.
This strategy works great on medium time frames (like 4h, 6h, daily), since it spends way less in fees, opening less positions.
It works good on low TFs too (up to 1h, didn't test lower ones), provided Volatility filter is turned on and parameters are set according to the asset.
Commission included in calculations: 0.06% (it's the taker commission on BitMEX with the 10% discount obtainable with any referral link)
Slippage included in calculations: 2 ticks (BitMEX has very liquid order books, and slippage doesn't happen very often unless a huge position size is used).

MystockMoney Trend Trading ToolThis indicator is a trend following indicator its a mix of CPR , VOLUME + TREND INDICATOR. This will help You to understand Market Trend.
CPR Frank Ochoa call it It Pivot Range Histogram in his book.
Use it in conjunction with the Central Pivot Range indicator.
Once the trigger of the trend direction is made, the FollowLine will be placed at High or Low (depending of the trend).

GOLD SUPER TREND ARROW SIGNALS STRATEGY WITH PERFORMANCEThe strategy is based on combination of ATR, Moving Averages, Volatility indicators that was filtered and final strategy based on accurate arrows that catch trend and
also predict pivot points for intraday Gold ( XAUUSD ) charts.
The strategy script can be used for time frames 30 MIN, 45 MIN, 1Hour, 4 HOURS.
The goal was to create trending strategy with maximum profit and lowest drawdown.
For initial deposit $12000 time frame 30 MIN profit was 42% with maximum drawdown 6%:
For time frame 45 MIN profit was 30% with maximum drawdown 5%:

Intraday Trend Following Algorithm [Bitduke]Description :
Trend following strategy that constantly adjusts to volatility and avoids of most whipsaws; rapidly moves up or down according to a quickly changing market. Great strategy for high volatile markets, like crypto market.
Based on a couple of special moving averages with integrated smoother which helps to avoid whipsaws.
Backtesting
Backtested on BTCPERP ( FTX ). It shows much better results on 4h timeframe (more than 222% YTD) and relatively low drawdown which allows you to use up to x3 leverage without a fear of huge losses. I.e if we have 5% drawdown for this strategy and using x3 leverage then to be prepared to 15% drawdown maximum in this case.
Initial Capital: $1000
Capital per trade: $1000
Including fee: 0.075% (buy + sell) side, type "taker"
When we get a signal (green/red column on chart) algo opens a trade by the next candle open price.
Others:
Risk management: Stop loss/Take profit in %
Strategy doesn't repaint .
----------
To access: sign up on FTX using ref link from my signature.

FTSMA - Trend is your frendThis my new solid strategy: if you belive that "TREND IS YOUR FRIEND" this is for you!
I have tested with many pairs and at many timeframes and have profit with just minor changes in settings.
I suggest to use it for intraday trading .
VERY IMPORTANT NOTE: this is a trend following strategy, so the target is to stay in the trade as much as possible. If your trading style is more focused on scalping and/or pullbaks, this strategy is not for you.
This strategy uses moving averages applied to Fourier waves for forecasting trend direction.
How strategy works:
- Buy when fast MA is above mid MA and price is above slow MA, which acts as a trend indicator.
- Sell when fast MA is below mid MA and price is below slow MA, which acts as a trend indicator.
Strategy uses a lot of pyramiding orders because when you are in a flat market phase it will close 1 or 2 orders with a loss, but when a big trend starts, it will have profit in a lot of orders.
So, if you analize carefully the strategy results, you will note that "Percent Profitable" is very low (30% in this case) because strategy opened a lot of orders also in flat markets with small losses, BUT "Avg # bars in winning trades" is very high and overall Profit is very high: when a big trend starts, orders are kept open for long time generating big profits.
Thanks to all pinescripters mentioned in the code for their snippets.
I have also a study with alerts. Next improvement (only to whom is interested to this script and follows me): study with alerts on multiple tickers all at one. Leave a comment if you want to have access to study.
HOW TO USE STRATEGY AND STUDY TOGHETER:
1- Add to chart the strategy first, so your workspace will be as clean as possible.
2- Open the Strategy Tester tab at footer of the page.
3- Modify settings to get best results (Profit, Profit Factor, Drawdown).
4- Add study with alerts to your chart with same setting of strategy.
I WILL PROVIDE A DETAILED QUICK INSTALLATION GUIDE WITH THE STUDY!
Please use comment section for any feedback or contact me if you need support.

KBL Trend - FilterKBL Trend Filter is a combination of Average true range and range breakout settings.
When KBL Trend -Filter Vertical line indicated with Green color and price cross over the candle on which the green vertical indicator came, then it is considered as a buy trades.
And same for sell trade,
When KBL Trend -Filter Vertical line indicated with Red color and price cross below the candle on which the Red vertical indicator came, then it is considered as a sell trades.

Derivative Based TrendsUses a combination of moving averages to establish trends, and finite-difference derivative approximations to predict possible reversals. Seems to work best on 1 hour charts of less volatile currency pairs.
Trend Balance Point System by Welles WilderThis is the original Trend Balance Point System created by Welles Wilders in 1978, rules can be found in his book New Concepts in Technical Trading Systems.

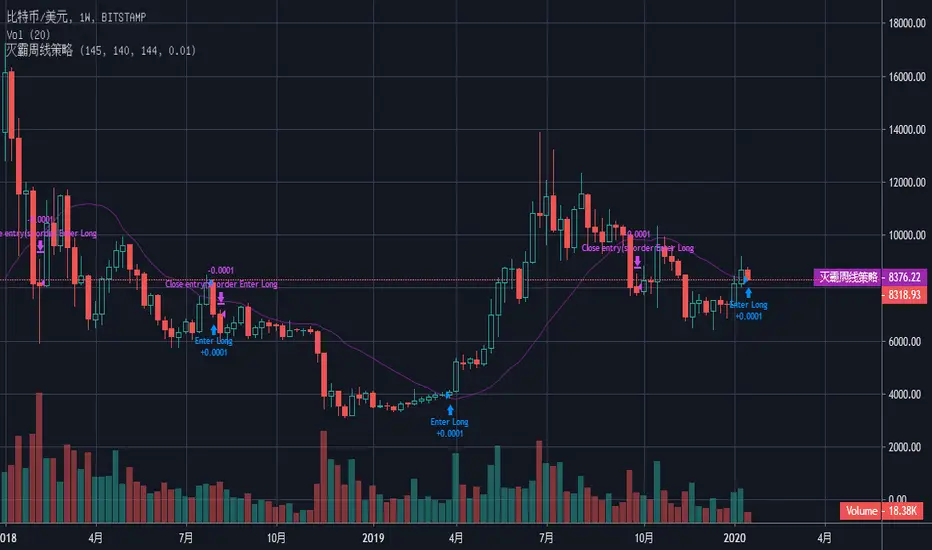
Bithanos Weekly Trend strategy 灭霸比特币BITSTAMP:BTCUSD
Just for bitcoin weekly trend strategy. It is mainly used for helping to decide buy and sell spot bitcoin.
"enter long" on chart meas the price may go up trend in future weeks.
"close the enter long order " on chart meas the price may not go up trend in future weeks.The indeterminacy of future may be go down trend or Shock market.
Recommended the "position%" to be "1".
推荐用bitstamp BTCUSD 交易对。
仅用于比特币周线趋势策略。主要用于帮助判断现货比特币的买卖。
“enter long ” 周线看涨
“close enter long” 周线止看涨,说明后面不确定,可能是震荡,也可能是下跌。
推荐设置 “position%参数”为“1” .
Mcote's Macro TrendThis identifies the macro trend.
The standard settings are for BTC (Bitmex) 2hour chart using settings 0, -2 and 4.
Other Settings: BTC (Bitmex) 4 hour chart using settings 0, 0 and 0.
You can find some profitable settings for lower timeframes too like BTC 15m -2, 8 and 8. This gives approx 23.5% profit and 4.6% DD for the past 4 weeks.
Have a play around with your own settings and let me know how you get on with the profits and other markets.
It also works in the Forex Market, for example on GBP/USD 4 hour chart it is quite easy to find settings that achieve 1300 pips over the year with 69% win ratio.

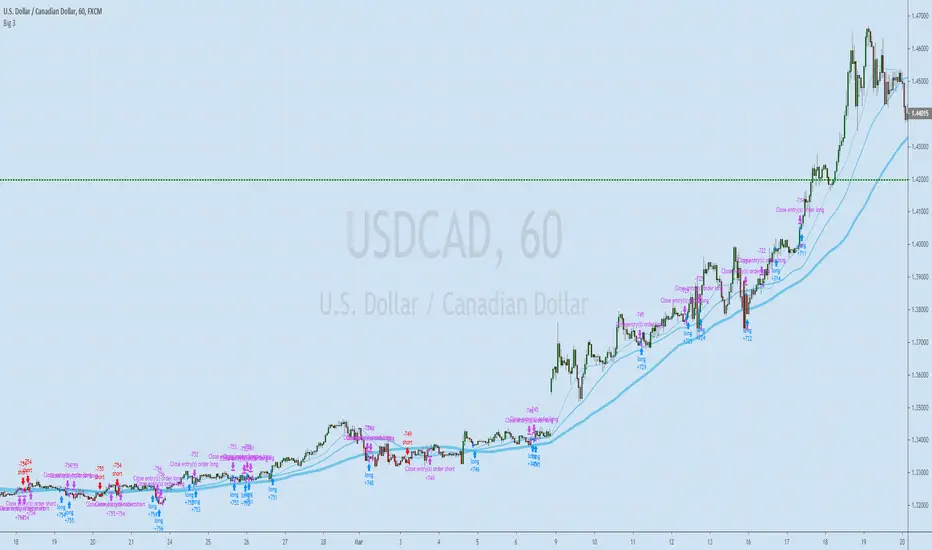
Bithanos Daily Trend Strategy 灭霸比特币
BITSTAMP:BTCUSD
Ma cross up and down,make the "enter long" or "close order" symbol out the chart.
Modify the function of Ma by math as to reduce the mistake symbol.
"enter long" on chart meas the price may go up trend in next days.
"close the enter long order " on chart meas the price may not go up trend in next days.
the parameter can be changed,you can try the length89 the fastlength16,the position% 1.
Recommended parameter setting is 89 16 1
“enter long ” 日线看涨
“close enter long” 日线停止看涨
推荐参数设置依次是89 16 1
