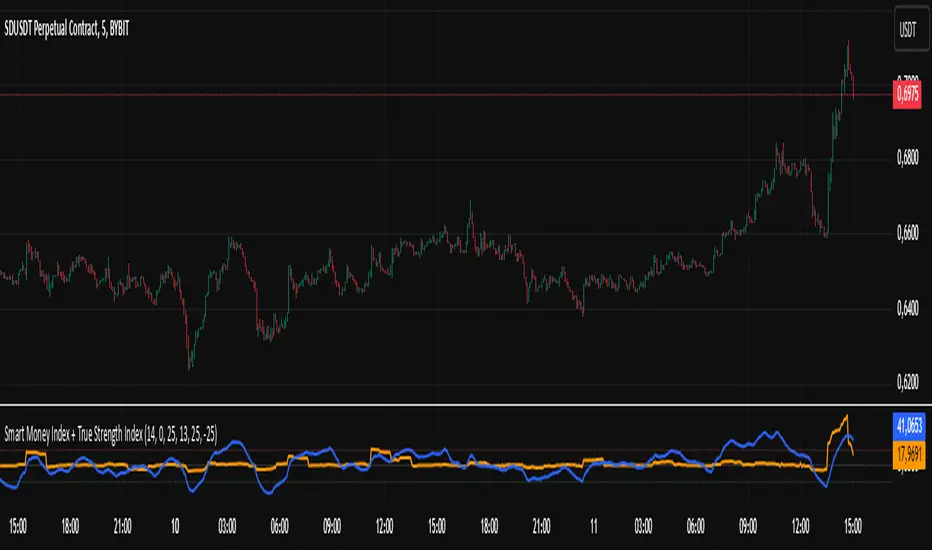
Smart Money Index + True Strength IndexThe Smart Money Index + True Strength Index indicator is a combination of two popular technical analysis indicators: the Smart Money Index (SMI) and the True Strength Index (TSI). This combined indicator helps traders identify potential entry points for long and short positions based on signals from both indexes.
Main Components:
Smart Money Index (SMI):
The SMI measures the difference between the closing and opening price of a candle multiplied by the trading volume over a certain period of time. This allows you to assess the activity of large players ("smart money") in the market. If the SMI value is above a certain threshold (smiThreshold), it may indicate a bullish trend, and if lower, it may indicate a bearish trend.
True Strength Index (TSI):
The TSI is an oscillator that measures the strength of a trend by comparing the price change of the current bar with the previous bar. It uses two exponential moving averages (EMAS) to smooth the data. TSI values can fluctuate around zero, with values above the overbought level indicating a possible downward correction, and values below the oversold level signaling a possible upward correction.
Parameters:
SMI Length: Defines the number of candles used to calculate the average SMI value. The default value is 14.
SMI Threshold: A threshold value that is used to determine a buy or sell signal. The default value is 0.
Length of the first TSI smoothing (tsiLength1): The length of the first EMA for calculating TSI. The default value is 25.
Second TSI smoothing length (tsiLength2): The length of the second EMA for additional smoothing of TSI values. The default value is 13.
TSI Overbought level: The level at which the market is considered to be overbought. The default value is 25.
Oversold level TSI: The level at which it is considered that the market is in an oversold state. The default value is -25.
Logic of operation:
SMI calculation:
First, the difference between the closing and opening price of each candle (close - open) is calculated.
This difference is then multiplied by the trading volume.
The resulting product is averaged using a simple moving average (SMA) over a specified period (smiLength).
Calculation of TSI:
The price change relative to the previous bar is calculated (close - close ).
The first EMA with the length tsiLength1 is applied.
Next, a second EMA with a length of tsiLength2 is applied to obtain the final TSI value.
The absolute value of price changes is calculated in the same way, and two emas are also applied.
The final TSI index is calculated as the ratio of these two values multiplied by 100.
Graphical representation:
The SMI and TSI lines are plotted on the graph along with their respective thresholds.
For SMI, the line is drawn in orange, and the threshold level is dotted in gray.
For the TSI, the line is plotted in blue, the overbought and oversold levels are indicated by red and green dotted lines, respectively.
Conditions for buy/sell signals:
A buy (long) signal is generated when:
SMI is greater than the threshold (smi > smiThreshold)
TSI crosses the oversold level from bottom to top (ta.crossover(tsi, oversold)).
A sell (short) signal is generated when:
SMI is less than the threshold (smi < smiThreshold)
TSI crosses the overbought level from top to bottom (ta.crossunder(tsi, overbought)).
Signal display:
When the conditions for a long or short are met, labels labeled "LONG" or "SHORT" appear on the chart.
The label for the long is located under the candle and is colored green, and for the short it is above the candle and is colored red.
Notification generation:
The indicator also supports notifications via the TradingView platform. Notifications are sent when conditions arise for a long or short position.
This combined indicator provides the trader with the opportunity to use both SMI and TSI signals simultaneously, which can improve the accuracy of trading decisions.
Search in scripts for "tsi"
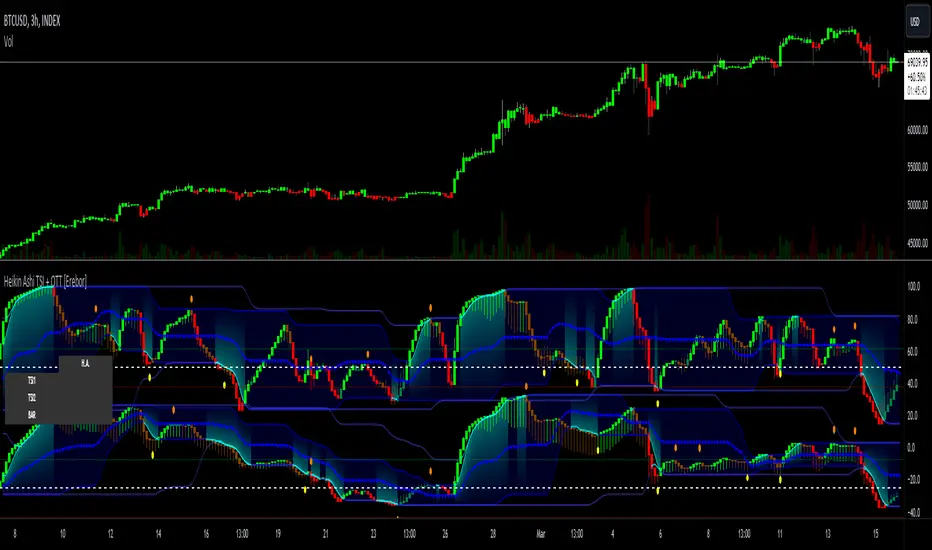
Heikin Ashi TSI and OTT [Erebor]TSI (True Strength Index)
The TSI (True Strength Index) is a momentum-based trading indicator used to identify trend direction, overbought/oversold conditions, and potential trend reversals in financial markets. It was developed by William Blau and first introduced in 1991.
Here's how the TSI indicator is calculated:
• Double Smoothed Momentum (DM): This is calculated by applying double smoothing to the price momentum. First, the single smoothed momentum is calculated by subtracting the smoothed closing price from the current closing price. Then, this single smoothed momentum is smoothed again using an additional smoothing period.
• Absolute Smoothed Momentum (ASM): This is calculated by applying smoothing to the absolute value of the price momentum. Similar to DM, ASM applies a smoothing period to the absolute value of the difference between the current closing price and the smoothed closing price.
• TSI Calculation: The TSI is calculated as the ratio of DM to ASM, multiplied by 100 to express it as a percentage. Mathematically, TSI = (DM / ASM) * 100.
The TSI indicator oscillates around a centerline (typically at zero), with positive values indicating bullish momentum and negative values indicating bearish momentum. Traders often look for crossovers of the TSI above or below the centerline to identify shifts in momentum and potential trend reversals. Additionally, divergences between price and the TSI can signal weakening trends and potential reversal points.
Pros of the TSI indicator:
• Smoothed Momentum: The TSI uses double smoothing techniques, which helps to reduce noise and generate smoother signals compared to other momentum indicators.
• Versatility: The TSI can be applied to various financial instruments and timeframes, making it suitable for both short-term and long-term trading strategies.
• Trend Identification: The TSI is effective in identifying the direction and strength of market trends, helping traders to align their positions with the prevailing market sentiment.
Cons of the TSI indicator:
• Lagging Indicator: Like many momentum indicators, the TSI is a lagging indicator, meaning it may not provide timely signals for entering or exiting trades during rapidly changing market conditions.
• False Signals: Despite its smoothing techniques, the TSI can still produce false signals, especially during periods of low volatility or ranging markets.
• Subjectivity: Interpretation of the TSI signals may vary among traders, leading to subjective analysis and potential inconsistencies in trading decisions.
Overall, the TSI indicator can be a valuable tool for traders when used in conjunction with other technical analysis tools and risk management strategies. It can help traders identify potential trading opportunities and confirm trends, but it's essential to consider its limitations and incorporate additional analysis for more robust trading decisions.
Heikin Ashi Candles
Let's consider a modification to the traditional “Heikin Ashi Candles” where we introduce a new parameter: the period of calculation. The traditional HA candles are derived from the open , high low , and close prices of the underlying asset.
Now, let's introduce a new parameter, period, which will determine how many periods are considered in the calculation of the HA candles. This period parameter will affect the smoothing and responsiveness of the resulting candles.
In this modification, instead of considering just the current period, we're averaging or aggregating the prices over a specified number of periods . This will result in candles that reflect a longer-term trend or sentiment, depending on the chosen period value.
For example, if period is set to 1, it would essentially be the same as traditional Heikin Ashi candles. However, if period is set to a higher value, say 5, each candle will represent the average price movement over the last 5 periods, providing a smoother representation of the trend but potentially with delayed signals compared to lower period values.
Traders can adjust the period parameter based on their trading style, the timeframe they're analyzing, and the level of smoothing or responsiveness they prefer in their candlestick patterns.
Optimized Trend Tracker
The "Optimized Trend Tracker" is a proprietary trading indicator developed by TradingView user ANIL ÖZEKŞİ. It is designed to identify and track trends in financial markets efficiently. The indicator attempts to smooth out price fluctuations and provide clear signals for trend direction.
The Optimized Trend Tracker uses a combination of moving averages and adaptive filters to detect trends. It aims to reduce lag and noise typically associated with traditional moving averages, thereby providing more timely and accurate signals.
Some of the key features and applications of the OTT include:
• Trend Identification: The indicator helps traders identify the direction of the prevailing trend in a market. It distinguishes between uptrends, downtrends, and sideways consolidations.
• Entry and Exit Signals: The OTT generates buy and sell signals based on crossovers and direction changes of the trend. Traders can use these signals to time their entries and exits in the market.
• Trend Strength: It also provides insights into the strength of the trend by analyzing the slope and momentum of price movements. This information can help traders assess the conviction behind the trend and adjust their trading strategies accordingly.
• Filter Noise: By employing adaptive filters, the indicator aims to filter out market noise and false signals, thereby enhancing the reliability of trend identification.
• Customization: Traders can customize the parameters of the OTT to suit their specific trading preferences and market conditions. This flexibility allows for adaptation to different timeframes and asset classes.
Overall, the OTT can be a valuable tool for traders seeking to capitalize on trending market conditions while minimizing false signals and noise. However, like any trading indicator, it is essential to combine its signals with other forms of analysis and risk management strategies for optimal results. Additionally, traders should thoroughly back-test the indicator and practice using it in a demo environment before applying it to live trading.
The following types of moving average have been included: "SMA", "EMA", "SMMA (RMA)", "WMA", "VWMA", "HMA", "KAMA", "LSMA", "TRAMA", "VAR", "DEMA", "ZLEMA", "TSF", "WWMA". Thanks to the authors.
Thank you for your indicator “Optimized Trend Tracker”. © kivancozbilgic
Thank you for your programming language, indicators and strategies. © TradingView
Kind regards.
© Erebor_GIT
Fib TSIFib TSI = Fibonacci True Strength Index
The Fib TSI indicator uses Fibonacci numbers input for the True Strength Index moving averages. Then it is converted into a stochastic 0-100 scale.
The Fibonacci sequence is the series of numbers where each number is the sum of the two preceding numbers. 1, 2, 3, 5, 8, 13, 21, 34, 55, 89, 144, 233, 377, 610...
TSI uses moving averages of the underlying momentum of a financial instrument.
Stochastic is calculated by a formula of high and low over a length of time on a scale of 0-100.
How to use Fib TSI:
100 = overbought
0 = oversold
Rising = bullish
Falling = bearish
crossover 50 = bullish
crossunder 50 = bearish
The default input settings are:
2 = Stoch D smoothing
3 = TSI signal
TSI uses 2 moving averages compared with each other.
5 = TSI fastest
TSI uses 2 moving averages compared with each other.
Default value is 3/5.
color = white
8 = TSI fast
TSI uses 2 moving averages compared with each other.
Default value is 5/8.
color = blue
13 = TSI mid
TSI uses 2 moving averages compared with each other.
Default value is 8/13.
color = orange
21 = TSI slow
TSI uses 2 moving averages compared with each other.
Default value is 13/21.
color = purple
34 = TSI slowest
TSI uses 2 moving averages compared with each other.
Default value is 21/34.
color = yellow
55 = Stoch K length
All total / 5 = All TSI
color rising above 50 = bright green
color falling above 50 = mint green
color falling below 50 = bright red
color rising below 50 = pink
Up bullish reversal = green arrow up
bullish trend = green dots
Down bearish reversal = red arrow down
bearish trend = red dots
Horizontal lines:
100
75
50
25
0
2 different visual options example snapshot:

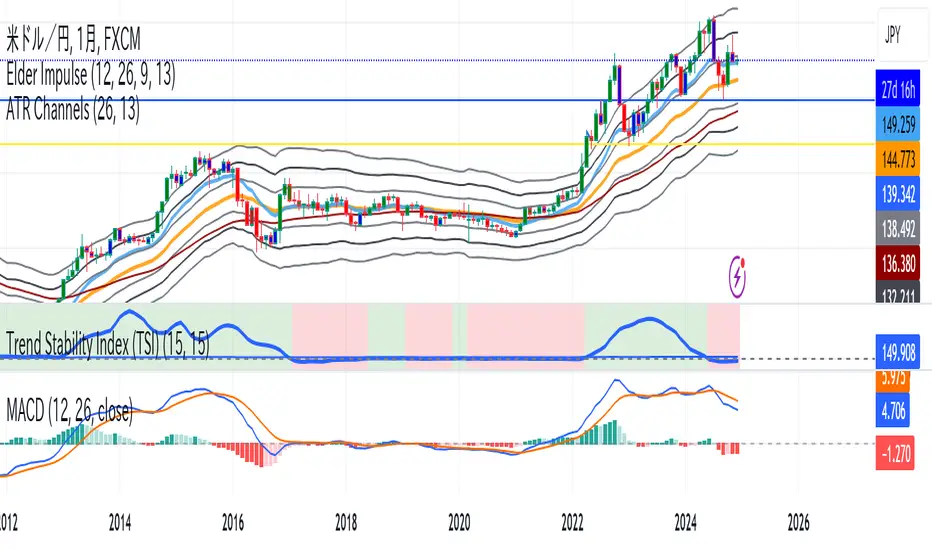
Trend Stability Index (TSI)Overview
The Trend Stability Index (TSI) is a technical analysis tool designed to evaluate the stability of a market trend by analyzing both price movements and trading volume. By combining these two crucial elements, the TSI provides traders with insights into the strength and reliability of ongoing trends, assisting in making informed trading decisions.
Key Features
• Dual Analysis: Integrates price changes and volume fluctuations to assess trend stability.
• Customizable Periods: Allows users to set evaluation periods for both trend and volume based on their trading preferences.
• Visual Indicators: Displays the Trend Stability Index as a line chart, highlights neutral zones, and uses background colors to indicate trend stability or instability.
Configuration Settings
1. Trend Length (trendLength)
• Description: Determines the number of periods over which the price stability is evaluated.
• Default Value: 15
• Usage: A longer trend length smooths out short-term volatility, providing a clearer picture of the overarching trend.
2. Volume Length (volumeLength)
• Description: Sets the number of periods over which trading volume changes are assessed.
• Default Value: 15
• Usage: Adjusting the volume length helps in capturing significant volume movements that may influence trend strength.
Calculation Methodology
The Trend Stability Index is calculated through a series of steps that analyze both price and volume changes:
1. Price Change Rate (priceChange)
• Calculation: Utilizes the Rate of Change (ROC) function on the closing prices over the specified trendLength.
• Purpose: Measures the percentage change in price over the trend evaluation period, indicating the direction and momentum of the price movement.
2. Volume Change Rate (volumeChange)
• Calculation: Applies the Rate of Change (ROC) function to the trading volume over the specified volumeLength.
• Purpose: Assesses the percentage change in trading volume, providing insight into the conviction behind price movements.
3. Trend Stability (trendStability)
• Calculation: Multiplies priceChange by volumeChange.
• Purpose: Combines price and volume changes to gauge the overall stability of the trend. A higher positive value suggests a strong and stable trend, while negative values may indicate trend weakness or reversal.
4. Trend Stability Index (TSI)
• Calculation: Applies a Simple Moving Average (SMA) to the trendStability over the trendLength period.
• Purpose: Smooths the trend stability data to create a more consistent and interpretable index.
Trend/Ranging Determination
• Stable Trend (isStable)
• Condition: When the TSI value is greater than 0.
• Interpretation: Indicates that the current trend is stable and likely to continue in its direction.
• Unstable Trend / Range-bound Market
• Condition: When the TSI value is less than or equal to 0.
• Interpretation: Suggests that the trend may be weakening, reversing, or that the market is moving sideways without a clear direction.
Visualization
The TSI indicator employs several visual elements to convey information effectively:
1. TSI Line
• Representation: Plotted as a blue line.
• Purpose: Displays the Trend Stability Index values over time, allowing traders to observe trend stability dynamics.
2. Neutral Horizontal Line
• Representation: A gray horizontal line at the 0 level.
• Purpose: Serves as a reference point to distinguish between stable and unstable trends.
3. Background Color
• Stable Trend: Green background with 80% transparency when isStable is true.
• Unstable Trend: Red background with 80% transparency when isStable is false.
• Purpose: Provides an immediate visual cue about the current trend’s stability, enhancing the interpretability of the indicator.
Usage Guidelines
• Identifying Trend Strength: Utilize the TSI to confirm the strength of existing trends. A consistently positive TSI suggests strong trend momentum, while a negative TSI may signal caution or a potential reversal.
• Volume Confirmation: The integration of volume changes helps in validating price movements. Significant price changes accompanied by corresponding volume shifts can reinforce the reliability of the trend.
• Entry and Exit Signals: Traders can use crossovers of the TSI with the neutral line (0 level) as potential entry or exit points. For instance, a crossover from below to above 0 may indicate a bullish trend initiation, while a crossover from above to below 0 could suggest bearish momentum.
• Combining with Other Indicators: To enhance trading strategies, consider using the TSI in conjunction with other technical indicators such as Moving Averages, RSI, or MACD for comprehensive market analysis.
Example Scenario
Imagine analyzing a stock with the following observations using the TSI:
• The TSI has been consistently above 0 for the past 30 periods, accompanied by increasing trading volume. This scenario indicates a strong and stable uptrend, suggesting that buying opportunities may be favorable.
• Conversely, if the TSI drops below 0 while the price remains relatively flat and volume decreases, it may imply that the current trend is losing momentum, and the market could be entering a consolidation phase or preparing for a trend reversal.
Conclusion
The Trend Stability Index is a valuable tool for traders seeking to assess the reliability and strength of market trends by integrating price and volume dynamics. Its customizable settings and clear visual indicators make it adaptable to various trading styles and market conditions. By incorporating the TSI into your trading analysis, you can enhance your ability to identify and act upon stable and profitable trends.
Multi SMI Ergodic OscillatorThe Multi SMI Ergodic Oscillator (Multi SMIEO) indicator can be used to identify potential buy and sell signals based on the relationship between the TSI and EMA lines.
The script is creating an indicator that plots multiple (3) sets of Time Series Indicator (TSI-Indicator) and Exponential Moving Average (EMA-Signal) lines as a single indicator.
The TSI is a momentum oscillator that helps identify overbought and oversold conditions. It is calculated using the close prices of an asset, a short-term moving average, and a long-term moving average. The script uses three different pairs of input values for the short-term and long-term periods, which can be adjusted by the user.
The EMA is a type of moving average that gives more weight to recent prices. It is calculated by applying a weighting factor to the most recent price, and then adding that weighted value to the previous EMA value. The script uses three different input values for the length of the EMA, which can also be adjusted by the user.
After calculating the TSI and EMA for each set, the script plots them on the same graph, with different colors and widths to differentiate them. The three sets of TSI and EMA lines are plotted to allow the user to compare the results of different periods. The script also plots a horizontal line at zero, which is used as a reference point for the oscillations of the indicator lines.
One way to use this indicator is to look for crossovers between the TSI and the EMA lines. A bullish crossover occurs when the TSI crosses above the EMA. This suggests that the buying pressure is increasing and a potential buy signal is generated. A bearish crossover occurs when the TSI crosses below the EMA. This suggests that the selling pressure is increasing and a potential sell signal is generated.
Some other ways that the indicator can be used include:
1. Identifying trends: The TSI and EMA lines can be used to identify the direction of the trend. An uptrend is present when the TSI and EMA lines are both trending upwards, while a downtrend is present when the TSI and EMA lines are both trending downwards.
2. Overbought and oversold conditions: The TSI can be used to identify overbought and oversold conditions. When the TSI is above the upper limit of the range, the asset is considered overbought and may be due for a price correction. Conversely, when the TSI is below the lower limit of the range, the asset is considered oversold and may be due for a price rebound.
3. Confirming price action: The Multi SMIEO indicator can be used to confirm price action. If a bullish divergence is present, it confirms a potential bullish reversal. If a bearish divergence is present, it confirms a potential bearish reversal.
4. Multiple time frame analysis: By using different periods for the TSI and EMA lines, the indicator can be used to analyze the asset on multiple time frames. It can be useful to compare the results of different periods to get a better understanding of the asset's price movements.
5. Risk management: This indicator can be used as an element of risk management strategy, it can help traders to identify overbought and oversold conditions to set stop loss or take profit levels.
The Multi SMI Ergodic Oscillator (Multi SMIEO) is a versatile indicator that can be used in a number of ways to analyze the price movements of an asset. It can be used to identify potential buy and sell signals, trends, overbought and oversold conditions, and to confirm price action. By using different periods for the TSI and EMA lines, the indicator can also be used to analyze the asset on multiple time frames. However, it is important to remember that indicators are based on historical data, and past performance does not guarantee future results.
It is important to use the indicator as part of a comprehensive trading strategy that includes risk management and other analysis techniques, such as fundamental and technical analysis. It is also important to keep in mind that indicators are not a standalone solution for trading, they should be used in conjunction with other market analysis and research techniques to generate better results.
Lastly, it is important to keep in mind that trading in financial markets comes with a certain level of risk and it is crucial to always have a proper risk management plan in place. Never invest more than you can afford to lose.

Any Oscillator Underlay [TTF]We are proud to release a new indicator that has been a while in the making - the Any Oscillator Underlay (AOU) !
Note: There is a lot to discuss regarding this indicator, including its intent and some of how it operates, so please be sure to read this entire description before using this indicator to help ensure you understand both the intent and some limitations with this tool.
Our intent for building this indicator was to accomplish the following:
Combine all of the oscillators that we like to use into a single indicator
Take up a bit less screen space for the underlay indicators for strategies that utilize multiple oscillators
Provide a tool for newer traders to be able to leverage multiple oscillators in a single indicator
Features:
Includes 8 separate, fully-functional indicators combined into one
Ability to easily enable/disable and configure each included indicator independently
Clearly named plots to support user customization of color and styling, as well as manual creation of alerts
Ability to customize sub-indicator title position and color
Ability to customize sub-indicator divider lines style and color
Indicators that are included in this initial release:
TSI
2x RSIs (dubbed the Twin RSI )
Stochastic RSI
Stochastic
Ultimate Oscillator
Awesome Oscillator
MACD
Outback RSI (Color-coding only)
Quick note on OB/OS:
Before we get into covering each included indicator, we first need to cover a core concept for how we're defining OB and OS levels. To help illustrate this, we will use the TSI as an example.
The TSI by default has a mid-point of 0 and a range of -100 to 100. As a result, a common practice is to place lines on the -30 and +30 levels to represent OS and OB zones, respectively. Most people tend to view these levels as distance from the edges/outer bounds or as absolute levels, but we feel a more way to frame the OB/OS concept is to instead define it as distance ("offset") from the mid-line. In keeping with the -30 and +30 levels in our example, the offset in this case would be "30".
Taking this a step further, let's say we decided we wanted an offset of 25. Since the mid-point is 0, we'd then calculate the OB level as 0 + 25 (+25), and the OS level as 0 - 25 (-25).
Now that we've covered the concept of how we approach defining OB and OS levels (based on offset/distance from the mid-line), and since we did apply some transformations, rescaling, and/or repositioning to all of the indicators noted above, we are going to discuss each component indicator to detail both how it was modified from the original to fit the stacked-indicator model, as well as the various major components that the indicator contains.
TSI:
This indicator contains the following major elements:
TSI and TSI Signal Line
Color-coded fill for the TSI/TSI Signal lines
Moving Average for the TSI
TSI Histogram
Mid-line and OB/OS lines
Default TSI fill color coding:
Green : TSI is above the signal line
Red : TSI is below the signal line
Note: The TSI traditionally has a range of -100 to +100 with a mid-point of 0 (range of 200). To fit into our stacking model, we first shrunk the range to 100 (-50 to +50 - cut it in half), then repositioned it to have a mid-point of 50. Since this is the "bottom" of our indicator-stack, no additional repositioning is necessary.
Twin RSI:
This indicator contains the following major elements:
Fast RSI (useful if you want to leverage 2x RSIs as it makes it easier to see the overlaps and crosses - can be disabled if desired)
Slow RSI (primary RSI)
Color-coded fill for the Fast/Slow RSI lines (if Fast RSI is enabled and configured)
Moving Average for the Slow RSI
Mid-line and OB/OS lines
Default Twin RSI fill color coding:
Dark Red : Fast RSI below Slow RSI and Slow RSI below Slow RSI MA
Light Red : Fast RSI below Slow RSI and Slow RSI above Slow RSI MA
Dark Green : Fast RSI above Slow RSI and Slow RSI below Slow RSI MA
Light Green : Fast RSI above Slow RSI and Slow RSI above Slow RSI MA
Note: The RSI naturally has a range of 0 to 100 with a mid-point of 50, so no rescaling or transformation is done on this indicator. The only manipulation done is to properly position it in the indicator-stack based on which other indicators are also enabled.
Stochastic and Stochastic RSI:
These indicators contain the following major elements:
Configurable lengths for the RSI (for the Stochastic RSI only), K, and D values
Configurable base price source
Mid-line and OB/OS lines
Note: The Stochastic and Stochastic RSI both have a normal range of 0 to 100 with a mid-point of 50, so no rescaling or transformations are done on either of these indicators. The only manipulation done is to properly position it in the indicator-stack based on which other indicators are also enabled.
Ultimate Oscillator (UO):
This indicator contains the following major elements:
Configurable lengths for the Fast, Middle, and Slow BP/TR components
Mid-line and OB/OS lines
Moving Average for the UO
Color-coded fill for the UO/UO MA lines (if UO MA is enabled and configured)
Default UO fill color coding:
Green : UO is above the moving average line
Red : UO is below the moving average line
Note: The UO naturally has a range of 0 to 100 with a mid-point of 50, so no rescaling or transformation is done on this indicator. The only manipulation done is to properly position it in the indicator-stack based on which other indicators are also enabled.
Awesome Oscillator (AO):
This indicator contains the following major elements:
Configurable lengths for the Fast and Slow moving averages used in the AO calculation
Configurable price source for the moving averages used in the AO calculation
Mid-line
Option to display the AO as a line or pseudo-histogram
Moving Average for the AO
Color-coded fill for the AO/AO MA lines (if AO MA is enabled and configured)
Default AO fill color coding (Note: Fill was disabled in the image above to improve clarity):
Green : AO is above the moving average line
Red : AO is below the moving average line
Note: The AO is technically has an infinite (unbound) range - -∞ to ∞ - and the effective range is bound to the underlying security price (e.g. BTC will have a wider range than SP500, and SP500 will have a wider range than EUR/USD). We employed some special techniques to rescale this indicator into our desired range of 100 (-50 to 50), and then repositioned it to have a midpoint of 50 (range of 0 to 100) to meet the constraints of our stacking model. We then do one final repositioning to place it in the correct position the indicator-stack based on which other indicators are also enabled. For more details on how we accomplished this, read our section "Binding Infinity" below.
MACD:
This indicator contains the following major elements:
Configurable lengths for the Fast and Slow moving averages used in the MACD calculation
Configurable price source for the moving averages used in the MACD calculation
Configurable length and calculation method for the MACD Signal Line calculation
Mid-line
Note: Like the AO, the MACD also technically has an infinite (unbound) range. We employed the same principles here as we did with the AO to rescale and reposition this indicator as well. For more details on how we accomplished this, read our section "Binding Infinity" below.
Outback RSI (ORSI):
This is a stripped-down version of the Outback RSI indicator (linked above) that only includes the color-coding background (suffice it to say that it was not technically feasible to attempt to rescale the other components in a way that could consistently be clearly seen on-chart). As this component is a bit of a niche/special-purpose sub-indicator, it is disabled by default, and we suggest it remain disabled unless you have some pre-defined strategy that leverages the color-coding element of the Outback RSI that you wish to use.
Binding Infinity - How We Incorporated the AO and MACD (Warning - Math Talk Ahead!)
Note: This applies only to the AO and MACD at time of original publication. If any other indicators are added in the future that also fall into the category of "binding an infinite-range oscillator", we will make that clear in the release notes when that new addition is published.
To help set the stage for this discussion, it's important to note that the broader challenge of "equalizing inputs" is nothing new. In fact, it's a key element in many of the most popular fields of data science, such as AI and Machine Learning. They need to take a diverse set of inputs with a wide variety of ranges and seemingly-random inputs (referred to as "features"), and build a mathematical or computational model in order to work. But, when the raw inputs can vary significantly from one another, there is an inherent need to do some pre-processing to those inputs so that one doesn't overwhelm another simply due to the difference in raw values between them. This is where feature scaling comes into play.
With this in mind, we implemented 2 of the most common methods of Feature Scaling - Min-Max Normalization (which we call "Normalization" in our settings), and Z-Score Normalization (which we call "Standardization" in our settings). Let's take a look at each of those methods as they have been implemented in this script.
Min-Max Normalization (Normalization)
This is one of the most common - and most basic - methods of feature scaling. The basic formula is: y = (x - min)/(max - min) - where x is the current data sample, min is the lowest value in the dataset, and max is the highest value in the dataset. In this transformation, the max would evaluate to 1, and the min would evaluate to 0, and any value in between the min and the max would evaluate somewhere between 0 and 1.
The key benefits of this method are:
It can be used to transform datasets of any range into a new dataset with a consistent and known range (0 to 1).
It has no dependency on the "shape" of the raw input dataset (i.e. does not assume the input dataset can be approximated to a normal distribution).
But there are a couple of "gotchas" with this technique...
First, it assumes the input dataset is complete, or an accurate representation of the population via random sampling. While in most situations this is a valid assumption, in trading indicators we don't really have that luxury as we're often limited in what sample data we can access (i.e. number of historical bars available).
Second, this method is highly sensitive to outliers. Since the crux of this transformation is based on the max-min to define the initial range, a single significant outlier can result in skewing the post-transformation dataset (i.e. major price movement as a reaction to a significant news event).
You can potentially mitigate those 2 "gotchas" by using a mechanism or technique to find and discard outliers (e.g. calculate the mean and standard deviation of the input dataset and discard any raw values more than 5 standard deviations from the mean), but if your most recent datapoint is an "outlier" as defined by that algorithm, processing it using the "scrubbed" dataset would result in that new datapoint being outside the intended range of 0 to 1 (e.g. if the new datapoint is greater than the "scrubbed" max, it's post-transformation value would be greater than 1). Even though this is a bit of an edge-case scenario, it is still sure to happen in live markets processing live data, so it's not an ideal solution in our opinion (which is why we chose not to attempt to discard outliers in this manner).
Z-Score Normalization (Standardization)
This method of rescaling is a bit more complex than the Min-Max Normalization method noted above, but it is also a widely used process. The basic formula is: y = (x – μ) / σ - where x is the current data sample, μ is the mean (average) of the input dataset, and σ is the standard deviation of the input dataset. While this transformation still results in a technically-infinite possible range, the output of this transformation has a 2 very significant properties - the mean (average) of the output dataset has a mean (μ) of 0 and a standard deviation (σ) of 1.
The key benefits of this method are:
As it's based on normalizing the mean and standard deviation of the input dataset instead of a linear range conversion, it is far less susceptible to outliers significantly affecting the result (and in fact has the effect of "squishing" outliers).
It can be used to accurately transform disparate sets of data into a similar range regardless of the original dataset's raw/actual range.
But there are a couple of "gotchas" with this technique as well...
First, it still technically does not do any form of range-binding, so it is still technically unbounded (range -∞ to ∞ with a mid-point of 0).
Second, it implicitly assumes that the raw input dataset to be transformed is normally distributed, which won't always be the case in financial markets.
The first "gotcha" is a bit of an annoyance, but isn't a huge issue as we can apply principles of normal distribution to conceptually limit the range by defining a fixed number of standard deviations from the mean. While this doesn't totally solve the "infinite range" problem (a strong enough sudden move can still break out of our "conceptual range" boundaries), the amount of movement needed to achieve that kind of impact will generally be pretty rare.
The bigger challenge is how to deal with the assumption of the input dataset being normally distributed. While most financial markets (and indicators) do tend towards a normal distribution, they are almost never going to match that distribution exactly. So let's dig a bit deeper into distributions are defined and how things like trending markets can affect them.
Skew (skewness): This is a measure of asymmetry of the bell curve, or put another way, how and in what way the bell curve is disfigured when comparing the 2 halves. The easiest way to visualize this is to draw an imaginary vertical line through the apex of the bell curve, then fold the curve in half along that line. If both halves are exactly the same, the skew is 0 (no skew/perfectly symmetrical) - which is what a normal distribution has (skew = 0). Most financial markets tend to have short, medium, and long-term trends, and these trends will cause the distribution curve to skew in one direction or another. Bullish markets tend to skew to the right (positive), and bearish markets to the left (negative).
Kurtosis: This is a measure of the "tail size" of the bell curve. Another way to state this could be how "flat" or "steep" the bell-shape is. If the bell is steep with a strong drop from the apex (like a steep cliff), it has low kurtosis. If the bell has a shallow, more sweeping drop from the apex (like a tall hill), is has high kurtosis. Translating this to financial markets, kurtosis is generally a metric of volatility as the bell shape is largely defined by the strength and frequency of outliers. This is effectively a measure of volatility - volatile markets tend to have a high level of kurtosis (>3), and stable/consolidating markets tend to have a low level of kurtosis (<3). A normal distribution (our reference), has a kurtosis value of 3.
So to try and bring all that back together, here's a quick recap of the Standardization rescaling method:
The Standardization method has an assumption of a normal distribution of input data by using the mean (average) and standard deviation to handle the transformation
Most financial markets do NOT have a normal distribution (as discussed above), and will have varying degrees of skew and kurtosis
Q: Why are we still favoring the Standardization method over the Normalization method, and how are we accounting for the innate skew and/or kurtosis inherent in most financial markets?
A: Well, since we're only trying to rescale oscillators that by-definition have a midpoint of 0, kurtosis isn't a major concern beyond the affect it has on the post-transformation scaling (specifically, the number of standard deviations from the mean we need to include in our "artificially-bound" range definition).
Q: So that answers the question about kurtosis, but what about skew?
A: So - for skew, the answer is in the formula - specifically the mean (average) element. The standard mean calculation assumes a complete dataset and therefore uses a standard (i.e. simple) average, but we're limited by the data history available to us. So we adapted the transformation formula to leverage a moving average that included a weighting element to it so that it favored recent datapoints more heavily than older ones. By making the average component more adaptive, we gained the effect of reducing the skew element by having the average itself be more responsive to recent movements, which significantly reduces the effect historical outliers have on the dataset as a whole. While this is certainly not a perfect solution, we've found that it serves the purpose of rescaling the MACD and AO to a far more well-defined range while still preserving the oscillator behavior and mid-line exceptionally well.
The most difficult parts to compensate for are periods where markets have low volatility for an extended period of time - to the point where the oscillators are hovering around the 0/midline (in the case of the AO), or when the oscillator and signal lines converge and remain close to each other (in the case of the MACD). It's during these periods where even our best attempt at ensuring accurate mirrored-behavior when compared to the original can still occasionally lead or lag by a candle.
Note: If this is a make-or-break situation for you or your strategy, then we recommend you do not use any of the included indicators that leverage this kind of bounding technique (the AO and MACD at time of publication) and instead use the Trandingview built-in versions!
We know this is a lot to read and digest, so please take your time and feel free to ask questions - we will do our best to answer! And as always, constructive feedback is always welcome!

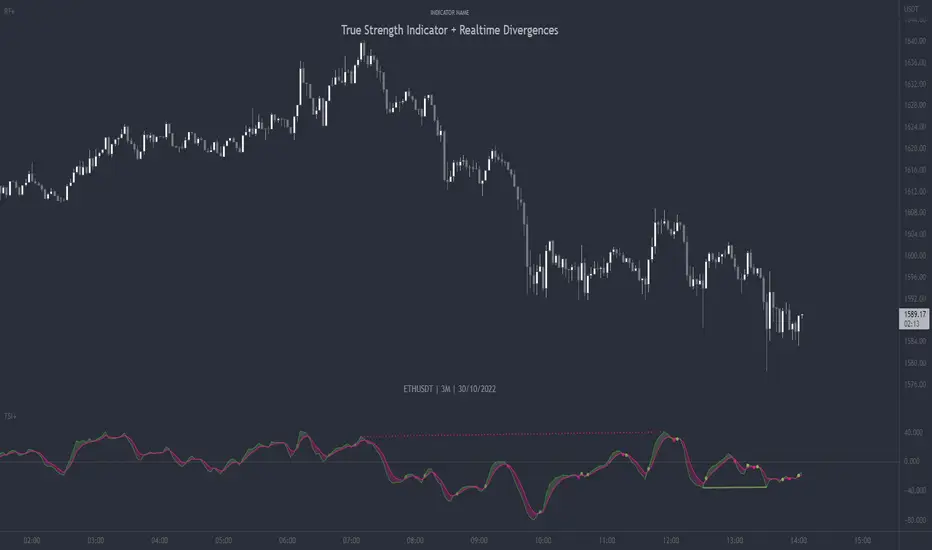
True Strength Indicator + Realtime DivergencesTrue Strength Indicator (TSI) + Realtime Divergences + Alerts + Lookback periods.
This version of the True Strength Indicator adds the following 5 additional features to the stock TSI by Tradingview:
- Optional divergence lines drawn directly onto the oscillator in realtime.
- Configurable alerts to notify you when divergences occur, as well as when the TSI and lagline bands crossover one another, when the oscillator begins heading up, or heading down.
- Configurable lookback periods to fine tune the divergences drawn in order to suit different trading styles and timeframes.
- Background colouring option to indicate when the two TSI bands, the TSI line and the TSI lagline, have crossed one another, either moving upwards or downwards, or optionally when the two TSI bands have crossed upwards and an external oscillator, which can be linked via the settings, has crossed above its centerline, and the TSI bands have crossed downwards and the external oscillator has crossed below its centerline.
- Alternate timeframe feature allows you to configure the oscillator to use data from a different timeframe than the chart it is loaded on.
This indicator adds additional features onto the stock TSI by Tradingview, whose core calculations remain unchanged, although this version has different settings as default to suit a shorter time period (it uses 6, 13, 4 by default, whereas the stock TSI typically ships with higher values, e.g. 25, 13, 13). Namely the configurable option to automatically, quickly and clearly draw divergence lines onto the oscillator for you as they occur in realtime. It also has the addition of unique alerts, so you can be notified when divergences occur without spending all day watching the charts. Furthermore, this version of the TSI comes with configurable lookback periods, which can be configured in order to adjust the sensitivity of the divergences, in order to suit shorter or higher timeframe trading approaches.
The True Strength Indicator
Tradingview describes the True Strength Indicator as follows:
“The True Strength Index (TSI) is a momentum oscillator that ranges between limits of -100 and +100 and has a base value of 0. Momentum is positive when the oscillator is positive (pointing to a bullish market bias) and vice versa. It was developed by William Blau and consists of 2 lines: the index line and an exponential moving average of the TSI, called the signal line. Traders may look for any of the following 5 types of conditions: overbought, oversold, centerline crossover, divergence and signal line crossover. The indicator is often used in combination with other signals..”
What are divergences?
Divergence is when the price of an asset is moving in the opposite direction of a technical indicator, such as an oscillator, or is moving contrary to other data. Divergence warns that the current price trend may be weakening, and in some cases may lead to the price changing direction.
There are 4 main types of divergence, which are split into 2 categories;
regular divergences and hidden divergences. Regular divergences indicate possible trend reversals, and hidden divergences indicate possible trend continuation.
Regular bullish divergence: An indication of a potential trend reversal, from the current downtrend, to an uptrend.
Regular bearish divergence: An indication of a potential trend reversal, from the current uptrend, to a downtrend.
Hidden bullish divergence: An indication of a potential uptrend continuation.
Hidden bearish divergence: An indication of a potential downtrend continuation.
Setting alerts.
With this indicator you can set alerts to notify you when any/all of the above types of divergences occur, on any chart timeframe you choose.
Configurable lookback values.
You can adjust the default lookback values to suit your prefered trading style and timeframe. If you like to trade a shorter time frame, lowering the default lookback values will make the divergences drawn more sensitive to short term price action.
How do traders use divergences in their trading?
A divergence is considered a leading indicator in technical analysis , meaning it has the ability to indicate a potential price move in the short term future.
Hidden bullish and hidden bearish divergences, which indicate a potential continuation of the current trend are sometimes considered a good place for traders to begin, since trend continuation occurs more frequently than reversals, or trend changes.
When trading regular bullish divergences and regular bearish divergences, which are indications of a trend reversal, the probability of it doing so may increase when these occur at a strong support or resistance level . A common mistake new traders make is to get into a regular divergence trade too early, assuming it will immediately reverse, but these can continue to form for some time before the trend eventually changes, by using forms of support or resistance as an added confluence, such as when price reaches a moving average, the success rate when trading these patterns may increase.
Typically, traders will manually draw lines across the swing highs and swing lows of both the price chart and the oscillator to see whether they appear to present a divergence, this indicator will draw them for you, quickly and clearly, and can notify you when they occur.
Disclaimer: This script includes code from the stock TSI by Tradingview as well as the Divergence for Many Indicators v4 by LonesomeTheBlue
True Strength Index with Crossovers Alerts🚀 True Strength Index (TSI) with Visual Crossover Alerts
Hey everyone! I’m sharing my customized True Strength Index (TSI) indicator, which I've boosted with clear visual signals and alert conditions based on my personal, high-probability trading strategy.
The True Strength Index is a powerful, oscillation-based momentum indicator that smooths price movements twice using Exponential Moving Averages (EMAs). This double-smoothing process helps to filter out market noise, giving you a much clearer view of momentum changes than basic indicators.
🛠️ How This Script Works
This script focuses on the crucial interaction between the TSI line and its Signal Line:
TSI Line (Blue): Tracks momentum direction and strength.
Signal Line (Red): A simple EMA of the TSI line, used to determine short-term trend shifts.
Visual Buy/Sell Signals:
To make signals impossible to miss, I've added distinct visual markers:
🟢 Green Dot: A "Buy Signal" is plotted at the bottom of the indicator pane when the TSI crosses above the Signal Line (bullish crossover).
🔴 Red Dot: A "Sell Signal" is plotted at the bottom when the TSI crosses below the Signal Line (bearish crossover).
Additionally, I've included named alertconditions so you can set up real-time notifications for these exact crossovers in the TradingView Alert system.
🧠 My Trading Logic: Combining TSI with RSI
I don't use the TSI in isolation. My favorite approach is to use this TSI indicator as a timing tool, but only when it aligns with the overall momentum context defined by the Relative Strength Index (RSI).
This is the key to my strategy:
Bullish Trade Filter: I only take a BUY signal (Green Dot) when my RSI indicator is already in a bullish territory (above 50).
Bearish Trade Filter: I only take a SELL signal (Red Dot) when my RSI indicator is already in a bearish territory (below 50).
This combination ensures you are trading with the underlying momentum trend, improving the probability of success.
⚙️ My Recommended Custom Settings
For the best results with this strategy, I recommend using the following custom settings. You can enter these values in the "Inputs" tab when adding the indicator to your chart.
1. TSI (Alerts) Settings
Long Length - 60
Higher value for smoother price change data.
Short Length -30
Medium-term smoothing for clearer momentum shifts.
Signal Length - 9
Short length for a responsive signal line.
2. Companion RSI Settings (RSI+)
RSI Length - 150
A long look-back period for highly accurate trend filtering.
MA1 Length - 60
Used for additional smoothing.
MA2 Length - 150
Used for powerful trend confluence.

True Strength Index (TSI)%📌 Script Name: TSI Percentuale
This script is a custom True Strength Index (TSI) indicator that expresses momentum strength as a percentage from 0% to 100%, instead of the traditional TSI scale.
✅ What the Script Does
Calculates the standard TSI:
Uses double exponential smoothing of price changes and their absolute values.
Formula:
TSI_raw
=
100
×
DoubleSmoothed(ΔPrice)
DoubleSmoothed(|ΔPrice|)
TSI_raw=100×
DoubleSmoothed(|ΔPrice|)
DoubleSmoothed(ΔPrice)
Normalizes TSI to a percentile scale:
Over a user-defined lookback period, the script finds the lowest and highest TSI values.
It then rescales the current TSI to a value between 0% (minimum) and 100% (maximum).
50% represents neutral momentum (i.e., "flat").
Plots the result:
tsi_percent is plotted as a blue line.
Horizontal dashed/dotted lines are drawn at:
0% → strong downward momentum
50% → neutral
100% → strong upward momentum
⚙️ Inputs
Long Length: Long EMA smoothing period (default: 25)
Short Length: Short EMA smoothing period (default: 13)
Signal Length: (not used in this version, can be removed or extended)
Lookback Period: Number of bars to calculate min/max normalization (default: 100)
🧠 Why Use This Indicator
The classic TSI ranges around and can be hard to interpret.
This version makes TSI visually intuitive by converting it to percentile form, allowing easier comparison of momentum strength across time and instruments.
It’s particularly useful for defining zones like:
Above 70% = strong bullish
Below 30% = strong bearish

OBV TSI IndicatorThe OBV TSI Indicator combines two powerful technical analysis tools: the On-Balance Volume (OBV) and the True Strength Index (TSI). This hybrid approach provides insights into both volume dynamics and momentum, helping traders identify potential trend reversals, breakouts, or continuations with greater accuracy.
The OBV TSI Indicator tracks cumulative volume shifts via OBV and integrates the TSI for momentum analysis. It offers customizable moving average options for further smoothing. Visual trendlines, pivot points, and signal markers enhance clarity.
The OBV tracks volume flow by summing volumes based on price changes. Positive volume is added when prices rise, and negative volume is subtracted when prices fall. The result is smoothed to detect meaningful trends in volume. A volume spread is derived from the difference between the smoothed OBV and cumulative volume. This is then adjusted by the price deviation to generate the shadow spread, which highlights critical volume-driven price levels.
The shadow spread is added to either the high or low price, depending on its sign, producing a refined OBV output. This serves as the main source for the subsequent TSI calculation. The TSI is a momentum oscillator calculated using double-smoothed price changes. It provides an accurate measure of trend strength and direction.
Various moving average options, such as EMA, DEMA, or TEMA, are applied to the smoothed OBV for additional trend filtering. Users can select their preferred type and length to suit their trading strategy. Trendlines are plotted to visualize the overall direction. When a significant change in trend is detected, up or down arrows indicate potential buy or sell signals. The script identifies key pivot points based on the highest and lowest levels within a defined period. These pivots help pinpoint reversal zones.
The indicator offers customization options, allowing users to adjust the OBV length for smoothing, choose from various moving average types, and fine-tune the short, long, and signal periods for TSI. Additionally, users can toggle visibility for trendlines, signals, and pivots to suit their preferences.
This indicator is ideal for practical use cases such as spotting potential trend reversals by observing TSI crossovers and pivot levels, anticipating breakouts from key price levels using the shadow spread, and validating trends by aligning TSI signals with OBV and moving averages.
The OBV TSI Indicator is a versatile tool designed to enhance decision-making in trading by combining volume and momentum analysis. Its flexibility and visual aids make it suitable for traders of all experience levels. By leveraging its insights, you can confidently navigate market trends and improve your trading outcomes.

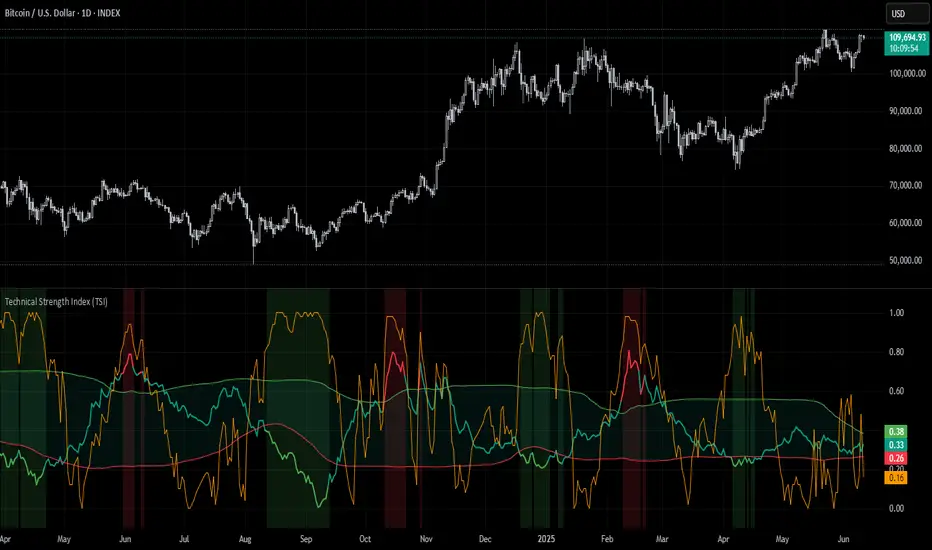
Technical Strength Index (TSI)📘 TSI with Dynamic Bands – Technical Strength Index
The TSI with Dynamic Bands is a multi-factor indicator designed to measure the statistical strength and structure of a trend. It combines several quantitative metrics into a single, normalized score between 0 and 1, allowing traders to assess the technical quality of market moves and detect overbought/oversold conditions with adaptive precision.
🧠 Core Components
This indicator draws from the StatMetrics library, blending:
📈 Trend Persistence: via the Hurst exponent, indicating whether price action is mean-reverting or trending.
📉 Risk-Adjusted Volatility: via the inverted , rewarding smoother, less erratic price movement.
🚀 Momentum Strength: using a combination of directional momentum and Z-score–normalized returns.
These components are normalized and averaged into the TSI line.
🎯 Features
TSI Line: Composite score of trend quality (0 = weak/noise, 1 = strong/structured).
Dynamic Bands: Mean ± 1 standard deviation envelopes provide adaptive context.
Overbought/Oversold Detection: Based on a rolling quantile (e.g. 90th/10th percentile of TSI history).
Signal Strength Bar (optional): Measures how statistically extreme the current TSI value is, helping validate confidence in trade setups.
Dynamic Color Cues: Background and bar gradients help visually identify statistically significant zones.
📈 How to Use
Look for overbought (red background) or oversold (green background) conditions as potential reversal zones.
Confirm trend strength with the optional signal strength bar — stronger values suggest higher signal confidence.
Use the TSI line and context bands to filter out noisy ranges and focus on structured price moves.
⚙️ Inputs
Lookback Period: Controls the smoothing and window size for statistical calculations.
Overbought/Oversold Quantiles: Adjust the thresholds for signal zones.
Plot Signal Strength: Enable or disable the signal confidence bar.
Overlay Signal Strength: Show signal strength in the same panel (compact) or not (cleaner TSI-only view).
🛠 Example Use Cases
Mean reversion traders identifying reversal zones with statistical backing
Momentum/Trend traders confirming structure before entries
Quantitative dashboards or multi-asset screening tools
⚠️ Disclaimer
This script is for educational and informational purposes only. It does not constitute financial advice or a recommendation to buy or sell any financial instrument.
This AI is not a financial advisor; please consult your financial advisor for personalized advice.
BK AK-Scope🔭 Introducing BK AK-Scope — Target Locked. Signal Acquired. 🔭
After building five precision weapons for traders, I’m proud to unveil the sixth.
BK AK-Scope — the eye of the arsenal.
This is not just an indicator. It’s an intelligence system for volatility, signal clarity, and rate-of-change dynamics — forged for elite vision in any market terrain.
🧠 Why “Scope”? And Why “AK”?
Every shooter knows: you can’t hit what you can’t see.
The Scope brings range, clarity, and target distinction. It filters motion from noise. Purpose from panic.
“AK” continues to honor the man who trained my sight — my mentor, A.K.
His discipline taught me to wait for alignment. To move with reason, not emotion.
His vision lives in every code line here.
🔬 What Is BK AK-Scope?
A Triple-Tier TSI Correlation Engine, fused with adaptive opacity logic, a volatility scoring system, and real-time signal clarity. It’s momentum dissected — by speed, depth, and rate of change.
Built to serve traders who:
Need visual hierarchy between fast, mid, and slow TSI responses.
Want adaptive fills that pulse with volatility — not static zones.
Require a volatility scoring overlay that reads the battlefield in real time.
⚙️ Core Systems: How BK AK-Scope Works
✅ Fast/Mid/Slow TSI →
Three layers of correlation: like scopes with zoom levels.
You track micro moves, mid swings, and macro flow simultaneously.
✅ Rate-of-Change Adaptive Opacity →
Momentum fills fade or flash based on speed — giving you movement density at a glance.
Bull vs. Bear zones adapt to strength. You feel the market’s pulse.
✅ Volatility Score Intelligence →
Custom algorithm measuring:
Range expansion
Rate-of-change differentials
ATR dynamics
Standard deviation pressure
All combined into a score from 0–100 with live icons:
🔥 = Extreme Heat (70+)
🧊 = Cold Zone (<30)
⚠️ = ROC Warning
• = Neutral drift
✅ Auto-Detect Volatility Modes →
Scalp = <15min
Swing = intraday/hourly
Macro = daily/weekly
Or override manually with total control.
🎯 How To Use BK AK-Scope
🔹 Trend Continuation → When all three TSI layers align in direction + volatility score climbs, ride with the trend.
🔹 Early Reversals → Opposing TSI + rapid opacity change + volatility shift = sniper reversal zone.
🔹 Consolidation Filter → Neutral fills + score < 30 = stay out, wait for signal surge.
🔹 Signal Confluence → Pair with:
• Gann fans or angles
• Fib time/price clusters
• Elliott Wave structure
• Harmonics or divergence
To isolate entry perfection.
🛡️ Why This Indicator Changes the Game
It's not just momentum. It’s TSI with depth hierarchy.
It’s not just color. It’s real-time strength visualization.
It’s not just volatility. It’s rate-weighted market intelligence.
This is market optics for the advanced trader — built for vision, clarity, and discipline.
🙏 Final Thoughts
🔹 In honor of A.K., my mentor. The man who taught me to see what others miss.
🔹 Inspired by the power of vision — because execution without clarity is chaos.
🔹 Powered by faith — because Gd alone gives sight beyond the visible.
“He gives sight to the blind and wisdom to the humble.” — Psalms 146
Every tool I build is a prayer in code — that it helps someone trade with clarity, integrity, and precision.
⚡ Zoom In. Focus Deep. Trade Clean.
BK AK-Scope — Lock on the target. See what others don’t.
🔫 Clarity is power. 🔫
Gd bless. 🙏

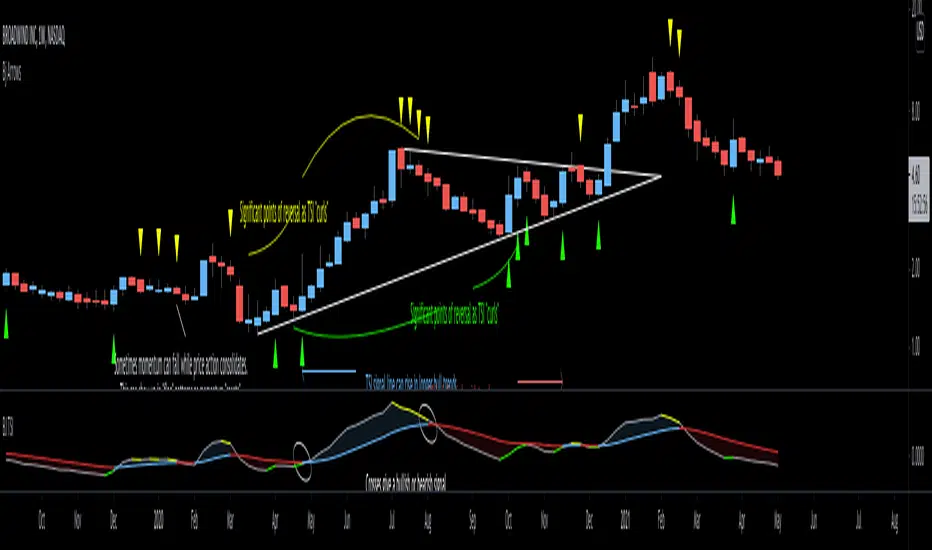
Bjorgum TSI-This script utilizes simple color changes of the TSI output signals to aid in interpretation of the classic TSI indicator.
-Crosses of the TSI value line and signal line are a bullish or bearish indication. TSI value line is colored green or yellow to help identify that the TSI value line is either dropping or rising, while over or under the signal line.
-This can help anticipate a cross, or significant points in the trend. TSI signal line changes color when rising or falling which can help to identify larger prevailing trends.
-Generally, a rising signal line can be an overall bullish move, while falling more bearish regardless of crosses.
*Resolution function enables multiple overlay for "Multi-timeframe analysis"*
Machine Learning Momentum Oscillator [ChartPrime]The Machine Learning Momentum Oscillator brings together the K-Nearest Neighbors (KNN) algorithm and the predictive strength of the Tactical Sector Indicator (TSI) Momentum. This unique oscillator not only uses the insights from TSI Momentum but also taps into the power of machine learning therefore being designed to give traders a more comprehensive view of market momentum.
At its core, the Machine Learning Momentum Oscillator blends TSI Momentum with the capabilities of the KNN algorithm. Introducing KNN logic allows for better handling of noise in the data set. The TSI Momentum is known for understanding how strong trends are and which direction they're headed, and now, with the added layer of machine learning, we're able to offer a deeper perspective on market trends. This is a fairly classical when it comes to visuals and trading.
Green bars show the trader when the asset is in an uptrend. On the flip side, red bars mean things are heading down, signaling a bearish movement driven by selling pressure. These color cues make it easier to catch the sentiment and direction of the market in a glance.
Yellow boxes are also displayed by the oscillator. These boxes highlight potential turning points or peaks. When the market comes close to these points, they can provide a heads-up about the possibility of changes in momentum or even a trend reversal, helping a trader make informed choices quickly. These can be looked at as possible reversal areas simply put.
Settings:
Users can adjust the number of neighbours in the KNN algorithm and choose the periods they prefer for analysis. This way, the tool becomes a part of a trader's strategy, adapting to different market conditions as they see fit. Users can also adjust the smoothing used by the oscillator via the smoothing input.

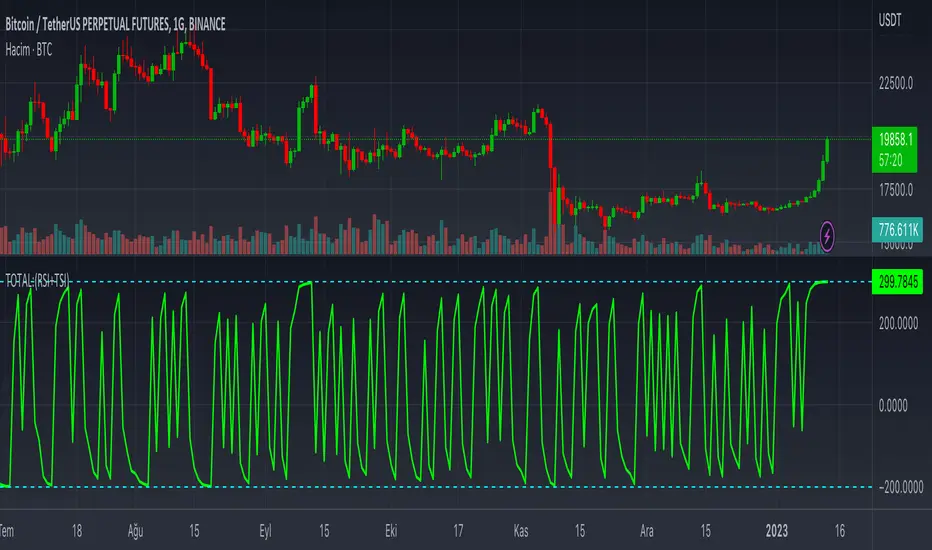
TOTAL:(RSI+TSI)TOTAL:(RSI+TSI)
This indicator collects instant data of RSI and TSI oscillators. RSI moves between (0) and (100) values as a moving line, while TSI moves between (-100) and (+100) values as two moving lines.
The top value of the sum of these values is graphically;
It takes the total value (+300) from RSI (+100), TSI (+100) and (+100).
The lowest value of the sum of these values is graphically;
It takes the value (-200) from the RSI (0), (-100) and (-100) from the TSI.
In case this indicator approaches (+300) graphically; It can be seen that price candlesticks mostly move upwards. This may not always give accurate results. Past incompatibilities can affect this situation.
In case this indicator approaches (-200) graphically; It can be seen that price candlesticks mostly move downwards. This may not always give accurate results. Past incompatibilities can affect this situation.
The graphical movements and numerical values created by this indicator do not give precise results for price candles.
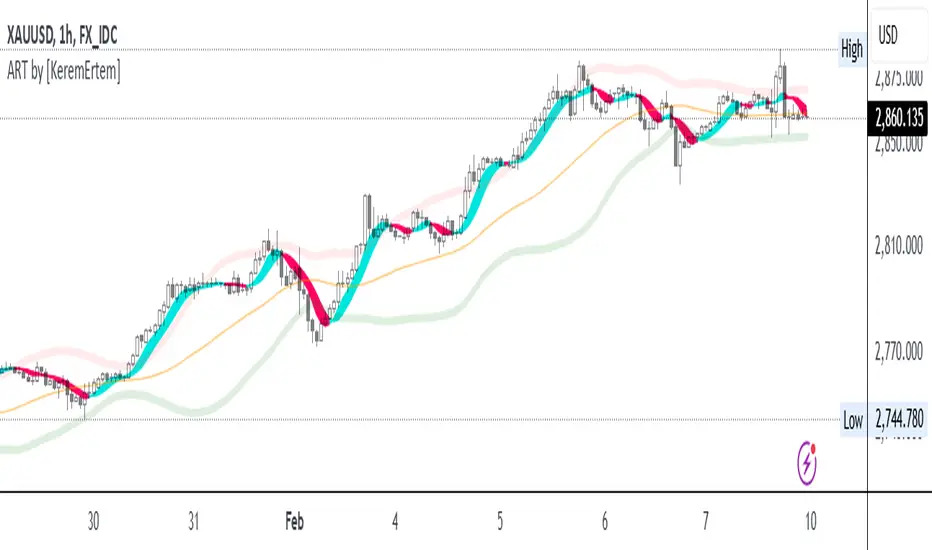
ADX, RSI, & TSI utilized as ART [by KeremErtem]The "ADX, RSI, & TSI utilized as ART" script is an advanced technical analysis tool designed by Kerem Ertem to help traders identify trend direction, strength, and potential reversals. It integrates the Average Directional Index (ADX), Relative Strength Index (RSI), and True Strength Index (TSI) into a cohesive, user-friendly indicator known as ART (Adaptive Relative Trend) .
What it does:
Trend Detection: Utilizes ADX to identify the strength and direction of trends.
Momentum Analysis: Uses RSI to gauge the speed and change of price movements.
Signal Smoothing: Incorporates TSI to reduce noise and provide clearer signals.
How it works:
Input Settings: Customize the source (hlc3), signal period (l1), and lookback range (l2) to tailor the indicator to your trading strategy.
Angle Calculation (ACI): The script calculates the angle of price movements using a custom function, which combines the lowest and highest prices with moving averages to create a smoother representation of trend angles.
Weighted Average: The ACI function is applied to the source price to derive a weighted average, which serves as the foundation for further calculations.
RSI Integration: The script calculates the RSI based on the weighted average price and further refines it using the ACI function to enhance signal accuracy.
ADX Calculation: ADX values are computed and adjusted using the ACI function to provide a clearer indication of trend strength and direction.
ART Indicator: The combined results of the RSI and ADX calculations form the ART indicator, which is plotted alongside trend lines and bands for comprehensive trend analysis.
Bands and Trend Lines: The script plots upper, lower, and center bands based on standard deviation and moving averages, providing visual cues for potential support and resistance levels.
How to use it:
Customization: Adjust the signal period, lookback range, RSI length, and ADX settings to fit your trading preferences.
Interpretation: Green ART signal lines indicate bullish trends, while red lines indicate bearish trends. The trend line color changes from cyan to magenta based on the trend direction.
Bands: Use the upper and lower bands as potential entry and exit points, with the center line acting as a trend confirmation.
This script offers a comprehensive approach to trend and momentum analysis, making it a valuable tool for traders seeking to enhance their trading strategies with advanced technical indicators.
SMI Ergodic Indicator/Oscillator▮ Introduction
The Stochastic Momentum Index Ergodic Indicator (SMII) is a technical analysis tool designed to predict trend reversals in the price of an asset.
It functions as a momentum oscillator, measuring the ratio of the smoothed price change to the smoothed absolute price change over a given number of previous periods.
The Ergodic SMI is based on the True Strength Index (TSI) and integrates a signal line, which is an exponential moving average (EMA) of the SMI indicator itself.
It provides a clearer picture of market trends than the traditional stochastic oscillator by incorporating the concept of "ergodicity", which helps remove market noise.
On ther other hand, the Stochastic Momentum Index Ergodic Oscillator (SMIO) is a histogram that measures the difference between TSI and it's signal line.
By default, in TradingView both SMII and SMIO are provided independently.
Here in this script these two indicators are combined, providing a more comprehensive view of price direction and market strength.
▮ Motivation: why another indicator?
The intrinsic value of this indicator lies in the fact that it allows fine adjustments in both calculation parameters, data source and visualization, features that are not present in the standard indicators or similar.
Also, trend lines breakouts and divergences detector were added.
▮ What to look for
When using the indicator, there are a few things to look out for.
First, look at the SMI signal line.
When the line crosses above -40, it is considered a buy signal, while the crossing below +40 is considered a sell signal.
Also, pay attention to divergences between the SMI and the price.
If price is rising but the SMI is showing negative divergence, it could indicate that momentum is waning and a reversal could be in the offing.
Likewise, if price is falling but the SMI is showing positive divergence, this could indicate that momentum is building and a reversal could also be in the offing.
Divergences can be considered in both indicator and/or histogram.
Examples:
▮ Notes
The indicator presented here offers both the "SMII" and the "SMIO", that is, the "Stochastic Momentum Index Ergodic Indicator" together with the "Stochastic Momentum Index Ergodic Oscillator" (histogram), as per the documentation described in reference links.
So it is important to highlight the differences in relation to my other indicator, Stochastic Momentum Index (SMI) Refurbished .
This last one is purely based on the **SMI**, which is implemented using smoothed ratio between the relative range and the high/low range.
Although they may seem the same in some situations, the calculation is actually different. The TSI tends to be more responsive at the expense of being noisier, while the SMI tends to be smoother. Which of these two indicators is best depends on the situation, the context, and the analyst's personal preference.
Please refer to reference links to more info.
▮ References
SMI documentation
SMII documentation
SMIO documentation

Stochastic Momentum Index (SMI) Refurbished▮Introduction
Stochastic Momentum Index (SMI) Indicator is a technical indicator used in technical analysis of stocks and other financial instruments.
It was developed by William Blau in 1993 and is considered to be a momentum indicator that can help identify trend reversal points.
Basically, it's a combination of the True Strength Index with a signal line to help identify turning points in the market.
SMI uses the stochastic formula to compare the current closing price of an asset with the maximum and minimum price range over a specific period.
He then compares this ratio to a short-term moving average to create an indicator that oscillates between -100 and +100.
When the SMI is above 0, it is considered positive, indicating that the current price is above the short-term moving average.
When it is below 0, it is considered negative, indicating that the current price is below the short-term moving average.
Traders use the SMI to identify potential trend reversal points.
When the indicator reaches an extreme level above +40 or below -40, a trend reversal is possible.
Furthermore, traders also watch for divergences between the SMI and the asset price to identify potential trading opportunities.
It is important to remember that the SMI is a technical indicator and as such should be used in conjunction with other technical analysis tools to get a complete picture of the market situation.
▮ Improvements
The following features were added:
1. 7 color themes, for TSI, Signal and Histogram.
2. Possibility to customize moving average type for TSI/Signal.
3. Dynamic Zones.
4. Crossing Alerts.
5. Alert points on specific ranges.
5. Coloring of bars according to TSI/Signal/Histogram.
▮ Themes
Examples:
▮ About Dynamic Zones
'Most indicators use a fixed zone for buy and sell signals.
Here's a concept based on zones that are responsive to the past levels of the indicator.'
The concept of Dynamic Zones was described by Leo Zamansky ( Ph .D.) and David Stendahl, in the magazine of Stocks & Commodities V15:7 (306-310).
Basically, a statistical calculation is made to define the extreme levels, delimiting a possible overbought/oversold region.
Given user-defined probabilities, the percentile is calculated using the method of Nearest Rank.
It is calculated by taking the difference between the data point and the number of data points below it, then dividing by the total number of data points in the set.
The result is expressed as a percentage.
This provides a measure of how a particular value compares to other values in a data set, identifying outliers or values that are significantly higher or lower than the rest of the data.
▮ What to look for
1. Divergences/weakening of a trend/reversal:
2. Supports, resistances, pullbacks:
3. Overbought/Oversold Points:
▮ Thanks and Credits
- TradingView and PineCoders: for SMI and Moving Averages
- allanster: for Dynamic Zones

Divergence for Many Panel (D4MP+)Divergence for Many Panel (D4MP+)
This Divergence for Many Panel indicator is built upon the realtme divergence drawing code originally authored by LonesomeTheBlue, now in the form of a panel indicator.
The available oscillators, hand picked for their ability to identify high quality divergences currently include:
- Ultimate Oscillator (UO)
- True Strength Index (TSI)
- Money Flow Index (MFI)
- Relative Strength Index (RSI)
- Stochastic RSI
- Time Segmented Volume (TSV)
- Cumulative Delta Volume (CDV)
Note : this list of available oscillators may be added to or altered at a later date.
The indicator includes the following features:
- Ability to select any of the above oscillators
- Optional divergence lines drawn directly onto the oscillator in realtime .
- Configurable alerts to notify you when divergences occur.
- Configurable pivot lookback periods to fine tune the divergences drawn in order to suit different trading styles and timeframes, including the ability to enable automatic adjustment of pivot period per chart timeframe.
- Background colouring option to indicate when the selected oscillator has crossed above or below its centerline.
- Alternate timeframe feature allows you to configure the oscillator to use data from a different timeframe than the chart it is loaded on.
- Oscillator name label, so you can clearly see which oscillator is selected, in the case you have multiple loaded onto a chart.
- Optional adjustable range bands.
- Automatic adjustment of line colours, centerlines and range band levels on a per oscillator basis by default.
- Ability to customise the colours of each of the oscillators.
What is the Ultimate Oscillator ( UO )?
“The Ultimate Oscillator indicator (UO) indicator is a technical analysis tool used to measure momentum across three varying timeframes. The problem with many momentum oscillators is that after a rapid advance or decline in price, they can form false divergence trading signals. For example, after a rapid rise in price, a bearish divergence signal may present itself, however price continues to rise. The ultimate Oscillator attempts to correct this by using multiple timeframes in its calculation as opposed to just one timeframe which is what is used in most other momentum oscillators.”
What is the True Strength Index ( TSI )?
"The true strength index (TSI) is a technical momentum oscillator used to identify trends and reversals. The indicator may be useful for determining overbought and oversold conditions, indicating potential trend direction changes via centerline or signal line crossovers, and warning of trend weakness through divergence."
What is the Money Flow Index ( MFI )?
“The Money Flow Index ( MFI ) is a technical oscillator that uses price and volume data for identifying overbought or oversold signals in an asset. It can also be used to spot divergences which warn of a trend change in price. The oscillator moves between 0 and 100. Unlike conventional oscillators such as the Relative Strength Index ( RSI ), the Money Flow Index incorporates both price and volume data, as opposed to just price. For this reason, some analysts call MFI the volume-weighted RSI .”
What is the Relative Strength Index ( RSI )?
"The relative strength index (RSI) is a momentum indicator used in technical analysis. RSI measures the speed and magnitude of a security's recent price changes to evaluate overvalued or undervalued conditions in the price of that security. The RSI can do more than point to overbought and oversold securities. It can also indicate securities that may be primed for a trend reversal or corrective pullback in price. It can signal when to buy and sell. Traditionally, an RSI reading of 70 or above indicates an overbought situation. A reading of 30 or below indicates an oversold condition. It is also commonly used to identify divergences."
What is the Stochastic RSI (StochRSI)?
"The Stochastic RSI (StochRSI) is an indicator used in technical analysis that ranges between zero and one (or zero and 100 on some charting platforms) and is created by applying the Stochastic oscillator formula to a set of relative strength index (RSI) values rather than to standard price data. Using RSI values within the Stochastic formula gives traders an idea of whether the current RSI value is overbought or oversold. The StochRSI oscillator was developed to take advantage of both momentum indicators in order to create a more sensitive indicator that is attuned to a specific security's historical performance rather than a generalized analysis of price change."
What Is Time Segmented Volume?
"Time segmented volume (TSV) is a technical analysis indicator developed by Worden Brothers Inc. that segments a stock's price and volume according to specific time intervals. The price and volume data is then compared to uncover periods of accumulation (buying) and distribution (selling)."
What is Cumulative Volume Delta ( CDV )?
"The CDV analyses the net buying at market price and net selling at market price. This means, that volume delta is measuring whether it is the buyers or sellers that are more aggressive in taking the current market price. It measures the degree of intent by buyers and sellers, which can be used to indicate who is more dominant. The CDV can be used to help identify possible trends and also divergences"
What are divergences?
Divergence is when the price of an asset is moving in the opposite direction of a technical indicator, such as an oscillator, or is moving contrary to other data. Divergence warns that the current price trend may be weakening, and in some cases may lead to the price changing direction.
There are 4 main types of divergence, which are split into 2 categories;
regular divergences and hidden divergences. Regular divergences indicate possible trend reversals, and hidden divergences indicate possible trend continuation.
Regular bullish divergence: An indication of a potential trend reversal, from the current downtrend, to an uptrend.
Regular bearish divergence: An indication of a potential trend reversal, from the current uptrend, to a downtrend.
Hidden bullish divergence: An indication of a potential uptrend continuation.
Hidden bearish divergence: An indication of a potential downtrend continuation.
Setting alerts.
With this indicator you can set alerts to notify you when any/all of the above types of divergences occur, on any chart timeframe you choose.
Configurable pivot periods.
You can adjust the default pivot periods to suit your prefered trading style and timeframe. If you like to trade a shorter time frame, lowering the default lookback values will make the divergences drawn more sensitive to short term price action.
How do traders use divergences in their trading?
A divergence is considered a leading indicator in technical analysis , meaning it has the ability to indicate a potential price move in the short term future.
Hidden bullish and hidden bearish divergences, which indicate a potential continuation of the current trend are sometimes considered a good place for traders to begin, since trend continuation occurs more frequently than reversals, or trend changes.
When trading regular bullish divergences and regular bearish divergences, which are indications of a trend reversal, the probability of it doing so may increase when these occur at a strong support or resistance level . A common mistake new traders make is to get into a regular divergence trade too early, assuming it will immediately reverse, but these can continue to form for some time before the trend eventually changes, by using forms of support or resistance as an added confluence, such as when price reaches a moving average, the success rate when trading these patterns may increase.
Typically, traders will manually draw lines across the swing highs and swing lows of both the price chart and the oscillator to see whether they appear to present a divergence, this indicator will draw them for you, quickly and clearly, and can notify you when they occur.
Disclaimer : This script includes code from several stock indicators by Tradingview as well as the Divergence for Many Indicators v4 by LonesomeTheBlue. With special thanks.

FOTSI - Open sourceI WOULD LIKE TO SPECIFY TWO THINGS:
- The indicator was absolutely not designed by me, I do not take any credit and much less I want them, I am just making this fantastic indicator open source and accessible to all
- The script code was not recycled from other indicators, but was created from 0 following the theory behind it to the letter, thus avoiding copyright infringement
- Advices and improvements are accepted, as having very little programming experience in Pine Script I consider this work still rough and slow
WHAT IS THE FOTSI?
The FOTSI is an oscillator that measures the relative strength of the individual currencies that make up the 28 major Forex exchanges.
By identifying the currencies that are in the overbought (+50) and oversold (-50) areas, it is possible to anticipate the correction of a currency pair following a strong trend.
THE THEORY BEHIND
1) At the base of everything is the 1-period momentum (close-open) of the single currency pairs that contain a certain currency. For example, the momentum of the USD currency is composed of all the exchange rates that contain the US dollar inside it: mom_usd = - mom_eurusd - mom_gbpusd + mom_usdchf + mom_usdjpy - mom_audusd + mom_usdcad - mom_nzdusd. Where the base currency is in second position, the momentum is subtracted instead of adding it.
2) The IST formula is applied to the momentum of the individual currencies obtained. In this way we get an oscillator that oscillates between 0 and its overbought and oversold areas. The area between +25 and -25 is an area in which we can consider the movements of individual currencies to be neutral.
3) The TSI is nothing more than a double smoothing on the momentum of individual currencies. This particularity makes the indicator very reactive, minimizing the delays of the trend reversal.
HOW TO USE
1) A currency is identified that is in the overbought (+50) or oversold (-50) area. Example GBP = 50
2) The second currency is identified as the one most opposite to the first. Example USD = -25
3) The currency pair consisting of the two currencies opens. So GBP / USD
4) Considering that GBP is oversold, we anticipate its future devaluation. So in this case we are short on GBP / SUD. Otherwise if GBP had been oversold (-50) we expect its future valuation and therefore we enter long.
5) It is used on the H1, H4 and D1 timeframes
6) Closing conditions: the position on the 50-period exponential moving average is split / the position at target on the 100-period exponential moving average is closed
7) Stoploss: it is recommended not to use it, if you want to use it it is equivalent to 5 times the ATR on the reference timeframe
8) Position sizing: go very slow! Being a counter-trend strategy, it is very risky to position yourself heavily. Use common sense in everything!
9) To insert the alerts that warn you of an overbought and oversold condition, it is necessary to enter the signals called "Overbought Signal" and "Oversold Signal" for each chart used, in the specific Trading View window. like me using multiple charts in the same window.
I hope you enjoy my work. For any questions write in the comments.
Thanks <3
//--------------------------------------------------------------------------------------------------------------------------------------------------------------------------------------------------------------
TENGO A PRECISARE DUE COSE:
- L'indicatore non è stato assolutamente ideato da me, non mi assumo nessun merito e tanto meno li voglio, io sto solo rendendo questo fantastico indicatore open source ed accessibile a tutti
- Il codice dello script non è stato riciclato da altri indicatori, ma è stato creato da 0 seguendo alla lettere la teoria che sta alla sua base, evitando così di violare il copyright
- Si accettano consigli e migliorie, visto che avendo pochissima esperienza di programmazione in Pine Script considero questo lavoro ancora grezzo e lento
COS'È IL FOTSI?
Il FOTSI è un oscillatore che misura la forza relativa delle singole valute che compongono i 28 cambi major del Forex.
Individuando le valute che si trovano nelle aree di ipercomprato (+50) ed ipervenduto (-50) , è possibile anticipare la correzione di una coppia valutaria al seguito di un forte trend.
LA TEORIA ALLA BASE
1) Alla base di tutto c'è il momentum ad 1 periodo (close-open) delle singole coppie valutarie che contengono una determinata valuta. Ad esempio il momentum della valuta USD è composto da tutti i cambi che contengono il dollaro americano al suo interno: mom_usd = - mom_eurusd - mom_gbpusd + mom_usdchf + mom_usdjpy - mom_audusd + mom_usdcad - mom_nzdusd . Ove la valuta base si trova in seconda posizione si sottrae il momentum al posto che sommarlo.
2) Si applica la formula del TSI ai momentum delle singole valute ottenute. In questo modo otteniamo un oscillatore che oscilla tra lo 0 e le sue aree di ipercomprato ed ipervenduto. L'area compresa tra +25 e -25 è un area in cui possiamo considerare neutri i movimenti delle singole valute.
3) Il TSI non è altro che un doppio smoothing sul momentum delle singole valute. Questa particolarità rende l'indicatore molto reattivo, minimizzando i ritardi dell'inversione del trend.
COME SI USA
1) Si individua una valuta che si trova nell'area di ipercomprato (+50) o ipervenduto (-50) . Esempio GBP = 50
2) Si individua come seconda valuta quella più opposta alla prima. Esempio USD = -25
3) Si apre la coppia di valuta composta dalle due valute. Quindi GBP/USD
4) Considerando che GBP è in fase di ipervenduto prevediamo una sua futura svalutazione. Quindi in questo caso entriamo short su GBP/SUD. Diversamente se GBP fosse stato in fase di ipervenduto (-50) ci aspettiamo una sua futura valutazione e quindi entriamo long.
5) Si usa sui timeframe H1, H4 e D1
6) Condizioni di chiusura: si smezza la posizione sulla media mobile esponenziale a 50 periodi / si chiude la posizione a target sulla media mobile esponenziale a 100 periodi
7) Stoploss: è consigliato non usarlo, nel caso lo si voglia utilizzare esso equivale a 5 volte l'ATR sul timeframe di riferimento
8) Position sizing: andateci molto piano! Essendo una strategia contro trend è molto rischioso posizionarsi in modo pesante. Usate il buonsenso in tutto!
9) Per inserire gli allert che ti avvertono di una condizione di ipercomprato ed ipervenduto, è necessario inserire dall'apposita finestra di Trading View i segnali denominati "Segnale di ipercomprato" ed "Segnale di ipervenduto" per ogni grafico che si usa, nel caso come me che si utilizzano più grafici nella stessa finestra.
Spero che possiate apprezzare il mio lavoro. Per qualsiasi domanda scrivete nei commenti.
Grazie<3

RSI + TSI✅ All 3 indicators in one pane
✅ RSI and RSI MA with standard zones (30, 50, 70)
✅ TSI scaled to 0–100 range for alignment with RSI
✅ Color-coded TSI fill for quick trend recognition (green = bullish, red = bearish)
✅ Compatible with TradingView v6
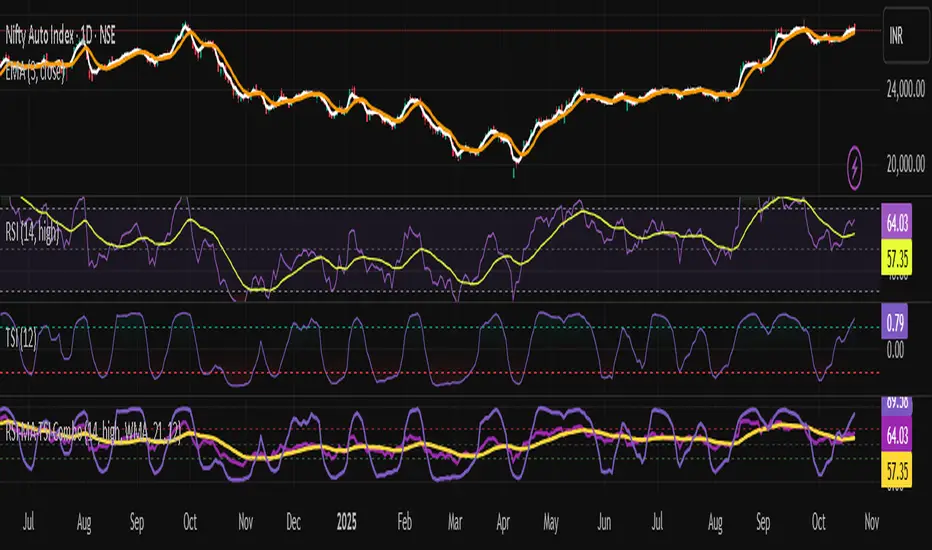
BH Ergodic (TSI-style) [v5]The BG Ergodic script is a custom momentum and trend-confirmation tool that builds on the classic True Strength Index (TSI) and Ergodic Oscillator concepts. It smooths price momentum over multiple exponential averages to identify underlying trend direction, exhaustion, and potential reversals with reduced noise.
Unlike a standard TSI, the BG Ergodic combines:
Dual-smoothing filters for both momentum and signal lines, giving a cleaner response in choppy markets.
Dynamic color transitions that highlight bullish and bearish phases based on crossovers and slope changes.
Optional histogram plotting to visualize the spread between the Ergodic line and its signal line for early trend-shift detection.
This indicator works best on swing or trend-following timeframes (e.g., 1H–1D) and can be used to:
Confirm trend direction before entries,
Filter false breakouts, or
Spot momentum divergence near key support/resistance zones.

MomentumSignal Kit RSI-MACD-ADX-CCI-CMF-TSI-EStoch// ----------------------------------------
// Description:
// ----------------------------------------
// MomentumKit RSI/MACD-ADX-CCI-CMF-TSI-EStoch Suite is a comprehensive momentum indicator suite designed to provide robust buy and sell signals through the consensus of multiple normalized momentum indicators. This suite integrates the following indicators:
// - **Relative Strength Index (RSI)**
// - **Stochastic RSI**
// - **Moving Average Convergence Divergence (MACD)** with enhanced logic
// - **True Strength Index (TSI)**
// - **Commodity Channel Index (CCI)**
// - **Chaikin Money Flow (CMF)**
// - **Average Directional Index (ADX)**
// - **Ehlers' Stochastic**
//
// **Key Features:**
// 1. **Normalization:** Each indicator is normalized to a consistent scale, facilitating easier comparison and interpretation across different momentum metrics. This uniform scaling allows traders to seamlessly analyze multiple indicators simultaneously without the confusion of differing value ranges.
//
// 2. **Consensus-Based Signals:** By combining multiple indicators, MomentumKit generates buy and sell signals based on the agreement among various momentum measurements. This multi-indicator consensus approach enhances signal reliability and reduces the likelihood of false positives.
//
// 3. **Overlap Analysis:** The normalization process aids in identifying overlapping signals, where multiple indicators point towards a potential change in price or momentum. Such overlaps are strong indicators of significant market movements, providing traders with timely and actionable insights.
//
// 4. **Enhanced Logic for MACD:** The MACD component within MomentumKit utilizes enhanced logic to improve its responsiveness and accuracy in detecting trend changes.
//
// 5. **Debugging Features:** MomentumKit includes advanced debugging tools that display individual buy and sell signals generated by each indicator. These features are intended for users with technical and programming skills, allowing them to:
// - **Visualize Signal Generation:** See real-time buy and sell signals for each integrated indicator directly on the chart.
// - **Adjust Signal Thresholds:** Modify the criteria for what constitutes a buy or sell signal for each indicator, enabling tailored analysis based on specific trading strategies.
// - **Filter and Manipulate Signals:** Enable or disable specific indicators' contributions to the overall buy and sell signals, providing flexibility in signal generation.
// - **Monitor Indicator Behavior:** Utilize debug plots and labels to understand how each indicator reacts to market movements, aiding in strategy optimization.
//
// **Work in Progress:**
// MomentumKit is continuously evolving, with ongoing enhancements to its algorithms and user interface. Current debugging features are designed to offer deep insights for technically adept users, allowing for extensive customization and fine-tuning. Future updates aim to introduce more user-friendly interfaces and automated optimization tools to cater to a broader audience.
//
// **Usage Instructions:**
// - **Visibility Controls:** Users can toggle the visibility of individual indicators to focus on specific momentum metrics as needed.
// - **Parameter Adjustments:** Each indicator comes with customizable parameters, allowing traders to fine-tune the suite according to their trading strategies and market conditions.
// - **Debugging Features:** Enable the debugging mode to visualize individual indicator signals and adjust their contribution to the overall buy/sell signals. This requires a basic understanding of the underlying indicators and their operational thresholds.
//
// **Benefits:**
// - **Simplified Analysis:** Normalization simplifies the process of analyzing multiple indicators, making it easier to identify consistent signals across different momentum measurements.
// - **Improved Decision-Making:** Consensus-based signals backed by multiple normalized indicators provide a higher level of confidence in trading decisions.
// - **Versatility:** Suitable for various trading styles and market conditions, MomentumKit offers a versatile toolset for both novice and experienced traders.
//
// **Technical Requirements:**
// - **Programming Knowledge:** To fully leverage the debugging and signal manipulation features, users should possess a foundational understanding of Pine Script and the mechanics of momentum indicators.
// - **Customization Skills:** Ability to adjust indicator parameters and debug filters to align with specific trading strategies.
//
// **Disclaimer:**
// This indicator suite is intended for educational and analytical purposes only and does not constitute financial advice. Trading involves significant risk, and past performance is not indicative of future results. Always conduct your own analysis or consult a qualified financial advisor before making trading decisions.
