Volumetric Entropy IndexVolumetric Entropy Index (VEI)
A volume-based drift analyzer that captures directional pressure, trend agreement, and entropy structure using smoothed volume flows.
---
🧠 What It Does:
• Volume Drift EMAs : Shows buy/sell pressure momentum with adaptive smoothing.
• Dynamic Bands : Bollinger-style volatility wrappers react to expanding/contracting drift.
• Baseline Envelope : Clean structural white rails for mean-reversion zones or trend momentum.
• Background Shading : Highlights when both sides (up & down drift) are in agreement — green for bullish, red for bearish.
• Alerts Included : Drift alignment, crossover events, net drift shifts, and strength spikes.
---
🔍 What Makes It Different:
• Most volume indicators rely on bars, oscillators, or OBV-style accumulation — this doesn’t.
• It compares directional EMAs of raw volume to isolate real-time bias and acceleration.
• It visualizes the twisting tension between volume forces — not just price reaction.
• Designed to show when volatility is building inside the volume mechanics before price follows.
• Modular — every element is optional, so you can run it lean or fully loaded.
---
📊 How to Use It:
• Drift EMAs : Watch for one side consistently dominating — sharp spikes often precede breakouts.
• Bands : When they tighten and start expanding, it often signals directional momentum forming.
• Envelope Lines : Use as high-probability reversal or continuation zones. Bands crossing envelopes = potential thrust.
• Background Color : Green/red backgrounds confirm volume agreement. Can be used as a filter for other signals.
• Net Drift : Optional smoothed oscillator showing the difference between bullish and bearish volume pressure. Crosses above or below zero signal directional bias shifts.
• Drift Strength : Measures pressure buildup — spikes often correlate with large moves.
---
⚙️ Full Customization:
• Turn every layer on/off independently
• Modify all colors, transparencies, and line widths
• Adjust band width multiplier and envelope offset (%)
• Toggle bonus plots like drift strength and net baseline
---
🧪 Experimental Tools:
• Smoothed Net Drift trace
• Drift Strength signal
• Envelope lines and dynamic entropy bands with adjustable math
---
Built for signal refinement. Made to expose directional imbalance before the herd sees it.
Created by @Sherlock_Macgyver
Search in scripts for "volume"

Volumetric Pivot Echo🔮 Volumetric Pivot Echo (VPE)
Future Price Projection Zones with Confidence Scoring
📘 Overview
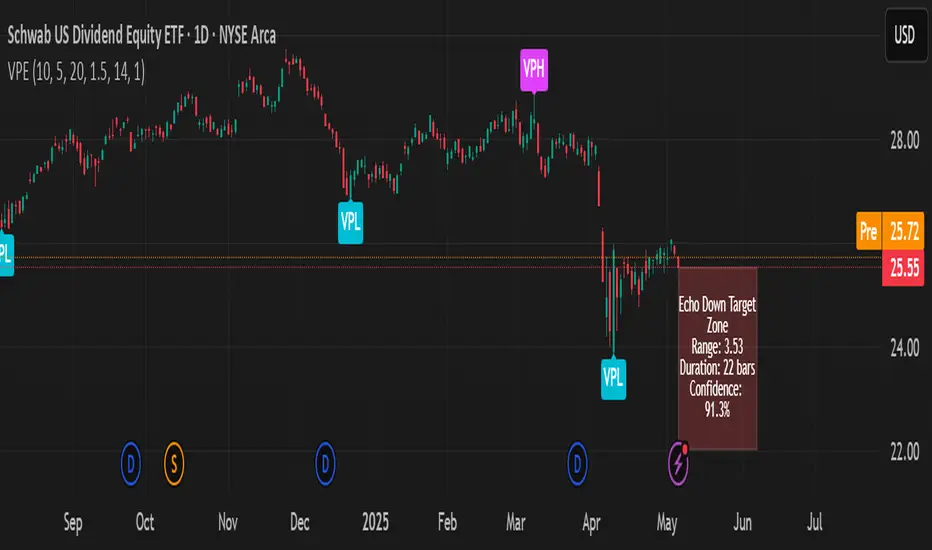
The Volumetric Pivot Echo (VPE) is a next-generation leading indicator that identifies high-volume reversal points and echoes their price + time behavior into the future — giving you a visual forecast box that includes a confidence score, price range, and duration estimate.
It’s designed for swing and options traders who want forward guidance based on real structure, not just reactive signals.
⚙️ How It Works
Pivot Detection – Finds pivot highs/lows based on configurable bar structure.
Volume Confirmation – Only confirms pivots backed by strong volume (e.g., 1.5× average).
Echo Logic – Measures the price move and time it took to reach the pivot.
ATR Scaling – Adjusts projections based on current market volatility.
Confidence Score – Rates each projection (0–100%) based on structure match, volatility, and direction alignment.
📦 What Appears on Chart
Projection Box:
A forward-drawn rectangle from the current bar to the estimated future zone. The box's size and duration mirror the last valid momentum leg.
Box Label Text:
🔹 Range (projected move size)
⏱️ Duration (bars expected)
✅ Confidence %
VPH/VPL Markers:
Pivot highs and lows confirmed by volume, marked with “VPH” or “VPL”.
🎯 How to Trade with It
Use the box as a target zone for directional trades.
If price enters a box with >85% confidence, consider it a high-quality path projection.
Use with support/resistance confluence or entry systems.
Works especially well for swing trading, breakout setups, or options targeting.
🛠️ Recommended Settings
Box Transparency: Set Projection Up/Down Color to 90 (10% visible).
Text Color: Set to white for readability.
Volume Multiplier: Default 1.5x, increase in choppy markets.
Projection Duration: Start with 1.0x echo multiplier and fine-tune.
⏳ Timeframes & Accuracy
Timeframe Confidence Zones Most Reliable
15m – 1h Use 70–85% confidence scores
1h – 4h Sweet spot for balanced signals
1D – 1W Strongest historical echo tracking (>85% ideal)
✅ Key Features
Forward-looking, non-repainting logic
Clear visual projections — no guesswork
Confidence scoring built-in
ATR-adjusted — adapts to volatility
Works on any asset (stocks, crypto, FX)
🧠 Why It’s Unique
This is not a lagging oscillator or classic trend-following tool.
It’s a leading structure projection model — combining pivot behavior, volume intensity, and market volatility to sketch forward “echo zones” based on the past.
Volume Weighted Sign ChangeThe VWSCI measures the relationship between price reversals and volume. Specifically, it calculates the proportion of total volume in a given window that occurs at bars where the price changes direction—i.e., where the price difference switches from positive to negative or vice versa, indicating a local maximum or minimum.
• Low VWSCI values (close to 0) suggest that little volume is associated with price reversals, which typically occurs in strong trending markets where price moves consistently in one direction with high volume, and pullbacks (if any) occur on low volume.
• High VWSCI values (closer to 100) indicate that a significant portion of the volume is tied to price turning points, which is characteristic of a ranging or choppy market with frequent reversals.
This approach combines price action (via sign changes in price differences) and volume, offering a novel twist on traditional momentum or volume-based indicators like RSI, OBV, or the Volume-Price Trend.

Volume Trend Signals | iSolani
Volume Trend Signals | iSolani: Syncing Price Momentum with Volume Confirmation
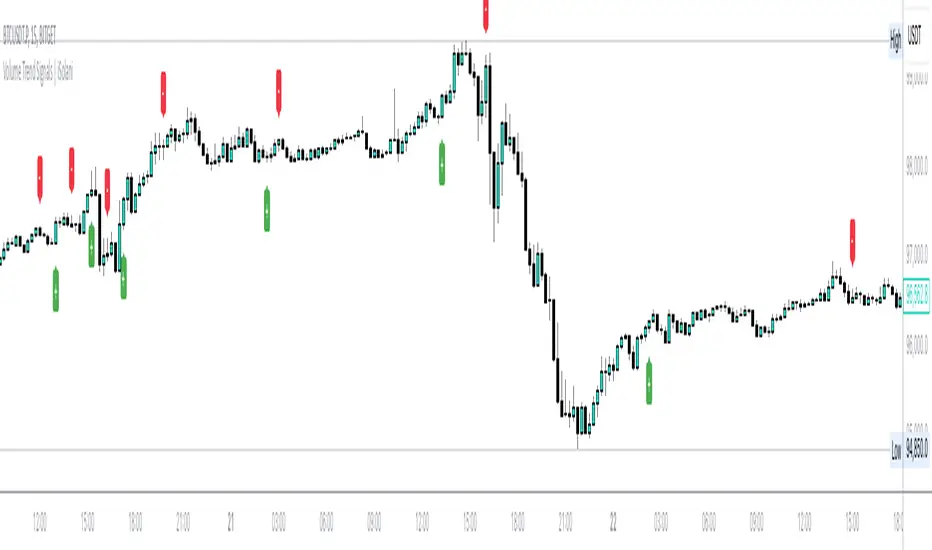
In the dance between price action and volume, discerning true trend commitment requires seeing how institutional players vote with their capital. The Volume Trend Signals | iSolani illuminates this interplay by generating precise crossover signals when volume-accelerated price movements gain sustained traction. Unlike conventional volume oscillators, it employs a two-layered confirmation system —blending volatility-adjusted thresholds with adaptive smoothing—to spotlight high-probability entries aligned with smart-money activity.
Core Methodology
The indicator executes a five-phase process to filter meaningful trends:
Logarithmic Price Scaling: Measures percentage-based price changes via HLC3 typical price, reducing large-value bias in volatile markets.
Volatility Dynamic Filter: Uses a 30-bar standard deviation of price changes, scaled by user sensitivity (default 2x), to set momentum thresholds.
Volume Governance: Caps raw volume at 3x its 40-bar SMA, neutralizing outlier spikes while preserving institutional footprints.
Directional Flow Accumulation: Sums volume as positive/negative based on whether price movement breaches volatility-derived boundaries.
Signal Refinement: Smooths the Volume Flow Indicator (VFI) with a 3-bar SMA, then triggers alerts via crosses over a 20-bar EMA signal line.
Breaking New Ground
This tool introduces three evolutionary improvements over traditional volume indicators:
EMA Convergence Signals: Unlike basic zero-cross systems, it requires VFI to overtake its own EMA, confirming sustained momentum shifts.
Context-Aware Volume: The 3x volume cap adapts to current market activity, preventing false signals during news-driven liquidity spikes.
Minimalist Visual Alerts: Uses and symbols below/above candles, reducing chart clutter while emphasizing pivotal moments.
Engine Under the Hood
The script’s logic flows through four computational stages:
Data Conditioning: Computes HLC3 and its log-based rate of change for normalized price analysis.
Threshold Calibration: Derives dynamic entry/exit levels from 30-period volatility multiplied by user sensitivity.
Volume Processing: Filters and signs volume based on price meeting threshold criteria.
Signal Generation: Triggers buy/sell labels when the 3-bar SMA of cumulative flow crosses the 20-bar EMA.
Standard Configuration
Optimized defaults balance responsiveness and reliability:
VFI Length: 40-bar accumulation window
Sensitivity: 2.0 (double the volatility-derived threshold)
Signal Smoothing: 20-bar EMA
Volume Cap: 3x average (hidden parameter)
Smoothing: Enabled (3-bar SMA on VFI)
By fusing adaptive volume filtering with EMA-confirmed momentum, the Volume Trend Signals | iSolani cuts through market noise to reveal institutional-grade trend inflection points. Its unique crossover logic—prioritizing confirmation over speed—makes it particularly effective in swing trading and trend-following strategies across equities, commodities, and forex markets.
Intraday Volume### Intraday Volume Indicator Explanation
--- this was Mostly created by OpenAI ChatGPT --- it's pretty good!
--- My Commentary: One of the problems I find is with Volume is - it is skewed by the overwhelming volume around the Open and Close. So, as an experiment, I asked ChatGPT to create an indicator to plot the volume everywhere BUT the open.
I added in the CandleColor() function and set the times.
I also changed the Intraday Volume calculation from Cumulative to live.
still Chat GPT - did about 90% of the heavy lift! And, wrote the summary !
----
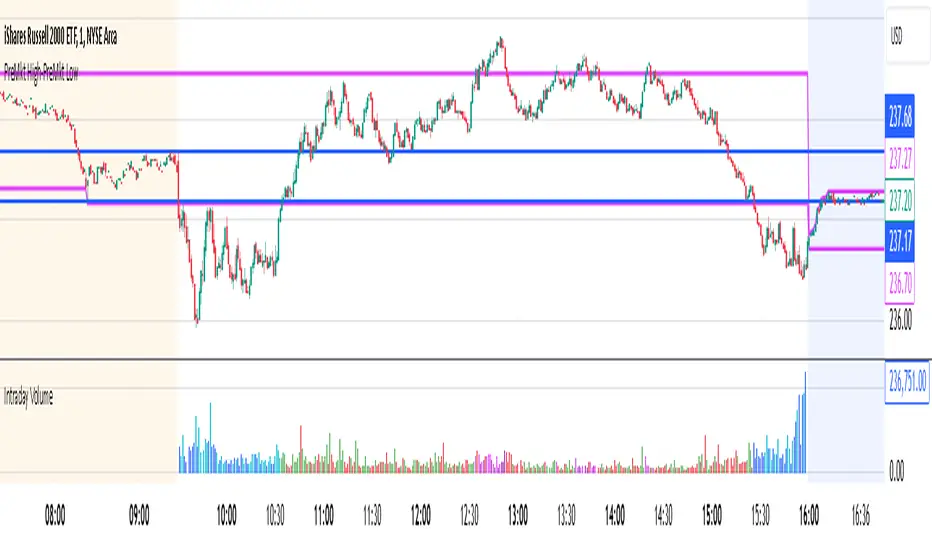
The "Intraday Volume" indicator is a custom script designed for use on the TradingView platform. It provides a visual representation of the total accumulated trading volume during the intraday trading session, specifically between the market open and close times. Below is a detailed explanation of its functionality:
#### **Key Features:**
1. **Session Times:**
- The indicator defines the intraday session as the period between 9:30 AM EST (market open) and 4:00 PM EST (market close).
- It uses the `timestamp` function to set these times dynamically for each trading day.
2. **Intraday Volume Calculation:**
- During the defined intraday session, the indicator accumulates the trading volume from each bar (candlestick).
- Outside the intraday session, the volume is reset to `na` (not available) to ensure only intraday data is plotted.
3. **Plotting the Volume:**
- The accumulated intraday volume is plotted as a blue column chart in a separate pane below the price chart.
- This provides a clear visualization of how the trading volume evolves throughout the trading session.
4. **Horizontal Reference Line:**
- A horizontal line is added at zero as a visual reference, making it easier to interpret the volume data.
#### **Use Cases:**
- **Volume Analysis:**
- Traders can use the indicator to identify periods of high or low trading activity during the intraday session.
- Peaks in the volume chart may correspond to key market events, such as news releases or significant price movements.
- **Trend Confirmation:**
- Comparing intraday volume with price action can help traders confirm the strength of a trend or the likelihood of a reversal.
- **Custom Time Frames:**
- Although this script is tailored for regular U.S. market hours, it can be adapted for other markets or time zones by modifying the session times.
#### **Customization:**
- **Colors and Styles:**
- The plot color (blue) and style (columns) can be customized to suit user preferences.
- **Session Times:**
- Users can change the session start and end times to match their trading needs or regional market hours.
This indicator is especially useful for intraday traders seeking insights into trading volume dynamics within the trading day. By visualizing the intraday volume, traders can gain a deeper understanding of market behavior and make informed decisions.
Freak VolumeFreak Volume is a technical indicator designed to identify bars with exceptionally high trading volume. It operates by calculating the mean volume over a specified period and determines high volume thresholds using both multiples of the mean and standard deviations from this mean.
High Volume Identification:
Standard Deviation Threshold: Bars with volume exceeding a specified number of standard deviations above the mean are highlighted within the indicator and on the corresponding candlesticks on the chart.
Mean Multiple Threshold: Bars with volume exceeding a multiple of the average volume are also highlighted. This highlighting is secondary to the standard deviation threshold, meaning standard deviation-based highlights take precedence.
Price Range Plotting: The indicator offers an option to display the price range of high volume candles, which may serve as potential supply and demand zones or support and resistance levels.
Freak Volume assists traders in visually identifying significant volume spikes that could indicate important market activity or potential turning points by providing multiple methods of high volume detection.

Bubbles Volume [BigBeluga]The Bubbles Volume indicator is an innovative visualization tool designed to represent trading volume in a more intuitive and visually appealing manner. By displaying volume as bubbles of varying sizes and colors on the price chart, this indicator helps traders quickly identify significant volume levels and potential areas of interest.
Important Note:
For correct visual representation of indicator, layout it to front:
🔵 KEY FEATURES
● Volume Bubbles
Represents trading volume as bubbles on the price chart
Bubble size increases with higher volume levels
Color intensity changes based on volume significance
Provides an intuitive visual representation of volume distribution
● Heatmap Coloring
Optional feature to color bubbles based on volume intensity
Uses a color gradient from cool (low volume) to hot (high volume) colors
Helps quickly identify extremely high volume areas
● Significant Volume Levels
Option to display horizontal lines at significant volume levels
Shows volume amount as labels for highly significant levels
Helps identify potential support/resistance areas based on volume
Volume Levels:
Levels with HeatMap:
Levels without Volume Bubles:
● Normalized Volume Calculation
Uses normalized volume to account for overall market volume trends
Provides a more accurate representation of volume significance
🔵 HOW TO USE
● Volume Analysis
Larger bubbles indicate higher trading volume
Clusters of large bubbles may suggest areas of high interest or potential reversals
Use in conjunction with price action to identify potential breakouts or fakeouts
● Trend Confirmation
Strong trends often show increasing bubble sizes in the trend direction
Diminishing bubble sizes might indicate weakening trends
● Support and Resistance
Significant volume levels (displayed as lines) can act as potential support/resistance
Pay attention to price reactions at these levels for trading opportunities
● Divergences
Look for divergences between price action and bubble sizes
Price making new highs/lows with smaller bubbles might indicate weakening momentum
● Volatility Assessment
Periods with consistently large bubbles indicate high volatility
Can be used to adjust trading strategies or position sizing
🔵 CUSTOMIZATION
The Bubbles Volume indicator offers several customization options:
Toggle bubble display on/off
Adjust volume threshold for filtering low volume bubbles
Enable/disable heatmap coloring for enhanced visual analysis
Show/hide significant volume levels
Adjust the number of significant levels displayed
Customize colors to suit personal preferences
By fine-tuning these settings, traders can adapt the indicator to various market conditions and personal analysis preferences.
The Bubbles Volume indicator provides a unique and intuitive way to visualize trading volume directly on the price chart. This approach allows traders to quickly identify areas of significant trading activity and potential price levels of interest without the need for a separate volume sub-chart.
This tool can be particularly useful for traders focusing on volume analysis, breakout strategies, or those looking to confirm price action with volume. The visual nature of the bubbles makes it easy to spot volume patterns and anomalies at a glance, potentially leading to faster and more informed trading decisions.
As with all technical indicators, it's recommended to use the Bubbles Volume indicator in conjunction with other forms of analysis and within the context of a well-defined trading strategy. While this indicator provides valuable volume insights, it should be considered alongside other factors such as overall market trends, price patterns, and fundamental analysis when making trading decisions.

Volume on levels @gauranshgVolume on Levels @gauranshg is a powerful Pine Script designed to visualize trading volume across price levels directly on the chart. This script allows users to observe volume intensity, offering a clearer perspective on price action and potential support/resistance areas. By utilizing a dynamic, customizable multiplier, the volume is normalized and displayed in proportion, ensuring better scalability across various timeframes and assets.
Usage:
Normalization of Volume: Users can input a multiplier to adjust the normalization of volume. This is useful when analyzing assets with differing price and volume ranges.
Input of 1 means 1 Million volume will be marked with green color of opacity 1 and 2 Million as 2 and so on. In case you are looking at chart with very high volume, you might want to increase the multiplies
Default multiplier is set to 1, and can be customized for different scales.
Volume Visualization: The volume is displayed on the chart as background boxes behind price levels, with the opacity of the boxes changing based on the normalized volume. This helps to quickly visualize areas of high and low trading activity.
This script is ideal for investors who wish to enhance their volume analysis by visualizing it directly on price levels in a clear, normalized format.

Buy-Sell Volume Bar Gauge [By MUQWISHI]▋ INTRODUCTION :
The Buy-Sell Volume Bar Gauge is developed to provide traders with a detailed analysis of volume in bars using a low timeframe, such as a 1-second interval, to measure the dominance of buy and sell for each bar. By highlighting the balance between buying and selling activities, the Buy-Sell Volume Bar Gauge helps traders identify potential volume momentum of a bar; aimed at being a useful tool for day traders and scalpers.
_______________________
▋ OVERVIEW:
_______________________
▋ METHODOLOGY:
The concept is based on bars from a lower timeframe within the current chart timeframe bar, where volume is categorized into Up, Down, and Neutral Volume, with each one displayed as a portion of a column plot. Up Volume is recorded when the price experiences a positive change, Down Volume occurs when the price experiences a negative change, and Neutral Volume is observed when the price shows no significant change.
_______________________
▋ INDICATOR SETTINGS:
(1) Fetch data from the selected lower timeframe. Note: If the selected timeframe is invalid (higher than chart), the indicator will automatically switch to 1 second.
(2) Price Source.
(3) Treating Neutral Data (Price Source) as
Neutral: In a lower timeframe, when the bar has no change in its price, the volume is counted as Neutral Volume.
Previous Move: In a lower timeframe, when the bar has no change in its price, the volume is counted as the previous change; “Up Volume” if the previous change was positive, and “Down Volume” if the previous change was negative.
Opposite Previous Move: In a lower timeframe, when the bar has no change in its price, the volume is counted as the opposite previous change; “Up Volume” if the previous change was negative, and “Down Volume” if the previous change was positive.
(4) Average Volume Length, it's used for lighting/darkening columns in a plot.
(5) Enable Alert.
(7) Total bought (%) Level.
(8) Total Sold (%) Level.
_____________________
▋ COMMENT:
The Buy-Sell Volume Bar Gauge can be taken as confirmation for predicting the next move, but it should not be considered a major factor in making a trading decision.

KillZones & Sessions [TradingFinder] Volume | Asia, London & NY🔵 Introduction
🟣 Session
The forex market operates 24 hours a day, 5 days a week, with only Saturdays and Sundays being off; traders often focus on one of the forex trading sessions instead of trying to trade in all markets 24 hours a day.
Trading sessions are time intervals during which a specific financial market is active and trades are conducted. The Asia, London, and New York sessions are the most important trading sessions throughout the 24-hour period, during which a significant amount of money and liquidity enters the market.
🟣 Kill Zone
Traders in financial markets profit from the difference between the price at which they buy or sell and the current market price. Traders have different time horizons for trading.
Among these, some traders engage in daily or even hourly trading and must operate during times when the market has desirable trading volumes and significant price movements.
Kill zones are segments of a session with higher trading volumes and price fluctuations compared to the rest of the session.
🔵 How to Use
🟣 Session Time
The "Asia Session" consists of two sessions: "Sydney" and "Tokyo." The beginning of this session, according to the "UTC" time zone, is at 23:00 and ends at 06:00. Similarly, the beginning of the "Asia KillZone," according to the "UTC" time zone, is at 23:00, and it ends at 03:55.
The "London Session" consists of two sessions: "Frankfurt" and "London." The beginning of this session, according to the "UTC" time zone, is at 07:00, and it ends at 14:25. Similarly, the beginning of the "London KillZone," according to the "UTC" time zone, is at 07:00, and it ends at 09:55.
The beginning of the "New York am" session, according to the "UTC" time zone, is at 14:30, and it ends at 19:25. Similarly, the beginning of the "New York am KillZone," according to the "UTC" time zone, is at 14:30, and it ends at 16:55.
The beginning of the "New York pm" session, according to the "UTC" time zone, is at 19:30, and it ends at 22:55. Similarly, the beginning of the "New York pm KillZone," according to the "UTC" time zone, is at 19:30, and it ends at 20:55.
Important : To prevent session overlap, the working hours of each session have slightly changed.
🔵 Features
🟣 Simultaneous Session and Kill Zone
With this indicator, you can simultaneously view the kill zone and session. High and low lines are used to indicate sessions, while filled areas with color represent kill zones. If you do not want to see kill zones, you can turn off the display settings.
🟣 Candle, Time, and Volume
Using the "More Info" feature, you can see the number of candles, elapsed time, and traded volume within the colored filled area.
🔵 Settings
•Show More Info: To display "More Info," you need to turn on this feature and turn it off whenever you don't need it.
• You can also customize these settings for each session separately :
o Display or hide session.
o Choose session color.
o Set session time range.
o Display or hide kill zone.
o Set kill zone time range.

Price Range Volume Profile [Pt]█ Introduction
The Price Range Volume Profile (PRVP) is a revolutionary indicator. This tool stands out from its peers due to its unique ability to capture the entire price chart history, thus providing a comprehensive volume profile of the entire asset's trading history, as available on TradingView chart. It's worth noting that I believe this tool is the first of its kind to accomplish such a feat. A much recommended tool if you are a volume profile trader.
█ Main Features
► Historical Lookback: This feature dives deep into the past, grasping all the historical data of an asset. It's equipped to handle up to 20,000 bars, although users without a premium TradingView account are advised to keep it at a maximum of 10,000 bars, or just use the "Full Historical Lookback" feature.
► Volume Profile / POC: Displays the distribution of volume across price levels for the selected price range. The Point of Control (POC), which is the price level with the highest traded volume, is also highlighted.
► Customization: Users have the flexibility to adjust the profile's appearance, including profile width, horizontal offset, and the option to fill the background of the profile range.
► Time Weighting: This feature allows users to give more weight to recent trading activity, which can be especially useful for intraday traders or during times of high volatility. Note that this feature will impact the volume profile and POC level.
► Settings Table: A settings table is displayed on the chart for users to quickly reference their input parameters.
█ Input Parameters
► Lookback Timeframe: Determines the period for which the volume profile is generated.
► Price Range: The percentage distance to consider for the profile, adjusted above and below the current closing price.
► Profile Step size: The granularity of the volume profile. Users can opt for automatic step size based on a predefined calculation or set their preferred tick step size.
► Historical Bars Lookback: Determines the number of bars to include in the volume profile calculation.
► Profile Visuals: Adjust the appearance and layout of the volume profile on the chart.
► Extra: Additional settings including the display of a settings table and its location.
█ Basic Understanding of Volume Profile - How to use PRVP?
Volume Profile is a valuable tool for traders who want insights into where the majority of trading activity has occurred. Here are some tips to make the most of it:
► Understand the Basics: Before using the Volume Profile, ensure you understand the difference between it and the standard volume histogram. While both represent volume, the former displays it against price while the latter shows it against time.
► Identify High Volume Nodes (HVN) and Low Volume Nodes (LVN):
◊ HVN: Areas where there's a lot of trading activity and where the price has spent a lot of time. These areas can act as strong support or resistance.
◊ LVN: Areas where there's a lack of trading activity. Prices might move quickly through these areas, and they can act as potential breakpoints or accelerators for price movement.
► Locate the Point of Control (POC): This is the price level with the highest traded volume for a specified period. It often acts as a magnet for price, and it can serve as a pivot or reference point.
► Trend Confirmation: A shift in the volume profile from one price level to another can confirm a trend. For instance, if higher volume starts to build at higher price levels, it may indicate a strong uptrend.
► Watch for Volume Gaps: If there's a significant gap in the volume profile, prices may move quickly through these levels as there's little historical trading activity to act as support or resistance.
█ Other Usage Tips
◊ For optimal performance, ensure that the chosen timeframe aligns closely with the chart timeframe. Differences in timeframes may lead to minor discrepancies in the volume profile.
◊ To address any errors arising from too many levels displayed on the volume profile, consider increasing the Profile Step size or reducing the Price Range.

improved volumeIt is an indicator that displays the trading volume.
Red-colored candle bars indicate a decrease in trading volume.
Green-colored candle bars indicate an increase in trading volume.
The transparent yellow cloud above the volume bars represents the 21-bar moving average volume, which shows the average volume over the specified period. (You can change the number of bars and the type of moving average from the indicator settings.)
This allows for easier comparison between the current trading volume and the average volume.
In the price scale section, there are 4 target levels. They represent the following in ascending order: Average volume, Average volume multiplied by 2, Average volume multiplied by 3, Average volume multiplied by 4.
Additionally, you can use the alarm feature based on these average volume levels.

Volume Profile Regression Channel [LuxAlgo]The Volume Profile Regression Channel calculates a volume profile from an anchored linear regression channel. Users can choose the starting and ending points for the indicator calculation interval.
Like a regular volume profile, a "line" of control (LOC), value area, and a developing LOC are displayed.
🔶 SETTINGS
Sections: The number of sections the linear regression channel is divided into for the calculation of the volume profile.
Width %: Determines the length of the profile within the channel relative to the channel length.
Value Area %: Highlights the sections starting from the POC whose accumulated volume is equal to the user-defined percentage of the total profile sections volume.
🔶 USAGES
Regular volume profiles are often constructed from a horizontal price area, this can allow highlighting price areas where most trading activity takes place.
However, when price is strongly trending a classical volume profile can sometimes be more uniform. This is where using an angled volume profile can be useful.
The line of control allows highlighting the section of the channel with the most accumulated volume, this line can be used as a potential future support/resistance. This is where an angled volume profile might be the most useful.
The developing LOC highlights the LOC location at a specific time within the profile (from left to right) and can sometimes provide an estimate of the underlying trend in the price.
🔶 DETAILS
To be computed the script requires a left and right chart time coordinates. When adding the script to their charts users can determine the left and right time coordinates by clicking on the chart.
The linear regression channel width is determined so that the channel precisely encompasses the whole price.
🔶 LIMITATIONS
Using a very large calculation interval can return timeouts. Users can reduce the calculation interval to fix that issue from occurring.
The amount of drawing objects that can be used is limited, as such using a high calculation interval can display an incomplete profile.
🔶 ACKNOWLEDGEMENTS
If you are interested in these types of scripts, @HeWhoMustNotBeNamed published a similar script where users can use a custom line angle. See his 'Angled Volume Profile' script from March 2023.

Import Forex Volume from 5 biggest FX Brokers (single/combined) Some Brokers like Forex.com don't show Volume for FX. This indicator allows user to import Volume from a range of FX brokers that DO show volume
-Combine the reported volumes from all five brokers: FXCM, GLOBALPRIME, PEPPERSTONE, Currency.com, OANDA. Or pick a specific broker to import volume from.
-Image above shows combined Volume from the big 5 brokers, with added notes on the 2yr average of various broker's volumes; showing their size in descending order.
-Works across timeframes & FX pairs. Standard color formatting options Added.
//notes:
~default settings pull/combine volume from all 5 brokers. History goes back to Sept 2019 (due to GlobalPrime's later start date in publishing Volume data).
~~toggle ON 'only show FXCM, Pepperstone & Oanda' for a LONGER history, going back to June 2012.
~individual broker feeds: top checkbox toggled OFF, choose your preferred broker.
~~FXCM has both the longest history and the highest volume size of all the brokers.
~Table (toggle on/off) shows the broker feed (which broker(s) volume is on display) and the SMA 100 to give an idea of relative size.
//Cautionary note:
Volume is not as reliable in Forex as it is in Equities/commodities, due to unreported Inter-bank trades; the broker volumes do not give the full picture, but this is a best approximation of combined total volume based on brokers reported volume. The true volume will likely be much higher.
-Thank you @theEccentricTrader for the idea of pulling volume feed from other brokers.

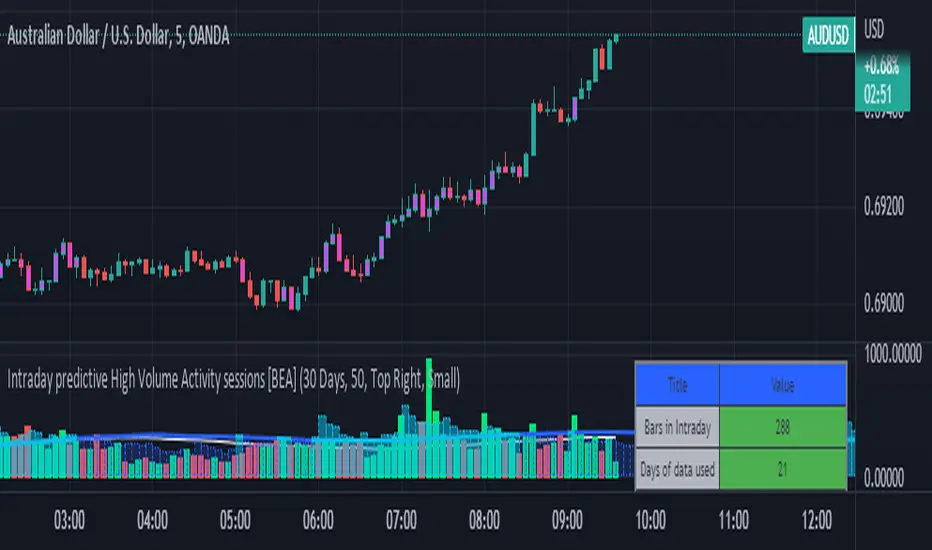
Intraday predictive High Volume Activity sessions [BEA]Idea:
This indicator is designed to know the high traded volume sessions in advance before the day starts.
The predictive volume bars will be plotted in advance once a new trading session starts.
Logic Used:
The basic idea is to store each bar volume / Volume MA data for the selected time. So, the first bar of each data is stored for all selected historical days.
Once the data is stored, I am taking average of each bar data for the selected Historical days.
How to Use:
This gives me an idea of the volume behavior throughout the days based on historical data. So I decide my time of trading for that specific times sessions where the traded volume activity is high.
The bars which are more than the Moving average ( Highlighted Volume bars plotted in future ) is the time session to focus.
Designed only for intraday timeframes.
Here in the image, you can see the session in advance for high traded volume activity.
Try it test it , let me know if it can be improved further.
Have a happy trading.
DISCLAIMER
Any and all liability for risks resulting from investment transactions or other asset dispositions carried out by the user based on information received or a market analysis is expressly excluded by me.
All the information made available here is generally provided to serve as an example only, without obligation and without specific recommendations for action. It does not constitute and cannot replace investment advice. We therefore recommend that you contact your personal financial advisor before carrying out specific transactions and investments.
Do your own research, this is not a financial advice.
Effective Volume (Willain)This is the Effective Volume using the Average Separation Method
Excerpt:
The most obvious way to separate Large from Small Effective Volume is to calculate the per-minute average Effective Volume exchanged for all the
minutes of the day where a price inflection was found. The volume above that average is called Large Effective Volume (pg. 67)
Looks at the Close(n) to Close(n-1)/h-c*vol and registers it if its above 30% of total volume.

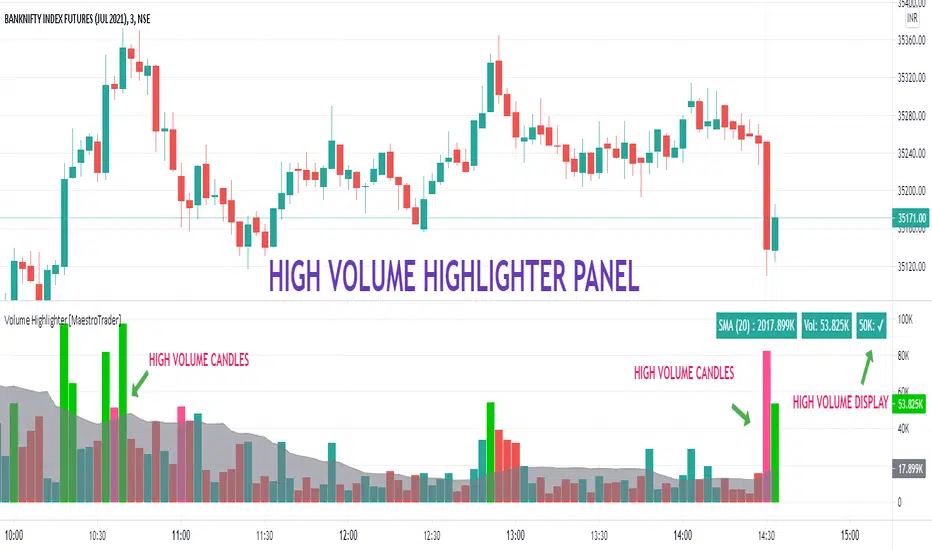
VOLUME HIGHLIGHTER PANEL (CUSTOM) [MaestroTrader]█ OVERVIEW
Volume highlighter panel provides volume insights to identify gradual increase or drop in volume or sudden volume urge that exceeds daily threshold.
It helps to determine the price behavior of the underlying Index/stock to make informed decisions while trading.
█ FEATURES
a) Displays Live SMA (20) Volume with color code. SMA Cells turns green if consecutive bar volume increases.
b) Live Volume Cell in table turns green if the volume is above average and turns red vice versa.
c) Threshold volume label appears when volume crosses the daily threshold limit.
Differences with the built-in version
This variation displays volume panel with additional volume insights for quick entry/exits.
█ SETTINGS
• Highlight Panel a) Configure Daily Volume Threshold b) configure Market session time c) Toggle highlighter on/Off d) Toggle Time on/Off (off) displays for whole period
• Volume Panel a) Configure SMA b) configure volume bar criteria c) configure Panel Display Location d) Toggle Volume Panel on/Off
█ IMPORTANT
Price always moves from trending to trading phase. Volume in Trending phase is generally high compared to volume in sideways phase. You need to identify the right volume threshold in each of the trading phases and change the settings accordingly.
█ BANKNIFTY /NIFTY VOLUME SETTINGS
BANKNIFTY - 3 MIN -50K volume
NIFTY - 3 MIN 125 K volume
Thanks to OSPL Siva for Nifty/Bank Nifty volumes. These volumes differ from trending phase & consolidation phase so adjust the threshold settings accordingly.
█ THANKS
Thanks a lot to Pine Team for this new great feature table & ‘ format. Volume ’ ! Thanks to @author=LucF, for the 'volume' logic.
█ DISCLIAMER
Indicator is built for educational purposes. Please test it thoroughly before you start using it.
You are free to use the code, please share the credit for reuse.
Hope - All these features help you get quick insights of the price movement to take the informed trades.
Happy Trading !!
Best Bulls Bears Volume trend Breakout V2 [badshah_e_alam]This is a intraday indicator. Only to be used on timeframe less than daily charts.
This indicator purely uses volume to plot the graph. The indicator helps in conforming a breakout strategy.
This indicator is advanced version of my previously developed indicator you can check this link
Total volume is made up of buying volume and selling volume . Buying volume is the number of shares, contracts, or lots that were associated with green bars, and selling volume is the number that were associated with red bars.
The labels on the right side are the current bar value and that days bulls /bears weightage.
the first value shows the current bar volume.
second value show the bulls weight in %
third value show the bears weightage throughout the day ( %)
The Blue plot in graph keeps the track of bulls movement in intraday( %)
The Red plot in graph keeps the track of bears movement in intraday ( %)
X axis is time.
Y axis ranges from 100 to -100
I use 1:2 risk to reward ratio. Do your own research.
**not a financial advice**
Example of price increasing, volume decreasing
this indicator can be used for confirming a breakout strategy with bulls or bears in action. In the current example, the buyer’s volume percentage is reducing and the price is increasing throughout the day. Hence a breakout of the trendline is confirmation of a short trade.
Example of Price reducing, volume decreasing
example of price moving down , bears losing the grip
Example of price decreasing volume increasing
Thanks to nizar9599 for giving idea to improve my previous indicator.
DISCLAIMER
Any and all liability for risks resulting from investment transactions or other asset dispositions carried out by the user based on information received or a market analysis is expressly excluded by me.
All the information made available here is generally provided to serve as an example only, without obligation and without specific recommendations for action. It does not constitute and cannot replace investment advice. We therefore recommend that you contact your personal financial advisor before carrying out specific transactions and investments.
Do your own research, This is not a financial advice.

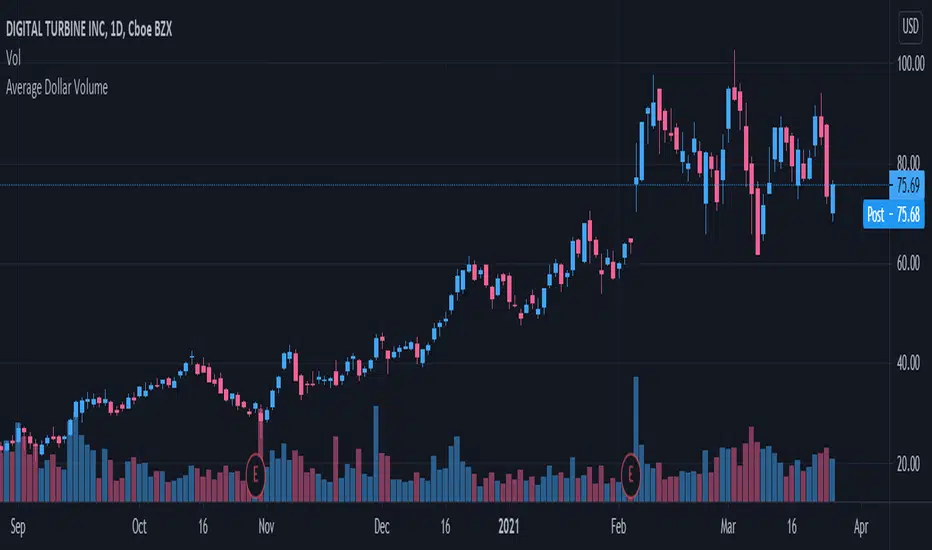
Average Dollar VolumeDollar volume is simply the volume traded multiplied times the cost of the stock.
Dollar volume is an extremely important metric for finding stocks with enough liquidity for market makers to position themselves in. Market Liquidity is defined as market's feature whereby an individual or firm can quickly purchase or sell an asset without causing a drastic change in the asset's price. The key concept you want to understand is that these big instructions with billions of dollars need liquidity in a stock in order to even think about buying it, and therefore these institutions will demand a large dollar volume. A good dollar volume amount, that represents a pretty liquid name, is typically above 100 million $ average. Why are institutions important? Simple because they are the ones who make stocks move, and I mean really move. If you want to see large growth from a stock in a short amount of time, you need institutions wielding billions of dollars to be fighting one another to buy more shares. Institutions are the ones who make or break a stock, this is why we call them market makers.
My script calculates average dollar volume using four averages: the 50, the 30, the 20, and the 10 period. I use multiple averages in order to provide the accurate and up to date information to you. It then selects the minimum of these averages and divides this value by 1 million and displays this number to you.
TL;DR? If you want monster moves from your stocks, you need to pick names with average high liquidity(dollar volume >= $100 million). The number presented to you is in millions of whatever currency the name is traded in.
Colored Volumes HistogramThis colored volumes histogram uses standard deviation from the mean to color bars.
I prefer use large Length input for more stability at mean and standard deviation values.
Uses 5 colors, by default:
Red = Volume >= 4 stdev;
Orange = 4 stdev > Volume >= 2.5 stdev;
Yellow = 2.5 stdev > Volume >= 1 stdev;
White = 1 stdev > Volume >= -0.5 stdev;
Aqua = -0.5 stdev > Volume.
I coded another script, called "Volumes on Candles". It uses the same idea, but color directly the candle.
Big Notional Volume Bubbles (Lower-TF Order Flow Approximation)Big Notional Volume Bubbles (Lower-TF Order Flow Approximation)
### Overview
This indicator visualizes large notional trading activity by scanning lower-timeframe candles inside each chart bar and highlighting periods where unusually high traded value (volume × price) occurs.
This script is intended to help short-term traders and scalpers identify bursts of aggressive activity, potential absorption zones, and areas of heightened participation, using standard OHLCV data.
Important: This indicator does not access true market order tape or DOM data. It is an approximation based on lower-timeframe OHLCV data provided by TradingView.
What the Indicator Shows
Each bubble represents a lower-timeframe candle where traded notional value exceeds a user-defined threshold.
Bubble size scales with the notional value of that candle.
Green bubbles indicate the lower-timeframe candle closed higher (buy-side pressure approximation).
Red bubbles indicate the lower-timeframe candle closed lower (sell-side pressure approximation).
Bubbles can be plotted at candle closes or wick extremes for contextual analysis.
How It Works
1. Lower-timeframe OHLCV data is requested using `request.security_lower_tf`.
2. Notional value is calculated as volume × price for each micro-candle.
3. The script selects the largest notional events per bar that exceed the minimum threshold.
4. These events are rendered as bubbles on the main price chart.
Intended Use Cases
Scalping and short-term trading
Momentum ignition and continuation analysis
Absorption and failed breakout detection
Effort versus result analysis
Confirmation at key structural levels
Recommended Settings
Lower timeframe: Start with 1 (1 minute). Seconds-based timeframes may not be supported on all feeds.
Minimum notional (USD/USDT):
BTC / ETH: 25,000 – 250,000
Mid-cap assets: 5,000 – 50,000
Adjust based on liquidity and volatility
Max bubbles per bar: 3–8 to avoid visual clutter
Limitations
This indicator does not display individual market orders or aggressor-side execution.
Buy/sell classification is inferred from candle direction, not bid/ask data.
Lower-timeframe data availability depends on the selected symbol and exchange feed.
This tool should not be used as a standalone signal generator.
Best Practices
Use in conjunction with market structure, VWAP, and key price levels.
Focus on price behavior after a bubble appears rather than the bubble itself.
Interpret bubbles as areas of interest, not directional guarantees.

Turnover (Volume * HLC/3)Let's get the elephant out of the room. Everyone knows volume is the key to validate price movement, but you can't compare two volume candles of the same stock when the price is 3 times different you need to account for that. So here it is, Turnover chart, to replace volume entirely, because why would you look at volume when you can look at turnover instead?

Cumulative Volume Profile DeltaThis indicator calculates the Cumulative Volume Profile Delta (CVPD). It constructs a high-resolution volume profile for each bar using intra-bar data, then derives and accumulates the delta from that profile to show net buying/selling pressure.
Key Features:
Statistical Volume Profile Engine: For each bar, the indicator builds a high-resolution volume profile on a lower 'Intra-Bar Timeframe'. Instead of simple tick counting, it uses statistical models ('PDF' allocation) to distribute volume across price levels and advanced classifiers ('Dynamic' split) to determine the buy/sell pressure before accumulation.
Periodic Accumulation: The CVPD accumulation is anchored to a user-defined 'Anchor Timeframe' (e.g., daily, weekly). This cyclical reset allows to analyze the build-up of pressure within specific trading periods.
"Delta Candle" Visualization: The periodic CVPD is shown as a candle, where:
Open: The CVPD value at the start of the period (or zero).
High/Low: Represent the peak buying (CVD High) and selling (CVD Low) pressure within that period's profile.
Close: The final net delta value (CVD) for the period.
Dual CVD & Divergence Engine: The indicator calculates two CVPDs: a Periodic one (for plotting) and a Continuous one (non-resetting). The continuous line is used as a stable source for the built-in divergence engine (detecting Regular, Hidden, and Exaggerated).
Dynamic Divergence Plotting: Divergence markers are plotted relative to the periodic (candle) CVPD. They automatically adjust their vertical position after a reset to remain visually aligned with the plotted candles.
Note on Confirmation (Lag): Divergence signals rely on a pivot confirmation method to ensure they do not repaint.
The Start of a- divergence is only detected after the confirming pivot is fully formed (a delay based on Pivot Right Bars).
The End of a divergence is detected either instantly (if the signal is invalidated by price action) or with a delay (when a new, non-divergent pivot is confirmed).
Multi-Timeframe (MTF) Capability:
MTF Output: The entire analysis (Delta Candles, Divergences) can be calculated on a higher timeframe (using the Timeframe input), with standard options to handle gaps (Fill Gaps) and prevent repainting (Wait for...).
Limitation: The Divergence detection engine (pivDiv) is disabled if a Higher Timeframe (HTF) is selected.
Integrated Alerts: Includes 18 comprehensive alerts for:
The start and end of all 6 divergence types.
The periodic CVPD crossing the zero line.
Conditions of agreement or disagreement between the delta and the main bar's direction.
Caution: Real-Time Data Behavior (Intra-Bar Repainting) This indicator uses high-resolution intra-bar data. As a result, the values on the current, unclosed bar (the real-time bar) will update dynamically as new intra-bar data arrives. This behavior is normal and necessary for this type of analysis. Signals should only be considered final after the main chart bar has closed.
DISCLAIMER
For Informational/Educational Use Only: This indicator is provided for informational and educational purposes only. It does not constitute financial, investment, or trading advice, nor is it a recommendation to buy or sell any asset.
Use at Your Own Risk: All trading decisions you make based on the information or signals generated by this indicator are made solely at your own risk.
No Guarantee of Performance: Past performance is not an indicator of future results. The author makes no guarantee regarding the accuracy of the signals or future profitability.
No Liability: The author shall not be held liable for any financial losses or damages incurred directly or indirectly from the use of this indicator.
Signals Are Not Recommendations: The alerts and visual signals (e.Example: crossovers) generated by this tool are not direct recommendations to buy or sell. They are technical observations for your own analysis and consideration.
