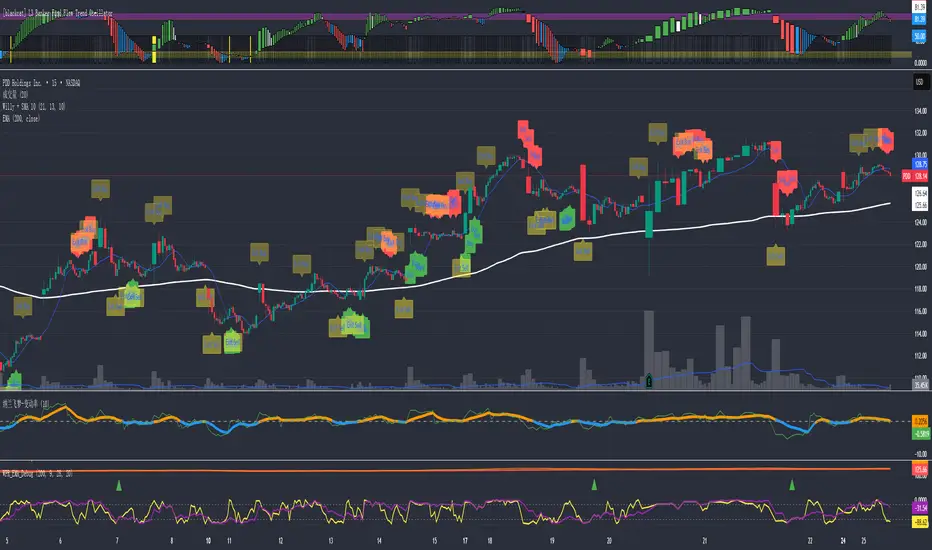
Whale Fractal Levels (V1.0)What it does
This indicator plots Fractal Levels (Bill Williams pivots) as horizontal lines and prints clean signals for:
BO+ / BO− → Breakouts through the latest fractal high/low
SW↑ / SW↓ → Liquidity sweeps (wick pierces, close rejects)
RE+ / RE− → Retests of the broken level after a confirmed breakout
Cyan = support (fractal lows).
Lilac = resistance (fractal highs).
How it works
Detects fractals with Left/Right = lr. A pivot is confirmed after lr bars on the right → the level itself doesn’t repaint.
Each confirmed fractal spawns a horizontal line extended to the right. You can limit how many lines stay on chart and auto-expire old ones.
Signals reference the most recent fractal high/low only and are edge-triggered (crossover/crossunder) with a cooldown so you don’t get a marker on every bar near the level.
A small state machine remembers the last breakout to validate the next retest.
Inputs (Settings)
Fractals
Left/Right (BW fractal) — Sensitivity of pivots (lower = more reactive, higher = cleaner).
MAX number of levels to display — Keep only the most recent N lines.
Level lifetime (bars) — Auto-delete lines after N bars to declutter.
Signals
Cooldown between signals (bars) — Minimum spacing between markers (anti-spam).
Show Breakouts (BO±) — Toggle breakout markers.
Show Sweeps (SW↑/SW↓) — Toggle sweep markers.
Show Retests (RE±) — Toggle retest markers.
Display
Show fractal lines / Line width / Line transparency (0..100)
Alerts (ready to use)
BO+ (Fractal), BO- (Fractal)
SW↑ (Fractal), SW↓ (Fractal)
RE+ (Fractal), RE- (Fractal)
Search in scripts for "williams"

Renko WPR Color ChangerChanges color when williams percent R is between 0 and -20 or when between -80 and -100. Works with renko, HA and regular candles. Can change color.

Screener based on Profitunity strategy for multiple timeframes
Screener based on Profitunity strategy by Bill Williams for multiple timeframes (max 5, including chart timeframe) and customizable symbol list. The screener analyzes the Alligator and Awesome Oscillator indicators, Divergent bars and high volume bars.
The maximum allowed number of requests (symbols and timeframes) is limited to 40 requests, for example, for 10 symbols by 4 requests of different timeframes. Therefore, the indicator automatically limits the number of displayed symbols depending on the number of timeframes for each symbol, if there are more symbols than are displayed in the screener table, then the ordinal numbers are displayed to the left of the symbols, in this case you can display the next group of symbols by increasing the value by 1 in the "Show tickers from" field, if the "Group" field is enabled, or specify the symbol number by 1 more than the last symbol in the screener table. 👀 When timeframe filtering is applied, the screener table displays only the columns of those timeframes for which the filtering value is selected, which allows displaying more symbols.
For each timeframe, in the "TIMEFRAMES > Prev" field, you can enable the display of data for the previous bar relative to the last (current) one, if the market is open for the requested symbol. In the "TIMEFRAMES > Y" field, you can enable filtering depending on the location of the last five bars relative to the Alligator indicator lines, which are designated by special symbols in the screener table:
⬆️ — if the Alligator is open upwards (Lips > Teeth > Jaw) and none of the bars is closed below the Lips line;
↗️ — if one of the bars, except for the penultimate one, is closed below Lips, or two bars, except for the last one, are closed below Lips, or the Alligator is open upwards only below four bars, but none of the bars is closed below Lips;
⬇️ — if the Alligator is open downwards (Lips < Teeth < Jaw), but none of the bars is closed above Lips;
↘️ — if one of the bars, except the penultimate one, is closed above the Lips, or two bars, except the last one, are closed above the Lips, or the Alligator is open down only above four bars, but none of the bars are closed above the Lips;
➡️ — in other cases, including when the Alligator lines intersect and one of the bars is closed behind the Lips line or two bars intersect one of the Alligator lines.
In the "TIMEFRAMES > Show bar change value for TF" field, you can add a column to the right of the selected timeframe column with the percentage change between the closing price of the last bar (current) and the closing price of the previous bar ((close – previous close) / previous close * 100). Depending on the percentage value, the background color of the screener table cell will change: dark red if <= -3%; red if <= -2%, light red if <= -0.5%; dark green if >= 3%; green if >= 2%; light green if >= 0.5%.
For each timeframe, the screener table displays the symbol of the latest (current) bar, depending on the closing price relative to the bar's midpoint ((high + low) / 2) and its location relative to the Alligator indicator lines: ⎾ — the bar's closing price is above its midpoint; ⎿ — the bar's closing price is below its midpoint; ├ — the bar's closing price is equal to its midpoint; 🟢 — Bullish Divergent bar, i.e. the bar's closing price is above its midpoint, the bar's high is below all Alligator lines, the bar's low is below the previous bar's low; 🔴 — Bearish Divergent bar, i.e. the bar's closing price is below its midpoint, the bar's low is above all Alligator lines, the bar's high is above the previous bar's high. When filtering is enabled in the "TIMEFRAMES > Filtering by Divergent bar" field, the data in the screener table cells will be displayed only for those timeframes that have a Divergent bar. A high bar volume signal is also displayed — 📶/📶² if the bar volume is greater than 40%/70% of the average volume value calculated using a simple moving average (SMA) in the 140 bar interval from the last bar.
In the indicator settings in the "SYMBOL LIST" field, each ticker (for example: OANDA:SPX500USD) must be on a separate line. If the market is closed, then the data for requested symbols will be limited to the time of the last (current) bar on the chart, for example, if the current symbol was traded yesterday, and the requested symbol is traded today, when requesting data for an hourly timeframe, the last bar will be for yesterday, if the timeframe of the current chart is not higher than 1 day. Therefore, by default, a warning will be displayed on the chart instead of the screener table that if the market is open, you must wait for the screener to load (after the first price change on the current chart), or if the highest timeframe in the screener is 1 day, you will be prompted to change the timeframe on the current chart to 1 week, if the screener requests data for the timeframe of 1 week, you will be prompted to change the timeframe on the current chart to 1 month, or switch to another symbol on the current chart for which the market is open (for example: BINANCE:BTCUSDT), or disable the warning in the field "SYMBOL LIST > Do not display screener if market is close".
The number of the last columns with the color of the AO indicator that will be displayed in the screener table for each timeframe is specified in the indicator settings in the "AWESOME OSCILLATOR > Number of columns" field.
For each timeframe, the direction of the trend between the price of the highest and lowest bars in the specified range of bars from the last bar is displayed — ↑ if the trend is up (the highest bar is to the right of the lowest), or ↓ if the trend is down (the lowest bar is to the right of the highest). If there is a divergence on the AO indicator in the specified interval, the symbol ∇ is also displayed. The average volume value is also calculated in the specified interval using a simple moving average (SMA). The number of bars is set in the indicator settings in the "INTERVAL FOR HIGHEST AND LOWEST BARS > Bars count" field.
In the indicator settings in the "STYLE" field you can change the position of the screener table relative to the chart window, the background color, the color and size of the text.
***
Скринер на основе стратегии Profitunity Билла Вильямса для нескольких таймфреймов (максимум 5, включая таймфрейм графика) и настраиваемого списка символов. Скринер анализирует индикаторы Alligator и Awesome Oscillator, Дивергентные бары и бары с высоким объемом.
Максимально допустимое количество запросов (символы и таймфреймы) ограничено 40 запросами, например, для 10 символов по 4 запроса разных таймфреймов. Поэтому в индикаторе автоматически ограничивается количество отображаемых символов в зависимости от количества таймфреймов для каждого символа, если символов больше чем отображено в таблице скринера, то слева от символов отображаются порядковые номера, в таком случае можно отобразить следующую группу символов, увеличив значение на 1 в настройках индикатора поле "Show tickers from", если включено поле "Group", или указать номер символа на 1 больше, чем последний символ в таблице скринера. 👀 Когда применяется фильтрация по таймфрейму, в таблице скринера отображаются только столбцы тех таймфреймов, для которых выбрано значение фильтрации, что позволяет отображать большее количество символов.
Для каждого таймфрейма в настройках индикатора в поле "TIMEFRAMES > Prev" можно включить отображение данных для предыдущего бара относительно последнего (текущего), если для запрашиваемого символа рынок открыт. В поле "TIMEFRAMES > Y" можно включить фильтрацию, в зависимости от расположения последних пяти баров относительно линий индикатора Alligator, которые обозначаются специальными символами в таблице скринера:
⬆️ — если Alligator открыт вверх (Lips > Teeth > Jaw) и ни один из баров не закрыт ниже линии Lips;
↗️ — если один из баров, кроме предпоследнего, закрыт ниже Lips, или два бара, кроме последнего, закрыты ниже Lips, или Alligator открыт вверх только ниже четырех баров, но ни один из баров не закрыт ниже Lips;
⬇️ — если Alligator открыт вниз (Lips < Teeth < Jaw), но ни один из баров не закрыт выше Lips;
↘️ — если один из баров, кроме предпоследнего, закрыт выше Lips, или два бара, кроме последнего, закрыты выше Lips, или Alligator открыт вниз только выше четырех баров, но ни один из баров не закрыт выше Lips;
➡️ — в остальных случаях, в то числе когда линии Alligator пересекаются и один из баров закрыт за линией Lips или два бара пересекают одну из линий Alligator.
В поле "TIMEFRAMES > Show bar change value for TF" можно добавить справа от выбранного столбца таймфрейма столбец с процентным изменением между ценой закрытия последнего бара (текущего) и ценой закрытия предыдущего бара ((close – previous close) / previous close * 100). В зависимости от величины процента будет меняться цвет фона ячейки таблицы скринера: темно-красный, если <= -3%; красный, если <= -2%, светло-красный, если <= -0.5%; темно-зеленый, если >= 3%; зеленый, если >= 2%; светло-зеленый, если >= 0.5%.
Для каждого таймфрейма в таблице скринера отображается символ последнего (текущего) бара, в зависимости от цены закрытия относительно середины бара ((high + low) / 2) и расположения относительно линий индикатора Alligator: ⎾ — цена закрытия бара выше его середины; ⎿ — цена закрытия бара ниже его середины; ├ — цена закрытия бара равна его середине; 🟢 — Бычий Дивергентный бар, т.е. цена закрытия бара выше его середины, максимум бара ниже всех линий Alligator, минимум бара ниже минимума предыдущего бара; 🔴 — Медвежий Дивергентный бар, т.е. цена закрытия бара ниже его середины, минимум бара выше всех линий Alligator, максимум бара выше максимума предыдущего бара. При включении фильтрации в поле "TIMEFRAMES > Filtering by Divergent bar" данные в ячейках таблицы скринера будут отображаться только для тех таймфреймов, где есть Дивергентный бар. Также отображается сигнал высокого объема бара — 📶/📶², если объем бара больше чем на 40%/70% среднего значения объема, рассчитанного с помощью простой скользящей средней (SMA) в интервале 140 баров от последнего бара.
В настройках индикатора в поле "SYMBOL LIST" каждый тикер (например: OANDA:SPX500USD) должен быть на отдельной строке. Если рынок закрыт, то данные для запрашиваемых символов будут ограничены временем последнего (текущего) бара на графике, например, если текущий символ торговался последний день вчера, а запрашиваемый символ торгуется сегодня, при запросе данных для часового таймфрейма, последний бар будет за вчерашний день, если таймфрейм текущего графика не выше 1 дня. Поэтому по умолчанию на графике будет отображаться предупреждение вместо таблицы скринера о том, что если рынок открыт, то необходимо дождаться загрузки скринера (после первого изменения цены на текущем графике), или если в скринере самый высокий таймфрейм 1 день, то будет предложено изменить на текущем графике таймфрейм на 1 неделю, если в скринере запрашиваются данные для таймфрейма 1 неделя, то будет предложено изменить на текущем графике таймфрейм на 1 месяц, или же переключиться на другой символ на текущем графике, для которого рынок открыт (например: BINANCE:BTCUSDT), или отключить предупреждение в поле "SYMBOL LIST > Do not display screener if market is close".
Количество последних столбцов с цветом индикатора AO, которые будут отображены в таблице скринера для каждого таймфрейма, указывается в настройках индикатора в поле "AWESOME OSCILLATOR > Number of columns".
Для каждого таймфрейма отображается направление тренда между ценой самого высокого и самого низкого баров в указанном интервале баров от последнего бара — ↑, если тренд направлен вверх (самый высокий бар справа от самого низкого), или ↓, если тренд направлен вниз (самый низкий бар справа от самого высокого). Если есть дивергенция на индикаторе AO в указанном интервале, то также отображается символ — ∇. В указанном интервале также рассчитывается среднее значение объема с помощью простой скользящей средней (SMA). Количество баров устанавливается в настройках индикатора в поле "INTERVAL FOR HIGHEST AND LOWEST BARS > Bars count".
В настройках индикатора в поле "STYLE" можно изменить положение таблицы скринера относительно окна графика, цвет фона, цвет и размер текста.

Fractal Suite: MTF Fractals + BOS/CHOCH + OB + FVG + Targets Kese Way
Fractals (Multi-Timeframe): Automatically detects both current-timeframe and higher-timeframe Bill Williams fractals, with customizable left/right bar settings.
Break of Structure (BOS) & CHoCH: Marks structural breaks and changes of character in real time.
Liquidity Sweeps: Identifies sweep patterns where price takes out a previous swing high/low but closes back within range.
Order Blocks (OB): Highlights the last opposite candle before a BOS, with customizable extension bars.
Fair Value Gaps (FVG): Finds 3-bar inefficiencies with a minimum size filter.
Confluence Zones: Optionally require OB–FVG overlap for high-probability setups.
Entry, Stop, and Targets: Automatically calculates entry price, stop loss, and up to three take-profit targets based on risk-reward ratios.
Visual Dashboard: Mini on-chart table summarizing structure, last swing points, and settings.
Alerts: Set alerts for new fractals, BOS events, and confluence-based trade setups.

SCTI V30Description
The SCTI V30 is an advanced multi-functional technical analysis indicator for TradingView that combines multiple analytical approaches into a single comprehensive tool. This indicator provides:
Multiple Moving Average Types (EMA, SMA, PMA with various calculation methods)
Customizable VWAP with standard deviation bands
Sophisticated Divergence Detection across 12 different indicators
Volume Profile Analysis with peak/trough detection
Highly Configurable Display Options
The indicator is designed to help traders identify trends, potential reversals, and key support/resistance levels across different timeframes.
Features
1. Moving Average Systems
EMA Section: 13 configurable EMA periods (8, 13, 21, 34, 55, 89, 144, 233, 377, 610, 987, 1597, 2584)
SMA Section: 13 configurable SMA periods (same as EMA)
PMA Section: 11 customizable moving averages with multiple calculation methods:
ALMA, EMA, RMA, SMA, SWMA, VWAP, VWMA, WMA
Adjustable lengths from 12 to 1056
Customizable colors, widths, and fill options between MAs
2. VWAP Implementation
Multiple anchor periods (Session, Week, Month, Quarter, Year, etc.)
Standard deviation or percentage-based bands
Option to hide on daily/weekly/monthly timeframes
Customizable band multipliers (1.0, 2.0, 3.0)
3. Divergence Detection
Detects regular and hidden divergences across 12 indicators:
MACD, MACD Histogram, RSI, Stochastic, CCI, Momentum
OBV, VW-MACD, Chaikin Money Flow, Money Flow Index
Williams %R, and custom external indicators
Customizable detection parameters:
Pivot point period (1-50)
Source (Close or High/Low)
Divergence type (Regular, Hidden, or Both)
Minimum number of divergences required (1-11)
Maximum pivot points to check (1-20)
Maximum bars to look back (30-200)
4. Volume Profile Analysis
Configurable profile length (10-5000 bars)
Value Area threshold (0-100%)
Profile placement (Left or Right)
Number of rows (30-130)
Profile width adjustment
Volume node detection:
Peaks (with cluster option)
Troughs (with cluster option)
Highest/Lowest volume nodes
Customizable colors for all elements
Input Parameters
The indicator is organized into 7 parameter groups:
Basic Indicator Settings - Toggle visibility of main components
EMA Settings - Configure 13 EMA periods and visibility
SMA Settings - Configure 13 SMA periods and visibility
PMA Settings - Advanced moving average configuration
VWAP Settings - Volume-weighted average price configuration
Divergence Settings - Comprehensive divergence detection options
Volume Profile & Node Detection - Volume analysis configuration
How to Use
Trend Identification: Use the multiple moving averages to identify trend direction and strength. The Fibonacci-based periods (21, 34, 55, 89, 144, etc.) are particularly useful for this.
Support/Resistance: The VWAP and volume profile components help identify key support/resistance levels.
Divergence Trading: Look for divergences between price and the various indicators to spot potential reversal points.
Volume Analysis: The volume profile shows where the most trading activity occurred, highlighting important price levels.
Customization: Adjust the settings to match your trading style and timeframe. The indicator is highly configurable to suit different trading approaches.
Alerts
The indicator includes alert conditions for:
Positive regular divergence detected
Negative regular divergence detected
Positive hidden divergence detected
Negative hidden divergence detected
Any positive divergence (regular or hidden)
Any negative divergence (regular or hidden)
Notes
The indicator may be resource-intensive due to its comprehensive calculations, especially on lower timeframes with long lookback periods.
Some features (like VWAP) can be hidden on higher timeframes to improve performance.
The default settings are optimized for daily charts but can be adjusted for any timeframe.
This powerful all-in-one indicator provides traders with a complete toolkit for technical analysis, combining trend-following, momentum, volume, and divergence techniques into a single, customizable solution.

Reversal Radar
**Reversal Radar - Multi-Indicator Confirmation System**
This script combines five proven technical analysis methods into a unified reversal signal, reducing false signals through multi-indicator confirmation.
**INDICATORS USED:**
1. ADX/Directional Movement System
Determines trend direction via +DI and -DI comparison. Signal only during downtrend condition (DI- > DI+). Filters out sideways markets.
2. Custom Linear Regression Momentum
Proprietary momentum calculation based on linear regression. Measures price deviation from Keltner Channel midline. Signal on negative but rising momentum (beginning trend reversal).
3. Williams VIX Fix (WVF)
Identifies panic-selling phases. Calculates relative distance to recent high. Signal when exceeding Bollinger Bands or historical percentiles.
4. RSI Oversold Filter
Default RSI < 35 (adjustable 30-40). Filters only oversold zones for reversal setups.
5. MACD Confirmation
Signal only when MACD below zero line and below signal line. Confirms ongoing weakness before potential reversal.
**FUNCTIONALITY:**
The system generates a BUY signal only when ALL activated filters are simultaneously met. Each indicator can be individually enabled/disabled. Flexible parameter adjustment for different markets/timeframes. Reduces false signals through multi-confirmation.
**APPLICATION:**
Suitable for swing trading on higher timeframes (4H, Daily), reversal strategies in oversold markets, and combination with additional confirmation indicators.
Setup: Activate desired filters, adjust parameters to market/timeframe, check BUY signal as entry opportunity. Additional confirmation through volume/support recommended.
**INNOVATION:**
The Custom Linear Regression Momentum is a proprietary development combining Keltner Channel logic with linear regression for more precise momentum detection than standard oscillators.
**DISCLAIMER:**
This tool serves as technical analysis support. No signal should be traded without additional confirmation and risk management.

SCTI V28Indicator Overview | 指标概述
English: SCTI V28 (Smart Composite Technical Indicator) is a multi-functional composite technical analysis tool that integrates various classic technical analysis methods. It contains 7 core modules that can be flexibly configured to show or hide components based on traders' needs, suitable for various trading styles and market conditions.
中文: SCTI V28 (智能复合技术指标) 是一款多功能复合型技术分析指标,整合了多种经典技术分析工具于一体。该指标包含7大核心模块,可根据交易者的需求灵活配置显示或隐藏各个组件,适用于多种交易风格和市场环境。
Main Functional Modules | 主要功能模块
1. Basic Indicator Settings | 基础指标设置
English:
EMA Display: 13 configurable EMA lines (default shows 8/13/21/34/55/144/233/377/610/987/1597/2584 periods)
PMA Display: 11 configurable moving averages with multiple MA types (ALMA/EMA/RMA/SMA/SWMA/VWAP/VWMA/WMA)
VWAP Display: Volume Weighted Average Price indicator
Divergence Indicator: Detects divergences across 12 technical indicators
ATR Stop Loss: ATR-based stop loss lines
Volume SuperTrend AI: AI-powered super trend indicator
中文:
EMA显示:13条可配置EMA均线,默认显示8/13/21/34/55/144/233/377/610/987/1597/2584周期
PMA显示:11条可配置移动平均线,支持多种MA类型(ALMA/EMA/RMA/SMA/SWMA/VWAP/VWMA/WMA)
VWAP显示:成交量加权平均价指标
背离指标:12种技术指标的背离检测系统
ATR止损:基于ATR的止损线
Volume SuperTrend AI:基于AI预测的超级趋势指标
2. EMA Settings | EMA设置
English:
13 independent EMA lines, each configurable for visibility and period length
Default shows 21/34/55/144/233/377/610/987/1597/2584 period EMAs
Customizable colors and line widths for each EMA
中文:
13条独立EMA均线,每条均可单独配置显示/隐藏和周期长度
默认显示21/34/55/144/233/377/610/987/1597/2584周期的EMA
每条EMA可设置不同颜色和线宽
3. PMA Settings | PMA设置
English:
11 configurable moving averages, each with:
Selectable types (default EMA, options: ALMA/RMA/SMA/SWMA/VWAP/VWMA/WMA)
Independent period settings (12-1056)
Special ALMA parameters (offset and sigma)
Configurable data source and plot offset
Support for fill areas between MAs
Price lines and labels can be added
中文:
11条可配置移动平均线,每条均可:
选择不同类型(默认EMA,可选ALMA/RMA/SMA/SWMA/VWAP/VWMA/WMA)
独立设置周期长度(12-1056)
设置ALMA的特殊参数(偏移量和sigma)
配置数据源和绘图偏移
支持MA之间的填充区域显示
可添加价格线和标签
4. VWAP Settings | VWAP设置
English:
Multiple anchor period options (Session/Week/Month/Quarter/Year/Decade/Century/Earnings/Dividends/Splits)
3 configurable standard deviation bands
Option to hide on daily and higher timeframes
Configurable data source and offset settings
中文:
多种锚定周期选择(会话/周/月/季/年/十年/世纪/财报/股息/拆股)
3条可配置标准差带
可选择在日线及以上周期隐藏
支持数据源选择和偏移设置
5. Divergence Indicator Settings | 背离指标设置
English:
12 detectable indicators: MACD, MACD Histogram, RSI, Stochastic, CCI, Momentum, OBV, VWmacd, Chaikin Money Flow, MFI, Williams %R, External Indicator
4 divergence types: Regular Bullish/Bearish, Hidden Bullish/Bearish
Multiple display options: Full name/First letter/Hide indicator name
Configurable parameters: Pivot period, data source, maximum bars checked, etc.
Alert functions: Independent alerts for each divergence type
中文:
检测12种指标:MACD、MACD柱状图、RSI、随机指标、CCI、动量、OBV、VWmacd、Chaikin资金流、MFI、威廉姆斯%R、外部指标
4种背离类型:正/负常规背离,正/负隐藏背离
多种显示选项:完整名称/首字母/不显示指标名称
可配置参数:枢轴点周期、数据源、最大检查柱数等
警报功能:各类背离的独立警报
6. ATR Stop Loss Settings | ATR止损设置
English:
Configurable ATR length (default 13)
4 smoothing methods (RMA/SMA/EMA/WMA)
Adjustable multiplier (default 1.618)
Displays long and short stop loss lines
中文:
可配置ATR长度(默认13)
4种平滑方法(RMA/SMA/EMA/WMA)
可调乘数(默认1.618)
显示多头和空头止损线
7. Volume SuperTrend AI Settings | Volume SuperTrend AI设置
English:
AI Prediction:
Configurable neighbors (1-100) and data points (1-100)
Price trend length and prediction trend length settings
SuperTrend Parameters:
Length (default 3)
Factor (default 1.515)
5 MA source options (SMA/EMA/WMA/RMA/VWMA)
Signal Display:
Trend start signals (circle markers)
Trend confirmation signals (triangle markers)
6 Alerts: Various trend start and confirmation signals
中文:
AI预测功能:
可配置邻居数(1-100)和数据点数(1-100)
价格趋势长度和预测趋势长度设置
SuperTrend参数:
长度(默认3)
因子(默认1.515)
5种MA源选择(SMA/EMA/WMA/RMA/VWMA)
信号显示:
趋势开始信号(圆形标记)
趋势确认信号(三角形标记)
6种警报:各类趋势开始和确认信号
Usage Recommendations | 使用建议
English:
Trend Analysis: Use EMA/PMA combinations to determine market trends, with long-period EMAs (e.g., 144/233) as primary trend references
Divergence Trading: Look for potential reversals using price-indicator divergences
Stop Loss Management: Use ATR stop loss lines for risk management
AI Assistance: Volume SuperTrend AI provides machine learning-based trend predictions
Multiple Timeframes: Verify signals across different timeframes
中文:
趋势分析:使用EMA/PMA组合判断市场趋势,长周期EMA(如144/233)作为主要趋势参考
背离交易:结合价格与指标的背离寻找潜在反转点
止损设置:利用ATR止损线管理风险
AI辅助:Volume SuperTrend AI提供基于机器学习的趋势预测
多时间框架:建议在不同时间框架下验证信号
Parameter Configuration Tips | 参数配置技巧
English:
For short-term trading: Focus on 8-55 period EMAs and shorter divergence detection periods
For long-term investing: Use 144-2584 period EMAs with longer detection parameters
In ranging markets: Disable some EMAs, mainly rely on VWAP and divergence indicators
In trending markets: Enable more EMAs and SuperTrend AI
中文:
对于短线交易:可重点关注8-55周期的EMA和较短的背离检测周期
对于长线投资:建议使用144-2584周期的EMA和较长的检测参数
在震荡市:可关闭部分EMA,主要依靠VWAP和背离指标
在趋势市:可启用更多EMA和SuperTrend AI
Update Log | 更新日志
English:
V28 main updates:
Added Volume SuperTrend AI module
Optimized divergence detection algorithm
Added more EMA period options
Improved UI and parameter grouping
中文:
V28版本主要更新:
新增Volume SuperTrend AI模块
优化背离检测算法
增加更多EMA周期选项
改进用户界面和参数分组
Final Note | 最后说明
English: This indicator is suitable for technical traders with some experience. We recommend practicing with demo trading to familiarize yourself with all features before live trading.
中文: 该指标适合有一定经验的技术分析交易者使用,建议先通过模拟交易熟悉各项功能后再应用于实盘。

Briese CoT Movement IndexThis Briese CoT (Commitments of Traders) Movement Index histogram indicator was built based on the formula by Stephen Briese in his book "The Commitments of Traders Bible":
"...difference between the COT Index and its reading of one or several weeks prior. I use six." —Chapter 7, page 75.
The code is a bit of a remix of the "ICT Commitment of Traders°" indicator by toodegrees and is meant for use in a new pane below a Weekly Chart .
The upper and lower thresholds are +40/-40. Some context: "A ± 40 point surge in the COT Index within a six-week period frequently marks the end of a counter-trend price reaction"
40 Point CoT Surge Rules (Commercials) from page 76
"During a correction from a prevailing uptrend, a +40 point movement in the CoT Index within a six-week period often marks the end of a corrective pullback, and the resumption of the major uptrend."
"During a reaction in a prevailing downtrend, a -40 point movement in the CoT Index within a six-week period frequently marks the end of a price reaction, and the resumption of the established downtrend."
"The failure of a ± point CoT Movement Index signal to restart the prevailing trend is a tip-off to a major trend change"
I'd recommend reading Briese's book for examples on how to properly interpret this indictor.
This indicator can be used in conjunction with another one I've published called the "Williams x Briese Hybrid CoT Index" which can be found on my scripts page.

WVAD with Gap Compensation**Indicator Name:** WVAD with Gap Compensation
**Purpose:** Enhances the classic Williams Vix Fix (WVAD) by incorporating the impact of price gaps (jump ups/downs) in its calculation.
**Key Features:**
1. **Gap Detection:** Automatically identifies significant gaps (default: >0.5% from prior bar's high/low).
2. **Gap Compensation:** Adjusts the WVAD calculation by adding the gap size to the daily price change.
3. **Dynamic Weighting:** Applies a multiplier (1.2x or 1.5x) to the WVAD value on days with medium/large gaps (based on ATR).
4. **Visualization:**
- Plots the enhanced WVAD line (blue) and optionally the original WVAD (gray circles).
- Marks gap events with colored arrows (green ▲ for gap up, red ▼ for gap down) and connects the gap's impact with dashed lines.
- Includes a zero line for reference.
**Use Cases:**
- Gauges the true strength of money flow by accounting for gaps.
- Identifies potential trend shifts around gap events.
- Filters noise by focusing on significant gaps.
**Parameters:**
- `Accumulation Period`: Number of days to sum WVAD (default: 12).
- `Gap Threshold (%)`: Minimum gap size to trigger compensation (default: 0.5%).
- `Show Original WVAD`: Toggles display of the classic WVAD.
**Version:** Pine Script® v6

Cycle Composite 3.6 WeightedThe Cycle Composite is a multi-factor market cycle model designed to classify long-term market behavior into distinct phases using normalized and weighted data inputs.
It combines ten key on-chain, dominance, volatility, sentiment, and trend-following metrics into a single composite output. The goal is to provide a clearer understanding of where the market may stand in the broader cycle (e.g., accumulation, early bull, late bull, or euphoria).
This version (3.4) introduces flexible weighting, trend strength markers, and additional context-aware signals such as risk-on confirmations and altseason flags.
Phases Identified:
The model categorizes the market into one of five zones:
Euphoria (> 85)
Late Bull (70 – 85)
Mid Bull (50 – 70)
Early Bull (30 – 50)
Fear (< 30)
Each phase is determined by a smoothed EMA of the weighted composite score.
Data Sources and Metrics Used (10 total):
BTC Dominance (CRYPTOCAP:BTC.D)
Stablecoin Dominance (USDT + USDC average) (inverted for risk-on)
ETH Dominance (CRYPTOCAP:ETH.D)
BBWP (normalized Bollinger Band Width % over 1-year window)
WVF (Williams VIX Fix for volatility spike detection)
NUPL (Net Unrealized Profit/Loss, external source)
CMF (Chaikin Money Flow, smoothed volume accumulation)
CEX Open Interest (custom input from DAO / external source)
Whale Inflows (custom input from whale exchange transfer data)
Google Trends Average (BTC, Crypto, Altcoin terms)
All inputs are normalized over a 200-bar window and combined via weighted averaging, where each weight is user-configurable.
Additional Features:
Phase Labels: Labels are printed only when a new phase is entered.
Bull Continuation Marker: Triangle up when composite makes higher highs and NUPL increases.
Weakening Marker: Triangle down when composite rolls over in Late Bull and NUPL falls.
Risk-On Signal: Green circle appears when CMF and Google Trends are both rising.
Altseason Flag: Orange diamond appears when dominance of "others.d" exceeds BTC.D and ETH.D and composite is above 50.
Background Shading: Each phase is shaded with a semi-transparent background color.
Timeframe-Aware Display: All markers and signals are shown only on weekly timeframe for clarity.
Intended Use:
This script is intended for educational and macro-trend analysis purposes.
It can be used to:
Identify macro cycle position (accumulation, bull phases, euphoria, etc.)
Spot long-term trend continuation or weakening signals
Add context to price action with external on-chain and sentiment data
Time rotation events such as altseason risk
Disclaimer:
This script does not constitute financial advice.
It is intended for informational and research purposes only.
Users should conduct their own due diligence and analysis before making investment decisions.

Vix_Fix Enhanced MTF [Cometreon]The VIX Fix Enhanced is designed to detect market bottoms and spikes in volatility, helping traders anticipate major reversals with precision. Unlike standard VIX Fix tools, this version allows you to control the standard deviation logic, switch between chart styles, customize visual outputs, and set up advanced alerts — all with no repainting.
🧠 Logic and Calculation
This indicator is based on Larry Williams' VIX Fix and integrates features derived from community requests/advice, such as inverse VIX logic.
It calculates volatility spikes using a customizable standard deviation of the lows and compares it to a moving high to identify potential reversal points.
All moving average logic is based on Cometreon's proprietary library, ensuring accurate and optimized calculations on all 15 moving average types.
🔷 New Features and Improvements
🟩 Custom Visual Styles
Choose how you want your VIX data displayed:
Line
Step Line
Histogram
Area
Column
You can also flip the orientation (bottom-up or top-down), change the source ticker, and tailor the display to match your charting preferences.
🟩 Multi-MA Standard Deviation Calculation
Customize the standard deviation formula by selecting from 15 different moving averages:
SMA (Simple Moving Average)
EMA (Exponential Moving Average)
WMA (Weighted Moving Average)
RMA (Smoothed Moving Average)
HMA (Hull Moving Average)
JMA (Jurik Moving Average)
DEMA (Double Exponential Moving Average)
TEMA (Triple Exponential Moving Average)
LSMA (Least Squares Moving Average)
VWMA (Volume-Weighted Moving Average)
SMMA (Smoothed Moving Average)
KAMA (Kaufman’s Adaptive Moving Average)
ALMA (Arnaud Legoux Moving Average)
FRAMA (Fractal Adaptive Moving Average)
VIDYA (Variable Index Dynamic Average)
This gives you fine control over how volatility is measured and allows tuning the sensitivity for different market conditions.
🟩 Full Control Over Percentile and Deviation Conditions
You can enable or disable lines for standard deviation and percentile conditions, and define whether you want to trigger on over or under levels — adapting the indicator to your exact logic and style.
🟩 Chart Type Selection
You're no longer limited to candlestick charts! Now you can use Vix_Fix with different chart formats, including:
Candlestick
Heikin Ashi
Renko
Kagi
Line Break
Point & Figure
🟩 Multi-Timeframe Compatibility Without Repainting
Use a different timeframe from your chart with confidence. Signals remain stable and do not repaint. Perfect for spotting long-term reversal setups on lower timeframes.
🟩 Alert System Ready
Configure alerts directly from the indicator’s panel when conditions for over/under signals are met. Stay informed without needing to monitor the chart constantly.
🔷 Technical Details and Customizable Inputs
This indicator includes full control over the logic and appearance:
1️⃣ Length Deviation High - Adjusts the lookback period used to calculate the high deviation level of the VIX logic. Shorter values make it more reactive; longer values smooth out the signal.
2️⃣ Ticker - Choose a different chart type for the calculation, including Heikin Ashi, Renko, Kagi, Line Break, and Point & Figure.
3️⃣ Style VIX - Change the visual style (Line, Histogram, Column, etc.), adjust line width, and optionally invert the display (bottom-to-top).
📌 Fill zones for deviation and percentile are active only in Line and Step Line modes
4️⃣ Use Standard Deviation Up / Down - Enable the overbought and oversold zone logic based on upper and lower standard deviation bands.
5️⃣ Different Type MA (for StdDev) - Choose from 15 different moving averages to define the calculation method for standard deviation (SMA, EMA, HMA, JMA, etc.), with dedicated parameters like Phase, Sigma, and Offset for optimized responsiveness.
6️⃣ BB Length & Multiplier - Adjust the period and multiplier for the standard deviation bands, similar to how Bollinger Bands work.
7️⃣ Show StdDev Up / Down Line - Enable or disable the visibility of upper and lower standard deviation boundaries.
8️⃣ Use Percentile & Length High - Activate the percentile-based logic to detect extreme values in historical volatility using a customizable lookback length.
9️⃣ Highest % / Lowest % - Set the high and low percentile thresholds (e.g., 85 for high, 99 for low) that will be used to trigger over/under signals.
🔟 Show High / Low Percentile Line - Toggle the visual display of the percentile boundaries directly on the chart for clearer signal reference.
1️⃣1️⃣ Ticker Settings – Customize parameters for special chart types such as Renko, Heikin Ashi, Kagi, Line Break, and Point & Figure, adjusting reversal, number of lines, ATR length, etc.
1️⃣2️⃣ Timeframe – Enables using SuperTrend on a higher timeframe.
1️⃣3️⃣ Wait for Timeframe Closes -
✅ Enabled – Displays Vix_Fix smoothly with interruptions.
❌ Disabled – Displays Vix_Fix smoothly without interruptions.
☄️ If you find this indicator useful, leave a Boost to support its development!
Every feedback helps to continuously improve the tool, offering an even more effective trading experience. Share your thoughts in the comments! 🚀🔥

Stochastics + VixFix Buy/Sell SignalsThis script is designed for long-term investors using ETFs on a weekly timeframe, where catching high-probability bottoms is the goal. It combines the Stochastic Oscillator with the Williams VixFix to identify moments of extreme fear and potential reversals.
A Buy signal is triggered when:
Stochastic %K drops below 20
VixFix forms a green spike (suggesting a panic-driven market flush)
A Sell signal is triggered when:
Stochastic %K rises above 90
VixFix falls below 5 (indicating excessive complacency)
Catching tops is much harder than catching bottoms.
These Sell signals are not designed to fully exit positions. Instead, they suggest trimming a small portion of ETF holdings — simply to free up liquidity for future opportunities.
This strategy is ideal for:
Long-term ETF investors
Weekly charts
Systematic decision-making in volatile markets
Use in conjunction with macro indicators, sector rotation, and valuation frameworks for best results.

Pro Scalper AI [BullByte]The Pro Scalper AI is a powerful, multi-faceted scalping indicator designed to assist active traders in identifying short-term trading opportunities with precision. By combining trend analysis, momentum indicators, dynamic weighting, and optional AI forecasting, this tool provides both immediate and latched trading signals based on confirmed (closed bar) data—helping to avoid repainting issues. Its flexible design includes customizable filters such as a higher timeframe trend filter, and adjustable settings for ADX, ATR, and Hull Moving Average (HMA), giving traders the ability to fine-tune the strategy to different markets and timeframes.
Key Features :
- Confirmed Data Processing :
Utilizes a helper function to lock in price and volume data only from confirmed (closed) bars, ensuring the reliability of signals without the risk of intrabar repainting.
- Trend Analysis :
Employs ADX and Directional Movement (DI) calculations along with a locally computed HMA to detect short-term trends. An optional higher timeframe trend filter can further refine the analysis.
- Flexible Momentum Modes :
Choose between three momentum calculation methods—Stochastic RSI, Fisher RSI, or Williams %R—to match your preferred style of analysis. This versatility allows you to optimize the indicator for different market conditions.
- Dynamic Weighting & Volatility Adjustments :
Adjusts the contribution of trend, momentum, volatility, and volume through dynamic weighting. This ensures that the indicator responds appropriately to varying market conditions by scaling its sensitivity with user-defined maximum factors.
- Optional AI Forecast :
For those who want an extra edge, the built-in AI forecasting module uses linear regression to predict future price moves and adjusts oscillator thresholds accordingly. This feature can be toggled on or off, with smoothing options available for more stable output.
- Latching Mode for Signal Persistenc e:
The script features a latching mechanism that holds signals until a clear reversal is detected, preventing whipsaws and providing more reliable trade entries and exits.
- Comprehensive Visualizations & Dashboard :
- Composite Oscillator & Dynamic Thresholds : The oscillator is plotted with dynamic upper and lower thresholds, and the area between them is filled with a color that reflects the active trading signal (e.g., Strong Buy, Early Sell).
- Signal Markers : Both immediate (non-latching) and stored (latched) signals are marked on the chart with distinct shapes (circles, crosses, triangles, and diamonds) to differentiate between signal types.
- Real-Time Dashboard : A customizable dashboard table displays key metrics including ADX, oscillator value, chosen momentum mode, HMA trend, higher timeframe trend, volume factor, AI bias (if enabled), and more, allowing traders to quickly assess market conditions at a glance.
How to Use :
1. S ignal Interpretation :
- Immediate Signals : For traders who prefer quick entries, the indicator displays immediate signals such as “Strong Buy” or “Early Sell” based on the current market snapshot.
- Latched Signals : When latching is enabled, the indicator holds a signal state until a clear reversal is confirmed, offering sustained trade setups.
2. Trend Confirmation :
- Use the HMA trend indicator and the optional higher timeframe trend filter to confirm the prevailing market direction before acting on signals.
3. Dynamic Thresholds & AI Forecasting :
- Monitor the dynamically adjusted oscillator thresholds and, if enabled, the AI bias to gauge potential shifts in market momentum.
4. Risk Management :
- Combine these signals with additional analysis and sound risk management practices to determine optimal entry and exit points for scalping trades.
Disclaimer :
This script is provided for educational and informational purposes only and does not constitute financial advice. Trading involves risk, and past performance is not indicative of future results. Always perform your own analysis and use proper risk management strategies before trading.

Professional MSTI+ Trading Indicator"Professional MSTI+ Trading Indicator" is a comprehensive technical analysis tool that combines over 20 indicators to generate high-quality trading signals and assess market sentiment. The script integrates standard indicators (MACD, RSI, Bollinger Bands, Stochastic, Simple Moving Averages, and Volume Analysis) with advanced components (Squeeze Momentum, Fisher Transform, True Strength Index, Heikin-Ashi, Laguerre RSI, Hull MA) and further includes metrics such as ADX, Chaikin Money Flow, Williams %R, VWAP, and EMA for in-depth market analysis.
Key Features:
Multiple Presets for Different Trading Styles:
Choose from optimal configurations like Professional, Swing Trading, Day Trading, Scalping, or Reversal Hunter. Note that the presets may not work perfectly on all pairs, and manual calibration might be required. This flexibility allows you to fine-tune the settings to align with your unique strategies and signals.
Multi-Layered Signal Filtering:
Filters based on trend, volume, and volatility help eliminate false signals, enhancing the accuracy of market entries.
Comprehensive Fear & Greed Index:
The indicator aggregates data from RSI, volatility, momentum, trend, and volume to gauge overall market sentiment, providing an additional layer of market context.
Dynamic Information Panel:
Displays detailed status updates for each component (e.g., MACD, RSI, Laguerre RSI, TSI, Fisher Transform, Squeeze, Hull MA, etc.) along with a visual strength bar that represents the intensity of the trading signal.
Signal Generation:
Buy and sell signals are generated when a predefined number of conditions are met and confirmed over multiple bars. These signals are clearly displayed on the chart with arrows, making it easier to spot potential entry and exit points.
Alert Setup:
Built-in alert conditions allow you to receive real-time notifications when trading signals are generated, helping you stay on top of market movements.
"Professional MSTI+ Trading Indicator" is designed to enhance your trading strategy by providing a multi-faceted market analysis and an intuitive visual interface. While the presets offer a robust starting point, they may require manual calibration on certain pairs, giving you the flexibility to configure your own unique strategies and signals.

Optimized WPR Strategy with Filters (Debug)Identifying Market Trends:
The 200-period EMA is used to determine the short-term trend of the market.
When the price is above the 200-period EMA, it suggests a potential bullish market and an uptrend, and the strategy will only look for buying opportunities.
When the price is below the 200-period EMA, it suggests a potential bearish market and a downtrend, and the strategy will only look for selling opportunities.
When the 200-period EMA intersects with the price, it indicates that the market may be in a directionless consolidation phase.
Identifying Potential Reversal Points:
The strategy employs two Williams %R (WPR) indicators: one with a 9-period (fast WPR) and another with a 28-period (slow WPR).
WPR is a momentum indicator used to identify overbought and oversold conditions in the market. Its value oscillates between -100 and 0, with values near -100 indicating oversold conditions and values near 0 indicating overbought conditions.
In an uptrend (when the price is above the 200 EMA), the strategy seeks buying opportunities when both WPR indicators cross above -80 (the oversold zone) from below. This is considered a bullish signal, suggesting the market may be about to rebound. Sell signals are ignored at this time.
In a downtrend (when the price is below the 200 EMA), the strategy seeks selling opportunities when both WPR indicators cross below -20 (the overbought zone) from above. This is considered a bearish signal, suggesting the market may be about to reverse downward. Buy signals are ignored at this time.
Summary:
In summary, this strategy first uses the 200-period EMA to determine the overall trend direction of the market. Then, within the confirmed trend direction, it utilizes the simultaneous crossing of the overbought or oversold zones by the dual WPR indicators to identify potential reversal points as entry signals for trading. The strategy emphasizes that trading signals are only valid when both WPR indicators meet the conditions.
Hull Moving Average Adaptive RSI (Ehlers)Hull Moving Average Adaptive RSI (Ehlers)
The Hull Moving Average Adaptive RSI (Ehlers) is an enhanced trend-following indicator designed to provide a smooth and responsive view of price movement while incorporating an additional momentum-based analysis using the Adaptive RSI.
Principle and Advantages of the Hull Moving Average:
- The Hull Moving Average (HMA) is known for its ability to track price action with minimal lag while maintaining a smooth curve.
- Unlike traditional moving averages, the HMA significantly reduces noise and responds faster to market trends, making it highly effective for detecting trend direction and changes.
- It achieves this by applying a weighted moving average calculation that emphasizes recent price movements while smoothing out fluctuations.
Why the Adaptive RSI Was Added:
- The core HMA line remains the foundation of the indicator, but an additional analysis using the Adaptive RSI has been integrated to provide more meaningful insights into momentum shifts.
- The Adaptive RSI is a modified version of the traditional Relative Strength Index that dynamically adjusts its sensitivity based on market volatility.
- By incorporating the Adaptive RSI, the HMA visually represents whether momentum is strengthening or weakening, offering a complementary layer of analysis.
How the Adaptive RSI Influences the Indicator:
- High Adaptive RSI (above 65): The market may be overbought, or bullish momentum could be fading. The HMA turns shades of red, signaling a possible exhaustion phase or potential reversals.
- Neutral Adaptive RSI (around 50): The market is in a balanced state, meaning neither buyers nor sellers are in clear control. The HMA takes on grayish tones to indicate this consolidation.
- Low Adaptive RSI (below 35): The market may be oversold, or bearish momentum could be weakening. The HMA shifts to shades of blue, highlighting potential recovery zones or trend slowdowns.
Why This Combination is Powerful:
- While the HMA excels in tracking trends and reducing lag, it does not provide information about momentum strength on its own.
- The Adaptive RSI bridges this gap by adding a clear visual layer that helps traders assess whether a trend is likely to continue, consolidate, or reverse.
- This makes the indicator particularly useful for spotting trend exhaustion and confirming momentum shifts in real-time.
Best Use Cases:
- Works effectively on timeframes from 1 hour (1H) to 1 day (1D), making it suitable for swing trading and position trading.
- Particularly useful for trading indices (SPY), stocks, forex, and cryptocurrencies, where momentum shifts are frequent.
- Helps identify not just trend direction but also whether that trend is gaining or losing strength.
Recommended Complementary Indicators:
- Adaptive Trend Finder: Helps identify the dominant long-term trend.
- Williams Fractals Ultimate: Provides key reversal points to validate trend shifts.
- RVOL (Relative Volume): Confirms significant moves based on volume strength.
This enhanced HMA with Adaptive RSI provides a powerful, intuitive visual tool that makes trend analysis and momentum interpretation more effective and efficient.
This indicator is for educational and informational purposes only. It should not be considered financial advice or a guarantee of performance. Always conduct your own research and use proper risk management when trading. Past performance does not guarantee future results.

Multi-Timeframe RPM Gauges with Custom Timeframes by DiGetIntroducing the **Multi-Timeframe RPM Gauges with Custom Timeframes + RSI Combos (mod) by DiGet** – a cutting-edge TradingView indicator meticulously crafted to revolutionize your market analysis.
Imagine having a dynamic dashboard right on your chart that consolidates the power of nine essential technical indicators—RSI, CCI, Stochastic, Williams %R, EMA crossover, Bollinger Bands, ATR, MACD, and Ichimoku Cloud—across multiple timeframes. This indicator not only displays each indicator’s score through an intuitive gauge system but also computes a combined metric to provide you with an at-a-glance understanding of market momentum and potential trend shifts.
**Key Features:**
- **Multi-Timeframe Insight:**
Configure up to four custom timeframes (e.g., 1, 5, 15, 60 minutes) to capture both short-term fluctuations and long-term trends, ensuring you never miss critical market moves.
- **Comprehensive Signal Suite:**
Benefit from a harmonious blend of signals. Whether you rely on momentum indicators like RSI and CCI, volatility measures like Bollinger Bands and ATR, or trend confirmations via EMA, MACD, and Ichimoku, every metric is normalized into actionable percentages.
- **Dynamic, Color-Coded Gauge Display:**
A built-in table presents all your data in a clear, color-coded format—green for bullish, red for bearish, and gray for neutral conditions. This visual representation allows you to quickly gauge market sentiment without sifting through complex charts.
- **Customizable Layout:**
Tailor your experience by toggling individual table columns. Whether you want to focus solely on RSI or dive deep into combined metrics like RSI & CCI or RSI & MACD, the choice is yours.
- **Optimized Utility Functions:**
Proprietary functions standardize indicator values into percentage scores, making it simpler than ever to compare different signals and spot opportunities in real time.
- **User-Friendly Interface:**
Designed for both beginners and seasoned traders, the straightforward input settings let you easily adjust technical parameters and timeframes to suit your personal trading strategy.
This indicator is not just a tool—it’s your new trading companion. It equips you with a multi-dimensional view of the market, enabling faster, more informed decision-making. Whether you’re scanning across various assets or drilling down on a single chart, the Multi-Timeframe RPM Gauges empower you to interpret market data with unprecedented clarity.
Add this indicator to your TradingView chart today and experience a smarter, more efficient way to navigate the markets. Join the community of traders who have elevated their analysis—and be ready to receive countless thanks as you transform your trading strategy!

VPSA-VTDDear Sir/Madam,
I am pleased to present the next iteration of my indicator concept, which, in my opinion, serves as a highly useful tool for analyzing markets using the Volume Spread Analysis (VSA) method or the Wyckoff methodology.
The VPSA (Volume-Price Spread Analysis), the latest version in the family of scripts I’ve developed, appears to perform its task effectively. The combination of visualizing normalized data alongside their significance, achieved through the application of Z-Score standardization, proved to be a sound solution. Therefore, I decided to take it a step further and expand my project with a complementary approach to the existing one.
Theory
At the outset, I want to acknowledge that I’m aware of the existence of other probabilistic models used in financial markets, which may describe these phenomena more accurately. However, in line with Occam's Razor, I aimed to maintain simplicity in the analysis and interpretation of the concepts below. For this reason, I focused on describing the data using the Gaussian distribution.
The data I read from the chart — primarily the closing price, the high-low price difference (spread), and volume — exhibit cyclical patterns. These cycles are described by Wyckoff's methodology, while VSA complements and presents them from a different perspective. I will refrain from explaining these methods in depth due to their complexity and broad scope. What matters is that within these cycles, various events occur, described by candles or bars in distinct ways, characterized by different spreads and volumes. When observing the chart, I notice periods of lower volatility, often accompanied by lower volumes, as well as periods of high volatility and significant volumes. It’s important to find harmony within this apparent chaos. I think that chart interpretation cannot happen without considering the broader context, but the more variables I include in the analytical process, the more challenges arise. For instance, how can I determine if something is large (wide) or small (narrow)? For elements like volume or spread, my script provides a partial answer to this question. Now, let’s get to the point.
Technical Overview
The first technique I applied is Min-Max Normalization. With its help, the script adjusts volume and spread values to a range between 0 and 1. This allows for a comparable bar chart, where a wide bar represents volume, and a narrow one represents spread. Without normalization, visually comparing values that differ by several orders of magnitude would be inconvenient. If the indicator shows that one bar has a unit spread value while another has half that value, it means the first bar is twice as large. The ratio is preserved.
The second technique I used is Z-Score Standardization. This concept is based on the normal distribution, characterized by variables such as the mean and standard deviation, which measures data dispersion around the mean. The Z-Score indicates how many standard deviations a given value deviates from the population mean. The higher the Z-Score, the more the examined object deviates from the mean. If an object has a Z-Score of 3, it falls within 0.1% of the population, making it a rare occurrence or even an anomaly. In the context of chart analysis, such strong deviations are events like climaxes, which often signal the end of a trend, though not always. In my script, I assigned specific colors to frequently occurring Z-Score values:
Below 1 – Blue
Above 1 – Green
Above 2 – Red
Above 3 – Fuchsia
These colors are applied to both spread and volume, allowing for quick visual interpretation of data.
Volume Trend Detector (VTD)
The above forms the foundation of VPSA. However, I have extended the script with a Volume Trend Detector (VTD). The idea is that when I consider market structure - by market structure, I mean the overall chart, support and resistance levels, candles, and patterns typical of spread and volume analysis as well as Wyckoff patterns - I look for price ranges where there is a lack of supply, demand, or clues left behind by Smart Money or the market's enigmatic identity known as the Composite Man. This is essential because, as these clues and behaviors of market participants — expressed through the chart’s dynamics - reflect the actions, decisions, and emotions of all players. These behaviors can help interpret the bull-bear battle and estimate the probability of their next moves, which is one of the key factors for a trader relying on technical analysis to make a trade decision.
I enhanced the script with a Volume Trend Detector, which operates in two modes:
Step-by-Step Logic
The detector identifies expected volume dynamics. For instance, when looking for signs of a lack of bullish interest, I focus on setups with decreasing volatility and volume, particularly for bullish candles. These setups are referred to as No Demand patterns, according to Tom Williams' methodology.
Simple Moving Average (SMA)
The detector can also operate based on a simple moving average, helping to identify systematic trends in declining volume, indicating potential imbalances in market forces.
I’ve designed the program to allow the selection of candle types and volume characteristics to which the script will pay particular attention and notify me of specific market conditions.
Advantages and Disadvantages
Advantages:
Unified visualization of normalized spread and volume, saving time and improving efficiency.
The use of Z-Score as a consistent and repeatable relative mechanism for marking examined values.
The use of colors in visualization as a reference to Z-Score values.
The possibility to set up a continuous alert system that monitors the market in real time.
The use of EMA (Exponential Moving Average) as a moving average for Z-Score.
The goal of these features is to save my time, which is the only truly invaluable resource.
Disadvantages:
The assumption that the data follows a normal distribution, which may lead to inaccurate interpretations.
A fixed analysis period, which may not be perfectly suited to changing market conditions.
The use of EMA as a moving average for Z-Score, listed both as an advantage and a disadvantage depending on market context.
I have included comments within the code to explain the logic behind each part. For those who seek detailed mathematical formulas, I invite you to explore the code itself.
Defining Program Parameters:
Numerical Conditions:
VPSA Period for Analysis – The number of candles analyzed.
Normalized Spread Alert Threshold – The expected normalized spread value; defines how large or small the spread should be, with a range of 0-1.00.
Normalized Volume Alert Threshold – The expected normalized volume value; defines how large or small the volume should be, with a range of 0-1.00.
Spread Z-SCORE Alert Threshold – The Z-SCORE value for the spread; determines how much the spread deviates from the average, with a range of 0-4 (a higher value can be entered, but from a logical standpoint, exceeding 4 is unnecessary).
Volume Z-SCORE Alert Threshold – The Z-SCORE value for volume; determines how much the volume deviates from the average, with a range of 0-4 (the same logical note as above applies).
Logical Conditions:
Logical conditions describe whether the expected value should be less than or equal to or greater than or equal to the numerical condition.
All four parameters accept two possibilities and are analogous to the numerical conditions.
Volume Trend Detector:
Volume Trend Detector Period for Analysis – The analysis period, indicating the number of candles examined.
Method of Trend Determination – The method used to determine the trend. Possible values: Step by Step or SMA.
Trend Direction – The expected trend direction. Possible values: Upward or Downward.
Candle Type – The type of candle taken into account. Possible values: Bullish, Bearish, or Any.
The last available setting is the option to enable a joint alert for VPSA and VTD.
When enabled, VPSA will trigger on the last closed candle, regardless of the VTD analysis period.
Example Use Cases (Labels Visible in the Script Window Indicate Triggered Alerts):
The provided labels in the chart window mark where specific conditions were met and alerts were triggered.
Summary and Reflections
The program I present is a strong tool in the ongoing "game" with the Composite Man.
However, it requires familiarity and understanding of the underlying methodologies to fully utilize its potential.
Of course, like any technical analysis tool, it is not without flaws. There is no indicator that serves as a perfect Grail, accurately signaling Buy or Sell in every case.
I would like to thank those who have read through my thoughts to the end and are willing to take a closer look at my work by using this script.
If you encounter any errors or have suggestions for improvement, please feel free to contact me.
I wish you good health and accurately interpreted market structures, leading to successful trades!
CatTheTrader

AuriumFlowAURIUM (GOLD-Weighted Average with Fractal Dynamics)
Aurium is a cutting-edge indicator that blends volume-weighted moving averages (VWMA), fractal geometry, and Fibonacci-inspired calculations to deliver a precise and holistic view of market trends. By dynamically adjusting to price and volume, Aurium uncovers key levels of confluence for trend reversals and continuations, making it a powerful tool for traders.
Key Features:
Dynamic Trendline (GOLD):
The central trendline is a weighted moving average based on price and volume, tuned using Fibonacci-based fast (34) and slow (144) exponential moving average lengths. This ensures the trendline adapts seamlessly to the flow of market dynamics.
Formula:
GOLD = VWMA(34) * Volume Factor + VWMA(144) * (1 - Volume Factor)
Fractal Highs and Lows:
Detects pivotal market points using a fractal lookback period (default 5, odd-numbered). Fractals identify local highs and lows over a defined window, capturing the structure of market cycles.
Trend Background Highlighting:
Bullish Zone: Price above the GOLD line with a green background.
Bearish Zone: Price below the GOLD line with a red background.
Buy and Sell Alerts:
Generates actionable signals when fractals align with GOLD. Bullish fractals confirm continuation or reversal in an uptrend, while bearish fractals validate a downtrend.
The Math Behind Aurium:
Volume-Weighted Adjustments:
By integrating volume into the calculation, Aurium dynamically emphasizes price levels with greater participation, giving traders insight into zones of institutional interest.
Formula:
VWMA = EMA(Close * Volume) / EMA(Volume)
Fractal Calculations:
Fractals are identified as local maxima (highs) or minima (lows) based on the surrounding bars, leveraging the natural symmetry in price behavior.
Fibonacci Relationships:
The 34 and 144 EMA lengths are Fibonacci numbers, offering a natural alignment with price cycles and market rhythms.
Ideal For:
Traders seeking a precise and intuitive indicator for aligning with trends and detecting reversals.
Strategies inspired by Bill Williams, with added volume and fractal-based insights.
Short-term scalpers and long-term trend-followers alike.
Unlock deeper market insights and trade with precision using Aurium!

WVAD (Optimized Log Scaled)The WVAD (Optimized Log Scaled) indicator is a refined version of the classic Williams' Volume Accumulation/Distribution (WVAD). This version introduces logarithmic scaling for better visualization and usability, especially when dealing with large value ranges. It also includes EMA smoothing to highlight trends and reduce noise, providing traders with a more precise and clear representation of market dynamics.
Key Features:
1.Logarithmic Scaling:
Applies a log-based transformation to the WVAD values, ensuring extreme values are compressed while maintaining the overall structure of the data.
The log scaling allows better readability and interpretation, particularly for volatile or high-volume markets.
2.EMA Smoothing:
Uses an exponential moving average (EMA) to smooth the logarithmic WVAD values.
Helps reduce noise while preserving short-term trends, making it suitable for both trend-following and reversal strategies.
3.Customizable Parameters:
N (Lookback Period): Defines the accumulation period for calculating WVAD.
EMA Smoothing Period: Controls the sensitivity of the EMA applied to the logarithmic WVAD.
Decimal Places: Adjusts the precision of the displayed values for clearer visualization.
Line Colors: Fully customizable colors for both the raw WVAD line and the smoothed EMA.
4.Directional Preservation:
Keeps the positive and negative signs of WVAD to reflect accumulation (buying pressure) or distribution (selling pressure) in the market.
5.Zero Line Reference:
A horizontal zero line is plotted to help traders easily identify bullish (above 0) or bearish (below 0) market conditions.
How to Use:
Identify Trends: The smoothed WVAD line (EMA) can help detect trends or shifts in buying/selling pressure.
Crossovers: Use crossovers of the WVAD with the zero line as potential buy or sell signals.
Divergence: Spot divergences between price and the WVAD for early indications of reversals.
Applications:
Suitable for intraday, swing, or longer-term trading strategies.
Works across various asset classes, including stocks, commodities, and cryptocurrencies.

Awesome_Accelerator_Zone OscillatorExplanation and Usage Guide for AO_AC_ZONE Oscillator
Indicator Overview
The **AO_AC_ZONE** oscillator is based on the concepts introduced by **Bill Williams** in his book *New Trading Dimensions*. This indicator combines the **Awesome Oscillator (AO)**, **Accelerator Oscillator (AC)**, and a custom **Zone Oscillator**, visualizing them together in a clear, color-coded format.
The Zone Oscillator is derived from the relationship between AO and AC, indicating the market's dominant momentum state (bullish, bearish, or neutral). It also integrates real-time candle coloring to visually align price bars with the Zone's momentum.
---
**Components**
1. **Awesome Oscillator (AO)**:
- AO measures the difference between a 5-period and 34-period Simple Moving Average (SMA) applied to the midpoints of candles.
- It reflects market momentum, where:
- Green bars = increasing momentum
- Red bars = decreasing momentum
2. **Accelerator Oscillator (AC)**:
- AC is calculated as the difference between AO and its 5-period SMA.
- It indicates the acceleration or deceleration of market momentum.
- Fuchsia bars = increasing momentum
- Purple bars = decreasing momentum
3. **Zone Oscillator**:
- The Zone combines AO and AC states:
- **Green Zone**: Both AO and AC are positive (bullish momentum).
- **Red Zone**: Both AO and AC are negative (bearish momentum).
- **Gray Zone**: AO and AC have differing signs (neutral/uncertain momentum).
- Candle colors dynamically match the Zone’s state for enhanced visual clarity.
---
**How to Use the Indicator**
**1. Interpreting the Oscillators**
- **AO**: Use it to detect momentum direction and changes. Pay attention to shifts in bar color:
- **Increasing AO (Aqua)**: Bullish momentum gaining strength.
- **Decreasing AO (Navy)**: Bullish momentum weakening or bearish momentum strengthening.
- **AC**: Provides early signals of momentum shifts.
- If AC changes color ahead of AO, it signals potential trend reversals or accelerations.
**2. Using the Zone Oscillator**
- **Green Zone**:
- Both AO and AC are positive.
- Indicates a strong bullish trend. Look for buying opportunities in line with the trend.
- **Red Zone**:
- Both AO and AC are negative.
- Signals strong bearish momentum. Look for shorting opportunities.
- **Gray Zone**:
- AO and AC are in conflict.
- Represents uncertainty; avoid trading or wait for a clear signal.
---
**Real-Time Application**
**Candle Coloring**
- The indicator modifies candle colors to match the Zone Oscillator's state:
- **Green Candles**: Strong bullish momentum.
- **Red Candles**: Strong bearish momentum.
- **Gray Candles**: Neutral momentum.
**Recommended Strategy (Based on New Trading Dimensions)**:
1. **Identify the Zone**:
- Focus on Green Zones for long entries and Red Zones for short entries.
2. **Look for AO/AC Confirmation**:
- Enter trades in the direction of both AO and AC when they align with the Zone.
- For exits, monitor when AO and AC conflict (Gray Zone).
3. **Use in Combination**:
- Combine this oscillator with fractals or trend indicators to confirm signals.
---
**Benefits**
- Visualizes momentum strength, acceleration, and alignment in one chart.
- Simplifies decision-making by integrating price action with oscillator dynamics.
- Supports faster trade identification and execution by highlighting bullish, bearish, and neutral zones.
---
**Disclaimer**
This indicator is a tool to assist in market analysis. Always incorporate proper risk management and avoid trading during uncertain conditions (Gray Zones). For optimal results, use this oscillator in conjunction with other analysis methods like support/resistance, volume analysis, and trend-following systems.

IV Rank/Percentile with Williams VIX FixDisplay IV Rank / IV Percentile
This indicator is based on William's VixFix, which replicates the VIX—a measure of the implied volatility of the S&P 500 Index (SPX). The key advantage of the VixFix is that it can be applied to any security, not just the SPX.
IV Rank is calculated by identifying the highest and lowest implied volatility (IV) values over a selected number of past periods. It then determines where the current IV lies as a percentage between these two extremes. For example, if over the past five periods the highest IV was 30%, the lowest was 10%, and the current IV is 20%, the IV Rank would be 50%, since 20% is halfway between 10% and 30%.
IV Percentile, on the other hand, considers all past IV values—not just the highest and lowest—and calculates the percentage of these values that are below the current IV. For instance, if the past five IV values were 30%, 10%, 11%, 15%, and 17%, and the current IV is 20%, the IV Rank remains at 50%. However, the IV Percentile is 80% because 4 out of the 5 past values (80%) are below the current IV of 20%.
Trend Trader-RemasteredThe script was originally coded in 2018 with Pine Script version 3, and it was in invite only status. It has been updated and optimised for Pine Script v5 and made completely open source.
Overview
The Trend Trader-Remastered is a refined and highly sophisticated implementation of the Parabolic SAR designed to create strategic buy and sell entry signals, alongside precision take profit and re-entry signals based on marked Bill Williams (BW) fractals. Built with a deep emphasis on clarity and accuracy, this indicator ensures that only relevant and meaningful signals are generated, eliminating any unnecessary entries or exits.
Key Features
1) Parabolic SAR-Based Entry Signals:
This indicator leverages an advanced implementation of the Parabolic SAR to create clear buy and sell position entry signals.
The Parabolic SAR detects potential trend shifts, helping traders make timely entries in trending markets.
These entries are strategically aligned to maximise trend-following opportunities and minimise whipsaw trades, providing an effective approach for trend traders.
2) Take Profit and Re-Entry Signals with BW Fractals:
The indicator goes beyond simple entry and exit signals by integrating BW Fractal-based take profit and re-entry signals.
Relevant Signal Generation: The indicator maintains strict criteria for signal relevance, ensuring that a re-entry signal is only generated if there has been a preceding take profit signal in the respective position. This prevents any misleading or premature re-entry signals.
Progressive Take Profit Signals: The script generates multiple take profit signals sequentially in alignment with prior take profit levels. For instance, in a buy position initiated at a price of 100, the first take profit might occur at 110. Any subsequent take profit signals will then occur at prices greater than 110, ensuring they are "in favour" of the original position's trajectory and previous take profits.
3) Consistent Trend-Following Structure:
This design allows the Trend Trader-Remastered to continue signaling take profit opportunities as the trend advances. The indicator only generates take profit signals in alignment with previous ones, supporting a systematic and profit-maximising strategy.
This structure helps traders maintain positions effectively, securing incremental profits as the trend progresses.
4) Customisability and Usability:
Adjustable Parameters: Users can configure key settings, including sensitivity to the Parabolic SAR and fractal identification. This allows flexibility to fine-tune the indicator according to different market conditions or trading styles.
User-Friendly Alerts: The indicator provides clear visual signals on the chart, along with optional alerts to notify traders of new buy, sell, take profit, or re-entry opportunities in real-time.
