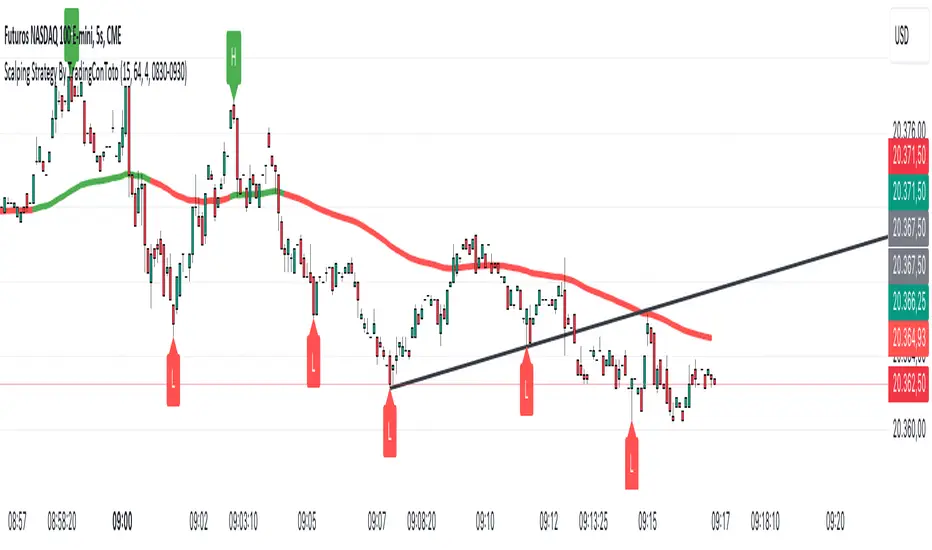
Scalping Strategy By TradingConTotoScript Description: "Scalping Strategy By TradingConToto"
This scalping strategy is designed to trade in volatile markets, taking advantage of rapid price movements. It uses pivots to identify key entry and exit points, along with exponential moving averages (EMAs) to determine the overall trend.
Key Features:
Dynamic Pivots: Calculates pivot highs and lows to identify support and resistance zones, improving entry accuracy.
Market Trend Analysis: Utilizes a 100-period EMA for long-term trend analysis and a 25-period EMA for short-term trends, facilitating informed decision-making.
Automated Entry and Exit: Generates buy and sell signals based on EMA crossovers and specific market conditions, ensuring you don't miss opportunities.
Risk Management: Allows you to set take profit and stop loss levels tailored to market volatility, using the ATR for effective risk management.
User-Friendly Interface: Easily customize strategy parameters such as pivot range, stop loss and take profit pips, and spread.
Requirements:
Ideal for use on short time frames during high activity sessions, like the configured scalping session.
Activate buy and sell options according to your preference and analyze performance using TradingView’s tools.
Note:
This script is a tool and does not guarantee results. It is recommended to test in a simulated environment before applying it to real accounts.
Optimize your scalping operations and enhance your market performance with this effective strategy!
Search in scripts for "zone"
Parent Session Sweeps + Alert Killzone Ranges with Parent Session Sweep
Key Features:
1. Multiple Session Support: The script tracks three major trading sessions - Asia, London, and New York. Users can customize the timing of these sessions.
2. Killzone Visualization: The strategy visually represents each session's range, either as filled boxes or lines, allowing traders to easily identify key price levels.
3. Parent Session Logic: The core of the strategy revolves around identifying a "parent" session - a session that encompasses the range of the following session. This parent session becomes the basis for potential trade setups.
4. Sweep and Reclaim Setups: The strategy looks for price movements that sweep (break above or below) the parent session's high or low, followed by a reclaim of that level. This price action often indicates a potential reversal.
5. Risk-Reward Filtering: Each potential setup is evaluated based on a user-defined minimum risk-reward ratio, ensuring that only high-quality trade opportunities are considered.
6. Candle Close Filter: An optional filter that checks the characteristics of the candle that reclaims the parent session level, adding an extra layer of confirmation to the setup.
7. Performance Tracking: The strategy keeps track of bullish and bearish setup success rates, providing valuable feedback on its performance over time.
8. Visual Aids: The script draws lines to mark the parent session's high and low, making it easy for traders to identify key levels.
How It Works:
1. The script continuously monitors price action across the defined sessions.
2. When a session fully contains the range of the next session, it's identified as a potential parent session.
3. The strategy then waits for price to sweep either the high or low of this parent session.
4. If a sweep occurs, it looks for a reclaim of the swept level within the parameters set by the user.
5. If a valid setup is identified, the script generates an alert and places a trade (if backtesting or running live).
6. The strategy continues to monitor the trade for either reaching the target (opposite level of the parent session) or hitting the stop loss.
Considerations for Signals:
- Sweep: A break of the parent session's high or low.
- Reclaim: A close back inside the parent session range after a sweep.
- Candle Characteristics: Optional filter for the reclaim candle (e.g., bullish candle for long setups).
- Risk-Reward: Each setup must meet or exceed the user-defined minimum risk-reward ratio.
- Session Timing: The strategy is sensitive to the defined session times, which should be set according to the trader's preferred time zone.
This strategy aims to capitalize on institutional order flow and liquidity patterns in the forex market, providing traders with a systematic approach to identifying potential reversal points with favorable risk-reward profiles.

Friday Bond Short StrategyStrategy: Friday Bond Short Strategy (1H Timeframe)
Objective:
This strategy aims to open short positions on a specified day and hour (Eastern Time) and close those positions on another specified day and hour. The background color of the chart will turn green when a position is active, providing a visual cue of an open trade.
Parameters:
1. Entry Day:
• Defines the day of the week on which the short position will be opened.
• Value: 6 for Friday (Pine Script’s weekday numbering: Monday = 2, Friday = 6).
2. Entry Hour:
• Specifies the hour (Eastern Time) when the short position will be opened.
• Value: 13 for 13:00 ET (1:00 PM).
3. Exit Day:
• Defines the day of the week on which the short position will be closed.
• Value: 2 for Monday.
4. Exit Hour:
• Specifies the hour (Eastern Time) when the position will be closed.
• Value: 13 for 13:00 ET (1:00 PM).
How It Works:
1. Time Adjustment to Eastern Time:
• The script converts all time references to Eastern Time (America/New_York) to ensure the strategy operates according to the desired time zone.
2. Entry Conditions:
• The strategy checks if the current day of the week matches the specified entry_day and if the current hour matches the specified entry_hour.
• If both conditions are met, a short position is opened (strategy.entry("Short", strategy.short)).
3. Exit Conditions:
• Similarly, the strategy checks if the current day of the week matches the specified exit_day and if the current hour matches the specified exit_hour.
• If both conditions are met, the open short position is closed (strategy.close("Short")).
4. Background Color:
• The background color of the chart is adjusted based on whether there is an open position:
• Green Background: If the strategy has an open position (strategy.position_size > 0), the background is set to light green.
• No Background Color: If there is no open position, the background color is not set (na).
Summary:
The Friday Bond Short Strategy is designed to enter short positions on Fridays at 1:00 PM ET and close them on Mondays at 1:00 PM ET. The chart background color turns green when a short position is active, providing a clear visual indication of when the strategy is engaged in a trade.

FVG Positioning Average with 200EMA Auto Trading [Pakun]Description
Strategy Name and Purpose
FVG Positioning Average with 200EMA Auto Trading
This strategy uses Fair Value Gaps (FVG) combined with a 200-period Exponential Moving Average (EMA) and Average True Range (ATR) to generate trend-based trading signals. It is designed to help traders identify high-probability entry points by leveraging the gaps between fair value prices and current market prices.
Originality and Usefulness
This script combines multiple indicators to create a cohesive trading strategy that is greater than the sum of its parts. While FVG is a powerful tool on its own, combining it with the EMA and ATR adds layers of confirmation and risk management, enhancing its effectiveness. Here’s how the components work together:
Fair Value Gap (FVG): Identifies gaps in the market where price action has not fully filled, indicating potential reversal or continuation points.
200-period Exponential Moving Average (EMA): Acts as a trend filter to ensure trades are taken in the direction of the overall trend, improving the probability of success.
Average True Range (ATR): Used to filter out insignificant gaps and set dynamic stop-loss levels based on market volatility, enhancing risk management.
Entry Conditions
Long Entry
The close price crosses above the downtrend FVG.
The close price, FVG up average, and down average are all above the 200 EMA, indicating a strong bullish trend.
Short Entry
The close price crosses below the uptrend FVG.
The close price, FVG up average, and down average are all below the 200 EMA, indicating a strong bearish trend.
Exit Conditions
For long positions, the stop loss is set at the recent low, and the take profit is set at a point with a risk-reward ratio of 1:1.5.
For short positions, the stop loss is set at the recent high, and the take profit is set at a point with a risk-reward ratio of 1:1.5.
Risk Management
Account Size: 1,000,000 yen
Commission and Slippage: 2 pips commission and 1 pip slippage per trade
Risk per Trade: 10% of account equity
The stop loss is based on the recent low or recent high, ensuring trades are exited when the market moves against the position.
Settings Options
FVG Lookback: Set the lookback period for calculating FVGs.
Lookback Type: Choose the type of lookback (Bar Count or FVG Count).
ATR Multiplier: Set the multiplier for ATR to filter significant gaps.
EMA Period: Set the period for the EMA to adjust the trend filter sensitivity.
Show FVGs on Chart: Choose whether to display FVGs on the chart for visual confirmation.
Bullish/Bearish Color: Set the color for bullish and bearish FVGs to distinguish them easily.
Show Gradient Areas: Choose whether to display gradient areas to highlight the zones of interest.
Sufficient Sample Size
The strategy has been backtested with 113 trades, providing a sufficient sample size to evaluate its performance.
Notes
This strategy is based on historical data and does not guarantee future results.
Thoroughly backtest and validate results before using in live trading.
Market volatility and other external factors can affect performance and may not yield expected results.
Acknowledgment
This strategy uses the FVG Positioning Average Strategy indicator. Thanks to for their contribution.
Clean Chart Explanation
The script is published with a clean chart to ensure that its output is readily identifiable and easy to understand. No other scripts are included on the chart, and any drawings or images used are specifically to illustrate how the script works.

CE_ZLSMA_5MIN_CANDLECHART-- Overview
The "CE_ZLSMA_5MIN_CANDLECHART" strategy, developed by DailyPanda, is a comprehensive trading strategy designed for analyzing trading on 5-minute candlestick charts.
It aims to use some indicators calculated from a Hekin Ashi chart, while running it on a normal candlestick chart, making sure that no price distortion affects the strategy results .
It also brings a feature to show, on the candlestick chart, where the entries would take place on the HA chart, to also be able to study the effect that the price distortion would make on your backtest.
-- Credit
The code in this script is based on open-source indicators originally written by veryfid and everget, I've made significant changes and additions to the scripts but all credit for the idea goes to them, I just built on top of it:
-- Key Features
It incorporate already built indicators (ZLSMA) and CandelierExit (CE)
-- Zero Lag Least Squares Moving Average (ZLSMA) - by veryfid
The ZLSMA is used to detect trends with minimal lag, improving the accuracy of entry and exit signals.
It incorporates a double-smoothed linear regression to minimize lag and enhance trend-following capabilities.
Buy signals are generated when the price closes above the ZLSMA together with the CE signal.
It is calculated based on the HA candlestick pattern.
-- Chandelier Exit (CE) - by everget
The Chandelier Exit indicator is used to dynamically manage stop-loss levels based on the Average True Range (ATR).
It ensures that stop-loss levels are adaptive to market volatility, protecting profits and limiting losses.
The ATR period and multiplier can be customized to fit different trading styles and risk tolerances.
It is calculated based on the HA candlestick pattern.
-- Heikin Ashi Candles
The strategy leverages Heikin Ashi candlesticks to be able identify trends more clearly and leverage this to stay on winning trades longer.
Traders can choose to display Heikin Ashi candlesticks and order fills on the chart for better visualization.
-- Risk Management
The strategy includes multiple risk management options to protect traders' capital.
Maximum intraday loss limit based on a percentage of equity.
Maximum stop-loss in points to filter out entries with excessive risk.
Daily profit target to stop trading once the goal is achieved.
Options to use fixed contract sizes or dynamically adjust based on a percentage of equity.
These features help traders manage risk and ensure sustainable trading practices.
Moving Averages
Several moving averages (EMA 9, EMA 20, EMA 50, EMA 72, EMA 200, SMA 200, and SMA 500) are plotted to provide additional context and trend confirmation.
A "Zone of Value" is highlighted between the EMA 200 and SMA 200 to identify potential support and resistance areas.
-- Customizable Inputs
The strategy includes various customizable inputs, allowing traders to tailor it to their specific needs.
Start and stop trading times.
Risk management parameters (e.g., maximum stop-loss, daily drawdown limit, and daily profit target).
Display options for Heikin Ashi candles and moving averages.
ZLSMA length and offset.
-- Usage
-- Setting Up the Strategy
Configure the start year for the strategy and the trading hours using the input fields. The first candle of each day will be filled black for easy identification, while candles that are outside the allowed time range will be filled purple.
Customize the risk management parameters to match your risk tolerance and trading style.
Enable or disable the display of Heikin Ashi candlesticks and moving averages as desired.
-- Interpreting Signals
Buy signals are indicated by a "Buy" label when the Heikin Ashi close price is above the ZLSMA and the Chandelier Exit indicates a long position.
The strategy will automatically enter a long position with a stop-loss level determined the swing low.
Positions are closed when the close price falls below the ZLSMA.
-- Risk Management
The strategy monitors the maximum intraday loss and stops trading if the loss limit is reached.
If enabled, also stops trading once the daily profit target is achieved, helping to lock in gains.
You have the option to filter operations based on a maximum accepted stop-loss level, based on your risk tolerance.
You can also operate with a fixed amount of contracts or dynamically adjust it based on your allowed risk per trade, ensuring optimal protection of capital.
-- Visual Aids
The strategy plots various moving averages to provide additional trend context.
The "Zone of Value" between the EMA 200 and SMA 200 highlights potential support and resistance areas.
Heikin Ashi candlesticks and order fills can be displayed to enhance the difference this strategy would take if you were to backtest it on a Heikin Ashi chart.
-- Table of results
This strategy also breaks down the results on a monthly basis for better understanding of your capital development along the way.
-- Conclusion
The "CE_ZLSMA_5MIN_CANDLECHART" strategy is a tool for intraday traders looking to understand and leaverage the Heikin Ashi chart while still using the normal candle chart. Traders can customize the strategy to fit their specific needs, making it a versatile addition to any trading toolkit.

Fibonacci Trend Reversal StrategyIntroduction
This publication introduces the " Fibonacci Retracement Trend Reversal Strategy, " tailored for traders aiming to leverage shifts in market momentum through advanced trend analysis and risk management techniques. This strategy is designed to pinpoint potential reversal points, optimizing trading opportunities.
Overview
The strategy leverages Fibonacci retracement levels derived from @IMBA_TRADER's lance Algo to identify potential trend reversals. It's further enhanced by a method called " Trend Strength Over Time " (TSOT) (by @federalTacos5392b), which utilizes percentile rankings of price action to measure trend strength. This also has implemented Dynamic SL finder by utilizing @veryfid's ATR Stoploss Finder which works pretty well
Indicators:
Fibonacci Retracement Levels : Identifies critical reversal zones at 23.6%, 50%, and 78.6% levels.
TSOT (Trend Strength Over Time) : Employs percentile rankings across various timeframes to gauge the strength and direction of trends, aiding in the confirmation of Fibonacci-based signals.
ATR (Average True Range) : Implements dynamic stop-loss settings for both long and short positions, enhancing trade security.
Strategy Settings :
- Sensitivity: Set default at 18, adjustable for more frequent or sparse signals based on market volatility.
- ATR Stop Loss Finder: Multiplier set at 3.5, applying the ATR value to determine stop losses dynamically.
- ATR Length: Default set to 14 with RMA smoothing.
- TSOT Settings: Hard-coded to identify percentile ranks, with no user-adjustable inputs due to its intrinsic calculation method.
Trade Direction Options : Configurable to support long, short, or both directions, adaptable to the trader's market assessment.
Entry Conditions :
- Long Entry: Triggered when the price surpasses the mid Fibonacci level (50%) with a bullish TSOT signal.
- Short Entry: Activated when the price falls below the mid Fibonacci level with a bearish TSOT indication.
Exit Conditions :
- Employs ATR-based dynamic stop losses, calibrated according to current market volatility, ensuring effective risk management.
Strategy Execution :
- Risk Management: Features adjustable risk-reward settings and enables partial take profits by default to systematically secure gains.
- Position Reversal: Includes an option to reverse positions based on new TSOT signals, improving the strategy's responsiveness to evolving market conditions.
The strategy is optimized for the BYBIT:WIFUSDT.P market on a scalping (5-minute) timeframe, using the default settings outlined above.
I spent a lot of time creating the dynamic exit strategies for partially taking profits and reversing positions so please make use of those and feel free to adjust the settings, tool tips are also provided.
For Developers: this is published as open-sourced code so that developers can learn something especially on dynamic exits and partial take profits!
Good Luck!
Disclaimer
This strategy is shared for educational purposes and must be thoroughly tested under diverse market conditions. Past performance does not guarantee future results. Traders are advised to integrate this strategy with other analytical tools and tailor it to specific market scenarios. I was only sharing what I've crafted while strategizing over a Solana Meme Coin.

Liquidity Breakout - Strategy [presentTrading]- Introduction and How It Is Different
The Liquidity Breakout Strategy is a unique trading strategy that focuses on identifying and leveraging patterns in market price data. This strategy, mainly inspired by the script "Master Pattern" by LuxAlgo, takes a different approach from many traditional strategies that rely on technical indicators or fundamental analysis. Instead, the Liquidity Breakout is based on the concept of contraction detection and liquidity levels. This approach allows traders to identify potential trading opportunities that other strategies might miss.
BTCUSDT 6h
The strategy is different from other trading strategies because it uses a unique combination of pattern detection, liquidity levels, and user-defined trading direction. This combination allows the strategy to adapt to various market conditions and trading styles, making it a versatile tool for traders.
- Strategy: How It Works
1. Contraction Detection: The strategy uses a lookback period defined by the user (default is 10 bars) to identify contractions in the market. A contraction is a period where the market is consolidating, often followed by a significant price movement. The strategy identifies contractions by finding pivot highs and pivot lows within the lookback period. If a pivot high is lower than the previous pivot high and a pivot low is higher than the previous pivot low, a contraction is detected.
2. liquidity Levels:
What are Liquidity levels? Liquidity levels, also known as liquidity pools or zones, are price levels at which there is a significant amount of trading activity. They are often areas where large institutional traders (like banks or hedge funds) have placed orders. These levels are important because they can act as support or resistance levels, and price often reacts at these levels.
In the context of this strategy, liquidity levels are used to identify potential entry and exit points for trades. When the price reaches a liquidity level, it could indicate a potential trading opportunity. For example, if the price breaks through a liquidity level, it could signal the start of a new trend. On the other hand, if the price approaches a liquidity level and then reverses, it could signal a potential reversal.
The strategy uses these two elements to identify potential trading opportunities. When a contraction is detected, the strategy will look for a breakout in the direction of the trend. If the breakout occurs at a liquidity level, the strategy will execute a trade.
The strategy also allows traders to set their stop loss based on either the Average True Range (ATR) or a fixed percentage. This flexibility allows traders to manage their risk according to their personal risk tolerance and trading style.
- Trade Direction
One of the unique features of the Master Pattern Strategy is the ability to choose the trading direction. Traders can choose to trade in the "Long" direction, the "Short" direction, or "Both". This feature allows traders to adapt the strategy to their personal trading style and market outlook.
For example, if a trader believes that the market is in an uptrend, they can choose to trade only in the "Long" direction. Conversely, if the market is in a downtrend, they can choose to trade only in the "Short" direction. If the trader believes that the market is volatile and there are opportunities in both directions, they can choose to trade in "Both" directions.
- Usage
To use the strategy, traders need to input their preferred settings, including the contraction detection lookback period, liquidity levels, stop loss type, and trading direction. Once these settings are input, the strategy will automatically detect potential trading opportunities and execute trades according to the defined parameters.
- Default Settings
The default settings for the Master Pattern Strategy are as follows:
Contraction Detection Lookback: 10
Liquidity Levels: 20
Stop Loss Type: ATR
ATR Length: 20
ATR Multiplier: 3.0
Fixed Percentage: 0.01
Trading Direction: Both
These settings can be adjusted according to the trader's personal preferences and market conditions. It's recommended that traders experiment with different settings to find the ones that work best for their trading style and goals.

twisted SMA strategy [4h] Hello
I would like to introduce a very simple strategy that uses a combination of 3 simple moving averages ( SMA 4 , SMA 9 , SMA 18 )
this is a classic combination showing the most probable trend directions
Crosses were marked on the basis of the color of the candles (bulish cross - blue / bearish cross - maroon)
ma 100 was used to determine the main trend, which is one of the most popular 4-hour candles
We define main trend while price crosses SMA100 ( for bullish trend I use green candle color )
The long position strategy was created in combination of 3 moving averages with Kaufman's adaptive moving average by alexgrover
The strategy is very accurate and is easy to use indicators
the strategy uses only Buy (Long) signals in a combination of crossovers of the SMA 4, SMA 9, SMA 18 and the Kaufman Adaptive Moving Average.
As a signal to close a long position, only the opposite signal of the intersection of 3 different moving averages is used
the current strategy is recommended for higher time zones (4h +) due to the strength of the closing candles, which translates into signal strength
works fascinatingly well for long-term bullish market assets (for example 4h Apple, Tesla charts)
Enjoy and trade safe ;)

Price Action - Support & Resistance + MACD LONG StrategyUsing "Price Action - Support & Resistance by DGT" and the MACD (Moving Average Convergence Divergence) indicator in TradingView can help develop a trade strategy. Here's a step-by-step approach you can follow:
1. Identifying Support and Resistance Levels: Apply the "Price Action - Support & Resistance by DGT" indicator to your chart. This indicator helps you identify key support and resistance levels based on price action. These levels act as potential areas where the price may reverse or consolidate.
2. Confirming Support and Resistance Levels: Once the indicator has plotted support and resistance levels on your chart, analyze the historical price action around these levels. Look for multiple touches or bounces from the same level, which adds strength to the support or resistance zone.
3. Analyzing the MACD Indicator: Add the MACD indicator to your chart. The MACD consists of two lines: the MACD line and the signal line, along with a histogram representing the difference between the two lines. The MACD helps identify momentum and potential trend reversals.
When the MACD line crosses above the signal line and the histogram turns positive, it suggests bullish momentum.
4. Identifying Trade Opportunities:
Bullish Trade: Look for a bullish setup when the price approaches a strong support level identified by the "Price Action - Support & Resistance by DGT" indicator. Wait for the MACD lines to cross above the signal line and the histogram to turn positive, indicating bullish momentum. Enter a long position with a stop loss below the
support level.
Managing the Trade: Once you enter a trade, consider setting a target based on the distance between your entry point and the nearest significant support or resistance level. You can also use trailing stop losses or other risk management techniques to protect your profits and limit potential losses.
Remember that no trading strategy is guaranteed to be successful, and it's important to practice proper risk management and conduct thorough analysis before making any trading decisions. Additionally, it's recommended to backtest and demo trade this strategy before using it with real money.

Exponential Stochastic Strategywhat is Exponential Stochastic?
it is a modified version of the stochastic indicator. This strategy does not include pyramiding, repaint, trailing stop or take profit.
what it does?
It contains an extra input in addition to the stochastic indicator. Thanks to this input, different exponential weights can be given to the outputs and the indicator can be made more sensitive or insensitive. The strategy buys when the indicator leaves the overbought zone, sells when it leaves the oversold zone and always stays in the trade.
how it does it?
it uses this formula: i.hizliresim.com
Thanks to this formula, even if the weights given to the outputs change, the indicator always continues to take a value between 0 and 100.
how to use it ?
With the input named "exp", you can change the sensitivity of the indicator and develop different strategies. other inputs are the same as the stochastic indicator. Increasing the exp value causes the indicator to signal less, decreasing it makes it much more sensitive.

X48 - Strategy | MA Type Cross + TPSL | Future&Spot | V.2Thank You For Open Source Code, This Strategy Ref. By 1.Simple Strategy Like MA Crossover For Long/Short or Spot Trade, 2. CDC Action Zone V.2 for BarPaint
This Strategy Mixing With MA Crossover Strategy and BarPaint By CDC Action Zone and TP/SL by Varbara
### How To Use Strategy : Setting EMA/SMA Crossover EMA/SMA, Any Value If You Want
For Long Position : Cross Up
For Short Position : Cross Down
Can Use With Spot Trade : Cross Up = Buy, Cross Down = Sell
TP/SL When Your OrderSize Change From any % Of Your TP/SL Value
### In Strategy Setting
Intitial Capital = Ex. 200
Order Size = Should Be Money Management Not Use 100% of Capital Ex. 10% of Capital (200$) = Order Size 20$
StopLoss and Take Profit = If You Run Trend TF 4H+ or 1D+ You Can Change TP% = 1,000% for nonlimit and Stop Loss 5 - 20% from your order size
Ex. Stoploss 15% = OrderSize / 100 x %SL = 20$/100 x 15% = 3$ Loss from order size 20$ (if you not set stop loss.)
Base Currency = (Your Currency) # Ex. USD
Commission = (Your Trading Fee) # Ex. Future Fee Can Check At Binance Fee Rate > www.binance.com > Choose Your Fee Type, Ex. USD M Future (Regular User) = 0.02 (Maker), 0.04 (Taker)
Commission Symbol Type = % # (Ref. By Binance Fee Rate)
### Notice ####
Default Setting It's Realistic From Normal Life Ex. Capital 200$ / Ordersize 20$ (10%)/ Commission 0.1% (Buy+Sell) / Slippage = 2 / TP = 1000% (nonlimit) / SL = 15%/OrderSize
Low Risk But High Return, Good Luck
### Bot Auto Trade by X4815162342 ###
if you wanna try my bot auto trade X48-3in1-bot : Contact My Line ID : x4815x
Full Command Alert For This Strategy If You Wanna See It's
'{"ex":"'+markettype+'","side": "'+longcommand+'", "amount": "@{{strategy.order.contracts}}", "symbol": "{{ticker}}", "passphrase": "'+passphrase+'","leverage":"'+str.tostring(leveragex)+'"}'
'{"ex":"'+markettype+'","side": "'+shortcommand+'", "amount": "@{{strategy.order.contracts}}", "symbol": "{{ticker}}", "passphrase": "'+passphrase+'","leverage":"'+str.tostring(leveragex)+'"}'
But Easy Than Full Command Just Use Thisssssss !! Strategy Be Manage Auto Long and Short or TPSL Position
You Don't Do Anything Just Use This Message to Alerts Message
{{strategy.order.alert_message}}
### If you don't use bot but just looking for strategy test ####
Just Pass Bot Setting Function It's Nothing Effect For Strategy !!!!!!
Let's Enjoy With Your Strategy BackTest 😁
Remember Beware Max drawdown%. I'm Recommend Lower Than 10% It's Very Good.

R19 STRATEGYHello again.
Let me introduce you R19 Strategy I wrote for mostly BTC long/short signals
This is an upgrated version of STRATEGY R18 F BTC strategy.
I checked this strategy on different timeframes and different assest and found it very usefull for BTC 1 Hour and 5 minutes chart.
Strategy is basically takes BTC/USDT as a main indicator, so you can apply this strategy to all cryptocurrencies as they mostly acts accordingly with BTC itself (Of course you can change main indicator to different assets if you think that there is a positive corelation with. i.e. for BTC signals you can sellect DXY index for main indicator to act for BTC long/short signals)
Default variables of the inticator is calibrated to BTC/USDT 5 minute chart. I gained above %77 success.
Strategy simply uses, ADX, MACD, SMA, Fibo, RSI combination and opens positions accordingly. Timeframe variable is very important that, strategy decides according the timeframe you've sellected but acts within the timeframe in the chart. For example, if you're on the 5 minutes chart, but you've selected 1 hour for the time frame variable, strategy looks for 1 hour MACD crossover for opening a position, but this happens in 5 minutes candle, It acts quickly and opens the position.
Strategy also uses a trailing stop loss feature. You can determine max stoploss, at which point trailing starts and at which distance trailing follows. The green and red lines will show your stoploss levels according to the position strategy enters (green for long, red for short stop loss levels). When price exceeds to the certaing levels of success, stop loss goes with the profitable price (this means, when strategy opens a position, you can put your stop loss to the green/red line in actual trading)
You can fine tune strategy to all assets.
Please write down your comments if you get more successfull about different time zones and different assets. And please tell me your fine tuning levels of this strategy as well.
See you all.

Smoothed Heikin Ashi Trend on Chart - TraderHalai BACKTESTSmoothed Heikin Ashi Trend on chart - Backtest
This is a backtest of the Smoothed Heikin Ashi Trend indicator, which computes the reverse candle close price required to flip a Heikin Ashi trend from red to green and vice versa. The original indicator can be found in the scripts section of my profile.
This particular back test uses this indicator with a Trend following paradigm with a percentage-based stop loss.
Note, that backtesting performance is not always indicative of future performance, but it does provide some basis for further development and walk-forward / live testing.
Testing was performed on Bitcoin , as this is a primary target market for me to use this kind of strategy.
Sample Backtesting results as of 10th June 2022:
Backtesting parameters:
Position size: 10% of equity
Long stop: 1% below entry
Short stop: 1% above entry
Repainting: Off
Smoothing: SMA
Period: 10
8 Hour:
Number of Trades: 1046
Gross Return: 249.27 %
CAGR Return: 14.04 %
Max Drawdown: 7.9 %
Win percentage: 28.01 %
Profit Factor (Expectancy): 2.019
Average Loss: 0.33 %
Average Win: 1.69 %
Average Time for Loss: 1 day
Average Time for Win: 5.33 days
1 Day:
Number of Trades: 429
Gross Return: 458.4 %
CAGR Return: 15.76 %
Max Drawdown: 6.37 %
Profit Factor (Expectancy): 2.804
Average Loss: 0.8 %
Average Win: 7.2 %
Average Time for Loss: 3 days
Average Time for Win: 16 days
5 Day:
Number of Trades: 69
Gross Return: 1614.9 %
CAGR Return: 26.7 %
Max Drawdown: 5.7 %
Profit Factor (Expectancy): 10.451
Average Loss: 3.64 %
Average Win: 81.17 %
Average Time for Loss: 15 days
Average Time for Win: 85 days
Analysis:
The strategy is typical amongst trend following strategies with a less regular win rate, but where profits are more significant than losses. Most of the losses are in sideways, low volatility markets. This strategy performs better on higher timeframes, where it shows a positive expectancy of the strategy.
The average win was positively impacted by Bitcoin’s earlier smaller market cap, as the percentage wins earlier were higher.
Overall the strategy shows potential for further development and may be suitable for walk-forward testing and out of sample analysis to be considered for a demo trading account.
Note in an actual trading setup, you may wish to use this with volatility filters, combined with support resistance zones for a better setup.
As always, this post/indicator/strategy is not financial advice, and please do your due diligence before trading this live.
Original indicator links:
On chart version -
Oscillator version -
Update - 27/06/2022
Unfortunately, It appears that the original script had been taken down due to auto-moderation because of concerns with no slippage / commission. I have since adjusted the backtest, and re-uploaded to include the following to address these concerns, and show that I am genuinely trying to give back to the community and not mislead anyone:
1) Include commission of 0.1% - to match Binance's maker fees prior to moving to a fee-less model.
2) Include slippage of 10 ticks (This is a realistic slippage figure from searching online for most crypto exchanges)
3) Adjust account balance to 10,000 - since most of us are not millionaires.
The rest of the backtesting parameters are comparable to previous results:
Backtesting parameters:
Initial capital: 10000 dollars
Position size: 10% of equity
Long stop: 2% below entry
Short stop: 2% above entry
Repainting: Off
Smoothing: SMA
Period: 10
Slippage: 10 ticks
Commission: 0.1%
This script still remains to shows viability / profitablity on higher term timeframes (with slightly higher drawdown), and I have included the backtest report below to document my findings:
8 Hour:
Number of Trades: 1082
Gross Return: 233.02%
CAGR Return: 14.04 %
Max Drawdown: 7.9 %
Win percentage: 25.6%
Profit Factor (Expectancy): 1.627
Average Loss: 0.46 %
Average Win: 2.18 %
Average Time for Loss: 1.33 day
Average Time for Win: 7.33 days
Once again, please do your own research and due dillegence before trading this live. This post is for education and information purposes only, and should not be taken as financial advice.

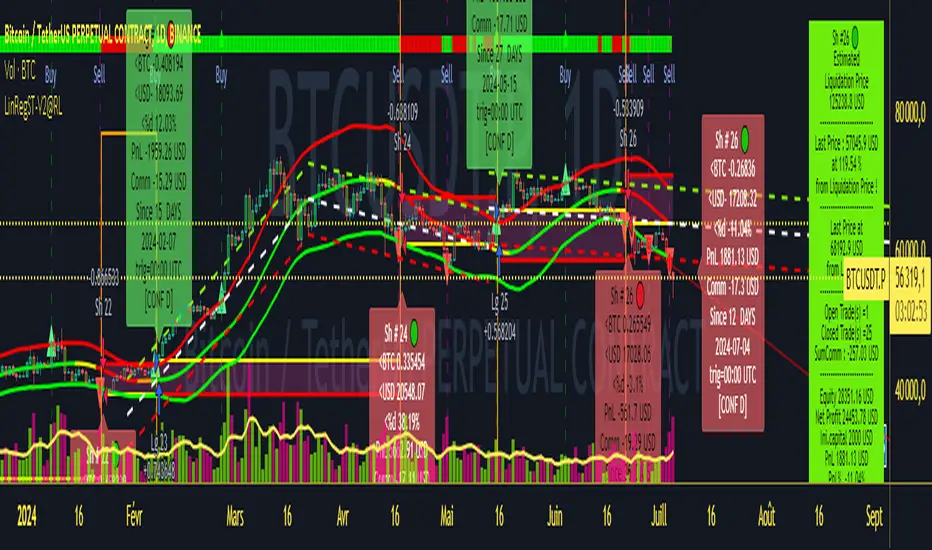
Strategy LinReg ST@RLStrategy LinReg ST@RL
Strategy LinReg ST@RL is a visual trend following indicator.
It is compiled in PINE Script Version V5 language.
This indicator/strategy, based on Linear Regression Calculation, is intended to help beginners (and also the more experienced ones) to trade in the right direction of the market trend and test strategy. It allows you to avoid the mistakes of always trading against the trend.
Strategy based on an original idea of @KivancOzbilgic (SuperTrend) and DevLucem (@LucemAnb) (Lin Reg ++)
A special credit goes to - KivancOzbilgic and @LucemAnb which inspired me a lot to improve this indicator/Strategy.
This indicator can be configured to your liking,according to your needs or your tastes.
The indicator/Strategy works in multi time frame.
The settings (length, offset, deviation, smoothing) are identical for all time frames if “Conf Auto” is not checked.
In this case the default settings (time frame=H1 settings) apply for all time frames.
The choice of source setting is common for all time frames.
If “Auto Conf” is checked,
then the settings will be optimized for each selected time frame (1m-3m H2 H3 H1 H4 & Daily). Time frames, other than 1m-3m H2 H3 H1 H4 & Daily will be affected with the default settings corresponding to the H1 time frame and will therefore not be optimized! The default setting values of each time frame (1m-3m H2 H3 H1 H4 & Daily) can be configured differently and optimized by you.
REVERSAL mode: Signal Buy=Sell and Signal Sell=Buy.
This option may be better than the regular strategy. Default mode is Reversal option.
Note that only for 1m (1 minute) Time frame, the option REVERSAL is opposite as default choice in configuration. (If reversal option is checked, then option for time frame 1m is not reversal!)
Trend indications (potential sell or buy areas) are displayed as a background color (bullish: green or bearish: red), assume that the market is moving in one direction.
You can tune the input, style and visibility settings to match your own preferences or habits.
Label Info (Simple or Full) gives trend info for each Exit (or current trade)
The choice of indicator colors is suitable for a graph with a "dark" theme, which you will probably need to modify for visual comfort, if you are using a "Light" mode or a custom mode.
This script is an indicator that you can run on standard chart types. It also works on non-standard chart types but the results will be skewed and different.
Non-standard charts are:
• Heikin Ashi (HA)
• Renko
• Kagi
• Point & Figure
• Range
As a reminder: No indicator is capable of providing accurate signals 100% of the time. Every now and then, even the best will fail, leaving you with a losing deal. Whichever indicator you base yourself on, remember to follow the basic rules of risk management and capital allocation.
BINANCE:BTCUSDT
! Français !
Strategy LinReg ST@RL
Stratégie LinReg ST@RL est un indicateur visuel de suivi de tendance.
Il est compilé en langage PINE Script Version V5.
Stratégie basée sur une idée originale de @KivancOzbilgic (SuperTrend) et DevLucem (@LucemAnb) (Lin Reg ++) Un crédit spécial va à - KivancOzbilgic et @LucemAnb qui m'ont beaucoup inspiré pour améliorer cet indicateur/stratégie.
Cet indicateur/strategie, basé sur le calcul de régression linéaire, est destiné à aider les débutants (et aussi les plus expérimentés) à trader dans le bon sens de la tendance du marché et à tester la stratégie. Cela vous permet d'éviter les erreurs de toujours négocier à contre-courant.
Cet indicateur peut être configuré à votre guise, selon vos besoins ou vos goûts.
L'indicateur/Stratégie fonctionne sur plusieurs bases de temps.
Les réglages (longueur, décalage, déviation, lissage) sont identiques pour toutes les bases de temps si
« Conf Auto » n'est pas coché. Dans ce cas, les paramètres par défaut (intervalle de temps=paramètres H1) s'appliquent à toutes les bases de temps.
Le choix du réglage de la source est commun à toutes les bases de temps.
Si "Auto Conf" est coché, alors les paramètres seront optimisés pour chaque base de temps sélectionnée (1m-3m H2 H3 H1 H4 & Daily). Les bases de temps, autres que 1m-3m H2 H3 H1 H4 & Daily seront affectées par les paramètres par défaut correspondant à la base de temps H1 et ne seront donc pas optimisées ! Les valeurs de réglage par défaut de chaque période (1m-3m H2 H3 H1 H4 & Daily) peuvent être configurées différemment et optimisées par vous.
Mode REVERSAL : Signal Achat=Vente et Signal Vente=Achat. Cette option peut être meilleure que la stratégie habituelle. Le mode par défaut est l'option REVERSAL.
Notez que seulement pour la base de temps de 1m (1 minute), l'option REVERSAL est l’opposée du choix par défaut dans la configuration. (Si l'option REVERSAL est cochée, alors l'option pour la base de temps 1 m n'est pas REVERSAL !)
Les indications de tendance (zones potentielles de vente ou d'achat) sont affichées en couleur de fond (haussier : vert ou baissier : rouge), supposons que le marché évolue dans une direction. Vous pouvez ajuster les paramètres d'entrée, de style et de visibilité en fonction de vos propres préférences ou habitudes.
Les informations sur l'étiquette (simples ou complètes) donnent des informations sur de chaque clôture (ou position en cours)
Le choix des couleurs des indicateurs est adapté à un graphique avec un thème "sombre", qu'il vous faudra probablement modifier pour le confort visuel, si vous utilisez un mode "Clair" ou un mode personnalisé.
Ce script est un indicateur que vous pouvez exécuter sur des types de graphiques standard. Cela fonctionne également sur les types de graphiques non standard, mais les résultats seront faussés et différents.
Les graphiques non standard sont :
• Heikin Ashi (HA)
• Renko
• Kagi
• Point & Figure
• Range
Pour rappel : Aucun indicateur n'est capable de fournir des signaux précis 100% du temps. De temps en temps, même les meilleurs échoueront, vous laissant avec une affaire perdante. Quel que soit l'indicateur sur lequel vous vous basez, rappelez-vous de suivre les règles de base de la gestion des risques et de l'allocation du capital.
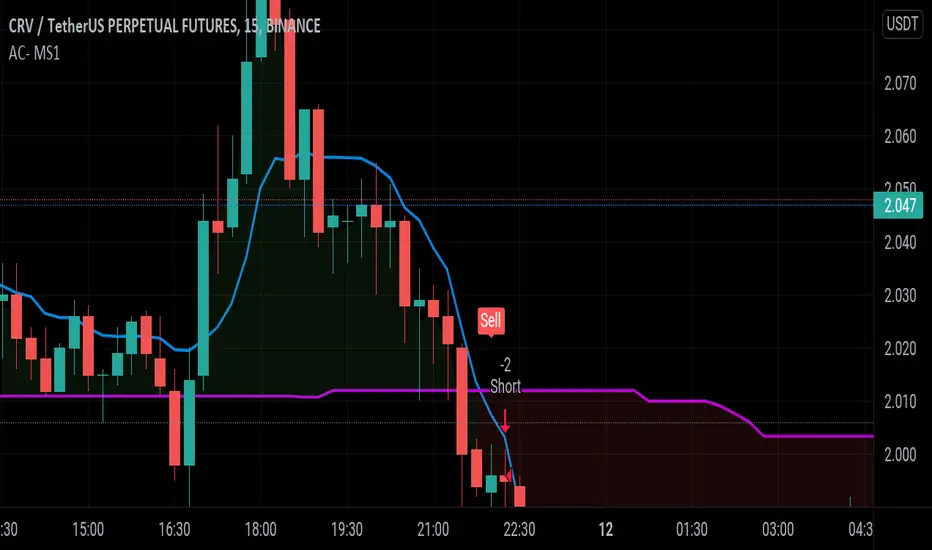
AC- MY SCRIPT1My Ac- My Scrpt1 that the BUY and SELL signals (trend reversals) for many coins defined different tickers in Tradingview charts
Terminology explanation:
Confirmed Reversal: Oxford T reversal that happened in the last bar and cannot be repainted.
Potential Reversal: Oxford T reversal that might happen in the current bar but can also not happen depending upon the timeframe closing price.
Downtrend: Tickers that are currently in the sell zone
Uptrend: Tickers that are currently in the buy zone
List and show has also got a built in Oxford T indicator which users can confirm the reversals on graphs.
Screener explores the 40 tickers in current graph's time frame and also in desired parameters of the OTT indicator.
Also you can optimize the parameters manually with the built in STRATEGY version.
Built in Moving Average type defaultly set as VAR but users can choose from 8 different Moving Average types like:
SMA : Simple Moving Average
EMA : Exponential Movin Average
WMA : Weighted Moving Average
TMA : Triangular Moving Average
VAR : Variable Index Dynamic Moving Average aka VIDYA
WWMA : Welles Wilder's Moving Average
ZLEMA : Zero Lag Exponential Moving Average
TSF : True Strength Force
Tip: In sideways VAR would be a good choice
You can use OxforfT default alarms and Buy Sell signals like:
1-
BUY when Prices are above OxfordT
SELL when Prices are below OxfordT
2-
BUY when OxfordT support Line crosses over OoxfordT line.
SELL when OxfordT support Line crosses under OxfordT line.
3-
BUY when OxfordT line is Green and makes higher highs.
SELL when OxfordT line is Red and makes lower lows.
IMPORTANT: SCREENER ONLY EXPLORES AND SCREENS FOR THE 2nd SIGNAL TYPE:
BUY when OxfordT support Line crosses over OxfordT line.
SELL when OxfordT support Line crosses under OxfordT line.
STR:EMA Oscilator [Azzrael]Strategy based on EMA and EMA Oscilator
(EMA - close) + Std Dev + Factor = detecting oversell/overbuy
Long only!
Pyramiding - sometimes, depends on ...
There're 2 enter strategies in one script:
1 - Classic, buy on entering to OverSell zone (more profitable ~> 70%)
2 - Crazy, buy on entering to OverBuy zone (catching trend and pyramiding, more net profit)
Exit - crossing zero of (EMA - close)

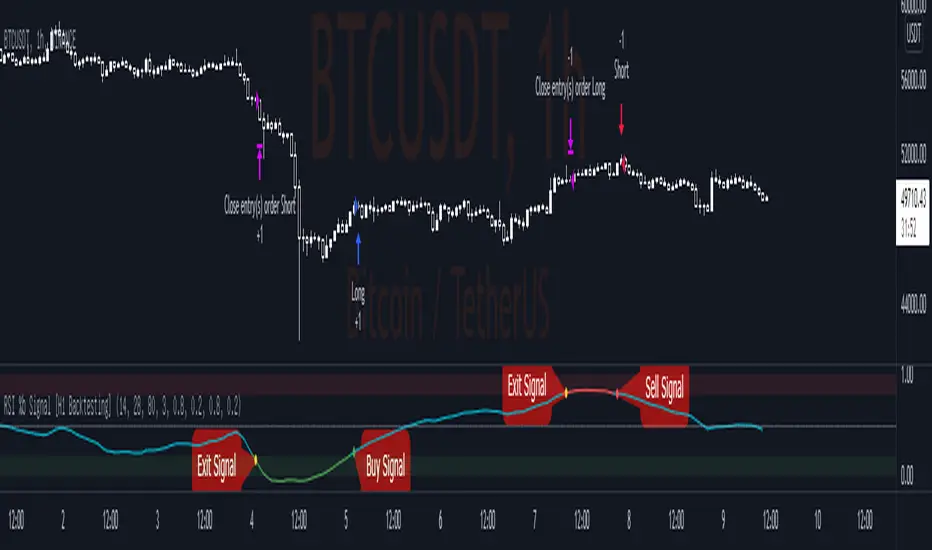
RSI %b Signal [H1 Backtesting]-----------------------------------------------------------------
This simple strategy base on RSI, EMA, Bollinger Bands to get Buy and Sell Signal with detail as below:
-----------------------------------------------------------------
1.Define Oscillator Line
+ Oscillator Line is smoothed by ema(28) of RSI(14) on H1 Timeframe
2.Define Overbought and Oversold
+ Apply Bollinger Bands BB(80,3) on Oscillator Line and calculate %b
+ Overbought Zone marked above level 0.8
+ Oversold Zone marked below level 0.2
3.Buy Signal
+ Entry Long Position when %b crossover Point of Entry Long
+ Deafault Point of Entry Long is 0.2
+ Buy signal marked by Green dot
4.Sell Signal
+ Entry Short Position when %b crossunder Point of Entry Short
+ Deafault Point of Entry Short is 0.8
+ Sell signal marked by Red dot
5.Exit Signal
+ Exit Position (both Long and Short) when %b go into Overbought Zone or Oversold Zone
+ Exit signal marked by Yellow dot
-----------------------------------------------------------------
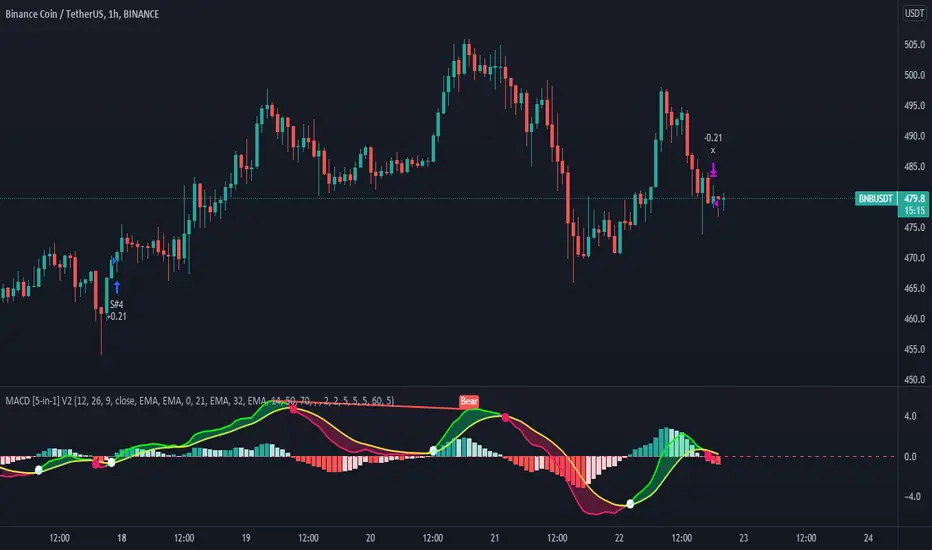
MACD 5 iN 1 [Pro-Tool]introducing MACD Which has different indicators inside,
And not only that, five different strategies have also been included in this indicator.
Strategy №1:👉 MACD Crossover Signal Line
Strategy №2:👉 MACD Crossover + MACD Overbought Section (for ignore false Crossover signals)
Strategy №3:👉 MACD Crossover + Market Close should b greater tha MOVING AVERAGE
Strategy №4:👉 MACD Crossover + Market Close should b greater tha MOVING AVERAGE ZONE
Strategy №5:👉 MACD Crossover + RSI Close should b greater tha 50 Level (or whatever level you choose)
also 5 types of MOVING AVERAGE you can choose
1: Simple Moving Average ( SMA )
2: Exponential Moving Average ( EMA )
3: Weighted Moving Average ( WMA )
4: Volume Weighted Moving Average ( VWMA )
5: Relative Moving Average (RMA)
and you can customize MACD Colors + Widths + Signals and MACD lines, and also can Hide or Unhide Histogram / Cross Sign / MACD Zone Color
hope so you like it, 🥰
Investing and trading in cryptocurrencies is very risky, as anything can happen at any time.
***NOT FINANCIAL, LEGAL, OR TAX ADVICE! JUST OPINION! I AM NOT AN EXPERT! I DO NOT GUARANTEE A PARTICULAR OUTCOME I HAVE NO INSIDE KNOWLEDGE! YOU NEED TO DO YOUR OWN RESEARCH AND MAKE YOUR OWN DECISIONS! THIS IS JUST EDUCATION & ENTERTAINMENT! USE ALTCOIN DAILY AS A STARTING OFF POINT!
[KL] Double Bollinger Bands Strategy (for Crypto/FOREX)This strategy uses a setup consisting of two Bollinger Bands based on the 20 period 20-SMA +/-
(a) upper/lower bands of two standard deviations apart, and
(b) upper/lower bands of one standard deviation apart.
We consider price at +/- one standard deviation apart from 20-SMA as the "Neutral Zone".
If price closes above Neutral Zone after a period of consolidation, then it's an opportunity for entry. Strategy will long, anticipating for breakout.
The illustration below shows price closing above the Neutral Zone after a period of consolidation.
a.c-dn.net
Position is exited when prices closes at Neutral Zone (being lower than prior bars)

Crypto RSI with RVI StrategyThis is a long only strategy adapted for crypto market.
Its idea is to take the most juice out of a long trend and cut the losses as soon as possible.
For this , its components are RSI with a very big length - 100 or 200 preferably and RVI.
Rules for entry
If RVI is in the buy zone and we have a crossover from RSI with the overbought level.
Rules for exit
With change condition : If RVI is in the sell zone and we have a cross under from RSI with the oversold level.
With stop loss : we have a SL based on movement in % of the price, recommendable between 5-10%.
If you have any questions let me know !

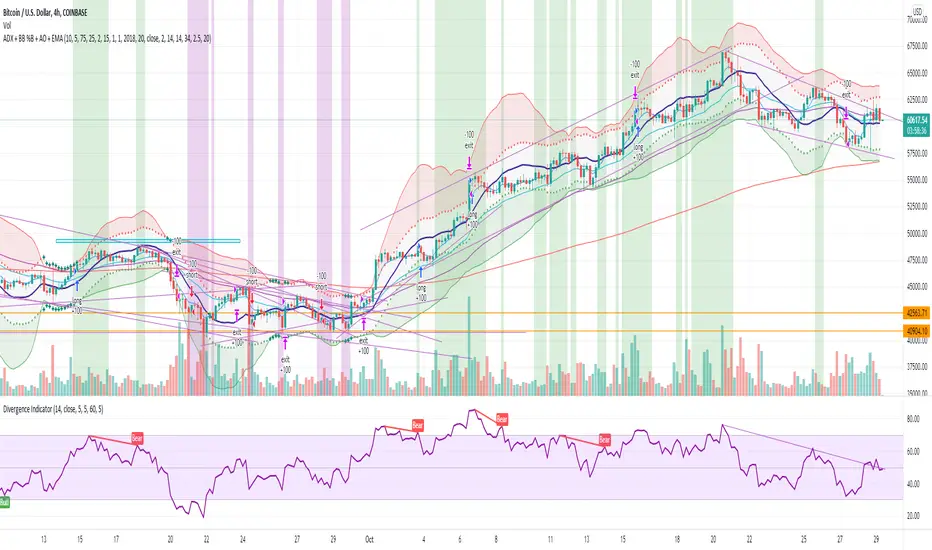
ADX + BB %B + AO + EMA [Luca Massuda]This trading strategy combines different indicators:
1) ADX, Average Directional Movement: to spot the trend
2) BB %B Bollinger Band %B: to spost relative price position to Bollinger Bands
3) AO Awesome Oscillator: to spot momentum
4) ema 5,ema21, ema50, ema200: to decide long or short position
You can configure:
Take profit % : at which % gains to take profit from the entry price
Stop loss % : at which % stop loss from the entry price
BB %B Overbought: At which level you consider Overbought respect to Bollinger Bands (values 0 to 100)
BB %B Oversold: At which level you consider Oversold respect to Bollinger Bands (values 0 to 100)
Awesome Oscillator: AO level to consider a long or short position +/- 2
ADX: ADX value to consider a long or short position
Start Date, Month, Year: Starting point for a backtesting strategy
Lenght , Source , Standard Deviation: Bollinger Bands values
ADX smoothing, DI Lenght: ADX values
Green and purple zones indicate when the strategy can go long or short.
Default Long conditions:
ema5>ema21 and ema50>ema200 and bb>75% and ao>2 and adx>15
Default Short conditions:
ema515
Swing High Low Price Channel V.1You should buy/sell small order at small plot zone or after small plot. And, Buy/sell big order at big plot zone or after big plot.
Recommended, You should use this with Fibonacci Retracement, Price Action or Graph Pattern.

Strategy - DMI Indicator with DPO Indicator as a GuardThe Directional Movement Index Indicator is one of my favorite indicators in tradingview's built-in library. It is free to use for all
For more information on what the DMI is, please visit: www.tradingview.com
The only problem I've come across with the DMI is that when it hits a 'trade range zone' it triggers false new trends (this is the case with almost every indicator I've ever tested).
This script modifies the DMI by removing the need for the ADX logic. It only focuses on the +DI and the -DI.
In order to remove the 'noise' generated during a trade range zone I have added another powerful indicator called the Detrended Price Oscillator.
The DPO is also a 'built-in' indicator on tradingview. www.tradingview.com
The DPO is used in conjunction with the DMI to stop trade ranges from wrecking your profits.
This strategy logic simply checks for the DMI indicator to cross itself. If the +DI crosses over the -DI this is a bullish cross and visa versa, if the -DI crosses over the +DI then it could mean bearish sentiment is building.
But then strategy logic uses the DPO to check if the DPO is above 0 or below 0 value
If the +DI crosses over the -DI and the DPO is above 0 value, then it's a Long entry point.
However, if the +DI crosses over the -DI and the DPO is below 0 value, then the Long signal is void.
And visa versa, if the -DI crosses over the +DI and the DPO is below 0 value, then it's a Short entry point (unless the DPO is greater than 0)
With this DPO 'guard' in place, it helps us keep the total trades executed to a minimum.
This is vital to push through trade ranges that can wreck your profit potential.
I wish I could create a better plotting mechanism for this indicator so you can better see the visuals. But combining the DMI to scale with the DPO is not possible.
The best solution is to simply add another DMI indicator to your chart so you can compare the DMI to this script that is dominated by the DPO (yellow line).
Enjoy! Likes are much appreciated!
