The Lazy Trader - Index (ETF) Trend Following Robot50/150 moving average, index (ETF) trend following robot. Coded for people who cannot psychologically handle dollar-cost-averaging through bear markets and extreme drawdowns (although DCA can produce better results eventually), this robot helps you to avoid bear markets. Be a fair-weathered friend of Mr Market, and only take up his offer when the sun is shining! Designed for the lazy trader who really doesn't care...
Recommended Chart Settings:
Asset Class: ETF
Time Frame: Daily
Necessary ETF Macro Conditions:
a) Country must have healthy demographics, good ratio of young > old
b) Country population must be increasing
c) Country must be experiencing price-inflation
Default Robot Settings:
Slow Moving Average: 50 (integer) //adjust to suit your underlying index
Fast Moving Average: 150 (integer) //adjust to suit your underlying index
Bullish Slope Angle: 5 (degrees) //up angle of moving averages
Bearish Slope Angle: -5 (degrees) //down angle of moving averages
Average True Range: 14 (integer) //input for slope-angle formula
Risk: 100 (%) //100% risk means using all equity per trade
ETF Test Results (Default Settings):
SPY (1993 to 2020, 27 years), 332% profit, 20 trades, 6.4 profit factor, 7% drawdown
EWG (1996 to 2020, 24 years), 310% profit, 18 trades, 3.7 profit factor, 10% drawdown
EWH (1996 to 2020, 24 years), 4% loss, 26 trades, 0.9 profit factor, 36% drawdown
QQQ (1999 to 2020, 21 years), 232% profit, 17 trades, 3.6 profit factor, 2% drawdown
EEM (2003 to 2020, 17 years), 73% profit, 17 trades, 1.1 profit factor, 3% drawdown
GXC (2007 to 2020, 13 years), 18% profit, 14 trades, 1.3 profit factor, 26% drawdown
BKF (2009 to 2020, 11 years), 11% profit, 13 trades, 1.2 profit factor, 33% drawdown
A longer time in the markets is better, with the exception of EWH. 6 out of 7 tested ETFs were profitable, feel free to test on your favourite ETF (default settings) and comment below.
Risk Warning:
Not tested on commodities nor other financial products like currencies (code will not work), feel free to leave comments below.
Moving Average Slope Angle Formula:
Reproduced and modified from source:
Search in scripts for "科创50"

50-Minute Opening Range BreakoutThis is a test of the opening range with Bearish/Bullish confirmation

50-Line Oscillator // (\_/)
// ( •.•)
// (")_(")
25-Line Oscillator
Description:
The 25-Line Oscillator is a sophisticated technical analysis tool designed to visualize market trends through the use of multiple Simple Moving Averages (SMAs). This indicator computes a series of 26 SMAs, incrementally increasing the base length, providing traders with a comprehensive view of price dynamics.
Features:
Customizable Base Length: Adjust the base length of the SMAs according to trading preferences, enhancing versatility for different market conditions.
Rainbow Effect: The indicator employs a visually appealing rainbow color scheme to differentiate between the various trend lines, making it easy to identify crossovers and momentum shifts.
Crossovers Detection: The script includes logic to detect crossover events between consecutive trend lines, which can serve as signals for potential entry or exit points in trading.
Clear Visualization: Suitable for both novice and seasoned traders, the plots enable quick interpretation of trends and market behavior.
How to Use:
Add the indicator to your chart and customize the base length as desired.
Observe the rainbow-colored lines for trend direction.
Look for crossover events between the SMAs as potential trading signals.
Application: This indicator is particularly useful for swing traders and trend followers who aim to capitalize on market momentum and identify reversals. By monitoring the behavior of multiple SMAs, traders can gain insights into the strength and direction of price movements over various time frames.


AK Simple Moving Average 50 days Simple Moving average suitable for Intraday on 1Hr,30Min.15Min Time frames
1. When candle crossing above SMA Line - Go for Long Entries
2. When candle crossing below SMA Line - Go for short Entries
50 SMA / 200 EMA / 128EMA Moving Average CrossFound success using 50SMA vs 200EMA.
128 EMA also charted for it's BTC relevance.


50/100/200 Moving Averages (Pine Script For Copy)by fresca
SCRIPT LANGUAGE
Copy script below and adjust based on your preferences.
-function (change function from "sma" to "ema", "wma" and more)
-length (25 Day, 150 Day or add more averages to the three in this script.)
-color, (red, yellow, etc. or use color hex codes i.e. #FEDA15, #FFAD8F, etc.)
-transparency (set to desired level 1-100)
Or add more options.
RESOURCES
Color hex codes site: www.canva.com
Trading View Pine Script Editor Reference Guide: www.tradingview.com

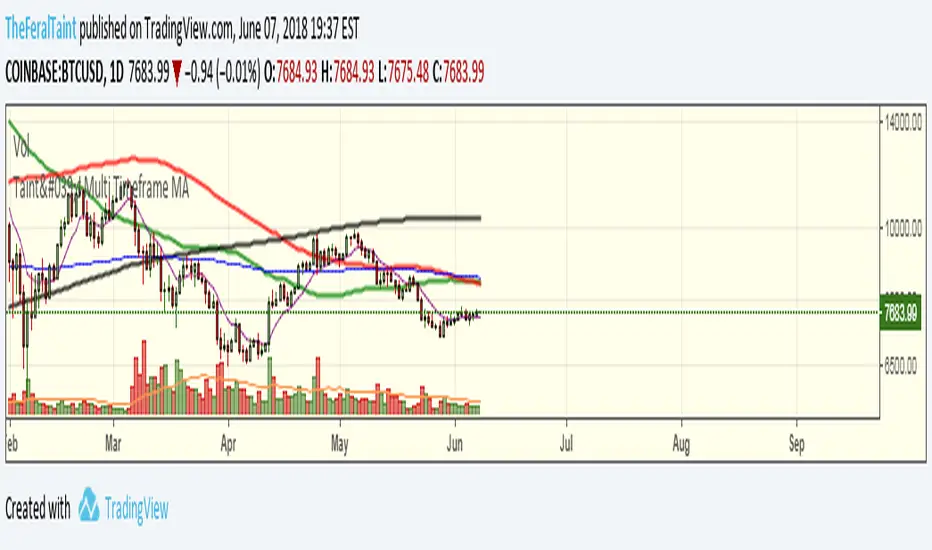
Taint's Multi Time Frame MA50-100-200 SMA with two 200 EMA's all with the ability choose a time frame for each.


Power Balance ForecasterHey trader buddy! Remember the old IBM 5150 on Wall Street back in the 80s? :) Well, I wanted to pay tribute to it with this retro-style code when MS DOS and CRT screens were the cutting edge of technology...
Analysis of the balance of power between buyers and sellers with price predictions
What This Indicator Does
The Power Balance Forecaster indicator analyzes the relationship between buyer and seller strength to predict future price movements. Here's what it does in detail:
Main Features:
Power Balance Analysis: Calculates real-time percentage of buyer power vs seller power
Price Predictions: Estimates next closing level based on current momentum
Market State Detection: Identifies 5 different market conditions
Visual Signals: Shows directional arrows and price targets
How the Trading Logic Works
Power Balance Calculation:
Analyzes Consecutive Bars - Counts consecutive bullish and bearish bars
Calculates Momentum - Uses ATR-normalized momentum to measure trend strength
Determines Market State - Assigns one of 5 market states based on conditions
Market States:
Bull Control: Strong uptrend (75% buyer power)
Bear Control: Strong downtrend (75% seller power)
Buying Pressure: Bullish pressure (65% buyer power)
Selling Pressure: Bearish pressure (65% seller power)
Balance Area: Market in equilibrium (50/50)
Prediction System:
Bullish Condition: Buyer power > 55% + Positive momentum = Bullish prediction
Bearish Condition: Seller power > 55% + Negative momentum = Bearish prediction
Price Target: Based on ATR multiplied by timeframe factor
Configurable Parameters:
Analysis Sensitivity (5-50): Controls how responsive the indicator is
Low values (5-15): More sensitive, ideal for scalping
High values (30-50): More stable, ideal for swing trading
Table Position: Choose from 9 positions to display the data table
Trading Signals:
Green Triangle ▲: Bullish signal, price expected to increase
Green Triangle ▼: Bearish signal, price expected to decrease
Dashed Line: Shows the price target projection
Label: Displays the exact target value
Recommended Timeframes:
Lower Timeframes (1-15 minutes):
Sensitivity: 10-20
Automatic Low TF mode
Higher Timeframes (1 hour - 1 day):
Sensitivity: 25-40
Automatic High TF mode
Important Notes:
Always use this indicator in combination with:
Market context analysis
Proper risk management
Confirmation from other indicators
Mandatory stop losses
The indicator works best in trending markets and may be less effective during extreme consolidation periods.

Multi SMA + Golden/Death + Heatmap + BB**Multi SMA (50/100/200) + Golden/Death + Candle Heatmap + BB**
A practical trend toolkit that blends classic 50/100/200 SMAs with clear crossover labels, special 🚀 Golden / 💀 Death Cross markers, and a readable candle heatmap based on a dynamic regression midline and volatility bands. Optional Bollinger Bands are included for context.
* See trend direction at a glance with SMAs.
* Get minimal, de-cluttered labels on important crosses (50↔100, 50↔200, 100↔200).
* Highlight big regime shifts with special Golden/Death tags.
* Read momentum and volatility with the candle heatmap.
* Add Bollinger Bands if you want classic mean-reversion context.
Designed to be lightweight, non-repainting on confirmed bars, and flexible across timeframes.
# What This Indicator Does (plain English)
* **Tracks trend** using **SMA 50/100/200** and lets you optionally compute each SMA on a higher or different timeframe (HTF-safe, no lookahead).
* **Prints labels** when SMAs cross each other (up or down). You can force signals only after bar close to avoid repaint.
* **Marks Golden/Death Crosses** (50 over/under 200) with special labels so major regime changes stand out.
* **Colors candles** with a **heatmap** built from a regression midline and volatility bands—greenish above, reddish below, with a smooth gradient.
* **Optionally shows Bollinger Bands** (basis SMA + stdev bands) and fills the area between them.
* **Includes alert conditions** for Golden and Death Cross so you can automate notifications.
---
# Settings — Simple Explanations
## Source
* **Source**: Price source used to calculate SMAs and Bollinger basis. Default: `close`.
## SMA 50
* **Show 50**: Turn the SMA(50) line on/off.
* **Length 50**: How many bars to average. Lower = faster but noisier.
* **Color 50** / **Width 50**: Visual style.
* **Timeframe 50**: Optional alternate timeframe for SMA(50). Leave empty to use the chart timeframe.
## SMA 100
* **Show 100**: Turn the SMA(100) line on/off.
* **Length 100**: Bars used for the mid-term trend.
* **Color 100** / **Width 100**: Visual style.
* **Timeframe 100**: Optional alternate timeframe for SMA(100).
## SMA 200
* **Show 200**: Turn the SMA(200) line on/off.
* **Length 200**: Bars used for the long-term trend.
* **Color 200** / **Width 200**: Visual style.
* **Timeframe 200**: Optional alternate timeframe for SMA(200).
## Signals (crossover labels)
* **Show crossover signals**: Prints triangle labels on SMA crosses (50↔100, 50↔200, 100↔200).
* **Wait for bar close (confirmed)**: If ON, signals only appear after the candle closes (reduces repaint).
* **Min bars between same-pair signals**: Minimum spacing to avoid duplicate labels from the same SMA pair too often.
* **Trend filter (buy: 50>100>200, sell: 50<100<200)**: Only show bullish labels when SMAs are stacked bullish (50 above 100 above 200), and only show bearish labels when stacked bearish.
### Label Offset
* **Offset mode**: Choose how to push labels away from price:
* **Percent**: Offset is a % of price.
* **ATR x**: Offset is ATR(14) × multiplier.
* **Percent of price (%)**: Used when mode = Percent.
* **ATR multiplier (for ‘ATR x’)**: Used when mode = ATR x.
### Label Colors
* **Bull color** / **Bear color**: Background of triangle labels.
* **Bull label text color** / **Bear label text color**: Text color inside the triangles.
## Golden / Death Cross
* **Show 🚀 Golden Cross (50↑200)**: Show a special “Golden” label when SMA50 crosses above SMA200.
* **Golden label color** / **Golden text color**: Styling for Golden label.
* **Show 💀 Death Cross (50↓200)**: Show a special “Death” label when SMA50 crosses below SMA200.
* **Death label color** / **Death text color**: Styling for Death label.
## Candle Heatmap
* **Enable heatmap candle colors**: Turns the heatmap on/off.
* **Length**: Lookback for the regression midline and volatility measure.
* **Deviation Multiplier**: Band width around the midline (bigger = wider).
* **Volatility basis**:
* **RMA Range** (smoothed high-low range)
* **Stdev** (standard deviation of close)
* **Upper/Middle/Lower color**: Gradient colors for the heatmap.
* **Heatmap transparency (0..100)**: 0 = solid, 100 = invisible.
* **Force override base candles**: Repaint base candles so heatmap stays visible even if your chart has custom coloring.
## Bollinger Bands (optional)
* **Show Bollinger Bands**: Toggle the overlay on/off.
* **Length**: Basis SMA length.
* **StdDev Multiplier**: Distance of bands from the basis in standard deviations.
* **Basis color** / **Band color**: Line colors for basis and bands.
* **Bands fill transparency**: Opacity of the fill between upper/lower bands.
---
# Features & How It Works
## 1) HTF-Safe SMAs
Each SMA can be calculated on the chart timeframe or a higher/different timeframe you choose. The script pulls HTF values **without lookahead** (non-repainting on confirmed bars).
## 2) Crossover Labels (Three Pairs)
* **50↔100**, **50↔200**, **100↔200**:
* **Triangle Up** label when the first SMA crosses **above** the second.
* **Triangle Down** label when it crosses **below**.
* Optional **Trend Filter** ensures only signals aligned with the overall stack (50>100>200 for bullish, 50<100<200 for bearish).
* **Debounce** spacing avoids repeated labels for the same pair too close together.
## 3) Golden / Death Cross Highlights
* **🚀 Golden Cross**: SMA50 crosses **above** SMA200 (often a longer-term bullish regime shift).
* **💀 Death Cross**: SMA50 crosses **below** SMA200 (often a longer-term bearish regime shift).
* Separate styling so they stand out from regular cross labels.
## 4) Candle Heatmap
* Builds a **regression midline** with **volatility bands**; colors candles by their position inside that channel.
* Smooth gradient: lower side → reddish, mid → yellowish, upper side → greenish.
* Helps you see momentum and “where price sits” relative to a dynamic channel.
## 5) Bollinger Bands (Optional)
* Classic **basis SMA** ± **StdDev** bands.
* Light visual context for mean-reversion and volatility expansion.
## 6) Alerts
* **Golden Cross**: `🚀 GOLDEN CROSS: SMA 50 crossed ABOVE SMA 200`
* **Death Cross**: `💀 DEATH CROSS: SMA 50 crossed BELOW SMA 200`
Add these to your alerts to get notified automatically.
---
# Tips & Notes
* For fewer false positives, keep **“Wait for bar close”** ON, especially on lower timeframes.
* Use the **Trend Filter** to align signals with the broader stack and cut noise.
* For HTF context, set **Timeframe 50/100/200** to higher frames (e.g., H1/H4/D) while you trade on a lower frame.
* Heatmap “Length” and “Deviation Multiplier” control smoothness and channel width—tune for your asset’s volatility.

RSI Overbought/Oversold + Divergence Indicator (new)//@version=5
indicator('CryptoSignalScanner - RSI Overbought/Oversold + Divergence Indicator (new)',
//---------------------------------------------------------------------------------------------------------------------------------
//--- Define Colors ---------------------------------------------------------------------------------------------------------------
//---------------------------------------------------------------------------------------------------------------------------------
vWhite = #FFFFFF
vViolet = #C77DF3
vIndigo = #8A2BE2
vBlue = #009CDF
vGreen = #5EBD3E
vYellow = #FFB900
vRed = #E23838
longColor = color.green
shortColor = color.red
textColor = color.white
bullishColor = color.rgb(38,166,154,0) //Used in the display table
bearishColor = color.rgb(239,83,79,0) //Used in the display table
nomatchColor = color.silver //Used in the display table
//---------------------------------------------------------------------------------------------------------------------------------------------------------------------
//--- Functions--------------------------------------------------------------------------------------------------------------------------------------------------------
//---------------------------------------------------------------------------------------------------------------------------------------------------------------------
TF2txt(TF) =>
switch TF
"S" => "RSI 1s:"
"5S" => "RSI 5s:"
"10S" => "RSI 10s:"
"15S" => "RSI 15s:"
"30S" => "RSI 30s"
"1" => "RSI 1m:"
"3" => "RSI 3m:"
"5" => "RSI 5m:"
"15" => "RSI 15m:"
"30" => "RSI 30m"
"45" => "RSI 45m"
"60" => "RSI 1h:"
"120" => "RSI 2h:"
"180" => "RSI 3h:"
"240" => "RSI 4h:"
"480" => "RSI 8h:"
"D" => "RSI 1D:"
"1D" => "RSI 1D:"
"2D" => "RSI 2D:"
"3D" => "RSI 2D:"
"3D" => "RSI 3W:"
"W" => "RSI 1W:"
"1W" => "RSI 1W:"
"M" => "RSI 1M:"
"1M" => "RSI 1M:"
"3M" => "RSI 3M:"
"6M" => "RSI 6M:"
"12M" => "RSI 12M:"
//---------------------------------------------------------------------------------------------------------------------------------------------------------------------
//--- Show/Hide Settings ----------------------------------------------------------------------------------------------------------------------------------------------
//---------------------------------------------------------------------------------------------------------------------------------------------------------------------
rsiShowInput = input(true, title='Show RSI', group='Show/Hide Settings')
maShowInput = input(false, title='Show MA', group='Show/Hide Settings')
showRSIMAInput = input(true, title='Show RSIMA Cloud', group='Show/Hide Settings')
rsiBandShowInput = input(true, title='Show Oversold/Overbought Lines', group='Show/Hide Settings')
rsiBandExtShowInput = input(true, title='Show Oversold/Overbought Extended Lines', group='Show/Hide Settings')
rsiHighlightShowInput = input(true, title='Show Oversold/Overbought Highlight Lines', group='Show/Hide Settings')
DivergenceShowInput = input(true, title='Show RSI Divergence Labels', group='Show/Hide Settings')
//---------------------------------------------------------------------------------------------------------------------------------------------------------------------
//--- Table Settings --------------------------------------------------------------------------------------------------------------------------------------------------
//---------------------------------------------------------------------------------------------------------------------------------------------------------------------
rsiShowTable = input(true, title='Show RSI Table Information box', group="RSI Table Settings")
rsiTablePosition = input.string(title='Location', defval='middle_right', options= , group="RSI Table Settings", inline='1')
rsiTextSize = input.string(title=' Size', defval='small', options= , group="RSI Table Settings", inline='1')
rsiShowTF1 = input(true, title='Show TimeFrame1', group="RSI Table Settings", inline='tf1')
rsiTF1 = input.timeframe("15", title=" Time", group="RSI Table Settings", inline='tf1')
rsiShowTF2 = input(true, title='Show TimeFrame2', group="RSI Table Settings", inline='tf2')
rsiTF2 = input.timeframe("60", title=" Time", group="RSI Table Settings", inline='tf2')
rsiShowTF3 = input(true, title='Show TimeFrame3', group="RSI Table Settings", inline='tf3')
rsiTF3 = input.timeframe("240", title=" Time", group="RSI Table Settings", inline='tf3')
rsiShowTF4 = input(true, title='Show TimeFrame4', group="RSI Table Settings", inline='tf4')
rsiTF4 = input.timeframe("D", title=" Time", group="RSI Table Settings", inline='tf4')
rsiShowHist = input(true, title='Show RSI Historical Columns', group="RSI Table Settings", tooltip='Show the information of the 2 previous closed candles')
//---------------------------------------------------------------------------------------------------------------------------------------------------------------------
//--- RSI Input Settings ----------------------------------------------------------------------------------------------------------------------------------------------
//---------------------------------------------------------------------------------------------------------------------------------------------------------------------
rsiSourceInput = input.source(close, 'Source', group='RSI Settings')
rsiLengthInput = input.int(14, minval=1, title='RSI Length', group='RSI Settings', tooltip='Here we set the RSI lenght')
rsiColorInput = input.color(#26a69a, title="RSI Color", group='RSI Settings')
rsimaColorInput = input.color(#ef534f, title="RSIMA Color", group='RSI Settings')
rsiBandColorInput = input.color(#787B86, title="RSI Band Color", group='RSI Settings')
rsiUpperBandExtInput = input.int(title='RSI Overbought Extended Line', defval=80, minval=50, maxval=100, group='RSI Settings')
rsiUpperBandInput = input.int(title='RSI Overbought Line', defval=70, minval=50, maxval=100, group='RSI Settings')
rsiLowerBandInput = input.int(title='RSI Oversold Line', defval=30, minval=0, maxval=50, group='RSI Settings')
rsiLowerBandExtInput = input.int(title='RSI Oversold Extended Line', defval=20, minval=0, maxval=50, group='RSI Settings')
//---------------------------------------------------------------------------------------------------------------------------------------------------------------------
//--- MA Input Settings -----------------------------------------------------------------------------------------------------------------------------------------------
//---------------------------------------------------------------------------------------------------------------------------------------------------------------------
maTypeInput = input.string("EMA", title="MA Type", options= , group="MA Settings")
maLengthInput = input.int(14, title="MA Length", group="MA Settings")
maColorInput = input.color(color.yellow, title="MA Color", group='MA Settings') //#7E57C2
//---------------------------------------------------------------------------------------------------------------------------------------------------------------------
//--- Divergence Input Settings ---------------------------------------------------------------------------------------------------------------------------------------
//---------------------------------------------------------------------------------------------------------------------------------------------------------------------
lbrInput = input(title="Pivot Lookback Right", defval=2, group='RSI Divergence Settings')
lblInput = input(title="Pivot Lookback Left", defval=2, group='RSI Divergence Settings')
lbRangeMaxInput = input(title="Max of Lookback Range", defval=10, group='RSI Divergence Settings')
lbRangeMinInput = input(title="Min of Lookback Range", defval=2, group='RSI Divergence Settings')
plotBullInput = input(title="Plot Bullish", defval=true, group='RSI Divergence Settings')
plotHiddenBullInput = input(title="Plot Hidden Bullish", defval=true, group='RSI Divergence Settings')
plotBearInput = input(title="Plot Bearish", defval=true, group='RSI Divergence Settings')
plotHiddenBearInput = input(title="Plot Hidden Bearish", defval=true, group='RSI Divergence Settings')
//---------------------------------------------------------------------------------------------------------------------------------------------------------------------
//--- RSI Calculation -------------------------------------------------------------------------------------------------------------------------------------------------
//---------------------------------------------------------------------------------------------------------------------------------------------------------------------
rsi = ta.rsi(rsiSourceInput, rsiLengthInput)
rsiprevious = rsi
= request.security(syminfo.tickerid, rsiTF1, [rsi, rsi , rsi ], lookahead=barmerge.lookahead_on)
= request.security(syminfo.tickerid, rsiTF2, [rsi, rsi , rsi ], lookahead=barmerge.lookahead_on)
= request.security(syminfo.tickerid, rsiTF3, [rsi, rsi , rsi ], lookahead=barmerge.lookahead_on)
= request.security(syminfo.tickerid, rsiTF4, [rsi, rsi , rsi ], lookahead=barmerge.lookahead_on)
//---------------------------------------------------------------------------------------------------------------------------------------------------------------------
//--- MA Calculation -------------------------------------------------------------------------------------------------------------------------------------------------
//---------------------------------------------------------------------------------------------------------------------------------------------------------------------
ma(source, length, type) =>
switch type
"SMA" => ta.sma(source, length)
"Bollinger Bands" => ta.sma(source, length)
"EMA" => ta.ema(source, length)
"SMMA (RMA)" => ta.rma(source, length)
"WMA" => ta.wma(source, length)
"VWMA" => ta.vwma(source, length)
rsiMA = ma(rsi, maLengthInput, maTypeInput)
rsiMAPrevious = rsiMA
//---------------------------------------------------------------------------------------------------------------------------------------------------------------------
//--- Stoch RSI Settings + Calculation --------------------------------------------------------------------------------------------------------------------------------
//---------------------------------------------------------------------------------------------------------------------------------------------------------------------
showStochRSI = input(false, title="Show Stochastic RSI", group='Stochastic RSI Settings')
smoothK = input.int(title="Stochastic K", defval=3, minval=1, maxval=10, group='Stochastic RSI Settings')
smoothD = input.int(title="Stochastic D", defval=4, minval=1, maxval=10, group='Stochastic RSI Settings')
lengthRSI = input.int(title="Stochastic RSI Lenght", defval=14, minval=1, group='Stochastic RSI Settings')
lengthStoch = input.int(title="Stochastic Lenght", defval=14, minval=1, group='Stochastic RSI Settings')
colorK = input.color(color.rgb(41,98,255,0), title="K Color", group='Stochastic RSI Settings', inline="1")
colorD = input.color(color.rgb(205,109,0,0), title="D Color", group='Stochastic RSI Settings', inline="1")
StochRSI = ta.rsi(rsiSourceInput, lengthRSI)
k = ta.sma(ta.stoch(StochRSI, StochRSI, StochRSI, lengthStoch), smoothK) //Blue Line
d = ta.sma(k, smoothD) //Red Line
//---------------------------------------------------------------------------------------------------------------------------------------------------------------------
//--- Divergence Settings ------------------------------------------------------------------------------------------------------------------------------------------
//---------------------------------------------------------------------------------------------------------------------------------------------------------------------
bearColor = color.red
bullColor = color.green
hiddenBullColor = color.new(color.green, 50)
hiddenBearColor = color.new(color.red, 50)
//textColor = color.white
noneColor = color.new(color.white, 100)
osc = rsi
plFound = na(ta.pivotlow(osc, lblInput, lbrInput)) ? false : true
phFound = na(ta.pivothigh(osc, lblInput, lbrInput)) ? false : true
_inRange(cond) =>
bars = ta.barssince(cond == true)
lbRangeMinInput <= bars and bars <= lbRangeMaxInput
//---------------------------------------------------------------------------------------------------------------------------------------------------------------------
//--- Define Plot & Line Colors ---------------------------------------------------------------------------------------------------------------------------------------
//---------------------------------------------------------------------------------------------------------------------------------------------------------------------
rsiColor = rsi >= rsiMA ? rsiColorInput : rsimaColorInput
//---------------------------------------------------------------------------------------------------------------------------------------------------------------------
//--- Plot Lines ------------------------------------------------------------------------------------------------------------------------------------------------------
//---------------------------------------------------------------------------------------------------------------------------------------------------------------------
// Create a horizontal line at a specific price level
myLine = line.new(bar_index , 75, bar_index, 75, color = color.rgb(187, 14, 14), width = 2)
bottom = line.new(bar_index , 50, bar_index, 50, color = color.rgb(223, 226, 28), width = 2)
mymainLine = line.new(bar_index , 60, bar_index, 60, color = color.rgb(13, 154, 10), width = 3)
hline(50, title='RSI Baseline', color=color.new(rsiBandColorInput, 50), linestyle=hline.style_solid, editable=false)
hline(rsiBandExtShowInput ? rsiUpperBandExtInput : na, title='RSI Upper Band', color=color.new(rsiBandColorInput, 10), linestyle=hline.style_dashed, editable=false)
hline(rsiBandShowInput ? rsiUpperBandInput : na, title='RSI Upper Band', color=color.new(rsiBandColorInput, 10), linestyle=hline.style_dashed, editable=false)
hline(rsiBandShowInput ? rsiLowerBandInput : na, title='RSI Upper Band', color=color.new(rsiBandColorInput, 10), linestyle=hline.style_dashed, editable=false)
hline(rsiBandExtShowInput ? rsiLowerBandExtInput : na, title='RSI Upper Band', color=color.new(rsiBandColorInput, 10), linestyle=hline.style_dashed, editable=false)
bgcolor(rsiHighlightShowInput ? rsi >= rsiUpperBandExtInput ? color.new(rsiColorInput, 70) : na : na, title="Show Extended Oversold Highlight", editable=false)
bgcolor(rsiHighlightShowInput ? rsi >= rsiUpperBandInput ? rsi < rsiUpperBandExtInput ? color.new(#64ffda, 90) : na : na: na, title="Show Overbought Highlight", editable=false)
bgcolor(rsiHighlightShowInput ? rsi <= rsiLowerBandInput ? rsi > rsiLowerBandExtInput ? color.new(#F43E32, 90) : na : na : na, title="Show Extended Oversold Highlight", editable=false)
bgcolor(rsiHighlightShowInput ? rsi <= rsiLowerBandInput ? color.new(rsimaColorInput, 70) : na : na, title="Show Oversold Highlight", editable=false)
maPlot = plot(maShowInput ? rsiMA : na, title='MA', color=color.new(maColorInput,0), linewidth=1)
rsiMAPlot = plot(showRSIMAInput ? rsiMA : na, title="RSI EMA", color=color.new(rsimaColorInput,0), editable=false, display=display.none)
rsiPlot = plot(rsiShowInput ? rsi : na, title='RSI', color=color.new(rsiColor,0), linewidth=1)
fill(rsiPlot, rsiMAPlot, color=color.new(rsiColor, 60), title="RSIMA Cloud")
plot(showStochRSI ? k : na, title='Stochastic K', color=colorK, linewidth=1)
plot(showStochRSI ? d : na, title='Stochastic D', color=colorD, linewidth=1)
//---------------------------------------------------------------------------------------------------------------------------------------------------------------------
//--- Plot Divergence -------------------------------------------------------------------------------------------------------------------------------------------------
//---------------------------------------------------------------------------------------------------------------------------------------------------------------------
// Regular Bullish
// Osc: Higher Low
oscHL = osc > ta.valuewhen(plFound, osc , 1) and _inRange(plFound )
// Price: Lower Low
priceLL = low < ta.valuewhen(plFound, low , 1)
bullCond = plotBullInput and priceLL and oscHL and plFound
plot(
plFound ? osc : na,
offset=-lbrInput,
title="Regular Bullish",
linewidth=2,
color=(bullCond ? bullColor : noneColor)
)
plotshape(
DivergenceShowInput ? bullCond ? osc : na : na,
offset=-lbrInput,
title="Regular Bullish Label",
text=" Bull ",
style=shape.labelup,
location=location.absolute,
color=bullColor,
textcolor=textColor
)
//------------------------------------------------------------------------------
// Hidden Bullish
// Osc: Lower Low
oscLL = osc < ta.valuewhen(plFound, osc , 1) and _inRange(plFound )
// Price: Higher Low
priceHL = low > ta.valuewhen(plFound, low , 1)
hiddenBullCond = plotHiddenBullInput and priceHL and oscLL and plFound
plot(
plFound ? osc : na,
offset=-lbrInput,
title="Hidden Bullish",
linewidth=2,
color=(hiddenBullCond ? hiddenBullColor : noneColor)
)
plotshape(
DivergenceShowInput ? hiddenBullCond ? osc : na : na,
offset=-lbrInput,
title="Hidden Bullish Label",
text=" H Bull ",
style=shape.labelup,
location=location.absolute,
color=bullColor,
textcolor=textColor
)
//------------------------------------------------------------------------------
// Regular Bearish
// Osc: Lower High
oscLH = osc < ta.valuewhen(phFound, osc , 1) and _inRange(phFound )
// Price: Higher High
priceHH = high > ta.valuewhen(phFound, high , 1)
bearCond = plotBearInput and priceHH and oscLH and phFound
plot(
phFound ? osc : na,
offset=-lbrInput,
title="Regular Bearish",
linewidth=2,
color=(bearCond ? bearColor : noneColor)
)
plotshape(
DivergenceShowInput ? bearCond ? osc : na : na,
offset=-lbrInput,
title="Regular Bearish Label",
text=" Bear ",
style=shape.labeldown,
location=location.absolute,
color=bearColor,
textcolor=textColor
)
//------------------------------------------------------------------------------
// Hidden Bearish
// Osc: Higher High
oscHH = osc > ta.valuewhen(phFound, osc , 1) and _inRange(phFound )
// Price: Lower High
priceLH = high < ta.valuewhen(phFound, high , 1)
hiddenBearCond = plotHiddenBearInput and priceLH and oscHH and phFound
plot(
phFound ? osc : na,
offset=-lbrInput,
title="Hidden Bearish",
linewidth=2,
color=(hiddenBearCond ? hiddenBearColor : noneColor)
)
plotshape(
DivergenceShowInput ? hiddenBearCond ? osc : na : na,
offset=-lbrInput,
title="Hidden Bearish Label",
text=" H Bear ",
style=shape.labeldown,
location=location.absolute,
color=bearColor,
textcolor=textColor
)
//---------------------------------------------------------------------------------------------------------------------------------------------------------------------
//--- Check RSI Lineup ------------------------------------------------------------------------------------------------------------------------------------------------
//---------------------------------------------------------------------------------------------------------------------------------------------------------------------
bullTF = rsi > rsi and rsi > rsi
bearTF = rsi < rsi and rsi < rsi
bullTF1 = rsi1 > rsi1_1 and rsi1_1 > rsi1_2
bearTF1 = rsi1 < rsi1_1 and rsi1_1 < rsi1_2
bullTF2 = rsi2 > rsi2_1 and rsi2_1 > rsi2_2
bearTF2 = rsi2 < rsi2_1 and rsi2_1 < rsi2_2
bullTF3 = rsi3 > rsi3_1 and rsi3_1 > rsi3_2
bearTF3 = rsi3 < rsi3_1 and rsi3_1 < rsi3_2
bullTF4 = rsi4 > rsi4_1 and rsi4_1 > rsi4_2
bearTF4 = rsi4 < rsi4_1 and rsi4_1 < rsi4_2
bbTxt(bull,bear) =>
bull ? "BULLISH" : bear ? "BEARISCH" : 'NO LINEUP'
bbColor(bull,bear) =>
bull ? bullishColor : bear ? bearishColor : nomatchColor
newTC(tBox, col, row, txt, width, txtColor, bgColor, txtHA, txtSize) =>
table.cell(table_id=tBox,column=col, row=row, text=txt, width=width,text_color=txtColor,bgcolor=bgColor, text_halign=txtHA, text_size=txtSize)
//---------------------------------------------------------------------------------------------------------------------------------------------------------------------
//--- Define RSI Table Setting ----------------------------------------------------------------------------------------------------------------------------------------
//---------------------------------------------------------------------------------------------------------------------------------------------------------------------
width_c0 = 0
width_c1 = 0
if rsiShowTable
var tBox = table.new(position=rsiTablePosition, columns=5, rows=6, bgcolor=color.rgb(18,22,33,50), frame_color=color.black, frame_width=1, border_color=color.black, border_width=1)
newTC(tBox, 0,1,"RSI Current",width_c0,color.orange,color.rgb(0,0,0,100),'right',rsiTextSize)
newTC(tBox, 1,1,str.format(" {0,number,#.##} ", rsi),width_c0,vWhite,rsi < 50 ? bearishColor:bullishColor,'left',rsiTextSize)
newTC(tBox, 4,1,bbTxt(bullTF, bearTF),width_c0,vWhite,bbColor(bullTF, bearTF),'center',rsiTextSize)
if rsiShowHist
newTC(tBox, 2,1,str.format(" {0,number,#.##} ", rsi ),width_c0,vWhite,rsi < 50 ? bearishColor:bullishColor,'left',rsiTextSize)
newTC(tBox, 3,1,str.format(" {0,number,#.##} ", rsi ),width_c0,vWhite,rsi < 50 ? bearishColor:bullishColor,'left',rsiTextSize)
if rsiShowTF1
newTC(tBox, 0,2,TF2txt(rsiTF1),width_c0,vWhite,color.rgb(0,0,0,100),'right',rsiTextSize)
newTC(tBox, 1,2,str.format(" {0,number,#.##} ", rsi1),width_c0,vWhite,rsi1 < 50 ? bearishColor:bullishColor,'left',rsiTextSize)
newTC(tBox, 4,2,bbTxt(bullTF1, bearTF1),width_c0,vWhite,bbColor(bullTF1,bearTF1),'center',rsiTextSize)
if rsiShowHist
newTC(tBox, 2,2,str.format(" {0,number,#.##} ", rsi1_1),width_c0,vWhite,rsi1_1 < 50 ? bearishColor:bullishColor,'left',rsiTextSize)
newTC(tBox, 3,2,str.format(" {0,number,#.##} ", rsi1_2),width_c0,vWhite,rsi1_2 < 50 ? bearishColor:bullishColor,'left',rsiTextSize)
if rsiShowTF2
newTC(tBox, 0,3,TF2txt(rsiTF2),width_c0,vWhite,color.rgb(0,0,0,100),'right',rsiTextSize)
newTC(tBox, 1,3,str.format(" {0,number,#.##} ", rsi2),width_c0,vWhite,rsi2 < 50 ? bearishColor:bullishColor,'left',rsiTextSize)
newTC(tBox, 4,3,bbTxt(bullTF2, bearTF2),width_c0,vWhite,bbColor(bullTF2,bearTF2),'center',rsiTextSize)
if rsiShowHist
newTC(tBox, 2,3,str.format(" {0,number,#.##} ", rsi2_1),width_c0,vWhite,rsi2_1 < 50 ? bearishColor:bullishColor,'left',rsiTextSize)
newTC(tBox, 3,3,str.format(" {0,number,#.##} ", rsi2_2),width_c0,vWhite,rsi2_2 < 50 ? bearishColor:bullishColor,'left',rsiTextSize)
if rsiShowTF3
newTC(tBox, 0,4,TF2txt(rsiTF3),width_c0,vWhite,color.rgb(0,0,0,100),'right',rsiTextSize)
newTC(tBox, 1,4,str.format(" {0,number,#.##} ", rsi3),width_c0,vWhite,rsi3 < 50 ? bearishColor:bullishColor,'left',rsiTextSize)
newTC(tBox, 4,4,bbTxt(bullTF3, bearTF3),width_c0,vWhite,bbColor(bullTF3,bearTF3),'center',rsiTextSize)
if rsiShowHist
newTC(tBox, 2,4,str.format(" {0,number,#.##} ", rsi3_1),width_c0,vWhite,rsi3_1 < 50 ? bearishColor:bullishColor,'left',rsiTextSize)
newTC(tBox, 3,4,str.format(" {0,number,#.##} ", rsi3_2),width_c0,vWhite,rsi3_2 < 50 ? bearishColor:bullishColor,'left',rsiTextSize)
if rsiShowTF4
newTC(tBox, 0,5,TF2txt(rsiTF4),width_c0,vWhite,color.rgb(0,0,0,100),'right',rsiTextSize)
newTC(tBox, 1,5,str.format(" {0,number,#.##} ", rsi4),width_c0,vWhite,rsi4 < 50 ? bearishColor:bullishColor,'left',rsiTextSize)
newTC(tBox, 4,5,bbTxt(bullTF4, bearTF4),width_c0,vWhite,bbColor(bullTF4,bearTF4),'center',rsiTextSize)
if rsiShowHist
newTC(tBox, 2,5,str.format(" {0,number,#.##} ", rsi4_1),width_c0,vWhite,rsi4_1 < 50 ? bearishColor:bullishColor,'left',rsiTextSize)
newTC(tBox, 3,5,str.format(" {0,number,#.##} ", rsi4_2),width_c0,vWhite,rsi4_2 < 50 ? bearishColor:bullishColor,'left',rsiTextSize)
//------------------------------------------------------
//--- Alerts -------------------------------------------
//------------------------------------------------------

Breadth Indicators NYSE Percent Above Moving AverageBreadth Indicators NYSE - transmits the processed data from the Barchart provider
NYSE - Breadth Indicators
S&P 500 - Breadth Indicators
DOW - Breadth Indicators
RUSSEL 1000 - Breadth Indicators
RUSSEL 2000 - Breadth Indicators
RUSSEL 3000 - Breadth Indicators
Moving Average - 5, 20, 50, 100, 150, 200
The "Percentage above 50-day SMA" indicator measures the percentage of stocks in the index trading above their 50-day moving average. It is a useful tool for assessing the general state of the market and identifying overbought and oversold conditions.
One way to use the "Percentage above 50-day SMA" indicator in a trading strategy is to combine it with a long-term moving average to determine whether the trend is bullish or bearish. Another way to use it is to combine it with a short-term moving average to identify pullbacks and rebounds within the overall trend.
The purpose of using the "Percentage above 50-day SMA" indicator is to participate in a larger trend with a better risk-reward ratio. By using this indicator to identify pullbacks and bounces, you can reduce the risk of entering trades at the wrong time.
Bull Signal Recap:
150-day EMA of $SPXA50R crosses above 52.5 and remains above 47.50 to set the bullish tone.
5-day EMA of $SPXA50R moves below 40 to signal a pullback
5-day EMA of $SPXA50R moves above 50 to signal an upturn
Bear Signal Recap:
150-day EMA of $SPXA50R crosses below 47.50 and remains below 52.50 to set the bearish tone.
5-day EMA of $SPXA50R moves above 60 to signal a bounce
5-day EMA of $SPXA50R moves below 50 to signal a downturn
Tweaking
There are numerous ways to tweak a trading system, but chartists should avoid over-optimizing the indicator settings. In other words, don't attempt to find the perfect moving average period or crossover level. Perfection is unattainable when developing a system or trading the markets. It is important to keep the system logical and focus tweaks on other aspects, such as the actual price chart of the underlying security.
What do levels above and below 50% signify in the long-term moving average?
A move above 52.5% is deemed bullish, and below 47.5% is deemed bearish. These levels help to reduce whipsaws by using buffers for bullish and bearish thresholds.
How does the short-term moving average work to identify pullbacks or bounces?
When using a 5-day EMA, a move below 40 signals a pullback, and a move above 60 signals a bounce.
How is the reversal of pullback or bounce identified?
A move back above 50 after a pullback or below 50 after a bounce signals that the respective trend may be resuming.
How can you ensure that the uptrend has resumed?
It’s important to wait for the surge above 50 to ensure the uptrend has resumed, signaling improved breadth.
Can the system be tweaked to optimize indicator settings?
While there are various ways to tweak the system, seeking perfection through over-optimizing settings is advised against. It's crucial to keep the system logical and focus tweaks on the price chart of the underlying security.
RUSSIAN \ Русская версия.
Индикатор "Процент выше 50-дневной скользящей средней" измеряет процент акций, торгующихся в индексе выше их 50-дневной скользящей средней. Это полезный инструмент для оценки общего состояния рынка и выявления условий перекупленности и перепроданности.
Один из способов использования индикатора "Процент выше 50-дневной скользящей средней" в торговой стратегии - это объединить его с долгосрочной скользящей средней, чтобы определить, является ли тренд бычьим или медвежьим. Другой способ использовать его - объединить с краткосрочной скользящей средней, чтобы выявить откаты и отскоки в рамках общего тренда.
Цель использования индикатора "Процент выше 50-дневной скользящей средней" - участвовать в более широком тренде с лучшим соотношением риска и прибыли. Используя этот индикатор для выявления откатов и отскоков, вы можете снизить риск входа в сделки в неподходящее время.
Краткое описание бычьего сигнала:
150-дневная ЕМА на уровне $SPXA50R пересекает отметку 52,5 и остается выше 47,50, что задает бычий настрой.
5-дневная ЕМА на уровне $SPXA50R опускается ниже 40, сигнализируя об откате
5-дневная ЕМА на уровне $SPXA50R поднимается выше 50, сигнализируя о росте
Обзор медвежьих сигналов:
150-дневная ЕМА на уровне $SPXA50R пересекает уровень ниже 47,50 и остается ниже 52,50, что указывает на медвежий настрой.
5-дневная ЕМА на уровне $SPXA50R поднимается выше 60, сигнализируя о отскоке
5-дневная ЕМА на уровне $SPXA50 опускается ниже 50, что сигнализирует о спаде
Корректировка
Существует множество способов настроить торговую систему, но графологам следует избегать чрезмерной оптимизации настроек индикатора. Другими словами, не пытайтесь найти идеальный период скользящей средней или уровень пересечения. Совершенство недостижимо при разработке системы или торговле на рынках. Важно поддерживать логику системы и уделять особое внимание другим аспектам, таким как график фактической цены базовой ценной бумаги.
Что означают уровни выше и ниже 50% в долгосрочной скользящей средней?
Движение выше 52,5% считается бычьим, а ниже 47,5% - медвежьим. Эти уровни помогают снизить риски, используя буферы для бычьих и медвежьих порогов.
Как краткосрочная скользящая средняя помогает идентифицировать откаты или отскоки?
При использовании 5-дневной ЕМА движение ниже 40 указывает на откат, а движение выше 60 указывает на отскок.
Как определяется разворот отката или отскока?
Движение выше 50 после отката или ниже 50 после отскока сигнализирует о возможном возобновлении соответствующего тренда.
Как вы можете гарантировать, что восходящий тренд возобновился?
Важно дождаться скачка выше 50, чтобы убедиться в возобновлении восходящего тренда, сигнализирующего о расширении диапазона.
Можно ли настроить систему для оптимизации настроек индикатора?
Хотя существуют различные способы настройки системы, не рекомендуется стремиться к совершенству с помощью чрезмерной оптимизации настроек. Крайне важно сохранить логичность системы и сфокусировать изменения на ценовом графике базовой ценной бумаги.

Parameter Free RSI [InvestorUnknown]The Parameter Free RSI (PF-RSI) is an innovative adaptation of the traditional Relative Strength Index (RSI), a widely used momentum oscillator that measures the speed and change of price movements. Unlike the standard RSI, which relies on a fixed lookback period (typically 14), the PF-RSI dynamically adjusts its calculation length based on real-time market conditions. By incorporating volatility and the RSI's deviation from its midpoint (50), this indicator aims to provide a more responsive and adaptable tool for identifying overbought/oversold conditions, trend shifts, and momentum changes. This adaptability makes it particularly valuable for traders navigating diverse market environments, from trending to ranging conditions.
PF-RSI offers a suite of customizable features, including dynamic length variants, smoothing options, visualization tools, and alert conditions.
Key Features
1. Dynamic RSI Length Calculation
The cornerstone of the PF-RSI is its ability to adjust the RSI calculation period dynamically, eliminating the need for a static parameter. The length is computed using two primary factors:
Volatility: Measured via the standard deviation of past RSI values.
Distance from Midpoint: The absolute deviation of the RSI from 50, reflecting the strength of bullish or bearish momentum.
The indicator offers three variants for calculating this dynamic length, allowing users to tailor its responsiveness:
Variant I (Aggressive): Increases the length dramatically based on volatility and a nonlinear scaling of the distance from 50. Ideal for traders seeking highly sensitive signals in fast-moving markets.
Variant II (Moderate): Combines volatility with a scaled distance from 50, using a less aggressive adjustment. Strikes a balance between responsiveness and stability, suitable for most trading scenarios.
Variant III (Conservative): Applies a linear combination of volatility and raw distance from 50. Offers a stable, less reactive length adjustment for traders prioritizing consistency.
// Function that returns a dynamic RSI length based on past RSI values
// The idea is to make the RSI length adaptive using volatility (stdev) and distance from the RSI midpoint (50)
// Different "variant" options control how aggressively the length changes
parameter_free_length(free_rsi, variant) =>
len = switch variant
// Variant I: Most aggressive adaptation
// Uses standard deviation scaled by a nonlinear factor of distance from 50
// Also adds another distance-based term to increase length more dramatically
"I" => math.ceil(
ta.stdev(free_rsi, math.ceil(free_rsi)) *
math.pow(1 + (math.ceil(math.abs(50 - (free_rsi - 50))) / 100), 2)
) +
(
math.ceil(math.abs(free_rsi - 50)) *
(1 + (math.ceil(math.abs(50 - (free_rsi - 50))) / 100))
)
// Variant II: Moderate adaptation
// Adds the standard deviation and a distance-based scaling term (less nonlinear)
"II" => math.ceil(
ta.stdev(free_rsi, math.ceil(free_rsi)) +
(
math.ceil(math.abs(free_rsi - 50)) *
(1 + (math.ceil(math.abs(50 - (free_rsi - 50))) / 100))
)
)
// Variant III: Least aggressive adaptation
// Simply adds standard deviation and raw distance from 50 (linear scaling)
"III" => math.ceil(
ta.stdev(free_rsi, math.ceil(free_rsi)) +
math.ceil(math.abs(free_rsi - 50))
)
2. Smoothing Options
To refine the dynamic RSI and reduce noise, the PF-RSI provides smoothing capabilities:
Smoothing Toggle: Enable or disable smoothing of the dynamic length used for RSI.
Smoothing MA Type for RSI MA: Choose between SMA and EMA
Smoothing Length Options for RSI MA:
Full: Uses the entire calculated dynamic length.
Half: Applies half of the dynamic length for smoother output.
SQRT: Uses the square root of the dynamic length, offering a compromise between responsiveness and smoothness.
The smoothed RSI is complemented by a separate moving average (MA) of the RSI itself, further enhancing signal clarity.
3. Visualization Tools
The PF-RSI includes visualization options to help traders interpret market conditions at a glance.
Plots:
Dynamic RSI: Displayed as a white line, showing the adaptive RSI value.
RSI Moving Average: Plotted in yellow, providing a smoothed reference for trend and momentum analysis.
Dynamic Length: A secondary plot (in faint white) showing how the calculation period evolves over time.
Histogram: Represents the RSI’s position relative to 50, with color gradients.
Fill Area: The space between the RSI and its MA is filled with a gradient (green for RSI > MA, red for RSI < MA), highlighting momentum shifts.
Customizable bar colors on the price chart reflect trend and momentum:
Trend (Raw RSI): Green (RSI > 50), Red (RSI < 50).
Trend (RSI MA): Green (MA > 50), Red (MA < 50).
Trend (Raw RSI) + Momentum: Adds momentum shading (lighter green/red when RSI and MA diverge).
Trend (RSI MA) + Momentum: Similar, but based on the MA’s trend.
Momentum: Green (RSI > MA), Red (RSI < MA).
Off: Disables bar coloring.
Intrabar Updating: Optional real-time updates within each bar for enhanced responsiveness.
4. Alerts
The PF-RSI supports customizable alerts to keep traders informed of key events.
Trend Alerts:
Raw RSI: Triggers when the RSI crosses above (uptrend) or below (downtrend) 50.
RSI MA: Triggers when the moving average crosses 50.
Off: Disables trend alerts.
Momentum Alerts:
Triggers when the RSI crosses its moving average, indicating rising (RSI > MA) or declining (RSI < MA) momentum.
Alerts are fired once per bar close, with descriptive messages including the ticker symbol (e.g., " Uptrend on: AAPL").
How It Works
The PF-RSI operates in a multi-step process:
Initialization
On the first run, it calculates a standard RSI with a 14-period length to seed the dynamic calculation.
Dynamic Length Computation
Once seeded, the indicator switches to a dynamic length based on the selected variant, factoring in volatility and distance from 50.
If smoothing is enabled, the length is further refined using an SMA.
RSI Calculation
The adaptive RSI is computed using the dynamic length, ensuring it reflects current market conditions.
Moving Average
A separate MA (SMA or EMA) is applied to the RSI, with a length derived from the dynamic length (Full, Half, or SQRT).
Visualization and Alerts
The results are plotted, and alerts are triggered based on user settings.
This adaptive approach minimizes lag in fast markets and reduces false signals in choppy conditions, offering a significant edge over fixed-period RSI implementations.
Why Use PF-RSI?
The Parameter Free RSI stands out by eliminating the guesswork of selecting an RSI period. Its dynamic length adjusts to market volatility and momentum, providing timely signals without manual tweaking.

Pinescript - Common Label & Line Array Functions Library by RRBPinescript - Common Label & Line Array Functions Library by RagingRocketBull 2021
Version 1.0
This script provides a library of common array functions for arrays of label and line objects with live testing of all functions.
Using this library you can easily create, update, delete, join label/line object arrays, and get/set properties of individual label/line object array items.
You can find the full list of supported label/line array functions below.
There are several libraries:
- Common String Functions Library
- Standard Array Functions Library
- Common Fixed Type Array Functions Library
- Common Label & Line Array Functions Library
- Common Variable Type Array Functions Library
Features:
- 30 array functions in categories create/update/delete/join/get/set with support for both label/line objects (45+ including all implementations)
- Create, Update label/line object arrays from list/array params
- GET/SET properties of individual label/line array items by index
- Join label/line objects/arrays into a single string for output
- Supports User Input of x,y coords of 5 different types: abs/rel/rel%/inc/inc% list/array, auto transforms x,y input into list/array based on type, base and xloc, translates rel into abs bar indexes
- Supports User Input of lists with shortened names of string properties, auto expands all standard string properties to their full names for use in functions
- Live Output for all/selected functions based on User Input. Test any function for possible errors you may encounter before using in script.
- Output filters: hide all excluded and show only allowed functions using a list of function names
- Output Panel customization options: set custom style, color, text size, and line spacing
Usage:
- select create function - create label/line arrays from lists or arrays (optional). Doesn't affect the update functions. The only change in output should be function name regardless of the selected implementation.
- specify num_objects for both label/line arrays (default is 7)
- specify common anchor point settings x,y base/type for both label/line arrays and GET/SET items in Common Settings
- fill lists with items to use as inputs for create label/line array functions in Create Label/Line Arrays section
- specify label/line array item index and properties to SET in corresponding sections
- select label/line SET function to see the changes applied live
Code Structure:
- translate x,y depending on x,y type, base and xloc as specified in UI (required for all functions)
- expand all shortened standard property names to full names (required for create/update* from arrays and set* functions, not needed for create/update* from lists) to prevent errors in label.new and line.new
- create param arrays from string lists (required for create/update* from arrays and set* functions, not needed for create/update* from lists)
- create label/line array from string lists (property names are auto expanded) or param arrays (requires already expanded properties)
- update entire label/line array or
- get/set label/line array item properties by index
Transforming/Expanding Input values:
- for this script to work on any chart regardless of price/scale, all x*,y* are specified as % increase relative to x0,y0 base levels by default, but user can enter abs x,price values specific for that chart if necessary.
- all lists can be empty, contain 1 or several items, have the same/different lengths. Array Length = min(min(len(list*)), mum_objects) is used to create label/line objects. Missing list items are replaced with default property values.
- when a list contains only 1 item it is duplicated (label name/tooltip is also auto incremented) to match the calculated Array Length
- since this script processes user input, all x,y values must be translated to abs bar indexes before passing them to functions. Your script may provide all data internally and doesn't require this step.
- at first int x, float y arrays are created from user string lists, transformed as described below and returned as x,y arrays.
- translated x,y arrays can then be passed to create from arrays function or can be converted back to x,y string lists for the create from lists function if necessary.
- all translation logic is separated from create/update/set functions for the following reasons:
- to avoid redundant code/dependency on ext functions/reduce local scopes and to be able to translate everything only once in one place - should be faster
- to simplify internal logic of all functions
- because your script may provide all data internally without user input and won't need the translation step
- there are 5 types available for both x,y: abs, rel, rel%, inc, inc%. In addition to that, x can be: bar index or time, y is always price.
- abs - absolute bar index/time from start bar0 (x) or price (y) from 0, is >= 0
- rel - relative bar index/time from cur bar n (x) or price from y0 base level, is >= 0
- rel% - relative % increase of bar index/time (x) or price (y) from corresponding base level (x0 or y0), can be <=> 0
- inc - relative increment (step) for each new level of bar index/time (x) or price (y) from corresponding base level (x0 or y0), can be <=> 0
- inc% - relative % increment (% step) for each new level of bar index/time (x) or price (y) from corresponding base level (x0 or y0), can be <=> 0
- x base level >= 0
- y base level can be 0 (empty) or open, close, high, low of cur bar
- single item x1_list = "50" translates into:
- for x type abs: "50, 50, 50 ..." num_objects times regardless of xloc => x = 50
- for x type rel: "50, 50, 50 ... " num_objects times => x = x_base + 50
- for x type rel%: "50%, 50%, 50% ... " num_objects times => x_base * (1 + 0.5)
- for x type inc: "0, 50, 100 ... " num_objects times => x_base + 50 * i
- for x type inc%: "0%, 50%, 100% ... " num_objects times => x_base * (1 + 0.5 * i)
- when xloc = xloc.bar_index each rel*/inc* value in the above list is then subtracted from n: n - x to convert rel to abs bar index, values of abs type are not affected
- x1_list = "0, 50, 100, ..." of type rel is the same as "50" of type inc
- x1_list = "50, 50, 50, ..." of type abs/rel/rel% produces a sequence of the same values and can be shortened to just "50"
- single item y1_list = "2" translates into (ragardless of yloc):
- for y type abs: "2, 2, 2 ..." num_objects times => y = 2
- for y type rel: "2, 2, 2 ... " num_objects times => y = y_base + 2
- for y type rel%: "2%, 2%, 2% ... " num_objects times => y = y_base * (1 + 0.02)
- for y type inc: "0, 2, 4 ... " num_objects times => y = y_base + 2 * i
- for y type inc%: "0%, 2%, 4% ... " num_objects times => y = y_base * (1 + 0.02 * i)
- when yloc != yloc.price all calculated values above are simply ignored
- y1_list = "0, 2, 4" of type rel% is the same as "2" with type inc%
- y1_list = "2, 2, 2" of type abs/rel/rel% produces a sequence of the same values and can be shortened to just "2"
- you can enter shortened property names in lists. To lookup supported shortened names use corresponding dropdowns in Set Label/Line Array Item Properties sections
- all shortened standard property names must be expanded to full names (required for create/update* from arrays and set* functions, not needed for create/update* from lists) to prevent errors in label.new and line.new
- examples of shortened property names that can be used in lists: bar_index, large, solid, label_right, white, left, left, price
- expanded to their corresponding full names: xloc.bar_index, size.large, line.style_solid, label.style_label_right, color.white, text.align_left, extend.left, yloc.price
- all expanding logic is separated from create/update* from arrays and set* functions for the same reasons as above, and because param arrays already have different types, implying the use of final values.
- all expanding logic is included in the create/update* from lists functions because it seemed more natural to process string lists from user input directly inside the function, since they are already strings.
Creating Label/Line Objects:
- use study max_lines_count and max_labels_count params to increase the max number of label/line objects to 500 (+3) if necessary. Default number of label/line objects is 50 (+3)
- all functions use standard param sequence from methods in reference, except style always comes before colors.
- standard label/line.get* functions only return a few properties, you can't read style, color, width etc.
- label.new(na, na, "") will still create a label with x = n-301, y = NaN, text = "" because max default scope for a var is 300 bars back.
- there are 2 types of color na, label color requires color(na) instead of color_na to prevent error. text_color and line_color can be color_na
- for line to be visible both x1, x2 ends must be visible on screen, also when y1 == y2 => abs(x1 - x2) >= 2 bars => line is visible
- xloc.bar_index line uses abs x1, x2 indexes and can only be within 0 and n ends, where n <= 5000 bars (free accounts) or 10000 bars (paid accounts) limit, can't be plotted into the future
- xloc.bar_time line uses abs x1, x2 times, can't go past bar0 time but can continue past cur bar time into the future, doesn't have a length limit in bars.
- xloc.bar_time line with length = exact number of bars can be plotted only within bar0 and cur bar, can't be plotted into the future reliably because of future gaps due to sessions on some charts
- xloc.bar_index line can't be created on bar 0 with fixed length value because there's only 1 bar of horiz length
- it can be created on cur bar using fixed length x < n <= 5000 or
- created on bar0 using na and then assigned final x* values on cur bar using set_x*
- created on bar0 using n - fixed_length x and then updated on cur bar using set_x*, where n <= 5000
- default orientation of lines (for style_arrow* and extend) is from left to right (from bar 50 to bar 0), it reverses when x1 and x2 are swapped
- price is a function, not a line object property
Variable Type Arrays:
- you can't create an if/function that returns var type value/array - compiler uses strict types and doesn't allow that
- however you can assign array of any type to another array of any type creating an arr pointer of invalid type that must be reassigned to a matching array type before used in any expression to prevent error
- create_any_array2 uses this loophole to return an int_arr pointer of a var type array
- this works for all array types defined with/without var keyword and doesn't work for string arrays defined with var keyword for some reason
- you can't do this with var type vars, only var type arrays because arrays are pointers passed by reference, while vars are actual values passed by value.
- you can only pass a var type value/array param to a function if all functions inside support every type - otherwise error
- alternatively values of every type must be passed simultaneously and processed separately by corresponding if branches/functions supporting these particular types returning a common single type result
- get_var_types solves this problem by generating a list of dummy values of every possible type including the source type, tricking the compiler into allowing a single valid branch to execute without error, while ignoring all dummy results
Notes:
- uses Pinescript v3 Compatibility Framework
- uses Common String Functions Library, Common Fixed Type Array Functions Library, Common Variable Type Array Functions Library
- has to be a separate script to reduce the number of local scopes/compiled file size, can't be merged with another library.
- lets you live test all label/line array functions for errors. If you see an error - change params in UI
- if you see "Loop too long" error - hide/unhide or reattach the script
- if you see "Chart references too many candles" error - change x type or value between abs/rel*. This can happen on charts with 5000+ bars when a rel bar index x is passed to label.new or line.new instead of abs bar index n - x
- create/update_label/line_array* use string lists, while create/update_label/line_array_from_arrays* use array params to create label/line arrays. "from_lists" is dropped to shorten the names of the most commonly used functions.
- create_label/line_array2,4 are preferable, 5,6 are listed for pure demonstration purposes only - don't use them, they don't improve anything but dramatically increase local scopes/compiled file size
- for this reason you would mainly be using create/update_label/line_array2,4 for list params or create/update_label/line_array_from_arrays2 for array params
- all update functions are executed after each create as proof of work and can be disabled. Only create functions are required. Use update functions when necessary - when list/array params are changed by your script.
- both lists and array item properties use the same x,y_type, x,y_base from common settings
- doesn't use pagination, a single str contains all output
- why is this so complicated? What are all these functions for?
- this script merges standard label/line object methods with standard array functions to create a powerful set of label/line object array functions to simplify manipulation of these arrays.
- this library also extends the functionality of Common Variable Type Array Functions Library providing support for label/line types in var type array functions (any_to_str6, join_any_array5)
- creating arrays from either lists or arrays adds a level of flexibility that comes with complexity. It's very likely that in your script you'd have to deal with both string lists as input, and arrays internally, once everything is converted.
- processing user input, allowing customization and targeting for any chart adds a whole new layer of complexity, all inputs must be translated and expanded before used in functions.
- different function implementations can increase/reduce local scopes and compiled file size. Select a version that best suits your needs. Creating complex scripts often requires rewriting your code multiple times to fit the limits, every line matters.
P.S. Don't rely too much on labels, for too often they are fables.
List of functions*:
* - functions from other libraries are not listed
1. Join Functions
Labels
- join_label_object(label_, d1, d2)
- join_label_array(arr, d1, d2)
- join_label_array2(arr, d1, d2, d3)
Lines
- join_line_object(line_, d1, d2)
- join_line_array(arr, d1, d2)
- join_line_array2(arr, d1, d2, d3)
Any Type
- any_to_str6(arr, index, type)
- join_any_array4(arr, d1, d2, type)
- join_any_array5(arr, d, type)
2. GET/SET Functions
Labels
- label_array_get_text(arr, index)
- label_array_get_xy(arr, index)
- label_array_get_fields(arr, index)
- label_array_set_text(arr, index, str)
- label_array_set_xy(arr, index, x, y)
- label_array_set_fields(arr, index, x, y, str)
- label_array_set_all_fields(arr, index, x, y, str, xloc, yloc, label_style, label_color, text_color, text_size, text_align, tooltip)
- label_array_set_all_fields2(arr, index, x, y, str, xloc, yloc, label_style, label_color, text_color, text_size, text_align, tooltip)
Lines
- line_array_get_price(arr, index, bar)
- line_array_get_xy(arr, index)
- line_array_get_fields(arr, index)
- line_array_set_text(arr, index, width)
- line_array_set_xy(arr, index, x1, y1, x2, y2)
- line_array_set_fields(arr, index, x1, y1, x2, y2, width)
- line_array_set_all_fields(arr, index, x1, y1, x2, y2, xloc, extend, line_style, line_color, width)
- line_array_set_all_fields2(arr, index, x1, y1, x2, y2, xloc, extend, line_style, line_color, width)
3. Create/Update/Delete Functions
Labels
- delete_label_array(label_arr)
- create_label_array(list1, list2, list3, list4, list5, d)
- create_label_array2(x_list, y_list, str_list, xloc_list, yloc_list, style_list, color1_list, color2_list, size_list, align_list, tooltip_list, d)
- create_label_array3(x_list, y_list, str_list, xloc_list, yloc_list, style_list, color1_list, color2_list, size_list, align_list, tooltip_list, d)
- create_label_array4(x_list, y_list, str_list, xloc_list, yloc_list, style_list, color1_list, color2_list, size_list, align_list, tooltip_list, d)
- create_label_array5(x_list, y_list, str_list, xloc_list, yloc_list, style_list, color1_list, color2_list, size_list, align_list, tooltip_list, d)
- create_label_array6(x_list, y_list, str_list, xloc_list, yloc_list, style_list, color1_list, color2_list, size_list, align_list, tooltip_list, d)
- update_label_array2(label_arr, x_list, y_list, str_list, xloc_list, yloc_list, style_list, color1_list, color2_list, size_list, align_list, tooltip_list, d)
- update_label_array4(label_arr, x_list, y_list, str_list, xloc_list, yloc_list, style_list, color1_list, color2_list, size_list, align_list, tooltip_list, d)
- create_label_array_from_arrays2(x_arr, y_arr, str_arr, xloc_arr, yloc_arr, style_arr, color1_arr, color2_arr, size_arr, align_arr, tooltip_arr, d)
- create_label_array_from_arrays4(x_arr, y_arr, str_arr, xloc_arr, yloc_arr, style_arr, color1_arr, color2_arr, size_arr, align_arr, tooltip_arr, d)
- update_label_array_from_arrays2(label_arr, x_arr, y_arr, str_arr, xloc_arr, yloc_arr, style_arr, color1_arr, color2_arr, size_arr, align_arr, tooltip_arr, d)
Lines
- delete_line_array(line_arr)
- create_line_array(list1, list2, list3, list4, list5, list6, d)
- create_line_array2(x1_list, y1_list, x2_list, y2_list, xloc_list, extend_list, style_list, color_list, width_list, d)
- create_line_array3(x1_list, y1_list, x2_list, y2_list, xloc_list, extend_list, style_list, color_list, width_list, d)
- create_line_array4(x1_list, y1_list, x2_list, y2_list, xloc_list, extend_list, style_list, color_list, width_list, d)
- create_line_array5(x1_list, y1_list, x2_list, y2_list, xloc_list, extend_list, style_list, color_list, width_list, d)
- create_line_array6(x1_list, y1_list, x2_list, y2_list, xloc_list, extend_list, style_list, color_list, width_list, d)
- update_line_array2(line_arr, x1_list, y1_list, x2_list, y2_list, xloc_list, extend_list, style_list, color_list, width_list, d)
- update_line_array4(line_arr, x1_list, y1_list, x2_list, y2_list, xloc_list, extend_list, style_list, color_list, width_list, d)
- create_line_array_from_arrays2(x1_arr, y1_arr, x2_arr, y2_arr, xloc_arr, extend_arr, style_arr, color_arr, width_arr, d)
- update_line_array_from_arrays2(line_arr, x1_arr, y1_arr, x2_arr, y2_arr, xloc_arr, extend_arr, style_arr, color_arr, width_arr, d)

DAX ORB Ultimate - ALGO Suite//@version=5
indicator("DAX ORB Ultimate - ALGO Suite", overlay=true, max_labels_count=200, max_lines_count=100)
// ═══════════════════════════════════════════════════════════════════════════════
// DAX OPENING RANGE BREAKOUT - ULTIMATE EDITION
// Real-time ORB building | Multi-timeframe support | Key levels with bias
// Works on ANY timeframe - uses M1 data for ORB construction
// ═══════════════════════════════════════════════════════════════════════════════
// ════════════════════════ INPUTS ════════════════════════
orb_start_h = input.int(7, "Start Hour (UTC)", minval=0, maxval=23, group="ORB Settings")
orb_start_m = input.int(40, "Start Minute", minval=0, maxval=59, group="ORB Settings")
orb_end_h = input.int(8, "End Hour (UTC)", minval=0, maxval=23, group="ORB Settings")
orb_end_m = input.int(0, "End Minute", minval=0, maxval=59, group="ORB Settings")
exclude_wicks = input.bool(true, "Exclude Wicks", group="ORB Settings")
close_hour = input.int(16, "Market Close Hour", minval=0, maxval=23, group="ORB Settings")
use_tf = input.bool(true, "1. Trend Following", group="Strategies")
use_mr = input.bool(true, "2. Mean Reversion", group="Strategies")
use_sa = input.bool(true, "3. Statistical Arb", group="Strategies")
use_mm = input.bool(true, "4. Market Making", group="Strategies")
use_ba = input.bool(true, "5. Basis Arb", group="Strategies")
use_ema = input.bool(true, "EMA Filter", group="Technical Filters")
use_rsi = input.bool(true, "RSI Filter", group="Technical Filters")
use_macd = input.bool(true, "MACD Filter", group="Technical Filters")
use_vol = input.bool(true, "Volume Filter", group="Technical Filters")
use_bb = input.bool(true, "Bollinger Filter", group="Technical Filters")
use_fixed = input.bool(false, "Fixed SL/TP", group="Risk Management")
fixed_sl = input.float(50, "Fixed SL Points", minval=10, group="Risk Management")
fixed_tp = input.float(150, "Fixed TP Points", minval=10, group="Risk Management")
atr_sl = input.float(2.0, "ATR SL Mult", minval=0.5, group="Risk Management")
atr_tp = input.float(3.0, "ATR TP Mult", minval=0.5, group="Risk Management")
min_rr = input.float(2.0, "Min R:R", minval=1.0, group="Risk Management")
show_dash = input.bool(true, "Show Dashboard", group="Display")
show_lines = input.bool(true, "Show Lines", group="Display")
show_levels = input.bool(true, "Show Key Levels", group="Display")
// ════════════════════════ FUNCTIONS ════════════════════════
is_orb_period(_h, _m) =>
start = orb_start_h * 60 + orb_start_m
end = orb_end_h * 60 + orb_end_m
curr = _h * 60 + _m
curr >= start and curr < end
orb_ended(_h, _m) =>
end = orb_end_h * 60 + orb_end_m
curr = _h * 60 + _m
curr == end
is_market_open() =>
h = hour(time)
h >= orb_start_h and h <= close_hour
// ════════════════════════ DATA GATHERING (M1) ════════════════════════
// Get M1 data for ORB construction (works on ANY chart timeframe)
= request.security(syminfo.tickerid, "1", , barmerge.gaps_off, barmerge.lookahead_off)
// Daily data
d_high = request.security(syminfo.tickerid, "D", high, barmerge.gaps_off, barmerge.lookahead_on)
d_low = request.security(syminfo.tickerid, "D", low, barmerge.gaps_off, barmerge.lookahead_on)
d_open = request.security(syminfo.tickerid, "D", open, barmerge.gaps_off, barmerge.lookahead_on)
// Current day high/low (intraday)
var float today_high = na
var float today_low = na
var float prev_day_high = na
var float prev_day_low = na
var float yest_size = 0
if ta.change(time("D")) != 0
prev_day_high := d_high
prev_day_low := d_low
yest_size := d_high - d_low
today_high := high
today_low := low
else
today_high := math.max(na(today_high) ? high : today_high, high)
today_low := math.min(na(today_low) ? low : today_low, low)
// ════════════════════════ ORB CONSTRUCTION (REAL-TIME) ════════════════════════
var float orb_h = na
var float orb_l = na
var bool orb_ready = false
var float orb_building_h = na
var float orb_building_l = na
var bool is_building = false
// Get M1 bar time components
m1_hour = hour(m1_time)
m1_minute = minute(m1_time)
// Reset daily
if ta.change(time("D")) != 0
orb_h := na
orb_l := na
orb_ready := false
orb_building_h := na
orb_building_l := na
is_building := false
// Build ORB using M1 data
if is_orb_period(m1_hour, m1_minute) and not orb_ready
is_building := true
val_h = exclude_wicks ? m1_close : m1_high
val_l = exclude_wicks ? m1_close : m1_low
if na(orb_building_h)
orb_building_h := val_h
orb_building_l := val_l
else
orb_building_h := math.max(orb_building_h, val_h)
orb_building_l := math.min(orb_building_l, val_l)
// FIX #1: Set is_building to false when NOT in ORB period anymore
if not is_orb_period(m1_hour, m1_minute) and is_building and not orb_ready
is_building := false
// Finalize ORB when period ends
if orb_ended(m1_hour, m1_minute) and not orb_ready
orb_h := orb_building_h
orb_l := orb_building_l
orb_ready := true
is_building := false
// Display building values in real-time
current_orb_h = is_building ? orb_building_h : orb_h
current_orb_l = is_building ? orb_building_l : orb_l
// ════════════════════════ INDICATORS ════════════════════════
ema9 = ta.ema(close, 9)
ema21 = ta.ema(close, 21)
ema50 = ta.ema(close, 50)
rsi = ta.rsi(close, 14)
= ta.macd(close, 12, 26, 9)
= ta.bb(close, 20, 2)
atr = ta.atr(14)
vol_ma = ta.sma(volume, 20)
// ════════════════════════ STRATEGY SIGNALS ════════════════════════
// 1. Trend Following
tf_short = ta.sma(close, 10)
tf_long = ta.sma(close, 30)
tf_bull = tf_short > tf_long
tf_bear = tf_short < tf_long
// 2. Mean Reversion
mr_mean = ta.sma(close, 20)
mr_dev = (close - mr_mean) / mr_mean * 100
mr_bull = mr_dev <= -0.5
mr_bear = mr_dev >= 0.5
// 3. Statistical Arb
sa_mean = ta.sma(close, 120)
sa_std = ta.stdev(close, 120)
sa_z = sa_std > 0 ? (close - sa_mean) / sa_std : 0
var string sa_st = "flat"
if sa_st == "flat"
if sa_z <= -2.0
sa_st := "long"
else if sa_z >= 2.0
sa_st := "short"
else if math.abs(sa_z) <= 0.5 or math.abs(sa_z) >= 4.0
sa_st := "flat"
sa_bull = sa_st == "long"
sa_bear = sa_st == "short"
// 4. Market Making
mm_spread = (high - low) / close * 100
mm_mid = (high + low) / 2
mm_bull = close < mm_mid and mm_spread >= 0.5
mm_bear = close > mm_mid and mm_spread >= 0.5
// 5. Basis Arb
ba_fair = ta.sma(close, 50)
ba_bps = ba_fair != 0 ? (close - ba_fair) / ba_fair * 10000 : 0
ba_bull = ba_bps <= -8.0
ba_bear = ba_bps >= 8.0
// Vote counting
bull_v = 0
bear_v = 0
if use_tf
bull_v := bull_v + (tf_bull ? 1 : 0)
bear_v := bear_v + (tf_bear ? 1 : 0)
if use_mr
bull_v := bull_v + (mr_bull ? 1 : 0)
bear_v := bear_v + (mr_bear ? 1 : 0)
if use_sa
bull_v := bull_v + (sa_bull ? 1 : 0)
bear_v := bear_v + (sa_bear ? 1 : 0)
if use_mm
bull_v := bull_v + (mm_bull ? 1 : 0)
bear_v := bear_v + (mm_bear ? 1 : 0)
if use_ba
bull_v := bull_v + (ba_bull ? 1 : 0)
bear_v := bear_v + (ba_bear ? 1 : 0)
// Technical filters - Simplified scoring system
ema_ok_b = not use_ema or (ema9 > ema21 and close > ema50)
ema_ok_s = not use_ema or (ema9 < ema21 and close < ema50)
rsi_ok_b = not use_rsi or (rsi > 40 and rsi < 80) // More lenient
rsi_ok_s = not use_rsi or (rsi < 60 and rsi > 20) // More lenient
macd_ok_b = not use_macd or macd > sig
macd_ok_s = not use_macd or macd < sig
vol_ok = not use_vol or volume > vol_ma * 1.2 // More lenient
bb_ok_b = not use_bb or close > bb_mid
bb_ok_s = not use_bb or close < bb_mid
// Technical score (need at least 2 out of 5 filters)
tech_score_b = (ema_ok_b ? 1 : 0) + (rsi_ok_b ? 1 : 0) + (macd_ok_b ? 1 : 0) + (bb_ok_b ? 1 : 0) + (vol_ok ? 1 : 0)
tech_score_s = (ema_ok_s ? 1 : 0) + (rsi_ok_s ? 1 : 0) + (macd_ok_s ? 1 : 0) + (bb_ok_s ? 1 : 0) + (vol_ok ? 1 : 0)
tech_bull = tech_score_b >= 2
tech_bear = tech_score_s >= 2
// Breakout - SIMPLIFIED (just need close above/below ORB)
brk_bull = orb_ready and close > current_orb_h
brk_bear = orb_ready and close < current_orb_l
// Consensus - At least 2 strategies agree (not majority)
total_st = (use_tf ? 1 : 0) + (use_mr ? 1 : 0) + (use_sa ? 1 : 0) + (use_mm ? 1 : 0) + (use_ba ? 1 : 0)
consensus_b = bull_v >= 2
consensus_s = bear_v >= 2
// Final signals - MUCH MORE LENIENT
daily_ok = yest_size >= 50 // Reduced from 100
buy = brk_bull and consensus_b and tech_bull and is_market_open()
sell = brk_bear and consensus_s and tech_bear and is_market_open()
// ════════════════════════ SL/TP ════════════════════════
// IMMEDIATE SL/TP LEVELS - Calculated as soon as ORB is ready (at 8:00)
var float long_entry = na
var float long_sl = na
var float long_tp = na
var float short_entry = na
var float short_sl = na
var float short_tp = na
// Calculate potential levels immediately when ORB is ready
if orb_ready and not na(orb_h) and not na(orb_l)
// Long scenario: Entry at ORB high breakout
long_entry := orb_h
long_sl := use_fixed ? long_entry - fixed_sl : long_entry - atr * atr_sl
long_tp := use_fixed ? long_entry + fixed_tp : long_entry + atr * atr_tp
// Short scenario: Entry at ORB low breakout
short_entry := orb_l
short_sl := use_fixed ? short_entry + fixed_sl : short_entry + atr * atr_sl
short_tp := use_fixed ? short_entry - fixed_tp : short_entry - atr * atr_tp
// Signal-based entry tracking (for dashboard and alerts)
var float buy_entry = na
var float buy_sl = na
var float buy_tp = na
var float sell_entry = na
var float sell_sl = na
var float sell_tp = na
if buy
buy_entry := close
buy_sl := use_fixed ? buy_entry - fixed_sl : buy_entry - atr * atr_sl
buy_tp := use_fixed ? buy_entry + fixed_tp : buy_entry + atr * atr_tp
if sell
sell_entry := close
sell_sl := use_fixed ? sell_entry + fixed_sl : sell_entry + atr * atr_sl
sell_tp := use_fixed ? sell_entry - fixed_tp : sell_entry - atr * atr_tp
buy_rr = not na(buy_entry) ? (buy_tp - buy_entry) / (buy_entry - buy_sl) : 0
sell_rr = not na(sell_entry) ? (sell_entry - sell_tp) / (sell_sl - sell_entry) : 0
buy_final = buy and buy_rr >= min_rr
sell_final = sell and sell_rr >= min_rr
// ════════════════════════ TRAILING STOPS ════════════════════════
// Trailing Stop Loss and Take Profit Management
var float trailing_sl_long = na
var float trailing_sl_short = na
var float trailing_tp_long = na
var float trailing_tp_short = na
var bool in_long = false
var bool in_short = false
var float highest_since_entry = na
var float lowest_since_entry = na
// Enter long position
if buy_final and not in_long
in_long := true
in_short := false
trailing_sl_long := buy_sl
trailing_tp_long := buy_tp
highest_since_entry := close
// Enter short position
if sell_final and not in_short
in_short := true
in_long := false
trailing_sl_short := sell_sl
trailing_tp_short := sell_tp
lowest_since_entry := close
// Update trailing stops for LONG
if in_long
// Track highest price since entry
highest_since_entry := math.max(highest_since_entry, high)
// Trail stop loss (moves up as price moves up)
// When price moves 1 ATR in profit, move SL to breakeven
// When price moves 2 ATR in profit, move SL to +1 ATR
profit_atr = (highest_since_entry - buy_entry) / atr
if profit_atr >= 2.0
trailing_sl_long := math.max(trailing_sl_long, buy_entry + atr * 1.0)
else if profit_atr >= 1.0
trailing_sl_long := math.max(trailing_sl_long, buy_entry)
// Smart trailing TP - extends TP if strong momentum
if highest_since_entry > trailing_tp_long * 0.9 and rsi > 60 // Within 10% of TP and strong momentum
trailing_tp_long := trailing_tp_long + atr * 0.5 // Extend TP
// Exit conditions
if close <= trailing_sl_long or close >= trailing_tp_long
in_long := false
trailing_sl_long := na
trailing_tp_long := na
highest_since_entry := na
// Update trailing stops for SHORT
if in_short
// Track lowest price since entry
lowest_since_entry := math.min(lowest_since_entry, low)
// Trail stop loss (moves down as price moves down)
profit_atr = (sell_entry - lowest_since_entry) / atr
if profit_atr >= 2.0
trailing_sl_short := math.min(trailing_sl_short, sell_entry - atr * 1.0)
else if profit_atr >= 1.0
trailing_sl_short := math.min(trailing_sl_short, sell_entry)
// Smart trailing TP - extends TP if strong momentum
if lowest_since_entry < trailing_tp_short * 1.1 and rsi < 40 // Within 10% of TP and strong momentum
trailing_tp_short := trailing_tp_short - atr * 0.5 // Extend TP
// Exit conditions
if close >= trailing_sl_short or close <= trailing_tp_short
in_short := false
trailing_sl_short := na
trailing_tp_short := na
lowest_since_entry := na
// ════════════════════════ ANALYTICS ════════════════════════
prob_strat = total_st > 0 ? math.max(bull_v, bear_v) / total_st * 100 : 50
prob_tech = (tech_bull or tech_bear) ? 75 : 35
prob_vol = vol_ok ? 85 : 50
prob_daily = daily_ok ? 85 : 30
prob_orb = orb_ready ? 80 : 20
probability = prob_strat * 0.3 + prob_tech * 0.25 + prob_vol * 0.15 + prob_daily * 0.15 + prob_orb * 0.15
dir_score = 0
dir_score := dir_score + (ema9 > ema21 ? 2 : -2)
dir_score := dir_score + (tf_bull ? 2 : -2)
dir_score := dir_score + (macd > sig ? 1 : -1)
dir_score := dir_score + (rsi > 50 ? 1 : -1)
direction = dir_score >= 2 ? "STRONG BULL" : (dir_score > 0 ? "BULL" : (dir_score <= -2 ? "STRONG BEAR" : (dir_score < 0 ? "BEAR" : "NEUTRAL")))
clean_trend = math.abs(ema9 - ema21) / close * 100
clean_noise = atr / close * 100
clean_struct = close > ema9 and close > ema21 and close > ema50 or close < ema9 and close < ema21 and close < ema50
clean_score = (clean_trend > 0.5 ? 30 : 10) + (clean_noise < 1.5 ? 30 : 10) + (clean_struct ? 40 : 10)
quality = clean_score >= 70 ? "CLEAN" : (clean_score >= 50 ? "GOOD" : (clean_score >= 30 ? "OK" : "CHOPPY"))
mom = ta.mom(close, 10)
mom_str = math.abs(mom) / close * 100
vol_rat = atr / ta.sma(atr, 20)
movement = buy_final or sell_final ? (mom_str > 0.8 and vol_rat > 1.3 ? "STRONG" : (mom_str > 0.5 ? "MODERATE" : "GRADUAL")) : "WAIT"
ok_score = (daily_ok ? 25 : 0) + (orb_ready ? 25 : 0) + (is_market_open() ? 20 : 0) + (clean_score >= 50 ? 20 : 5) + (probability >= 60 ? 10 : 0)
ok_trade = ok_score >= 65
// ════════════════════════ KEY LEVELS WITH BIAS ════════════════════════
// Calculate potential reaction levels with directional bias
var float key_levels = array.new_float(0)
var string key_bias = array.new_string(0)
if barstate.islast and show_levels
array.clear(key_levels)
array.clear(key_bias)
// Add levels with bias
if not na(current_orb_h)
array.push(key_levels, current_orb_h)
array.push(key_bias, consensus_b ? "BULL BREAK" : "RESISTANCE")
if not na(current_orb_l)
array.push(key_levels, current_orb_l)
array.push(key_bias, consensus_s ? "BEAR BREAK" : "SUPPORT")
if not na(prev_day_high)
array.push(key_levels, prev_day_high)
bias_pdh = close > prev_day_high ? "BULLISH" : (close < prev_day_high and close > prev_day_high * 0.995 ? "WATCH" : "RESIST")
array.push(key_bias, bias_pdh)
if not na(prev_day_low)
array.push(key_levels, prev_day_low)
bias_pdl = close < prev_day_low ? "BEARISH" : (close > prev_day_low and close < prev_day_low * 1.005 ? "WATCH" : "SUPPORT")
array.push(key_bias, bias_pdl)
if not na(today_high)
array.push(key_levels, today_high)
array.push(key_bias, "TODAY HIGH")
if not na(today_low)
array.push(key_levels, today_low)
array.push(key_bias, "TODAY LOW")
// Add EMA50 as dynamic level
array.push(key_levels, ema50)
ema_bias = close > ema50 ? "BULL SUPPORT" : "BEAR RESIST"
array.push(key_bias, ema_bias)
// ════════════════════════ VISUALS ════════════════════════
// Previous day lines
plot(show_lines ? prev_day_high : na, "Prev Day H", color.new(color.yellow, 0), 1, plot.style_line)
plot(show_lines ? prev_day_low : na, "Prev Day L", color.new(color.orange, 0), 1, plot.style_line)
// Current day high/low
plot(show_lines ? today_high : na, "Today High", color.new(color.lime, 40), 2, plot.style_circles)
plot(show_lines ? today_low : na, "Today Low", color.new(color.red, 40), 2, plot.style_circles)
// ORB lines (show building values in real-time with separate plots)
// Building phase - circles (orange during building)
plot(show_lines and is_building and not na(current_orb_h) ? current_orb_h : na, "ORB High Building", color.new(color.orange, 30), 3, plot.style_circles)
plot(show_lines and is_building and not na(current_orb_l) ? current_orb_l : na, "ORB Low Building", color.new(color.orange, 30), 3, plot.style_circles)
// Ready phase - ULTRA BRIGHT solid lines
plot(show_lines and not is_building and not na(current_orb_h) ? current_orb_h : na, "ORB High Ready", color.new(color.aqua, 0), 4, plot.style_line)
plot(show_lines and not is_building and not na(current_orb_l) ? current_orb_l : na, "ORB Low Ready", color.new(color.aqua, 0), 4, plot.style_line)
// ORB zone fill
p1 = plot(not na(current_orb_h) ? current_orb_h : na, display=display.none)
p2 = plot(not na(current_orb_l) ? current_orb_l : na, display=display.none)
fill_color = is_building ? color.new(color.blue, 93) : color.new(color.blue, 88)
fill(p1, p2, fill_color, title="ORB Zone")
// FIX #2: Draw ORB rectangle box ONLY ONCE when ready (use var to track if already drawn)
var box orb_box = na
var int orb_start_bar = na
var bool orb_box_drawn = false
// Reset box drawn flag on new day
if ta.change(time("D")) != 0
orb_box_drawn := false
// Capture the bar when ORB becomes ready
if orb_ready and not orb_ready
orb_start_bar := bar_index
orb_box_drawn := false // Allow new box to be drawn
// Draw box ONLY ONCE when ORB first becomes ready
if orb_ready and not orb_box_drawn and not na(orb_h) and not na(orb_l) and show_lines
if not na(orb_box)
box.delete(orb_box)
// Ultra clear rectangle with thick bright borders
box_color = color.new(color.aqua, 85) // Bright aqua fill
border_color = color.new(color.aqua, 0) // Solid bright aqua border
orb_box := box.new(orb_start_bar, orb_h, bar_index + 50, orb_l,
border_color=border_color,
border_width=3, // Thicker border
bgcolor=box_color,
extend=extend.right,
text="ORB ZONE",
text_size=size.normal, // Larger text
text_color=color.new(color.aqua, 0)) // Bright text
orb_box_drawn := true
// Update box right edge on each bar (without creating new box)
if orb_box_drawn and not na(orb_box) and show_lines
box.set_right(orb_box, bar_index)
// EMAs
plot(use_ema ? ema9 : na, "EMA9", color.new(color.blue, 20), 1)
plot(use_ema ? ema21 : na, "EMA21", color.new(color.orange, 20), 1)
plot(use_ema ? ema50 : na, "EMA50", color.new(color.purple, 30), 2)
// Signals
plotshape(buy_final, "BUY", shape.triangleup, location.belowbar, color.new(color.lime, 0), size=size.small, text="BUY")
plotshape(sell_final, "SELL", shape.triangledown, location.abovebar, color.new(color.red, 0), size=size.small, text="SELL")
// Exit signals
plotshape(in_long and not in_long, "EXIT LONG", shape.xcross, location.abovebar, color.new(color.orange, 0), size=size.tiny, text="EXIT")
plotshape(in_short and not in_short, "EXIT SHORT", shape.xcross, location.belowbar, color.new(color.orange, 0), size=size.tiny, text="EXIT")
// Trailing stop lines
plot(in_long and not na(trailing_sl_long) ? trailing_sl_long : na, "Trail SL Long", color.new(color.red, 0), 2, plot.style_cross)
plot(in_long and not na(trailing_tp_long) ? trailing_tp_long : na, "Trail TP Long", color.new(color.lime, 0), 2, plot.style_cross)
plot(in_short and not na(trailing_sl_short) ? trailing_sl_short : na, "Trail SL Short", color.new(color.red, 0), 2, plot.style_cross)
plot(in_short and not na(trailing_tp_short) ? trailing_tp_short : na, "Trail TP Short", color.new(color.lime, 0), 2, plot.style_cross)
// FIX #3: IMMEDIATE SL/TP LINES - Draw ONLY ONCE when ORB is ready
var line long_sl_ln = na
var line long_tp_ln = na
var line short_sl_ln = na
var line short_tp_ln = na
var label long_sl_lbl = na
var label long_tp_lbl = na
var label short_sl_lbl = na
var label short_tp_lbl = na
var bool sltp_lines_drawn = false
// Reset lines drawn flag on new day
if ta.change(time("D")) != 0
sltp_lines_drawn := false
// Draw lines ONLY ONCE when ORB first becomes ready
if orb_ready and not orb_ready and show_lines
sltp_lines_drawn := false // Allow new lines to be drawn
if orb_ready and not sltp_lines_drawn and show_lines
// Delete old lines
if not na(long_sl_ln)
line.delete(long_sl_ln)
line.delete(long_tp_ln)
line.delete(short_sl_ln)
line.delete(short_tp_ln)
label.delete(long_sl_lbl)
label.delete(long_tp_lbl)
label.delete(short_sl_lbl)
label.delete(short_tp_lbl)
// LONG scenario (green - bullish breakout above ORB high)
if not na(long_sl) and not na(long_tp)
long_sl_ln := line.new(bar_index, long_sl, bar_index + 100, long_sl, color=color.new(color.red, 0), width=2, style=line.style_solid, extend=extend.right)
long_tp_ln := line.new(bar_index, long_tp, bar_index + 100, long_tp, color=color.new(color.lime, 0), width=2, style=line.style_solid, extend=extend.right)
long_sl_lbl := label.new(bar_index, long_sl, "LONG SL: " + str.tostring(long_sl, "#.##"), style=label.style_label_left, color=color.new(color.red, 0), textcolor=color.white, size=size.small)
long_tp_lbl := label.new(bar_index, long_tp, "LONG TP: " + str.tostring(long_tp, "#.##"), style=label.style_label_left, color=color.new(color.lime, 0), textcolor=color.black, size=size.small)
// SHORT scenario (red - bearish breakout below ORB low)
if not na(short_sl) and not na(short_tp)
short_sl_ln := line.new(bar_index, short_sl, bar_index + 100, short_sl, color=color.new(color.red, 0), width=2, style=line.style_solid, extend=extend.right)
short_tp_ln := line.new(bar_index, short_tp, bar_index + 100, short_tp, color=color.new(color.lime, 0), width=2, style=line.style_solid, extend=extend.right)
short_sl_lbl := label.new(bar_index, short_sl, "SHORT SL: " + str.tostring(short_sl, "#.##"), style=label.style_label_left, color=color.new(color.red, 0), textcolor=color.white, size=size.small)
short_tp_lbl := label.new(bar_index, short_tp, "SHORT TP: " + str.tostring(short_tp, "#.##"), style=label.style_label_left, color=color.new(color.lime, 0), textcolor=color.black, size=size.small)
sltp_lines_drawn := true
// FIX #4: Key level labels - Track and delete old labels to prevent duplication
var label key_level_labels = array.new_label(0)
// Delete all old key level labels
if array.size(key_level_labels) > 0
for i = 0 to array.size(key_level_labels) - 1
label.delete(array.get(key_level_labels, i))
array.clear(key_level_labels)
// Create key level labels only on last bar
if barstate.islast and show_levels and array.size(key_levels) > 0
for i = 0 to array.size(key_levels) - 1
lvl = array.get(key_levels, i)
bias = array.get(key_bias, i)
// Color based on bias
lbl_color = str.contains(bias, "BULL") ? color.new(color.green, 70) : (str.contains(bias, "BEAR") ? color.new(color.red, 70) : (str.contains(bias, "SUPPORT") ? color.new(color.blue, 70) : (str.contains(bias, "RESIST") ? color.new(color.orange, 70) : color.new(color.gray, 70))))
txt_color = str.contains(bias, "BULL") ? color.green : (str.contains(bias, "BEAR") ? color.red : (str.contains(bias, "SUPPORT") ? color.blue : (str.contains(bias, "RESIST") ? color.orange : color.gray)))
new_lbl = label.new(bar_index + 2, lvl, str.tostring(lvl, "#.##") + "\n" + bias, style=label.style_label_left, color=lbl_color, textcolor=txt_color, size=size.tiny, textalign=text.align_left)
array.push(key_level_labels, new_lbl)
// FIX #5: Compact chart info labels - Track and delete to prevent duplication
var label prob_label = na
var label dir_label = na
if barstate.islast and show_lines
// Delete old labels
if not na(prob_label)
label.delete(prob_label)
if not na(dir_label)
label.delete(dir_label)
// Create new labels
prob_c = probability >= 70 ? color.green : (probability >= 50 ? color.yellow : color.red)
prob_label := label.new(bar_index, high + atr * 1.2, str.tostring(probability, "#") + "%", style=label.style_none, textcolor=prob_c, size=size.small)
dir_c = str.contains(direction, "BULL") ? color.green : (str.contains(direction, "BEAR") ? color.red : color.gray)
dir_label := label.new(bar_index, high + atr * 2, direction, style=label.style_none, textcolor=dir_c, size=size.tiny)
// ════════════════════════ DASHBOARD ════════════════════════
var table dash = table.new(position.top_right, 2, 20, bgcolor=color.new(color.black, 5), border_width=1, border_color=color.new(color.gray, 60))
if barstate.islast and show_dash
r = 0
// Header
table.cell(dash, 0, r, "DAX ORB ULTIMATE", text_color=color.white, bgcolor=color.new(color.blue, 30), text_size=size.small)
table.cell(dash, 1, r, timeframe.period, text_color=color.yellow, bgcolor=color.new(color.blue, 30), text_size=size.tiny)
// Current Day
r += 1
table.cell(dash, 0, r, "TODAY H/L", text_color=color.aqua, text_size=size.tiny)
table.cell(dash, 1, r, "", text_color=color.white)
r += 1
table.cell(dash, 0, r, "High", text_color=color.gray, text_size=size.tiny)
table.cell(dash, 1, r, str.tostring(today_high, "#.##"), text_color=color.lime, text_size=size.tiny)
r += 1
table.cell(dash, 0, r, "Low", text_color=color.gray, text_size=size.tiny)
table.cell(dash, 1, r, str.tostring(today_low, "#.##"), text_color=color.red, text_size=size.tiny)
r += 1
table.cell(dash, 0, r, "Range", text_color=color.gray, text_size=size.tiny)
today_range = today_high - today_low
table.cell(dash, 1, r, str.tostring(today_range, "#") + "p", text_color=color.aqua, text_size=size.tiny)
// Previous Day
r += 1
table.cell(dash, 0, r, "PREV H/L", text_color=color.aqua, text_size=size.tiny)
table.cell(dash, 1, r, str.tostring(yest_size, "#") + "p", text_color=daily_ok ? color.lime : color.red, text_size=size.tiny)
// ORB Status with real-time values
r += 1
table.cell(dash, 0, r, "ORB 7:40-8:00", text_color=color.aqua, text_size=size.tiny)
orb_status = is_building ? "BUILDING" : (orb_ready ? "READY" : "WAIT")
orb_clr = is_building ? color.orange : (orb_ready ? color.lime : color.gray)
table.cell(dash, 1, r, orb_status, text_color=orb_clr, text_size=size.tiny)
r += 1
table.cell(dash, 0, r, "High", text_color=color.gray, text_size=size.tiny)
orb_h_txt = not na(current_orb_h) ? str.tostring(current_orb_h, "#.##") : "---"
table.cell(dash, 1, r, orb_h_txt, text_color=is_building ? color.orange : color.green, text_size=size.tiny)
r += 1
table.cell(dash, 0, r, "Low", text_color=color.gray, text_size=size.tiny)
orb_l_txt = not na(current_orb_l) ? str.tostring(current_orb_l, "#.##") : "---"
table.cell(dash, 1, r, orb_l_txt, text_color=is_building ? color.orange : color.red, text_size=size.tiny)
r += 1
table.cell(dash, 0, r, "Size", text_color=color.gray, text_size=size.tiny)
orb_size = not na(current_orb_h) and not na(current_orb_l) ? current_orb_h - current_orb_l : 0
table.cell(dash, 1, r, str.tostring(orb_size, "#") + "p", text_color=color.yellow, text_size=size.tiny)
// Strategies
r += 1
table.cell(dash, 0, r, "STRATEGIES", text_color=color.aqua, text_size=size.tiny)
table.cell(dash, 1, r, str.tostring(bull_v) + "B " + str.tostring(bear_v) + "S", text_color=color.yellow, text_size=size.tiny)
// Analytics
r += 1
table.cell(dash, 0, r, "PROBABILITY", text_color=color.white, bgcolor=color.new(color.purple, 70), text_size=size.small)
prob_c = probability >= 70 ? color.lime : (probability >= 50 ? color.yellow : color.red)
table.cell(dash, 1, r, str.tostring(probability, "#") + "%", text_color=prob_c, bgcolor=color.new(color.purple, 70), text_size=size.small)
r += 1
table.cell(dash, 0, r, "Direction", text_color=color.gray, text_size=size.tiny)
dir_c = str.contains(direction, "BULL") ? color.lime : (str.contains(direction, "BEAR") ? color.red : color.gray)
table.cell(dash, 1, r, direction, text_color=dir_c, text_size=size.tiny)
r += 1
table.cell(dash, 0, r, "Chart", text_color=color.gray, text_size=size.tiny)
qual_c = quality == "CLEAN" ? color.lime : (quality == "GOOD" ? color.green : (quality == "OK" ? color.yellow : color.red))
table.cell(dash, 1, r, quality, text_color=qual_c, text_size=size.tiny)
r += 1
table.cell(dash, 0, r, "OK Trade?", text_color=color.gray, text_size=size.tiny)
table.cell(dash, 1, r, ok_trade ? "YES" : "NO", text_color=ok_trade ? color.lime : color.red, text_size=size.tiny)
// Position Status
r += 1
pos_txt = in_long ? "IN LONG" : (in_short ? "IN SHORT" : "NO POSITION")
pos_c = in_long ? color.lime : (in_short ? color.red : color.gray)
table.cell(dash, 0, r, "POSITION", text_color=color.white, bgcolor=color.new(color.blue, 50), text_size=size.small)
table.cell(dash, 1, r, pos_txt, text_color=pos_c, bgcolor=color.new(color.blue, 50), text_size=size.small)
// Show trailing stops if in position
if in_long and not na(trailing_sl_long)
r += 1
table.cell(dash, 0, r, "Trail SL", text_color=color.gray, text_size=size.tiny)
table.cell(dash, 1, r, str.tostring(trailing_sl_long, "#.##"), text_color=color.red, text_size=size.tiny)
r += 1
table.cell(dash, 0, r, "Trail TP", text_color=color.gray, text_size=size.tiny)
table.cell(dash, 1, r, str.tostring(trailing_tp_long, "#.##"), text_color=color.lime, text_size=size.tiny)
r += 1
table.cell(dash, 0, r, "Profit", text_color=color.gray, text_size=size.tiny)
pnl = close - buy_entry
pnl_c = pnl > 0 ? color.lime : color.red
table.cell(dash, 1, r, str.tostring(pnl, "#.#") + "p", text_color=pnl_c, text_size=size.tiny)
if in_short and not na(trailing_sl_short)
r += 1
table.cell(dash, 0, r, "Trail SL", text_color=color.gray, text_size=size.tiny)
table.cell(dash, 1, r, str.tostring(trailing_sl_short, "#.##"), text_color=color.red, text_size=size.tiny)
r += 1
table.cell(dash, 0, r, "Trail TP", text_color=color.gray, text_size=size.tiny)
table.cell(dash, 1, r, str.tostring(trailing_tp_short, "#.##"), text_color=color.lime, text_size=size.tiny)
r += 1
table.cell(dash, 0, r, "Profit", text_color=color.gray, text_size=size.tiny)
pnl = sell_entry - close
pnl_c = pnl > 0 ? color.lime : color.red
table.cell(dash, 1, r, str.tostring(pnl, "#.#") + "p", text_color=pnl_c, text_size=size.tiny)
// Signal
r += 1
table.cell(dash, 0, r, "SIGNAL", text_color=color.white, bgcolor=color.new(color.green, 50), text_size=size.small)
sig_txt = buy_final ? "BUY NOW" : (sell_final ? "SELL NOW" : "WAIT")
sig_c = buy_final ? color.lime : (sell_final ? color.red : color.gray)
table.cell(dash, 1, r, sig_txt, text_color=sig_c, bgcolor=color.new(color.green, 50), text_size=size.small)
// IMMEDIATE Trade Levels - Show as soon as ORB is ready
if orb_ready and not na(long_entry) and not na(short_entry)
r += 1
table.cell(dash, 0, r, "LONG LEVELS", text_color=color.lime, bgcolor=color.new(color.green, 70), text_size=size.tiny)
table.cell(dash, 1, r, "", text_color=color.white)
r += 1
table.cell(dash, 0, r, "Entry", text_color=color.gray, text_size=size.tiny)
table.cell(dash, 1, r, str.tostring(long_entry, "#.##"), text_color=color.white, text_size=size.tiny)
r += 1
table.cell(dash, 0, r, "SL", text_color=color.gray, text_size=size.tiny)
table.cell(dash, 1, r, str.tostring(long_sl, "#.##"), text_color=color.red, text_size=size.tiny)
r += 1
table.cell(dash, 0, r, "TP", text_color=color.gray, text_size=size.tiny)
table.cell(dash, 1, r, str.tostring(long_tp, "#.##"), text_color=color.lime, text_size=size.tiny)
r += 1
table.cell(dash, 0, r, "SHORT LEVELS", text_color=color.red, bgcolor=color.new(color.red, 70), text_size=size.tiny)
table.cell(dash, 1, r, "", text_color=color.white)
r += 1
table.cell(dash, 0, r, "Entry", text_color=color.gray, text_size=size.tiny)
table.cell(dash, 1, r, str.tostring(short_entry, "#.##"), text_color=color.white, text_size=size.tiny)
r += 1
table.cell(dash, 0, r, "SL", text_color=color.gray, text_size=size.tiny)
table.cell(dash, 1, r, str.tostring(short_sl, "#.##"), text_color=color.red, text_size=size.tiny)
r += 1
table.cell(dash, 0, r, "TP", text_color=color.gray, text_size=size.tiny)
table.cell(dash, 1, r, str.tostring(short_tp, "#.##"), text_color=color.lime, text_size=size.tiny)
// ════════════════════════ ALERTS ════════════════════════
alertcondition(buy_final, "BUY Signal", "DAX ORB BUY")
alertcondition(sell_final, "SELL Signal", "DAX ORB SELL")
alertcondition(orb_ready and not orb_ready , "ORB Ready", "DAX ORB READY")
alertcondition(is_building and not is_building , "ORB Building", "DAX ORB BUILDING")
alertcondition(ok_trade and not ok_trade , "Ready to Trade", "DAX OK")
