[STRATEGY]EMA 30/60 Cross Strategystrategy based on EMA 30/60 cross
works best on 4hr timeframes & high-midcaps
Search in scripts for "美元汇率30天走势"

5 Moving Average Exponential 7-15-30-50-2005 Moving Average Exponential. Crypto EMA. 7 is a fast support or resistance, 15 confirmation support or resistance. 30 Important support and resistance. 50 institutional support or resistance. 200 general trend, support and resistance.

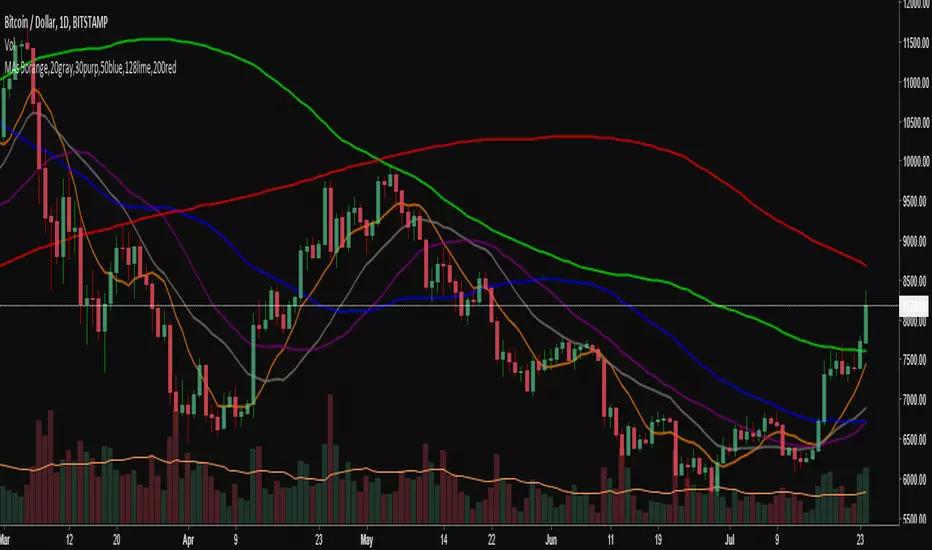
6 SMA's (fit to BTC) 9,20,30,50,128,200 (exponential optional)I've been using these for a while trading Bitcoin and I've found them to be the most useful to me. I replaced the 7 you may have seen in the first set with the 9 as I'm seeing it tested across many time frames quite frequently. The least used of the six is the 30 period, but it does have some influence I've found on the large time frames, mainly the weekly.

6 Simple Moving Averages 9,20,30,50,128,200 (bitcoin tested)I've condensed my SMAs down to these 6 and have found them to be most useful for Bitcoin, which is what I trade the most. They all have played their roll in acting as support and resistance and making decisions with the 30 period probably the least relevant, but relevant nonetheless. There is the option to change to exponential if desired.

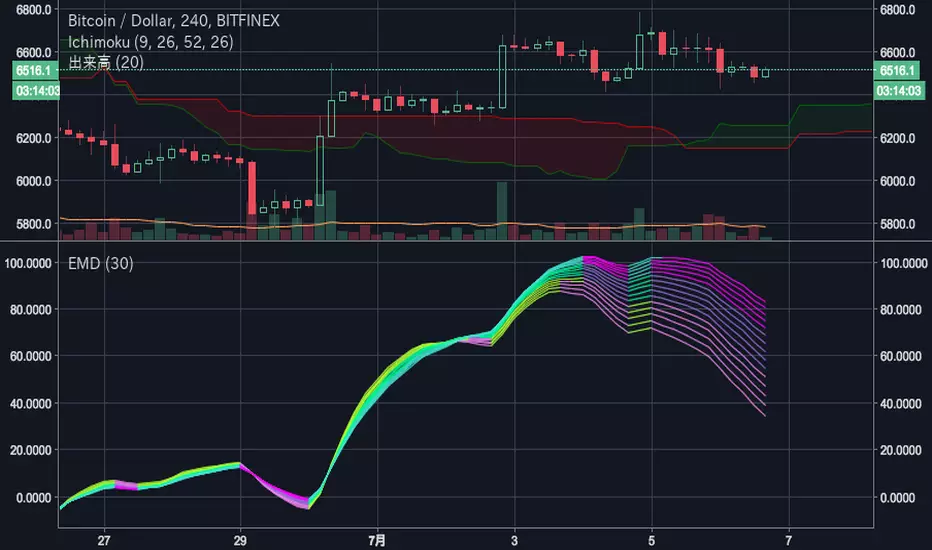
EvaMacD for 30 linesEva Chart calculate IIR Filter with Multiple MACD Histogram and estimate the cycle.
This oscillator can find the most powerful frequency. This use 30 MACD histogram lines tuned for filter.

Simple Moving Averages (7, 30, 50, 100, 200)7, 30, 50, 100, 200 simple moving averages, bundled in one indicator (for users who are using the free TradingView service and can only load limited number of indicators at any given time).
You can turn each moving average on or off at will and change the colors.

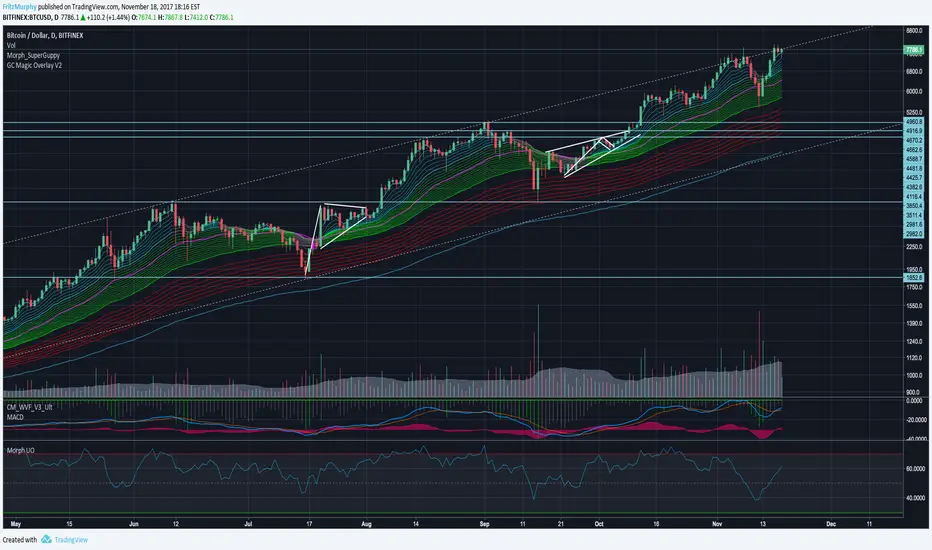
Guppy MMA 3, 5, 8, 10, 12, 15 and 30, 35, 40, 45, 50, 60Guppy Multiple Moving Average
Short Term EMA 3, 5, 8, 10, 12, 15
Long Term EMA 30, 35, 40, 45, 50, 60
Use for SFTS Class

Ultimate Oscillator with 70/30/50 LinesUltimate Oscillator with 70/30/50 lines and a background.
Read how to use it here:
stockcharts.com
Enjoy :)


Mark 30m High/Low on 1m30 MIN HIGHS AND LOWS
Marked on the one minute chart.
High is marked with a green line.
Low is marked with a red line.
MTF EMA Pane with Diagnostics30 sec chart, 1 min EMA goes flat, I buy, 1 min EMA stays inside the group, I stay in the trade.
Not financial advice. I am working on an Algo killer, stay tuned. I am dedicating the rest of my life, as short as it my be, to beating the Men behind the Algo's. Buy me some coffee.
Send USDT thru ETH or Base to BYDFi 0x20391e32afd61dc9e1ec027651391b56ceade4e0
Join BYDFi
Referral Link: Spin for a possible $100
partner.bydfi.com
Deposit: USDT via;
ETH (ERC20) 0x20391e32afd61dc9e1ec027651391b56ceade4e0
Tron (TRC20)
TUs5u2YxtQrQfRwYK2CsMmSDGvND6Uopdj
BNB/Base (BEP20)
0x20391e32afd61dc9e1ec027651391b56ceade4e0
Solana
696LAngiQBbdk4m6k1ZBiKZrFtjTJo6dxCnVXMEePQea

30s OR ProjectionsThis script gets the opening range for NQ,ES, and YM. It then created deviations based on this range as targets to take profit from. You may also use the deviations to enter into trades looking for the other side of the range. You have the ability to shade areas of the range.

7:30 AM ET Bar HighlighterHow it works
Step Explanation
1️⃣ hour(time, targetTZ) and minute(time, targetTZ) convert each bar’s opening time to America/New_York and check for 7 : 25.
2️⃣ When both match, isTargetBar becomes true.
3️⃣ bgcolor() paints that candle red, and plotshape() draws the white dot just above it.
Adjustable Color Changing WMA by Slope Degree30 weighted moving average that changes colors based upon degree of slope. Consider it a green light for buying/selling pullbacks to the wma. You can adjust the colors and the threshold for the degree of slope.

30 Day Moving AverageThis indicator offers a longer time frame view compared to the 9 day moving average. This can give a better indication over longer term market moves.

DTC Intra+DTC Intra+
Complete Indian Intraday Trading Indicator
What This Indicator Does:
DTC Intra+ is a comprehensive intraday trading indicator designed specifically for Indian markets. It provides real-time session analysis, volume profiling, and technical insights that work consistently across all timeframes.
Key Features:
Multi-Timeframe Data Consistency
Solves the common problem where indicators show different values on different timeframes
Gap percentage, ADR (Average Daily Range), and Burst values remain consistent whether viewing 1-minute or daily charts
Uses proprietary algorithms to fetch daily data and apply it accurately to intraday calculations
Intelligent Session Detection
Automatically detects and displays three Indian market sessions: Morning (9:15-11:00 AM), Mid-Day (11:00-1:30 PM), Afternoon (1:30-3:30 PM)
Creates visual session boxes that extend dynamically and finalize at session boundaries
Each session maintains distinct colors and labels for easy identification
Advanced Volume Analysis
Calculates Relative Volume (RVol) using 21-period moving average for volume strength assessment
Colors candles based on volume strength: high/moderate bullish and bearish volume patterns
Customizable volume thresholds (150% and 200% of average volume) for precise signal generation
Pattern Recognition System
Identifies mini-coil consolidation patterns with customizable styling options
Maintains visual persistence across timeframes and chart updates
Configurable lookback periods and pattern validation algorithms
Technical Analysis Tools
Four customizable Moving Averages (10, 20, 50, 200) with multiple calculation types (SMA, EMA, WMA, HMA)
VWAP integration with theme-adaptive styling
Gap analysis with customizable thresholds (1% and 2%+) and visual alerts
Theme-Adaptive Interface
Automatically detects and adapts to dark or light chart themes
Professional color schemes optimized for both theme types
Customizable transparency and styling for all visual elements
Information Dashboard
Dynamic information table displaying Gap %, RVol, ADR, Burst, Sector, Industry, Theme, and Session data
Real-time sector and industry classification from TradingView data
Burst Ranker with descriptive labels (GREAT, GOOD, LOW) based on historical performance analysis
How It Works:
Session Management:
The indicator uses time-based detection algorithms to identify Indian market sessions, creating visual boxes that extend dynamically and finalize at session boundaries. Each session maintains its own color scheme and label system.
Data Consistency Engine:
Proprietary cross-timeframe calculation system ensures that daily metrics display consistently across all timeframes by fetching daily data and applying it to intraday calculations.
Volume Profiling:
Custom volume analysis algorithms calculate relative volume strength and apply color coding to candles based on volume thresholds and price direction, providing immediate visual feedback on market activity.
Pattern Detection:
Advanced consolidation pattern recognition system that identifies mini-coil formations using customizable parameters and maintains visual persistence across chart updates.
How To Use:
Apply to any Indian stock chart (BSE, NSDL) on intraday timeframes
Session times are pre-configured for Indian markets but can be customized
Moving Averages can be adjusted to your preferred lengths and calculation types
Volume thresholds can be modified based on your trading strategy
Monitor the information panel for real-time market insights
Use session boxes to identify optimal trading windows
Who This Is For:
Indian intraday traders seeking comprehensive market analysis
Traders who need consistent data across multiple timeframes
Volume-based traders requiring real-time volume strength analysis
Technical analysts needing session-based market structure insights
Busy professionals who want market insights without constant chart monitoring
What Makes It Unique:
Unlike basic session indicators, DTC Intra+ provides cross-timeframe data consistency, advanced volume profiling, and comprehensive Indian market analysis in a single, theme-adaptive interface. The proprietary algorithms ensure accurate daily metrics on intraday charts, making it essential for serious Indian market traders who need reliable, consistent data across all timeframes.
The Bottom Line:
This indicator transforms how you view Indian intraday markets by providing consistent, reliable data across all timeframes while offering advanced session analysis, volume profiling, and pattern recognition. It's designed specifically for Indian market characteristics and trading patterns, giving you the tools to trade with confidence and precision.

PnL Bubble [%] | Fractalyst1. What's the indicator purpose?
The PnL Bubble indicator transforms your strategy's trade PnL percentages into an interactive bubble chart with professional-grade statistics and performance analytics. It helps traders quickly assess system profitability, understand win/loss distribution patterns, identify outliers, and make data-driven strategy improvements.
How does it work?
Think of this indicator as a visual report card for your trading performance. Here's what it does:
What You See
Colorful Bubbles: Each bubble represents one of your trades
Blue/Cyan bubbles = Winning trades (you made money)
Red bubbles = Losing trades (you lost money)
Bigger bubbles = Bigger wins or losses
Smaller bubbles = Smaller wins or losses
How It Organizes Your Trades:
Like a Photo Album: Instead of showing all your trades at once (which would be messy), it shows them in "pages" of 500 trades each:
Page 1: Your first 500 trades
Page 2: Trades 501-1000
Page 3: Trades 1001-1500, etc.
What the Numbers Tell You:
Average Win: How much money you typically make on winning trades
Average Loss: How much money you typically lose on losing trades
Expected Value (EV): Whether your trading system makes money over time
Positive EV = Your system is profitable long-term
Negative EV = Your system loses money long-term
Payoff Ratio (R): How your average win compares to your average loss
R > 1 = Your wins are bigger than your losses
R < 1 = Your losses are bigger than your wins
Why This Matters:
At a Glance: You can instantly see if you're a profitable trader or not
Pattern Recognition: Spot if you have more big wins than big losses
Performance Tracking: Watch how your trading improves over time
Realistic Expectations: Understand what "average" performance looks like for your system
The Cool Visual Effects:
Animation: The bubbles glow and shimmer to make the chart more engaging
Highlighting: Your biggest wins and losses get extra attention with special effects
Tooltips: hover any bubble to see details about that specific trade.
What are the underlying calculations?
The indicator processes trade PnL data using a dual-matrix architecture for optimal performance:
Dual-Matrix System:
• Display Matrix (display_matrix): Bounded to 500 trades for rendering performance
• Statistics Matrix (stats_matrix): Unbounded storage for complete statistical accuracy
Trade Classification & Aggregation:
// Separate wins, losses, and break-even trades
if val > 0.0
pos_sum += val // Sum winning trades
pos_count += 1 // Count winning trades
else if val < 0.0
neg_sum += val // Sum losing trades
neg_count += 1 // Count losing trades
else
zero_count += 1 // Count break-even trades
Statistical Averages:
avg_win = pos_count > 0 ? pos_sum / pos_count : na
avg_loss = neg_count > 0 ? math.abs(neg_sum) / neg_count : na
Win/Loss Rates:
total_obs = pos_count + neg_count + zero_count
win_rate = pos_count / total_obs
loss_rate = neg_count / total_obs
Expected Value (EV):
ev_value = (avg_win × win_rate) - (avg_loss × loss_rate)
Payoff Ratio (R):
R = avg_win ÷ |avg_loss|
Contribution Analysis:
ev_pos_contrib = avg_win × win_rate // Positive EV contribution
ev_neg_contrib = avg_loss × loss_rate // Negative EV contribution
How to integrate with any trading strategy?
Equity Change Tracking Method:
//@version=6
strategy("Your Strategy with Equity Change Export", overlay=true)
float prev_trade_equity = na
float equity_change_pct = na
if barstate.isconfirmed and na(prev_trade_equity)
prev_trade_equity := strategy.equity
trade_just_closed = strategy.closedtrades != strategy.closedtrades
if trade_just_closed and not na(prev_trade_equity)
current_equity = strategy.equity
equity_change_pct := ((current_equity - prev_trade_equity) / prev_trade_equity) * 100
prev_trade_equity := current_equity
else
equity_change_pct := na
plot(equity_change_pct, "Equity Change %", display=display.data_window)
Integration Steps:
1. Add equity tracking code to your strategy
2. Load both strategy and PnL Bubble indicator on the same chart
3. In bubble indicator settings, select your strategy's equity tracking output as data source
4. Configure visualization preferences (colors, effects, page navigation)
How does the pagination system work?
The indicator uses an intelligent pagination system to handle large trade datasets efficiently:
Page Organization:
• Page 1: Trades 1-500 (most recent)
• Page 2: Trades 501-1000
• Page 3: Trades 1001-1500
• Page N: Trades to
Example: With 1,500 trades total (3 pages available):
• User selects Page 1: Shows trades 1-500
• User selects Page 4: Automatically falls back to Page 3 (trades 1001-1500)
5. Understanding the Visual Elements
Bubble Visualization:
• Color Coding: Cyan/blue gradients for wins, red gradients for losses
• Size Mapping: Bubble size proportional to trade magnitude (larger = bigger P&L)
• Priority Rendering: Largest trades displayed first to ensure visibility
• Gradient Effects: Color intensity increases with trade magnitude within each category
Interactive Tooltips:
Each bubble displays quantitative trade information:
tooltip_text = outcome + " | PnL: " + pnl_str +
"\nDate: " + date_str + " " + time_str +
"\nTrade #" + str.tostring(trade_number) + " (Page " + str.tostring(active_page) + ")" +
"\nRank: " + str.tostring(rank) + " of " + str.tostring(n_display_rows) +
"\nPercentile: " + str.tostring(percentile, "#.#") + "%" +
"\nMagnitude: " + str.tostring(magnitude_pct, "#.#") + "%"
Example Tooltip:
Win | PnL: +2.45%
Date: 2024.03.15 14:30
Trade #1,247 (Page 3)
Rank: 5 of 347
Percentile: 98.6%
Magnitude: 85.2%
Reference Lines & Statistics:
• Average Win Line: Horizontal reference showing typical winning trade size
• Average Loss Line: Horizontal reference showing typical losing trade size
• Zero Line: Threshold separating wins from losses
• Statistical Labels: EV, R-Ratio, and contribution analysis displayed on chart
What do the statistical metrics mean?
Expected Value (EV):
Represents the mathematical expectation per trade in percentage terms
EV = (Average Win × Win Rate) - (Average Loss × Loss Rate)
Interpretation:
• EV > 0: Profitable system with positive mathematical expectation
• EV = 0: Break-even system, profitability depends on execution
• EV < 0: Unprofitable system with negative mathematical expectation
Example: EV = +0.34% means you expect +0.34% profit per trade on average
Payoff Ratio (R):
Quantifies the risk-reward relationship of your trading system
R = Average Win ÷ |Average Loss|
Interpretation:
• R > 1.0: Wins are larger than losses on average (favorable risk-reward)
• R = 1.0: Wins and losses are equal in magnitude
• R < 1.0: Losses are larger than wins on average (unfavorable risk-reward)
Example: R = 1.5 means your average win is 50% larger than your average loss
Contribution Analysis (Σ):
Breaks down the components of expected value
Positive Contribution (Σ+) = Average Win × Win Rate
Negative Contribution (Σ-) = Average Loss × Loss Rate
Purpose:
• Shows how much wins contribute to overall expectancy
• Shows how much losses detract from overall expectancy
• Net EV = Σ+ - Σ- (Expected Value per trade)
Example: Σ+: 1.23% means wins contribute +1.23% to expectancy
Example: Σ-: -0.89% means losses drag expectancy by -0.89%
Win/Loss Rates:
Win Rate = Count(Wins) ÷ Total Trades
Loss Rate = Count(Losses) ÷ Total Trades
Shows the probability of winning vs losing trades
Higher win rates don't guarantee profitability if average losses exceed average wins
7. Demo Mode & Synthetic Data Generation
When using built-in sources (close, open, etc.), the indicator generates realistic demo trades for testing:
if isBuiltInSource(source_data)
// Generate random trade outcomes with realistic distribution
u_sign = prand(float(time), float(bar_index))
if u_sign < 0.5
v_push := -1.0 // Loss trade
else
// Skewed distribution favoring smaller wins (realistic)
u_mag = prand(float(time) + 9876.543, float(bar_index) + 321.0)
k = 8.0 // Skewness factor
t = math.pow(u_mag, k)
v_push := 2.5 + t * 8.0 // Win trade
Demo Characteristics:
• Realistic win/loss distribution mimicking actual trading patterns
• Skewed distribution favoring smaller wins over large wins
• Deterministic randomness for consistent demo results
• Includes jitter effects to prevent visual overlap
8. Performance Limitations & Optimizations
Display Constraints:
points_count = 500 // Maximum 500 dots per page for optimal performance
Pine Script v6 Limits:
• Label Count: Maximum 500 labels per indicator
• Line Count: Maximum 100 lines per indicator
• Box Count: Maximum 50 boxes per indicator
• Matrix Size: Efficient memory management with dual-matrix system
Optimization Strategies:
• Pagination System: Handle unlimited trades through 500-trade pages
• Priority Rendering: Largest trades displayed first for maximum visibility
• Dual-Matrix Architecture: Separate display (bounded) from statistics (unbounded)
• Smart Fallback: Automatic page clamping prevents empty displays
Impact & Workarounds:
• Visual Limitation: Only 500 trades visible per page
• Statistical Accuracy: Complete dataset used for all calculations
• Navigation: Use page input to browse through entire trade history
• Performance: Smooth operation even with thousands of trades
9. Statistical Accuracy Guarantees
Data Integrity:
• Complete Dataset: Statistics matrix stores ALL trades without limit
• Proper Aggregation: Separate tracking of wins, losses, and break-even trades
• Mathematical Precision: Pine Script v6's enhanced floating-point calculations
• Dual-Matrix System: Display limitations don't affect statistical accuracy
Calculation Validation:
// Verified formulas match standard trading mathematics
avg_win = pos_sum / pos_count // Standard average calculation
win_rate = pos_count / total_obs // Standard probability calculation
ev_value = (avg_win * win_rate) - (avg_loss * loss_rate) // Standard EV formula
Accuracy Features:
• Mathematical Correctness: Formulas follow established trading statistics
• Data Preservation: Complete dataset maintained for all calculations
• Precision Handling: Proper rounding and boundary condition management
• Real-Time Updates: Statistics recalculated on every new trade
10. Advanced Technical Features
Real-Time Animation Engine:
// Shimmer effects with sine wave modulation
offset = math.sin(shimmer_t + phase) * amp
// Dynamic transparency with organic flicker
new_transp = math.min(flicker_limit, math.max(-flicker_limit, cur_transp + dir * flicker_step))
• Sine Wave Shimmer: Dynamic glowing effects on bubbles
• Organic Flicker: Random transparency variations for natural feel
• Extreme Value Highlighting: Special visual treatment for outliers
• Smooth Animations: Tick-based updates for fluid motion
Magnitude-Based Priority Rendering:
// Sort trades by magnitude for optimal visual hierarchy
sort_indices_by_magnitude(values_mat)
• Largest First: Most important trades always visible
• Intelligent Sorting: Custom bubble sort algorithm for trade prioritization
• Performance Optimized: Efficient sorting for real-time updates
• Visual Hierarchy: Ensures critical trades never get hidden
Professional Tooltip System:
• Quantitative Data: Pure numerical information without interpretative language
• Contextual Ranking: Shows trade position within page dataset
• Percentile Analysis: Performance ranking as percentage
• Magnitude Scaling: Relative size compared to page maximum
• Professional Format: Clean, data-focused presentation
11. Quick Start Guide
Step 1: Add Indicator
• Search for "PnL Bubble | Fractalyst" in TradingView indicators
• Add to your chart (works on any timeframe)
Step 2: Configure Data Source
• Demo Mode: Leave source as "close" to see synthetic trading data
• Strategy Mode: Select your strategy's PnL% output as data source
Step 3: Customize Visualization
• Colors: Set positive (cyan), negative (red), and neutral colors
• Page Navigation: Use "Trade Page" input to browse trade history
• Visual Effects: Built-in shimmer and animation effects are enabled by default
Step 4: Analyze Performance
• Study bubble patterns for win/loss distribution
• Review statistical metrics: EV, R-Ratio, Win Rate
• Use tooltips for detailed trade analysis
• Navigate pages to explore full trade history
Step 5: Optimize Strategy
• Identify outlier trades (largest bubbles)
• Analyze risk-reward profile through R-Ratio
• Monitor Expected Value for system profitability
• Use contribution analysis to understand win/loss impact
12. Why Choose PnL Bubble Indicator?
Unique Advantages:
• Advanced Pagination: Handle unlimited trades with smart fallback system
• Dual-Matrix Architecture: Perfect balance of performance and accuracy
• Professional Statistics: Institution-grade metrics with complete data integrity
• Real-Time Animation: Dynamic visual effects for engaging analysis
• Quantitative Tooltips: Pure numerical data without subjective interpretations
• Priority Rendering: Intelligent magnitude-based display ensures critical trades are always visible
Technical Excellence:
• Built with Pine Script v6 for maximum performance and modern features
• Optimized algorithms for smooth operation with large datasets
• Complete statistical accuracy despite display optimizations
• Professional-grade calculations matching institutional trading analytics
Practical Benefits:
• Instantly identify system profitability through visual patterns
• Spot outlier trades and risk management issues
• Understand true risk-reward profile of your strategies
• Make data-driven decisions for strategy optimization
• Professional presentation suitable for performance reporting
Disclaimer & Risk Considerations:
Important: Historical performance metrics, including positive Expected Value (EV), do not guarantee future trading success. Statistical measures are derived from finite sample data and subject to inherent limitations:
• Sample Bias: Historical data may not represent future market conditions or regime changes
• Ergodicity Assumption: Markets are non-stationary; past statistical relationships may break down
• Survivorship Bias: Strategies showing positive historical EV may fail during different market cycles
• Parameter Instability: Optimal parameters identified in backtesting often degrade in forward testing
• Transaction Cost Evolution: Slippage, spreads, and commission structures change over time
• Behavioral Factors: Live trading introduces psychological elements absent in backtesting
• Black Swan Events: Extreme market events can invalidate statistical assumptions instantaneously

Quarterly Cycle Theory with DST time AdjustedThe Quarterly Theory removes ambiguity, as it gives specific time-based reference points to look for when entering trades. Before being able to apply this theory to trading, one must first understand that time is fractal:
Yearly Quarters = 4 quarters of three months each.
Monthly Quarters = 4 quarters of one week each.
Weekly Quarters = 4 quarters of one day each (Monday - Thursday). Friday has its own specific function.
Daily Quarters = 4 quarters of 6 hours each = 4 trading sessions of a trading day.
Sessions Quarters = 4 quarters of 90 minutes each.
90 Minute Quarters = 4 quarters of 22.5 minutes each.
Yearly Cycle: Analogously to financial quarters, the year is divided in four sections of three months each:
Q1 - January, February, March.
Q2 - April, May, June (True Open, April Open).
Q3 - July, August, September.
Q4 - October, November, December.
S&P 500 E-mini Futures (daily candles) — Monthly Cycle.
Monthly Cycle: Considering that we have four weeks in a month, we start the cycle on the first month’s Monday (regardless of the calendar Day):
Q1 - Week 1: first Monday of the month.
Q2 - Week 2: second Monday of the month (True Open, Daily Candle Open Price).
Q3 - Week 3: third Monday of the month.
Q4 - Week 4: fourth Monday of the month.
S&P 500 E-mini Futures (4 hour candles) — Weekly Cycle.
Weekly Cycle: Daye determined that although the trading week is composed by 5 trading days, we should ignore Friday, and the small portion of Sunday’s price action:
Q1 - Monday.
Q2 - Tuesday (True Open, Daily Candle Open Price).
Q3 - Wednesday.
Q4 - Thursday.
S&P 500 E-mini Futures (1 hour candles) — Daily Cycle.
Daily Cycle: The Day can be broken down into 6 hour quarters. These times roughly define the sessions of the trading day, reinforcing the theory’s validity:
Q1 - 18:00 - 00:00 Asia.
Q2 - 00:00 - 06:00 London (True Open).
Q3 - 06:00 - 12:00 NY AM.
Q4 - 12:00 - 18:00 NY PM.
S&P 500 E-mini Futures (15 minute candles) — 6 Hour Cycle.
6 Hour Quarters or 90 Minute Cycle / Sessions divided into four sections of 90 minutes each (EST/EDT):
Asian Session
Q1 - 18:00 - 19:30
Q2 - 19:30 - 21:00 (True Open)
Q3 - 21:00 - 22:30
Q4 - 22:30 - 00:00
London Session
Q1 - 00:00 - 01:30
Q2 - 01:30 - 03:00 (True Open)
Q3 - 03:00 - 04:30
Q4 - 04:30 - 06:00
NY AM Session
Q1 - 06:00 - 07:30
Q2 - 07:30 - 09:00 (True Open)
Q3 - 09:00 - 10:30
Q4 - 10:30 - 12:00
NY PM Session
Q1 - 12:00 - 13:30
Q2 - 13:30 - 15:00 (True Open)
Q3 - 15:00 - 16:30
Q4 - 16:30 - 18:00
S&P 500 E-mini Futures (5 minute candles) — 90 Minute Cycle.
Micro Cycles: Dividing the 90 Minute Cycle yields 22.5 Minute Quarters, also known as Micro Sessions or Micro Quarters:
Asian Session
Q1/1 18:00:00 - 18:22:30
Q2 18:22:30 - 18:45:00
Q3 18:45:00 - 19:07:30
Q4 19:07:30 - 19:30:00
Q2/1 19:30:00 - 19:52:30 (True Session Open)
Q2/2 19:52:30 - 20:15:00
Q2/3 20:15:00 - 20:37:30
Q2/4 20:37:30 - 21:00:00
Q3/1 21:00:00 - 21:23:30
etc. 21:23:30 - 21:45:00
London Session
00:00:00 - 00:22:30 (True Daily Open)
00:22:30 - 00:45:00
00:45:00 - 01:07:30
01:07:30 - 01:30:00
01:30:00 - 01:52:30 (True Session Open)
01:52:30 - 02:15:00
02:15:00 - 02:37:30
02:37:30 - 03:00:00
03:00:00 - 03:22:30
03:22:30 - 03:45:00
03:45:00 - 04:07:30
04:07:30 - 04:30:00
04:30:00 - 04:52:30
04:52:30 - 05:15:00
05:15:00 - 05:37:30
05:37:30 - 06:00:00
New York AM Session
06:00:00 - 06:22:30
06:22:30 - 06:45:00
06:45:00 - 07:07:30
07:07:30 - 07:30:00
07:30:00 - 07:52:30 (True Session Open)
07:52:30 - 08:15:00
08:15:00 - 08:37:30
08:37:30 - 09:00:00
09:00:00 - 09:22:30
09:22:30 - 09:45:00
09:45:00 - 10:07:30
10:07:30 - 10:30:00
10:30:00 - 10:52:30
10:52:30 - 11:15:00
11:15:00 - 11:37:30
11:37:30 - 12:00:00
New York PM Session
12:00:00 - 12:22:30
12:22:30 - 12:45:00
12:45:00 - 13:07:30
13:07:30 - 13:30:00
13:30:00 - 13:52:30 (True Session Open)
13:52:30 - 14:15:00
14:15:00 - 14:37:30
14:37:30 - 15:00:00
15:00:00 - 15:22:30
15:22:30 - 15:45:00
15:45:00 - 15:37:30
15:37:30 - 16:00:00
16:00:00 - 16:22:30
16:22:30 - 16:45:00
16:45:00 - 17:07:30
17:07:30 - 18:00:00
S&P 500 E-mini Futures (30 second candles) — 22.5 Minute Cycle.

HSM TOOLS//@version=5
indicator("HSM TOOLS", overlay=true, max_lines_count=500, max_labels_count=5, max_boxes_count=500)
// General Settings Inputs
TZI = input.string (defval="UTC -4", title="Timezone Selection", options= , tooltip="Select the Timezone. ( Shifts Chart Elements )", group="Global Settings")
Timezone = TZI == "UTC -10" ? "GMT-10:00" : TZI == "UTC -7" ? "GMT-07:00" : TZI == "UTC -6" ? "GMT-06:00" : TZI == "UTC -5" ? "GMT-05:00" : TZI == "UTC -4" ? "GMT-04:00" : TZI == "UTC -3" ? "GMT-03:00" : TZI == "UTC +0" ? "GMT+00:00" : TZI == "UTC +1" ? "GMT+01:00" : TZI == "UTC +2" ? "GMT+02:00" : TZI == "UTC +3" ? "GMT+03:00" : TZI == "UTC +3:30" ? "GMT+03:30" : TZI == "UTC +4" ? "GMT+04:00" : TZI == "UTC +5" ? "GMT+05:00" : TZI == "UTC +5:30" ? "GMT+05:30" : TZI == "UTC +6" ? "GMT+06:00" : TZI == "UTC +7" ? "GMT+07:00" : TZI == "UTC +8" ? "GMT+08:00" : TZI == "UTC +9" ? "GMT+09:00" : TZI == "UTC +9:30" ? "GMT+09:30" : TZI == "UTC +10" ? "GMT+10:00" : TZI == "UTC +10:30" ? "GMT+10:30" : TZI == "UTC +11" ? "GMT+11:00" : TZI == "UTC +13" ? "GMT+13:00" : "GMT+13:45"
inputMaxInterval = input.int (31, title="Hide Indicator Above Specified Minutes", tooltip="Above 30Min, Chart Will Become Messy & Unreadable", group="Global Settings")
// Session options
ShowTSO = input.bool (true, title="Show Today's Session Only", group="Session Options", tooltip="Hide Historical Sessions")
ShowTWO = input.bool (true, title="Show Current Week's Sessions Only", group="Session Options", tooltip="Show All Sessions from the current week")
SL4W = input.bool (true, title="Show Last 4 Week Sessions", group="Session Options", tooltip="Show All Sessions from Last Four Weeks \nShould Disable Current Week Session to Work")
ShowSFill = input.bool (false, title="Show Session Highlighting", group="Session Options", tooltip="Highlights Session from Top of the Chart to Bottom")
//----------------------------------------------
// Historical Lines
ShowMOPL = input.bool (title="Midnight Historical Price Lines", defval=false, group="Historical Lines", tooltip="Shows Historical Midnight Price Lines")
MOLHist = input.bool (title="Midnight Historical Vertical Lines", defval=true, group="Historical Lines", tooltip="Shows Historical Midnight Vertical Lines")
ShowPrev = input.bool (false, title="Misc. Historical Price Lines", group="Historical Lines", tooltip="Makes Chart Cluttered, Use For Backtesting Only")
//----------------------------------------------
// Session Bool
ShowLondon = input.bool (false, "", inline="LONDON", group="Sessions", tooltip="01:00 to 05:00")
ShowNY = input.bool (false, "", inline="NY", group="Sessions", tooltip="07:00 to 10:00")
ShowLC = input.bool (false, "", inline="LC", group="Sessions", tooltip="10:00 to 12:00")
ShowPM = input.bool (false, "",inline="PM", group="Sessions", tooltip="13:00 to 16:00")
ShowAsian = input.bool (false, "",inline="ASIA2", group="Sessions", tooltip="20:00 to 00:00")
ShowFreeSesh = input.bool (false, "",inline="FREE", group="Sessions", tooltip="Custom Session")
// Session Strings
txt2 = input.string ("LONDON", title="", inline="LONDON", group="Sessions")
txt3 = input.string ("NEW YORK", title="", inline="NY", group="Sessions")
txt4 = input.string ("LDN CLOSE", title="", inline="LC", group="Sessions")
txt5 = input.string ("AFTERNOON", title="", inline="PM", group="Sessions")
txt6 = input.string ("ASIA", title="", inline="ASIA2", group="Sessions")
txt9 = input.string ("FREE SESH", title="", inline="FREE", group="Sessions")
// CBDR = input.session ('1400-2000:1234567', "", inline="CBDR", group="Sessions")
// ASIA = input.session ('2000-0000:1234567', "", inline="ASIA", group="Sessions")
// Session Times
LDNsesh = input.session ('0200-0500:1234567', "", inline="LONDON", group="Sessions")
NYsesh = input.session ('0700-1000:1234567', "", inline="NY", group="Sessions")
LCsesh = input.session ('1000-1200:1234567', "", inline="LC", group="Sessions")
PMsesh = input.session ('1300-1600:1234567', "", inline="PM", group="Sessions")
ASIA2sesh = input.session ('2000-2359:1234567', "", inline="ASIA2", group="Sessions")
FreeSesh = input.session ('0000-0000:1234567', "", inline="FREE", group="Sessions")
// Session Color
LSFC = input.color (color.new(#787b86, 90), "", inline="LONDON", group="Sessions")
NYSFC = input.color (color.new(#787b86, 90), "",inline="NY", group="Sessions")
LCSFC = input.color (color.new(#787b86, 90), "",inline="LC", group="Sessions")
PMSFC = input.color (color.new(#787b86, 90), "",inline="PM", group="Sessions")
ASFC = input.color (color.new(#787b86, 90), "",inline="ASIA2", group="Sessions")
FSFC = input.color (color.new(#787b86, 90), "",inline="FREE", group="Sessions")
//----------------------------------------------
// Vertical Line Bool
ShowMOP = input.bool (title="", defval=true, inline="MOP", group="Vertical Lines", tooltip="00:00 AM")
txt12 = input.string ("MIDNIGHT", title="", inline="MOP", group="Vertical Lines")
ShowLOP = input.bool (title="", defval=false, inline="LOP", group="Vertical Lines", tooltip="03:00 AM")
txt14 = input.string ("LONDON", title="", inline="LOP", group="Vertical Lines")
ShowNYOP = input.bool (title="", defval=true, inline="NYOP", group="Vertical Lines", tooltip="08:30 AM")
txt15 = input.string ("NEW YORK", title="", inline="NYOP", group="Vertical Lines")
ShowEOP = input.bool (title="", defval=false, inline="EOP", group="Vertical Lines", tooltip="09:30 AM")
txt16 = input.string ("EQUITIES", title="", inline="EOP", group="Vertical Lines")
// Vertical Line Color
MOPColor = input.color (color.new(#787b86, 0), "", inline="MOP", group="Vertical Lines")
LOPColor = input.color (color.rgb(0,128,128,60), "", inline="LOP", group="Vertical Lines")
NYOPColor = input.color (color.rgb(0,128,128,60), "", inline="NYOP", group="Vertical Lines")
EOPColor = input.color (color.rgb(0,128,128,60), "", inline="EOP", group="Vertical Lines")
// Vertical LineStyle
Midnight_Open_LS = input.string ("Dotted", "", options= , inline="MOP", group="Vertical Lines")
london_Open_LS = input.string ("Solid", "", options= , inline="LOP", group="Vertical Lines")
NY_Open_LS = input.string ("Solid", "", options= , inline="NYOP", group="Vertical Lines")
Equities_Open_LS = input.string ("Solid", "", options= , inline="EOP", group="Vertical Lines")
// Vertical LineWidth
Midnight_Open_LW = input.string ("1px", "", options= , inline="MOP", group="Vertical Lines")
London_Open_LW = input.string ("1px", "", options= , inline="LOP", group="Vertical Lines")
NY_Open_LW = input.string ("1px", "", options= , inline="NYOP", group="Vertical Lines")
Equities_Open_LW = input.string ("1px", "", options= , inline="EOP", group="Vertical Lines")
//----------------------------------------------
// Opening Price Bool
ShowMOPP = input.bool (title="", defval=true, inline="MOPP", group="Opening Price Lines", tooltip="00:00 AM")
txt13 = input.string ("MIDNIGHT", title="", inline="MOPP", group="Opening Price Lines")
ShowNYOPP = input.bool (title="", defval=false, inline="NYOPP", group="Opening Price Lines", tooltip="08:30 AM")
txt17 = input.string ("NEW YORK", title="", inline="NYOPP", group="Opening Price Lines")
ShowEOPP = input.bool (title="", defval=false, inline="EOPP", group="Opening Price Lines", tooltip="09:30 AM")
txt18 = input.string ("EQUITIES", title="", inline="EOPP", group="Opening Price Lines")
ShowAFTPP = input.bool (title="", defval=false, inline="AFTOPP", group="Opening Price Lines", tooltip="01:30 PM")
txt1330 = input.string ("AFTERNOON", title="", inline="AFTOPP", group="Opening Price Lines")
// Opening Price Color
MOPColP = input.color (color.new(#787b86, 0), "", inline="MOPP", group="Opening Price Lines")
NYOPColP = input.color (color.new(#787b86, 0), "", inline="NYOPP", group="Opening Price Lines")
EOPColP = input.color (color.new(#787b86, 0), "", inline="EOPP", group="Opening Price Lines")
AFTOPColP = input.color (color.new(#787b86, 0), "", inline="AFTOPP", group="Opening Price Lines")
// Opening Price LineStyle
MOPLS = input.string ("Dotted", "", options= , inline="MOPP", group="Opening Price Lines")
NYOPLS = input.string ("Dotted", "", options= , inline="NYOPP", group="Opening Price Lines")
EOPLS = input.string ("Dotted", "", options= , inline="EOPP", group="Opening Price Lines")
AFTOPLS = input.string ("Dotted", "", options= , inline="AFTOPP", group="Opening Price Lines")
// Opening Price LineWidth
i_MOPLW = input.string ("1px", "", options= , inline="MOPP", group="Opening Price Lines")
i_NYOPLW = input.string ("1px", "", options= , inline="NYOPP", group="Opening Price Lines")
i_EOPLW = input.string ("1px", "", options= , inline="EOPP", group="Opening Price Lines")
i_AFTOPLW = input.string ("1px", "", options= , inline="AFTOPP", group="Opening Price Lines")
//----------------------------------------------
// W&M Bool
ShowWeekOpen = input.bool (defval=false, title="", tooltip="Draw Weekly Open Price Line", group="HTF Opening Price Lines", inline="WO")
showMonthOpen = input.bool (defval=false, title="", tooltip="Draw Monthly Open Price Line", group="HTF Opening Price Lines", inline="MO")
// W&M String
txt19 = input.string ("WEEKLY", title="", inline="WO", group="HTF Opening Price Lines")
txt20 = input.string ("MONTHLY", title="", inline="MO", group="HTF Opening Price Lines")
// W&M Color
i_WeekOpenCol = input.color (title="", defval=color.new(#787b86, 0), group="HTF Opening Price Lines", inline="WO")
i_MonthOpenCol = input.color (title="", tooltip="", defval=color.new(#787b86, 0), group="HTF Opening Price Lines", inline="MO")
// W&M LineStyle
WOLS = input.string ("Dotted", "", options= , inline="WO", group="HTF Opening Price Lines")
MOLS = input.string ("Dotted", "", options= , inline="MO", group="HTF Opening Price Lines")
// W&M LineWidth
i_WOPLW = input.string ("1px", "", options= , inline="WO", group="HTF Opening Price Lines")
i_MONPLW = input.string ("1px", "", options= , inline="MO", group="HTF Opening Price Lines")
//----------------------------------------------
// CBDR, ASIA & FLOUT
ShowCBDR = input.bool (true, "", inline='CBDR', group="CBDR, ASIA & FLOUT")
ShowASIA = input.bool (true, "", inline='ASIA', group="CBDR, ASIA & FLOUT")
ShowFLOUT = input.bool (false, "", inline='FLOUT', group="CBDR, ASIA & FLOUT")
// Strings
txt0 = input.string ("CBDR", title="", inline="CBDR", group="CBDR, ASIA & FLOUT", tooltip="16:00 to 20:00 \nSD Increments of 1")
txt1 = input.string ("ASIA", title="", inline="ASIA", group="CBDR, ASIA & FLOUT", tooltip="20:00 to 00:00 \nSD Increments of 1")
txt7 = input.string ("FLOUT", title="", inline="FLOUT", group="CBDR, ASIA & FLOUT", tooltip="16:00 to 00:00 \nSD Increments of 0.5")
// Color
CBDRBoxCol = input.color (color.new(#787b86, 0),"", inline='CBDR', group="CBDR, ASIA & FLOUT")
ASIABoxCol = input.color (color.new(#787b86, 0), "", inline='ASIA', group="CBDR, ASIA & FLOUT")
FLOUTBoxCol = input.color (color.new(#787b86, 0),"", inline='FLOUT', group="CBDR, ASIA & FLOUT")
// Extras
box_text_cbdr = input.bool (true, "Show Text", inline="CBDR", group="CBDR, ASIA & FLOUT")
box_text_cbdr_col = input.color (color.new(color.gray, 80), "", inline="CBDR", group="CBDR, ASIA & FLOUT")
bool_cbdr_dev = input.bool (true, "SD", inline="CBDR", group="CBDR, ASIA & FLOUT")
box_text_asia = input.bool (true, "Show Text", inline="ASIA", group="CBDR, ASIA & FLOUT")
box_text_asia_col = input.color (color.new(color.gray, 80), "", inline="ASIA", group="CBDR, ASIA & FLOUT")
bool_asia_dev = input.bool (true, "SD", inline="ASIA", group="CBDR, ASIA & FLOUT")
box_text_flout = input.bool (true, "Show Text", inline="FLOUT", group="CBDR, ASIA & FLOUT")
box_text_flout_col = input.color (color.new(color.gray, 80), "", inline="FLOUT", group="CBDR, ASIA & FLOUT")
bool_flout_dev = input.bool (true, "SD", inline="FLOUT", group="CBDR, ASIA & FLOUT")
// Table
// SD Lines
ShowDevLN = input.bool (title="", defval=true, inline="DEVLN", group="Standard Deviation", tooltip="Deviation Lines")
DEVLNTXT = input.string ("SD LINES", title="", inline="DEVLN", group="Standard Deviation")
DevLNCol = input.color (color.new(#787b86, 0), "", inline="DEVLN", group="Standard Deviation")
DEVLS = input.string ("Solid", "", options= , inline="DEVLN", group="Standard Deviation")
i_DEVLW = input.string ("1px", "", options= , inline="DEVLN", group="Standard Deviation")
DEVLSS = DEVLS=="Solid" ? line.style_solid : DEVLS == "Dotted" ? line.style_dotted : line.style_dashed
DEVLW = i_DEVLW=="1px" ? 1 : i_DEVLW == "2px" ? 2 : i_DEVLW == "3px" ? 3 : i_DEVLW == "4px" ? 4 : 5
ShowDev = input.bool (false, '', inline="DEV", group="Standard Deviation")
txt8 = input.string ("SD COUNT", title="", inline="DEV", group="Standard Deviation")
SDCountCol = input.color (color.new(#787b86, 0), "", inline="DEV", group="Standard Deviation")
DevInput = input.string ("2 SD", "", options= , inline="DEV", group="Standard Deviation")
DevDirection = input.string ("Both", "", options= , inline="DEV", group="Standard Deviation", tooltip="SD Count, NULL, SD Count, SD Direction")
DevCount = DevInput == "1 SD" ? 1 : DevInput == "2 SD" ? 2 : DevInput == "3 SD" ? 3 : 4
Auto_Select = input.bool (false, "", group="Standard Deviation", inline="AUTOSD", tooltip="Auto SD Selection | Charter Content, Range Table \nMight Bug Out On Mondays" )
txtSD = input.string ("AUTO SD", "", group="Standard Deviation", inline="AUTOSD")
Tab1txtCol = input.color (color.new(#808080, 0), "", inline='AUTOSD', group="Standard Deviation")
TabOptionShow = input.string ("Show Table", "", options= , inline="AUTOSD", group="Standard Deviation")
Stats = TabOptionShow == "Show Table" ? true : false
TabOption1 = input.string ("Top Right", "", options= , inline="AUTOSD", group="Standard Deviation")
tabinp1 = TabOption1 == "Top Left" ? position.top_left : TabOption1 == "Top Center" ? position.top_center : TabOption1 == "Top Right" ? position.top_right : TabOption1 == "Middle Left" ? position.middle_left : TabOption1 == "Middle Right" ? position.middle_right : TabOption1 == "Bottom Left" ? position.bottom_left : TabOption1 == "Bottom Center" ? position.bottom_center : position.bottom_right
L_Prof = true
CellBG = color.new(#131722, 100)
//----------------------------------------------
// Day Of Week & Labels
// Label Settings Inputs
ShowLabel = input.bool (true, title="", inline="Glabel", group="Day Of Week & Labels")
txt21 = input.string ("LABEL", title="", inline="Glabel", group="Day Of Week & Labels")
LabelColor = input.color (color.rgb(0,0,0,100), "", inline="Glabel", group="Day Of Week & Labels")
LabelSizeInput = input.string ("Normal", "", options= , inline="Glabel", group="Day Of Week & Labels")
Terminusinp = input.string ("Terminus @ Current Time +1hr", "", options = , inline="Glabel", group="Day Of Week & Labels", tooltip="Select Label Size & Color & Terminus \nHistorical Price Lines needs to be toggled off for using Terminus")
ShowLabelText = input.bool (true, title="", inline="label", group="Day Of Week & Labels")
txt22 = input.string ("LABEL TEXT", title="", inline="label", group="Day Of Week & Labels")
LabelTextColor = input.color (color.new(#787b86, 0), title="", inline="label", group="Day Of Week & Labels")
LabelTextOptioninput = input.string ("Time", "", options= , inline="label", group="Day Of Week & Labels", tooltip="Choose Between Descriptive Text as Label or Time \nShow/Hide Prices on Labels")
ShowPricesBool = input.string ("Hide Prices", title="", options= , group="Day Of Week & Labels", inline="label")
ShowPrices = ShowPricesBool == "Show Prices" ? true : false
showDOW = input.bool (true, title="", inline="DOW", group="Day Of Week & Labels")
txt24 = input.string ("DAY OF WEEK", title="", inline="DOW", group="Day Of Week & Labels")
i_DOWCol = input.color (color.new(#787b86, 0), title="", inline="DOW", group="Day Of Week & Labels")
DOWTime = input.int (defval = 12, title="", inline="DOW", group="Day Of Week & Labels")
DOWLoc_inpt = input.string ("Bottom", "", options = , inline="DOW", group="Day Of Week & Labels", tooltip="DOW Color, Time Alignment, Vertical Location")
DOWLoc = DOWLoc_inpt == "Bottom" ? location.bottom : location.top
//----------------------------------------------
BIAS_M_Bool = input.bool (false, "", group="BIAS & NOTES PRECONFIG", inline="stats")
txt100 = input.string ("BIAS", title="", inline="stats", group="BIAS & NOTES PRECONFIG")
TableBG2 = color.new(#131722, 100)
Tab2txtCol = input.color (color.new(#787b86, 0), "", inline='stats', group="BIAS & NOTES PRECONFIG")
TabOption2 = input.string ("Bottom Right", "", options= , inline="stats", group="BIAS & NOTES PRECONFIG")
tabinp2 = TabOption2 == "Top Left" ? position.top_left : TabOption2 == "Top Center" ? position.top_center : TabOption2 == "Top Right" ? position.top_right : TabOption2 == "Middle Left" ? position.middle_left : TabOption2 == "Middle Right" ? position.middle_right : TabOption2 == "Bottom Left" ? position.bottom_left : TabOption2 == "Bottom Center" ? position.bottom_center : position.bottom_right
notesbool = false
NOTES_M_Bool = input.bool (true, "", group="BIAS & NOTES PRECONFIG", inline="stats2")
txt101 = input.string ("NOTES", title="", inline="stats2", group="BIAS & NOTES PRECONFIG")
Tab3txtCol = input.color (color.new(#787b86, 0), "", inline='stats2', group="BIAS & NOTES PRECONFIG")
TabOption3 = input.string ("Top Center", "", options= , inline="stats2", group="BIAS & NOTES PRECONFIG")
tabinp3 = TabOption3 == "Top Left" ? position.top_left : TabOption3 == "Top Center" ? position.top_center : TabOption3 == "Top Right" ? position.top_right : TabOption3 == "Middle Left" ? position.middle_left : TabOption3 == "Middle Right" ? position.middle_right : TabOption3 == "Bottom Left" ? position.bottom_left : TabOption3 == "Bottom Center" ? position.bottom_center : position.bottom_right
BIASbool1 = input.bool (true, '', inline="BIAS1", group="BIAS & NOTES")
txt52 = input.string ("DXY ", title="", inline="BIAS1", group="BIAS & NOTES")
BIASOption1 = input.string ("Unclear", options= , title="", inline="BIAS1", group="BIAS & NOTES")
BIASbool2 = input.bool (true, '', inline="BIAS2", group="BIAS & NOTES")
txt53 = input.string ("SPX ", title="", inline="BIAS2", group="BIAS & NOTES")
BIASOption2 = input.string ("Unclear", options= , title="", inline="BIAS2", group="BIAS & NOTES")
BIASbool3 = input.bool (true, '', inline="BIAS3", group="BIAS & NOTES")
txt54 = input.string ("DOW ", title="", inline="BIAS3", group="BIAS & NOTES")
BIASOption3 = input.string ("Unclear", options= , title="", inline="BIAS3", group="BIAS & NOTES")
BIASbool4 = input.bool (true, '', inline="BIAS4", group="BIAS & NOTES")
txt55 = input.string ("NAS ", title="", inline="BIAS4", group="BIAS & NOTES")
BIASOption4 = input.string ("Unclear", options= , title="", inline="BIAS4", group="BIAS & NOTES")
notes = input.text_area ("@hiran.invest", "Notes", group = "BIAS & NOTES")
//--------------------END OF INPUTS--------------------//
// Pre-Def
DOM = (timeframe.multiplier <= inputMaxInterval) and (timeframe.isintraday)
newDay = ta.change(dayofweek)
newWeek = ta.change(weekofyear)
newMonth = ta.change(time("M"))
transparentcol = color.rgb(255,255,255,100)
LSVLC = color.rgb(255,255,255,100)
NYSVLC = color.rgb(255,255,255,100)
PMSVLC = color.rgb(255,255,255,100)
ASVLC = color.rgb(255,255,255,100)
LSVLS = "dotted"
NYSVLS = "dotted"
PMSVLS = "dotted"
ASVLS = "dotted"
// Functions
isToday = false
if year(timenow) == year(time) and month(timenow) == month(time) and dayofmonth(timenow) == dayofmonth(time)
isToday := true
// Current Week
thisweek = year(timenow) == year(time) and weekofyear(timenow) == weekofyear(time)
LastOneWeek = year(timenow) == year(time) and weekofyear(timenow-604800000) == weekofyear(time)
LastTwoWeek = year(timenow) == year(time) and weekofyear(timenow-1209600000) == weekofyear(time)
LastThreeWeek = year(timenow) == year(time) and weekofyear(timenow-1814400000) == weekofyear(time)
LastFourWeek = year(timenow) == year(time) and weekofyear(timenow-2419200000) == weekofyear(time)
Last4Weeks = false
if thisweek == true or LastOneWeek == true or LastTwoWeek == true or LastThreeWeek == true or LastFourWeek == true
Last4Weeks := true
// Function to draw Vertical Lines
vline(Start, Color, linestyle, LineWidth) =>
line.new(x1=Start, y1=low - ta.tr, x2=Start, y2=high + ta.tr, xloc=xloc.bar_time, extend=extend.both, color=Color, style=linestyle, width=LineWidth)
// Function to convert forex pips into whole numbers
atr = ta.atr(14)
toWhole(number) =>
if syminfo.type == "forex" // This method only works on forex pairs
_return = atr < 1.0 ? (number / syminfo.mintick) / 10 : number
_return := atr >= 1.0 and atr < 100.0 and syminfo.currency == "JPY" ? _return * 100 : _return
else
number
// Function for determining the Start of a Session (taken from the Pinescript manual: www.tradingview.com )
SessionBegins(sess) =>
t = time("", sess , Timezone)
DOM and (not barstate.isfirst) and na(t ) and not na(t)
// BarIn Session
BarInSession(sess) =>
time(timeframe.period, sess, Timezone) != 0
// Label Type Logic
var SFistrue = true
if LabelTextOptioninput == "Time"
SFistrue := true
else
SFistrue := false
// Session String to int
SeshStartHour(Session) =>
math.round(str.tonumber(str.substring(Session,0,2)))
SeshStartMins(Session) =>
math.round(str.tonumber(str.substring(Session,2,4)))
SeshEndHour(Session) =>
math.round(str.tonumber(str.substring(Session,5,7)))
SeshEndMins(Session) =>
math.round(str.tonumber(str.substring(Session,7,9)))
// Time periods
CBDR = "1600-2000:1234567"
ASIA = "2000-0000:1234567"
FLOUT = "1600-0000:1234567"
midsesh = "0000-1600:1234567"
cbdrOpenTime = timestamp (Timezone, year, month, dayofmonth, SeshStartHour(CBDR), SeshStartMins(CBDR), 00)
cbdrEndTime = timestamp (Timezone, year, month, dayofmonth, SeshEndHour(CBDR), SeshEndMins(CBDR), 00)
asiaOpenTime = timestamp (Timezone, year, month, dayofmonth, SeshStartHour(ASIA), SeshStartMins(ASIA), 00)
asiaEndTime = timestamp (Timezone, year, month, dayofmonth, SeshEndHour(ASIA), SeshEndMins(ASIA), 00)+86400000
floutOpenTime = timestamp (Timezone, year, month, dayofmonth, SeshStartHour(FLOUT), SeshStartMins(FLOUT), 00)
floutEndTime = timestamp (Timezone, year, month, dayofmonth, SeshEndHour(FLOUT), SeshEndMins(FLOUT), 00)+86400000
CBDRTime = time (timeframe.period, CBDR, Timezone)
ASIATime = time (timeframe.period, ASIA, Timezone)
FLOUTTime = time (timeframe.period, FLOUT, Timezone)
LabelOnlyToday = true
// Time Periods
LondonStartTime = timestamp(Timezone, year, month, dayofmonth, SeshStartHour(LDNsesh), SeshStartMins(LDNsesh), 00)
LondonEndTime = timestamp(Timezone, year, month, dayofmonth, SeshEndHour(LDNsesh), SeshEndMins(LDNsesh), 00)
NYStartTime = timestamp(Timezone, year, month, dayofmonth, SeshStartHour(NYsesh), SeshStartMins(NYsesh), 00)
NYEndTime = timestamp(Timezone, year, month, dayofmonth, SeshEndHour(NYsesh), SeshEndMins(NYsesh), 00)
LCStartTime = timestamp(Timezone, year, month, dayofmonth, SeshStartHour(LCsesh), SeshStartMins(LCsesh), 00)
LCEndTime = timestamp(Timezone, year, month, dayofmonth, SeshEndHour(LCsesh), SeshEndMins(LCsesh), 00)
PMStartTime = timestamp(Timezone, year, month, dayofmonth, SeshStartHour(PMsesh), SeshStartMins(PMsesh), 00)
PMEndTime = timestamp(Timezone, year, month, dayofmonth, SeshEndHour(PMsesh), SeshEndMins(PMsesh), 00)
AsianStartTime = timestamp(Timezone, year, month, dayofmonth, SeshStartHour(ASIA2sesh), SeshStartMins(ASIA2sesh), 00)
AsianEndTime = timestamp(Timezone, year, month, dayofmonth, SeshEndHour(ASIA2sesh), SeshEndMins(ASIA2sesh), 00)
FreeStartTime = timestamp(Timezone, year, month, dayofmonth, SeshStartHour(FreeSesh), SeshStartMins(FreeSesh), 00)
FreeEndTime = timestamp(Timezone, year, month, dayofmonth, SeshEndHour(FreeSesh), SeshEndMins(FreeSesh), 00)
MidnightOpenTime = timestamp(Timezone, year, month, dayofmonth, 0, 0, 00)
CLEANUPTIME = timestamp(Timezone, year, month, dayofmonth, 0, 0, 00) - 16200000
LondonOpenTime = timestamp(Timezone, year, month, dayofmonth, 3, 0, 00)
NYOpenTime = timestamp(Timezone, year, month, dayofmonth, 8, 30, 00)
EquitiesOpenTime = timestamp(Timezone, year, month, dayofmonth, 9, 30, 00)
AfternoonOpenTime = timestamp(Timezone, year, month, dayofmonth, 13, 30, 00)
tMidnight = time("1", "0000-0001:1234567", Timezone)
// Cleanup - Remove old drawing objects
Cleanup(days) =>
// Delete old drawing objects
// One day is 86400000 milliseconds
removal_timestamp = (CLEANUPTIME) - (days * 86400000) // Remove every drawing object older than the start of the Today's Midnight
a_allLines = line.all
a_allLabels = label.all
a_allboxes = box.all
// Remove old lines
if array.size(a_allLines) > 0
for i = 0 to array.size(a_allLines) - 1
line_x2 = line.get_x2(array.get(a_allLines, i))
if line_x2 < (removal_timestamp)
line.delete(array.get(a_allLines, i))
// Remove old labels
if array.size(a_allLabels) > 0
for i = 0 to array.size(a_allLabels) - 1
label_x = label.get_x(array.get(a_allLabels, i))
if label_x < removal_timestamp
label.delete(array.get(a_allLabels, i))
// Remove old boxes
if array.size(a_allboxes) > 0
for i = 0 to array.size(a_allboxes) - 1
box_x = box.get_right(array.get(a_allboxes, i))
if box_x < (removal_timestamp - 86400000)
box.delete(array.get(a_allboxes, i))
// End of Cleanup function
// Terminus Function
Terminus(Terminus_Inp)=>
if Terminus_Inp == "Terminus @ Current Time"
_return = timenow
else if Terminus_Inp == "Terminus @ Current Time +15min"
_return = timenow + 900000
else if Terminus_Inp == "Terminus @ Current Time +30min"
_return = timenow + 1800000
else if Terminus_Inp == "Terminus @ Current Time +45min"
_return = timenow + 2700000
else if Terminus_Inp == "Terminus @ Current Time +1hr"
_return = timenow + 3600000
else if Terminus_Inp == "Terminus @ Current Time +2hr"
_return = timenow + 7200000
else
_return = timenow + 10800000
// Linestyle Function
MNOPLS = Midnight_Open_LS=="Solid" ? line.style_solid : Midnight_Open_LS == "Dotted" ? line.style_dotted : line.style_dashed
LNOPLS = london_Open_LS=="Solid" ? line.style_solid : london_Open_LS == "Dotted" ? line.style_dotted : line.style_dashed
NWYOPLS = NY_Open_LS=="Solid" ? line.style_solid : NY_Open_LS == "Dotted" ? line.style_dotted : line.style_dashed
EQOPLS = Equities_Open_LS=="Solid" ? line.style_solid : Equities_Open_LS == "Dotted" ? line.style_dotted : line.style_dashed
MOPLSS = MOPLS=="Solid" ? line.style_solid : MOPLS == "Dotted" ? line.style_dotted : line.style_dashed
NYOPLSS = NYOPLS=="Solid" ? line.style_solid : NYOPLS == "Dotted" ? line.style_dotted : line.style_dashed
EOPLSS = EOPLS=="Solid" ? line.style_solid : EOPLS == "Dotted" ? line.style_dotted : line.style_dashed
AFTOPLSS = AFTOPLS=="Solid" ? line.style_solid : AFTOPLS == "Dotted" ? line.style_dotted : line.style_dashed
WeekOpenLS = WOLS=="Solid" ? line.style_solid : WOLS == "Dotted" ? line.style_dotted : line.style_dashed
MonthOpenLS = MOLS=="Solid" ? line.style_solid : MOLS == "Dotted" ? line.style_dotted : line.style_dashed
// Linewidth Function
MOPLW = Midnight_Open_LW=="1px" ? 1 : Midnight_Open_LW == "2px" ? 2 : Midnight_Open_LW == "3px" ? 3 : Midnight_Open_LW == "4px" ? 4 : 5
LOPLW = London_Open_LW=="1px" ? 1 : London_Open_LW == "2px" ? 2 : London_Open_LW == "3px" ? 3 : London_Open_LW == "4px" ? 4 : 5
NYOPLW = NY_Open_LW=="1px" ? 1 : NY_Open_LW == "2px" ? 2 : NY_Open_LW == "3px" ? 3 : NY_Open_LW == "4px" ? 4 : 5
EOPLW = Equities_Open_LW=="1px" ? 1 : Equities_Open_LW == "2px" ? 2 : Equities_Open_LW == "3px" ? 3 : Equities_Open_LW == "4px" ? 4 : 5
MOPPLW = i_MOPLW=="1px" ? 1 : i_MOPLW == "2px" ? 2 : i_MOPLW == "3px" ? 3 : i_MOPLW == "4px" ? 4 : 5
NYOPPLW = i_NYOPLW=="1px" ? 1 : i_NYOPLW == "2px" ? 2 : i_NYOPLW == "3px" ? 3 : i_NYOPLW == "4px" ? 4 : 5
EOPPLW = i_EOPLW=="1px" ? 1 : i_EOPLW == "2px" ? 2 : i_EOPLW == "3px" ? 3 : i_EOPLW == "4px" ? 4 : 5
AFTOPLW = i_AFTOPLW=="1px" ? 1 : i_AFTOPLW == "2px" ? 2 : i_AFTOPLW == "3px" ? 3 : i_AFTOPLW == "4px" ? 4 : 5
WEEKOPPLW = i_WOPLW=="1px" ? 1 : i_WOPLW == "2px" ? 2 : i_WOPLW == "3px" ? 3 : i_WOPLW == "4px" ? 4 : 5
MONTHOPPLW = i_MONPLW=="1px" ? 1 : i_MONPLW == "2px" ? 2 : i_MONPLW == "3px" ? 3 : i_MONPLW == "4px" ? 4 : 5
// Label Size Function
LabelSize =LabelSizeInput=="Auto" ? size.auto : LabelSizeInput=="Tiny" ? size.tiny : LabelSizeInput=="Small" ? size.small : LabelSizeInput=="Normal" ? size.normal : LabelSizeInput=="Large" ? size.large : size.huge
// Creating Variables
var London_Start_Vline = line.new(x1=na, y1=na, x2=na, xloc=xloc.bar_time, y2=close, color=LSVLC, width=1)
var London_End_Vline = line.new(x1=na, y1=na, x2=na, xloc=xloc.bar_time, y2=close, color=LSVLC, width=1)
var LondonFill = linefill.new(London_Start_Vline, London_End_Vline, LSFC)
var NY_Start_Vline = line.new(x1=na, y1=na, x2=na, xloc=xloc.bar_time, y2=close, color=NYSVLC, width=1)
var NY_End_Vline = line.new(x1=na, y1=na, x2=na, xloc=xloc.bar_time, y2=close, color=NYSVLC, width=1)
var NYFill = linefill.new(NY_Start_Vline, NY_End_Vline, NYSFC)
var LC_Start_Vline = line.new(x1=na, y1=na, x2=na, xloc=xloc.bar_time, y2=close, color=NYSVLC, width=1)
var LC_End_Vline = line.new(x1=na, y1=na, x2=na, xloc=xloc.bar_time, y2=close, color=NYSVLC, width=1)
var LCFill = linefill.new(LC_Start_Vline, LC_End_Vline, LCSFC)
var PM_Start_Vline = line.new(x1=na, y1=na, x2=na, xloc=xloc.bar_time, y2=close, color=PMSVLC, width=1)
var PM_End_Vline = line.new(x1=na, y1=na, x2=na, xloc=xloc.bar_time, y2=close, color=PMSVLC, width=1)
var PMFill = linefill.new(PM_Start_Vline, PM_End_Vline, PMSFC)
var Asian_Start_Vline = line.new(x1=na, y1=na, x2=na, xloc=xloc.bar_time, y2=close, color=ASVLC, width=1)
var Asian_End_Vline = line.new(x1=na, y1=na, x2=na, xloc=xloc.bar_time, y2=close, color=ASVLC, width=1)
var AsianFill = linefill.new(Asian_Start_Vline, Asian_End_Vline, ASFC)
var Free_Start_Vline = line.new(x1=na, y1=na, x2=na, xloc=xloc.bar_time, y2=close, color=ASVLC, width=1)
var Free_End_Vline = line.new(x1=na, y1=na, x2=na, xloc=xloc.bar_time, y2=close, color=ASVLC, width=1)
var FreeFill = linefill.new(Free_Start_Vline, Free_End_Vline, FSFC)
var Midnight_Open = line.new(x1=na, y1=na, x2=na, xloc=xloc.bar_time, y2=close, color=MOPColor, width=1)
var London_Open = line.new(x1=na, y1=na, x2=na, xloc=xloc.bar_time, y2=close, color=LOPColor, width=1)
var NY_Open = line.new(x1=na, y1=na, x2=na, xloc=xloc.bar_time, y2=close, color=NYOPColor, width=1)
var Equities_Open = line.new(x1=na, y1=na, x2=na, xloc=xloc.bar_time, y2=close, color=EOPColor, width=1)
// When a New Day Starts, Start Drawing all lines
if newDay and dayofweek != dayofweek.sunday
// London Session
if (ShowLondon and DOM)
if ShowTSO
line.delete(London_Start_Vline )
line.delete(London_End_Vline )
linefill.delete(LondonFill )
London_Start_Vline := vline(LondonStartTime,transparentcol, line.style_solid, 1)
London_End_Vline := vline(LondonEndTime, transparentcol, line.style_solid, 1)
if ShowSFill
LondonFill := linefill.new(London_Start_Vline, London_End_Vline, LSFC)
// New York Session
if (ShowNY and DOM)
if ShowTSO
line.delete(NY_Start_Vline )
line.delete(NY_End_Vline )
linefill.delete(NYFill )
NY_Start_Vline := vline(NYStartTime, transparentcol, line.style_solid, 1)
NY_End_Vline := vline(NYEndTime, transparentcol, line.style_solid, 1)
if ShowSFill
NYFill := linefill.new(NY_Start_Vline, NY_End_Vline, NYSFC)
// London Close
if (ShowLC and DOM)
if ShowTSO
line.delete(LC_End_Vline )
linefill.delete(LCFill )
LC_Start_Vline := vline(LCStartTime, transparentcol, line.style_solid, 1)
LC_End_Vline := vline(LCEndTime, transparentcol, line.style_solid, 1)
if ShowSFill
LCFill := linefill.new(LC_Start_Vline, LC_End_Vline, LCSFC)
// PM Session
if (ShowPM and DOM)
if ShowTSO
line.delete(PM_Start_Vline )
line.delete(PM_End_Vline )
linefill.delete(PMFill )
PM_Start_Vline := vline(PMStartTime, transparentcol, line.style_solid, 1)
PM_End_Vline := vline(PMEndTime, transparentcol, line.style_solid, 1)
if ShowSFill
PMFill := linefill.new(PM_Start_Vline, PM_End_Vline, PMSFC)
// Asian Session
if (ShowAsian and DOM)
if ShowTSO
line.delete(Asian_Start_Vline )
line.delete(Asian_End_Vline )
linefill.delete(AsianFill )
Asian_Start_Vline := vline(AsianStartTime, transparentcol, line.style_solid, 1)
Asian_End_Vline := vline(AsianEndTime, transparentcol, line.style_solid, 1)
// if dayofweek == dayofweek.friday
// // line.delete(Asian_Start_Vline)
// // line.delete(Asian_End_Vline)
// Asian_Start_Vline := vline(MidnightOpenTime+244800000, transparentcol, line.style_solid, 1)
// Asian_End_Vline := vline(MidnightOpenTime+259200000, transparentcol, line.style_solid, 1)
if ShowSFill
AsianFill := linefill.new(Asian_Start_Vline, Asian_End_Vline, ASFC)
// Free Session
if (ShowFreeSesh and DOM)
if ShowTSO
line.delete(Free_Start_Vline )
line.delete(Free_End_Vline )
linefill.delete(FreeFill )
Free_Start_Vline := vline(FreeStartTime, transparentcol, line.style_solid, 1)
Free_End_Vline := vline(FreeEndTime, transparentcol, line.style_solid, 1)
if ShowSFill
FreeFill := linefill.new(Free_Start_Vline, Free_End_Vline, FSFC)
// Midnight Opening Price
if (ShowMOP and DOM)
if MOLHist == false
line.delete(Midnight_Open )
Midnight_Open := vline(MidnightOpenTime, MOPColor, MNOPLS, MOPLW)
// London Opening Price
if (ShowLOP and DOM)
if ShowTSO
line.delete(London_Open )
London_Open := vline(LondonOpenTime, LOPColor, LNOPLS, LOPLW)
// New York Opening Price
if (ShowNYOP and DOM)
if ShowTSO
line.delete(NY_Open )
NY_Open := vline(NYOpenTime, NYOPColor, NWYOPLS, NYOPLW)
// Equities Opening Price
if (ShowEOP and DOM)
if ShowTSO
line.delete(Equities_Open )
Equities_Open := vline(EquitiesOpenTime, EOPColor, EQOPLS, EOPLW)
// Variables
var label MOPLB = na
var line MOPLN = na
var label NYOPLB = na
var line NYOPLN = na
var label EOPLB = na
var line EOPLN = na
var line AFTLN = na
var label AFTLB = na
// New York Midnight Open Price line
var openMidnight = 0.0
if tMidnight
if not tMidnight
openMidnight := open
else
openMidnight := math.max(open, openMidnight)
if (ShowMOPP and (openMidnight != openMidnight ) and DOM and barstate.isconfirmed)
label.delete(MOPLB )
if ShowMOPL == false
line.delete(MOPLN )
MOPLN := line.new(x1=tMidnight, y1=openMidnight, x2=tMidnight+86400000, xloc=xloc.bar_time, y2=openMidnight, color=MOPColP, style=MOPLSS, width=MOPPLW)
if dayofweek == dayofweek.friday and syminfo.type != "crypto"
line.set_x2(MOPLN, tMidnight+259200000)
if ShowLabel
MOPLB := label.new(x=tMidnight+86400000, y=openMidnight, xloc=xloc.bar_time, color=LabelColor, textcolor=MOPColP, style=label.style_label_left, size=LabelSize, tooltip="Midnight Opening Price")
if dayofweek == dayofweek.friday and syminfo.type != "crypto"
label.set_x(MOPLB, tMidnight+259200000)
if ShowLabelText
if SFistrue
if ShowPrices == true
label.set_text(MOPLB, " 00:00 | " + str.tostring(open))
else
label.set_text(MOPLB, " 00:00 ")
label.set_tooltip(MOPLB, "Midnight Opening Price")
else
if ShowPrices == true
label.set_text(MOPLB, " Midnight Opening Price | " + str.tostring(open))
else
label.set_text(MOPLB, " Midnight Opening Price ")
label.set_tooltip(MOPLB, "")
label.set_textcolor(MOPLB, LabelTextColor)
label.set_size(MOPLB,LabelSize)
if time > PMEndTime and time < (MidnightOpenTime + 86400000)
line.delete(MOPLN )
if Terminusinp != "Terminus @ Next Midnight" and ShowMOPL == false
line.set_x2(MOPLN, Terminus(Terminusinp))
label.set_x(MOPLB, Terminus(Terminusinp))
// New York Opening Price Line
if (ShowNYOPP and (time == NYOpenTime) and DOM)
label.delete(NYOPLB )
if ShowPrev == false
line.delete(NYOPLN )
NYOPLN := line.new(x1=NYOpenTime, y1=open, x2=NYOpenTime+55800000, xloc=xloc.bar_time, y2=open, color=NYOPColP, style=NYOPLSS, width=NYOPPLW)
if dayofweek == dayofweek.friday and syminfo.type != "crypto"
line.set_x2(NYOPLN, NYOpenTime+228600000)
if ShowLabel
NYOPLB := label.new(x=NYOpenTime+55800000, y=open, xloc=xloc.bar_time, color=LabelColor, textcolor=NYOPColP, style=label.style_label_left, size=LabelSize, tooltip="New York Opening Price")
if dayofweek == dayofweek.friday and syminfo.type != "crypto"
label.set_x(NYOPLB, NYOpenTime+228600000)
if ShowLabelText
if SFistrue
if ShowPrices == true
label.set_text(NYOPLB, " 08:30 | " + str.tostring(open))
else
label.set_text(NYOPLB, " 08:30 ")
label.set_tooltip(NYOPLB, "New York Opening Price")
else
if ShowPrices == true
label.set_text(NYOPLB, " New York Opening Price | " + str.tostring(open))
else
label.set_text(NYOPLB, " New York Opening Price ")
label.set_tooltip(NYOPLB, "")
label.set_textcolor(NYOPLB, LabelTextColor)
label.set_size(NYOPLB,LabelSize)
if Terminusinp != "Terminus @ Next Midnight" and ShowPrev == false
line.set_x2(NYOPLN, Terminus(Terminusinp))
label.set_x(NYOPLB, Terminus(Terminusinp))
// Equities Opening Price Line
if (ShowEOPP and (time == EquitiesOpenTime) and DOM)
label.delete(EOPLB )
if ShowPrev == false
line.delete(EOPLN )
EOPLN := line.new(x1=EquitiesOpenTime, y1=open, x2=EquitiesOpenTime+52200000, xloc=xloc.bar_time, y2=open, color=EOPColP, style=EOPLSS, width=EOPPLW)
if dayofweek == dayofweek.friday and syminfo.type != "crypto"
line.set_x2(EOPLN, EquitiesOpenTime+225000000)
if ShowLabel
EOPLB := label.new(x=EquitiesOpenTime+52200000, y=open, xloc=xloc.bar_time, color=LabelColor, textcolor=EOPColP, style=label.style_label_left, size=LabelSize, tooltip="Equities Opening Price")
if dayofweek == dayofweek.friday and syminfo.type != "crypto"
label.set_x(EOPLB, EquitiesOpenTime+225000000)
if ShowLabelText
if SFistrue
if ShowPrices == true
label.set_text(EOPLB, " 09:30 | " + str.tostring(open))
else
label.set_text(EOPLB, " 09:30 ")
label.set_tooltip(EOPLB, "Equities Opening Price")
else
if ShowPrices == true
label.set_text(EOPLB, " Equities Opening Price | " + str.tostring(open))
else
label.set_text(EOPLB, " Equities Opening Price ")
label.set_tooltip(EOPLB, "")
label.set_textcolor(EOPLB, LabelTextColor)
label.set_size(EOPLB,LabelSize)
if Terminusinp != "Terminus @ Next Midnight" and ShowPrev == false
line.set_x2(EOPLN, Terminus(Terminusinp))
label.set_x(EOPLB, Terminus(Terminusinp))
// Afternoon Opening Price Line
if (ShowAFTPP and (time == AfternoonOpenTime) and DOM)
label.delete(AFTLB )
if ShowPrev == false
line.delete(AFTLN )
AFTLN := line.new(x1=AfternoonOpenTime, y1=open, x2=EquitiesOpenTime+52200000, xloc=xloc.bar_time, y2=open, color=AFTOPColP, style=AFTOPLSS, width=AFTOPLW)
if dayofweek == dayofweek.friday and syminfo.type != "crypto"
line.set_x2(AFTLN, EquitiesOpenTime+225000000)
if ShowLabel
AFTLB := label.new(x=EquitiesOpenTime+52200000, y=open, xloc=xloc.bar_time, color=LabelColor, textcolor=AFTOPColP, style=label.style_label_left, size=LabelSize, tooltip="Equities Opening Price")
if dayofweek == dayofweek.friday and syminfo.type != "crypto"
label.set_x(AFTLB, EquitiesOpenTime+225000000)
if ShowLabelText
if SFistrue
if ShowPrices == true
label.set_text(AFTLB, " 01:30 | " + str.tostring(open))
else
label.set_text(AFTLB, " 01:30 ")
label.set_tooltip(AFTLB, " Afternoon Opening Price")
else
if ShowPrices == true
label.set_text(AFTLB, " Afternoon Opening Price | " + str.tostring(open))
else
label.set_text(AFTLB, " Afternoon Opening Price ")
label.set_tooltip(AFTLB, "")
label.set_textcolor(AFTLB, LabelTextColor)
label.set_size(AFTLB,LabelSize)
if Terminusinp != "Terminus @ Next Midnight" and ShowPrev == false
line.set_x2(AFTLN, Terminus(Terminusinp))
label.set_x(AFTLB, Terminus(Terminusinp))
// HTF Variables
var Weekly_open = line.new(x1=na, y1=na, x2=na, xloc=xloc.bar_time, y2=close, color=i_WeekOpenCol, style=WeekOpenLS, width=1)
var Weekly_openlbl = label.new(x=na, y=na, xloc=xloc.bar_time, color=LabelColor, textcolor=LabelTextColor, style=label.style_label_left, size=LabelSize)
var WeeklyOpenTime = time
var Monthly_open = line.new(x1=na, y1=na, x2=na, xloc=xloc.bar_time, y2=close, color=i_MonthOpenCol, style=MonthOpenLS, width=1)
var Monthly_openlbl = label.new(x=na, y=na, xloc=xloc.bar_time, color=LabelColor, textcolor=LabelTextColor, style=label.style_label_left, size=LabelSize)
var MonthlyOpenTime = time
// Get HTF Price levels
WeeklyOpen = request.security(syminfo.tickerid, "W", open, lookahead = barmerge.lookahead_on)
MonthlyOpen = request.security(syminfo.tickerid, "M", open, lookahead = barmerge.lookahead_on)
// Weekly Open
if newWeek
WeeklyOpenTime := time
if ShowWeekOpen and newDay and Last4Weeks
label.delete(Weekly_openlbl )
line.delete(Weekly_open )
// if ShowPrev == false
// line.delete(Weekly_open )
Weekly_open:= line.new(x1=WeeklyOpenTime-25200000, y1=WeeklyOpen, x2=EquitiesOpenTime+52200000, xloc=xloc.bar_time, y2=WeeklyOpen, color=i_WeekOpenCol, style=WeekOpenLS, width=WEEKOPPLW)
if dayofweek == dayofweek.friday and syminfo.type != "crypto"
line.set_x2(Weekly_open, EquitiesOpenTime+225000000)
if ShowLabel
Weekly_openlbl := label.new(x=EquitiesOpenTime+52200000, y=WeeklyOpen, xloc=xloc.bar_time, color=LabelColor, textcolor=LabelTextColor, style=label.style_label_left, size=LabelSize, tooltip="Weekly Open: " + str.tostring(WeeklyOpen))
if dayofweek == dayofweek.friday and syminfo.type != "crypto"
label.set_x(Weekly_openlbl, EquitiesOpenTime+225000000)
if ShowLabelText
if SFistrue
if ShowPrices == true
label.set_text(Weekly_openlbl," W.O. | " + str.tostring(WeeklyOpen))
else
label.set_text(Weekly_openlbl," W.O. ")
label.set_tooltip(Weekly_openlbl, " Weekly Opening Price ")
else
if ShowPrices == true
label.set_text(Weekly_openlbl," Weekly Open | " + str.tostring(WeeklyOpen))
else
label.set_text(Weekly_openlbl," Weekly Open ")
label.set_tooltip(Weekly_openlbl, "")
label.set_textcolor(Weekly_openlbl, LabelTextColor)
label.set_size(Weekly_openlbl, LabelSize)
if timeframe.multiplier > 60
line.set_x2(Weekly_open, AsianEndTime + 232000000)
label.set_x(Weekly_openlbl, AsianEndTime + 232000000)
if timeframe.period == "D"
line.set_x2(Weekly_open, AsianEndTime + 832000000)
label.set_x(Weekly_openlbl, AsianEndTime + 832000000)
if timeframe.period == "M"
line.delete(Weekly_open)
label.delete(Weekly_openlbl)
if Terminusinp != "Terminus @ Next Midnight" and DOM
line.set_x2(Weekly_open, Terminus(Terminusinp))
label.set_x(Weekly_openlbl, Terminus(Terminusinp))
// Monthly Open
if newMonth
MonthlyOpenTime := time
if showMonthOpen and newDay
line.delete(Monthly_open )
label.delete(Monthly_openlbl )
Monthly_open:= line.new(x1=MonthlyOpenTime, y1=MonthlyOpen, x2=AsianEndTime, xloc=xloc.bar_time, y2=MonthlyOpen, color=i_MonthOpenCol, style=MonthOpenLS, width=MONTHOPPLW)
if dayofweek == dayofweek.friday and syminfo.type != "crypto"
line.set_x2(Monthly_open, EquitiesOpenTime+225000000)
if ShowLabel
Monthly_openlbl := label.new(x=AsianEndTime, y=MonthlyOpen, xloc=xloc.bar_time, color=LabelColor, textcolor=LabelTextColor, style=label.style_label_left, size=LabelSize, tooltip="Monthly Open: " + str.tostring(MonthlyOpen))
if dayofweek == dayofweek.friday and syminfo.type != "crypto"
label.set_x(Monthly_openlbl, EquitiesOpenTime+225000000)
if ShowLabelText
if SFistrue
if ShowPrices == true
label.set_text(Monthly_openlbl," M.O. | " + str.tostring(MonthlyOpen))
else
label.set_text(Monthly_openlbl," M.O. ")
label.set_tooltip(Monthly_openlbl, " Monthly Opening Price ")
else
if ShowPrices == true
label.set_text(Monthly_openlbl, " Monthly Open | " + str.tostring(MonthlyOpen))
else
label.set_text(Monthly_openlbl, " Monthly Open ")
label.set_tooltip(Monthly_openlbl, "")
label.set_textcolor(Monthly_openlbl, LabelTextColor)
label.set_size(Monthly_openlbl, LabelSize)
if timeframe.multiplier > 60
line.set_x2(Monthly_open, AsianEndTime + 232000000)
label.set_x(Monthly_openlbl, AsianEndTime + 232000000)
if timeframe.period == "D"
line.set_x2(Monthly_open, AsianEndTime + 832000000)
label.set_x(Monthly_openlbl, AsianEndTime + 832000000)
if timeframe.period == "W"
line.set_x2(Monthly_open, AsianEndTime + 2592000000)
label.set_x(Monthly_openlbl, AsianEndTime + 2592000000)
if timeframe.period == "M"
line.delete(Monthly_open)
label.delete(Monthly_openlbl)
if Terminusinp != "Terminus @ Next Midnight" and DOM
line.set_x2(Monthly_open, Terminus(Terminusinp))
label.set_x(Monthly_openlbl, Terminus(Terminusinp))
// CBDR Stuff
var float cbdr_hi = na
var float cbdr_lo = na
var float cbdr_diff = na
var box cbdrbox = na
var line cbdr_hi_line = na
var line cbdr_lo_line = na
var line dev01negline = na
var line dev02negline = na
var line dev03negline = na
var line dev04negline = na
var line dev01posline = na
var line dev02posline = na
var line dev03posline = na
var line dev04posline = na
if SessionBegins(CBDR) and DOM
cbdr_hi := high
cbdr_lo := low
cbdr_diff := cbdr_hi - cbdr_lo
if ShowTSO
box.delete(cbdrbox )
line.delete(dev01posline )
line.delete(dev01negline )
line.delete(dev02posline )
line.delete(dev02negline )
line.delete(dev03posline )
line.delete(dev03negline )
line.delete(dev04posline )
line.delete(dev04negline )
if ShowCBDR
cbdrbox := box.new(cbdrOpenTime, cbdr_hi, cbdrEndTime, cbdr_lo, color.new(CBDRBoxCol,90), 1, line.style_solid, extend.none, xloc.bar_time, color.new(CBDRBoxCol,90), txt0, size.auto, color.new(box_text_cbdr_col,80), text_wrap=text.wrap_auto)
if dayofweek == dayofweek.friday
box.set_right(cbdrbox, cbdrOpenTime+187200000)
line.set_x2(cbdr_hi_line, cbdrOpenTime+187200000)
line.set_x2(cbdr_lo_line, cbdrOpenTime+187200000)
if box_text_cbdr == false
box.set_text(cbdrbox, "")
if ShowDev and ShowCBDR and bool_cbdr_dev
for i = 1 to DevCount by 1
if i == 1
dev01posline := line.new(cbdrOpenTime, cbdr_hi + cbdr_diff * i, cbdrEndTime, cbdr_hi + cbdr_diff * i, xloc=xloc.bar_time, color=DevLNCol, style=DEVLSS, width=DEVLW)
dev01negline := line.new(cbdrOpenTime, cbdr_hi - cbdr_diff * i, cbdrEndTime, cbdr_lo - cbdr_diff * i, xloc=xloc.bar_time, color=DevLNCol, style=DEVLSS, width=DEVLW)
if dayofweek == dayofweek.friday
line.set_x2(dev01posline, cbdrOpenTime+187200000)
line.set_x2(dev01negline, cbdrOpenTime+187200000)
if i == 2
dev02posline := line.new(cbdrOpenTime, cbdr_hi + cbdr_diff * i, cbdrEndTime, cbdr_lo + cbdr_diff * i, xloc=xloc.bar_time, color=DevLNCol, style=DEVLSS, width=DEVLW)
dev02negline := line.new(cbdrOpenTime, cbdr_hi - cbdr_diff * i, cbdrEndTime, cbdr_lo - cbdr_diff * i, xloc=xloc.bar_time, color=DevLNCol, style=DEVLSS, width=DEVLW)
if dayofweek == dayofweek.friday
line.set_x2(dev02posline, cbdrOpenTime+187200000)
line.set_x2(dev02negline, cbdrOpenTime+187200000)
if i == 3
dev03posline := line.new(cbdrOpenTime, cbdr_hi + cbdr_diff * i, cbdrEndTime, cbdr_lo + cbdr_diff * i, xloc=xloc.bar_time, color=DevLNCol, style=DEVLSS, width=DEVLW)
dev03negline := line.new(cbdrOpenTime, cbdr_hi - cbdr_diff * i, cbdrEndTime, cbdr_lo - cbdr_diff * i, xloc=xloc.bar_time, color=DevLNCol, style=DEVLSS, width=DEVLW)
if dayofweek == dayofweek.friday
line.set_x2(dev03posline, cbdrOpenTime+187200000)
line.set_x2(dev03negline, cbdrOpenTime+187200000)
if i == 4
dev04posline := line.new(cbdrOpenTime, cbdr_hi + cbdr_diff * i, cbdrEndTime, cbdr_lo + cbdr_diff * i, xloc=xloc.bar_time, color=DevLNCol, style=DEVLSS, width=DEVLW)
dev04negline := line.new(cbdrOpenTime, cbdr_hi - cbdr_diff * i, cbdrEndTime, cbdr_lo - cbdr_diff * i, xloc=xloc.bar_time, color=DevLNCol, style=DEVLSS, width=DEVLW)
if dayofweek == dayofweek.friday
line.set_x2(dev04posline, cbdrOpenTime+187200000)
line.set_x2(dev04negline, cbdrOpenTime+187200000)
else if CBDRTime
cbdr_hi := math.max(high, cbdr_hi)
cbdr_lo := math.min(low, cbdr_lo)
cbdr_diff := cbdr_hi - cbdr_lo
for i = 1 to DevCount by 1
if i == 1 and ShowDev
line.set_y1(dev01posline, cbdr_hi + cbdr_diff * i)
line.set_y2(dev01posline, cbdr_hi + cbdr_diff * i)
line.set_y1(dev01negline, cbdr_lo - cbdr_diff * i)
line.set_y2(dev01negline, cbdr_lo - cbdr_diff * i)
if i == 2 and ShowDev
line.set_y1(dev02posline, cbdr_hi + cbdr_diff * i)
line.set_y2(dev02posline, cbdr_hi + cbdr_diff * i)
line.set_y1(dev02negline, cbdr_lo - cbdr_diff * i)
line.set_y2(dev02negline, cbdr_lo - cbdr_diff * i)
if i == 3 and ShowDev
line.set_y1(dev03posline, cbdr_hi + cbdr_diff * i)
line.set_y2(dev03posline, cbdr_hi + cbdr_diff * i)
line.set_y1(dev03negline, cbdr_lo - cbdr_diff * i)
line.set_y2(dev03negline, cbdr_lo - cbdr_diff * i)
if i == 4 and ShowDev
line.set_y1(dev04posline, cbdr_hi + cbdr_diff * i)
line.set_y2(dev04posline, cbdr_hi + cbdr_diff * i)
line.set_y1(dev04negline, cbdr_lo - cbdr_diff * i)
line.set_y2(dev04negline, cbdr_lo - cbdr_diff * i)
if (cbdr_hi > cbdr_hi )
if ShowCBDR
box.set_top(cbdrbox, cbdr_hi)
if (cbdr_lo < cbdr_lo )
if ShowCBDR
box.set_bottom(cbdrbox, cbdr_lo)
if DevDirection == "Upside Only"
line.delete(dev01negline)
line.delete(dev02negline)
line.delete(dev03negline)
line.delete(dev04negline)
else if DevDirection == "Downside Only"
line.delete(dev01posline)
line.delete(dev02posline)
line.delete(dev03posline)
line.delete(dev04posline)
// ASIA Stuff
var float asia_hi = na
var float asia_lo = na
var float asia_diff = na
var box asia_box = na
var line asia_hi_line = na
var line asia_lo_line = na
var line dev01negline_asia = na
var line dev02negline_asia = na
var line dev03negline_asia = na
var line dev04negline_asia = na
var line dev01posline_asia = na
var line dev02posline_asia = na
var line dev03posline_asia = na
var line dev04posline_asia = na
if SessionBegins(ASIA) and DOM
asia_hi := high
asia_lo := low
asia_diff := asia_hi - asia_lo
if ShowTSO
box.delete(asia_box )
line.delete(dev01posline_asia )
line.delete(dev01negline_asia )
line.delete(dev02posline_asia )
line.delete(dev02negline_asia )
line.delete(dev03posline_asia )
line.delete(dev03negline_asia )
line.delete(dev04posline_asia )
line.delete(dev04negline_asia )
if ShowASIA
asia_box := box.new(asiaOpenTime, asia_hi, asiaEndTime, asia_lo, color.new(ASIABoxCol,90), 1, line.style_solid, extend.none, xloc.bar_time, color.new(ASIABoxCol,90), txt1, size.auto, color.new(box_text_asia_col,80), text_wrap=text.wrap_auto)
if box_text_asia == false
box.set_text(asia_box, "")
if ShowDev and ShowASIA and bool_asia_dev
for i = 1 to DevCount by 1
if i == 1
dev01posline_asia := line.new(asiaOpenTime, asia_hi + asia_diff * i, asiaEndTime, asia_hi + asia_diff * i, xloc=xloc.bar_time, color=DevLNCol, style=DEVLSS, width=DEVLW)
dev01negline_asia := line.new(asiaOpenTime, asia_hi - asia_diff * i, asiaEndTime, asia_lo - asia_diff * i, xloc=xloc.bar_time, color=DevLNCol, style=DEVLSS, width=DEVLW)
if i == 2
dev02posline_asia := line.new(asiaOpenTime, asia_hi + asia_diff * i, asiaEndTime, asia_lo + asia_diff * i, xloc=xloc.bar_time, color=DevLNCol, style=DEVLSS, width=DEVLW)
dev02negline_asia := line.new(asiaOpenTime, asia_hi - asia_diff * i, asiaEndTime, asia_lo - asia_diff * i, xloc=xloc.bar_time, color=DevLNCol, style=DEVLSS, width=DEVLW)
if i == 3
dev03posline_asia := line.new(asiaOpenTime, asia_hi + asia_diff * i, asiaEndTime, asia_lo + asia_diff * i, xloc=xloc.bar_time, color=DevLNCol, style=DEVLSS, width=DEVLW)
dev03negline_asia := line.new(asiaOpenTime, asia_hi - asia_diff * i, asiaEndTime, asia_lo - asia_diff * i, xloc=xloc.bar_time, color=DevLNCol, style=DEVLSS, width=DEVLW)
if i == 4
dev04posline_asia := line.new(asiaOpenTime, asia_hi + asia_diff * i, asiaEndTime, asia_lo + asia_diff * i, xloc=xloc.bar_time, color=DevLNCol, style=DEVLSS, width=DEVLW)
dev04negline_asia := line.new(asiaOpenTime, asia_hi - asia_diff * i, asiaEndTime, asia_lo - asia_diff * i, xloc=xloc.bar_time, color=DevLNCol, style=DEVLSS, width=DEVLW)
else if ASIATime
asia_hi := math.max(high, asia_hi)
asia_lo := math.min(low, asia_lo)
asia_diff := asia_hi - asia_lo
for i = 1 to DevCount by 1
if i == 1 and ShowDev
line.set_y1(dev01posline_asia, asia_hi + asia_diff * i)
line.set_y2(dev01posline_asia, asia_hi + asia_diff * i)
line.set_y1(dev01negline_asia, asia_lo - asia_diff * i)
line.set_y2(dev01negline_asia, asia_lo - asia_diff * i)
if i == 2 and ShowDev
line.set_y1(dev02posline_asia, asia_hi + asia_diff * i)
line.set_y2(dev02posline_asia, asia_hi + asia_diff * i)
line.set_y1(dev02negline_asia, asia_lo - asia_diff * i)
line.set_y2(dev02negline_asia, asia_lo - asia_diff * i)
if i == 3 and ShowDev
line.set_y1(dev03posline_asia, asia_hi + asia_diff * i)
line.set_y2(dev03posline_asia, asia_hi + asia_diff * i)
line.set_y1(dev03negline_asia, asia_lo - asia_diff * i)
line.set_y2(dev03negline_asia, asia_lo - asia_diff * i)
if i == 4 and ShowDev
line.set_y1(dev04posline_asia, asia_hi + asia_diff * i)
line.set_y2(dev04posline_asia, asia_hi + asia_diff * i)
line.set_y1(dev04negline_asia, asia_lo - asia_diff * i)
line.set_y2(dev04negline_asia, asia_lo - asia_diff * i)
if (asia_hi > asia_hi )
box.set_top(asia_box, asia_hi)
if (asia_lo < asia_lo )
box.set_bottom(asia_box, asia_lo)
if DevDirection == "Upside Only"
line.delete(dev01negline_asia)
line.delete(dev02negline_asia)
line.delete(dev03negline_asia)
line.delete(dev04negline_asia)
else if DevDirection == "Downside Only"
line.delete(dev01posline_asia)
line.delete(dev02posline_asia)
line.delete(dev03posline_asia)
line.delete(dev04posline_asia)
// FLOUT Stuff
var float flout_hi = na
var float flout_lo = na
var float flout_diff = na
var box floutbox = na
var line flout_hi_line = na
var line flout_lo_line = na
var line dev01negline_flout = na
var line dev02negline_flout = na
var line dev03negline_flout = na
var line dev04negline_flout = na
var line dev01posline_flout = na
var line dev02posline_flout = na
var line dev03posline_flout = na
var line dev04posline_flout = na
if SessionBegins(FLOUT) and DOM
flout_hi := high
flout_lo := low
flout_diff := flout_hi - flout_lo
if ShowTSO
box.delete(floutbox )
line.delete(dev01posline_flout )
line.delete(dev01negline_flout )
line.delete(dev02posline_flout )
line.delete(dev02negline_flout )
line.delete(dev03posline_flout )
line.delete(dev03negline_flout )
line.delete(dev04posline_flout )
line.delete(dev04negline_flout )
if ShowFLOUT
floutbox := box.new(floutOpenTime, flout_hi, floutEndTime, flout_lo, color.new(FLOUTBoxCol,90), 1, line.style_solid, extend.none, xloc.bar_time, color.new(FLOUTBoxCol,90), txt7, size.auto, color.new(box_text_flout_col,80), text_wrap=text.wrap_auto)
if dayofweek == dayofweek.friday
box.set_right(floutbox, floutOpenTime+201600000)
line.set_x2(flout_hi_line, floutOpenTime+201600000)
line.set_x2(flout_lo_line, floutOpenTime+201600000)
if box_text_cbdr == false
box.set_text(floutbox, "")
if ShowDev and ShowFLOUT and bool_flout_dev
for i = 0.5 to DevCount by 0.5
if i == 0.5
dev01posline_flout := line.new(floutOpenTime, flout_hi + flout_diff * i, floutEndTime, flout_hi + flout_diff * i, xloc=xloc.bar_time, color=DevLNCol, style=DEVLSS, width=DEVLW)
dev01negline_flout := line.new(floutOpenTime, flout_hi - flout_diff * i, floutEndTime, flout_lo - flout_diff * i, xloc=xloc.bar_time, color=DevLNCol, style=DEVLSS, width=DEVLW)
if dayofweek == dayofweek.friday
line.set_x2(dev01posline_flout, floutOpenTime+201600000)
line.set_x2(dev01negline_flout, floutOpenTime+201600000)
if i == 1
dev02posline_flout := line.new(floutOpenTime, flout_hi + flout_diff * i, floutEndTime, flout_lo + flout_diff * i, xloc=xloc.bar_time, color=DevLNCol, style=DEVLSS, width=DEVLW)
dev02negline_flout := line.new(floutOpenTime, flout_hi - flout_diff * i, floutEndTime, flout_lo - flout_diff * i, xloc=xloc.bar_time, color=DevLNCol, style=DEVLSS, width=DEVLW)
if dayofweek == dayofweek.friday
line.set_x2(dev02posline_flout, floutOpenTime+201600000)
line.set_x2(dev02negline_flout, floutOpenTime+201600000)
if i == 1.5
dev03posline_flout := line.new(floutOpenTime, flout_hi + flout_diff * i, floutEndTime, flout_lo + flout_diff * i, xloc=xloc.bar_time, color=DevLNCol, style=DEVLSS, width=DEVLW)
dev03negline_flout := line.new(floutOpenTime, flout_hi - flout_diff * i, floutEndTime, flout_lo - flout_diff * i, xloc=xloc.bar_time, color=DevLNCol, style=DEVLSS, width=DEVLW)
if dayofweek == dayofweek.friday
line.set_x2(dev03posline_flout, floutOpenTime+201600000)
line.set_x2(dev03negline_flout, floutOpenTime+201600000)
if i == 2
dev04posline_flout := line.new(floutOpenTime, flout_hi + flout_diff * i, floutEndTime, flout_lo + flout_diff * i, xloc=xloc.bar_time, color=DevLNCol, style=DEVLSS, width=DEVLW)
dev04negline_flout := line.new(floutOpenTime, flout_hi - flout_diff * i, floutEndTime, flout_lo - flout_diff * i, xloc=xloc.bar_time, color=DevLNCol, style=DEVLSS, width=DEVLW)
if dayofweek == dayofweek.friday
line.set_x2(dev04posline_flout, floutOpenTime+201600000)
line.set_x2(dev04negline_flout, floutOpenTime+201600000)
else if FLOUTTime
flout_hi := math.max(high, flout_hi)
flout_lo := math.min(low, flout_lo)
flout_diff := flout_hi - flout_lo
for i = 0.5 to DevCount by 0.5
if i == 0.5 and ShowDev
line.set_y1(dev01posline_flout, flout_hi + flout_diff * i)
line.set_y2(dev01posline_flout, flout_hi + flout_diff * i)
line.set_y1(dev01negline_flout, flout_lo - flout_diff * i)
line.set_y2(dev01negline_flout, flout_lo - flout_diff * i)
if i == 1 and ShowDev
line.set_y1(dev02posline_flout, flout_hi + flout_diff * i)
line.set_y2(
