TRADE.GODANN-based script, comparing the previous and current closing of the asset with its percentage of change and determining the purchase or sale accordingly.
I recommend using the time of the script in 60 minutes and the time of opration and 5 minutes for a better scalp.
For junior time I recommend 240 minutes for the script time and 60 minutes for the operating time.
Thanks Thiago Kerbes;)
Search in scripts for "股价站上60月线"

RSI|The Wave PrincipleThe Wave Principle | Modified RSI
30 green | 70 red = Strong Movement (Possible Impulse)
20 cyan | 80 Yellow = Strongest Movement
Support and Resistance Level (Trend Continuation)
Uptrend= 40
Downtrend = 60
Break+Retest = BR
Div = Divergence (Change in trend)
--------------------------------------------
This indicator has been modified from original RSI to fit Wave Principle characteristics:
Uptrend Impulsive Wave over 70 RSI it changes color to red, and > 80 yellow stronger impulse | Usually means continuation, at least once more.
Downtrend Impulsive Wave under 30 RSI it changes color to green, and < 20 cyan stronger impulse | Usually means continuation, at least once more.
Once RSI reached these levels, it doesn't mean trend reversal but a correction is expected. If it shows divergence along with an Ending Diagonal, it's a confirmation for trend reversal.
In a corrective wave, levels 40-60 represents support and resistance levels where price won't go further. Indicating Corrective Waves, not as strong as Impulsives.
Prices can breakout RSI trend lines and retest from the other side before continue the new trend as also described in the Wave Principle.
--------------------------------------------

The Scale Of Sacred SoundsBased on the Sacred Sound Scale
How to use it:
This indicator is designed to capture the inferred behavior of traders and investors by using two groups of averages.
Meant for longer trades and trend indicator.
Used on any timescale as needed.
Can trade on long or short where the slow MA crosses fast Ma or where the Slow MA compresses and flips open again.
Follow the trend to the end - pot of gold at the end of the rainbow :-)
References:
Based on Daryl Guppy GMMA and
www.guppytraders.com
Read more at:
whatmusicreallyis.com
There is one tuning in which the frequencies 432, 528, 424 and 440 Hz can peacefully coexist. The scale has 32+1 pure harmonic tones and the reference frequency of 256 Hz. It comes from the Natural Ascending Series of Harmonics 32 to 64 of the 8 Hz Fundamental Tone, and represents its 6th double. I call this tuning The Scale of Sacred Sounds.
Representation using ancient Sumerian/Babylonian/Vedic math:
32; 33; 34; 35; 36; 37; 38; 39; 40; 41; 42; 43; 44; 45; 46; 47; 48; 49; 50; 51; 52; 53; 54; 55; 56; 57; 58; 59; 60; 61; 62; 63; 64
Representation using musical ratios:
1/1; 33/32; 17/16; 35/32; 9/8; 37/32; 19/16; 39/32; 5/4; 41/32; 21/16; 43/32; 11/8; 45/32; 23/16; 47/32; 3/2; 49/32; 25/16; 51/32; 13/8; 53/32; 27/16; 55/32; 7/4; 57/32; 29/16; 59/32; 15/8; 61/32; 31/16; 63/32; 2/1
The math for deriving one of the above series from the other is simple. Divide all numbers from the ancient series by the first, then simplify the fractions. Conversely, the series of ratios can be turned into the series of integers by calculating their least common denominator (the smallest whole number that is a multiple of all numbers under the fraction bar) and discarding it.
Logarithmic representation using musical constants (definition given further down):
0,000; 30,772; 60,625; 89,612; 117,783; 145,182; 171,850; 197,826; 223,144; 247,836; 271,934; 295,464; 318,454; 340,927; 362,905; 384,412; 405,465; 426,084; 446,287; 466,090; 485,508; 504,556; 523,248; 541,597; 559,616; 577,315; 594,707; 611,802; 628,609; 645,138; 661,398; 677,399; 693,147

Bitfinex Longs/Shorts Ratio AlertableThis script contains Bitfinex longs/short ratio and generates alarms with a given input .default value is 60 which means alerts when either shorts/longs reach 60:40 ratio

RSI / Stoch / SRSI / MFI / Aroon Overlay [SigmaDraconis]Combines 4 popular indicators (RSI, Stoch, SRSI, MFI) and 1 peculiar one (Aroon) in 1 for those who want to save indicators but not only.
This is an evolution of my (simpler) "RSI / Stoch / Stoch RSI (SRSI) Overlay " that you can find on my scripts.
Added bands for oversold/overbought areas (70/30 common for RSI and 80/20 for SRSI and MFI), as well as a middle 50 horizontal line.
Neutral bands around 55-45 added as well that can be hidden for less clutter. I also recommend a more transparent coloring for these since Pine script doesn't allow default transparency for horizontal lines.
By default only RSI and Stoch are activated, you can activate Aroon, MFI and SRSI on the inputs window.
Some extra notes:
* RSI, Stoch and MFI can help to strengthen one's decision as well as Aroon to predict a possible trend reversal, SRSI can show when RSI has high probability of being topped or bottomed when oversold/overbought but don't forget to look at volume and how the trend progresses that can keep SRSI above 80 or below 20 while RSI and price continues to trend, divergences are most helpful here to find possible reversal areas.
* This chart depicts some interesting divergences, as well as Stoch tops and bottoms and confluences between RSI/MFI and Stoch on some over-extended tops and bottoms that shown being good reversal zones.
RSI resistances are shown as well, failing to break above 60 or the neutral zone (this is a bearish BTC trend chart after all) or failing to gain support to break up certain levels (RSI notes a more bullish trend when consistently above 60 and more bearish below 40).
If you like it and use it to profit, please tip me below :)
Tip jars:
BTC: 15nMBiEGVrdGcu9C1h6QRcTNRvugHkqrMQ
ETH: 0xC33845946c48B61fBCbEA0367ec2238CaF2b73bc
BTS: sigma-draconis

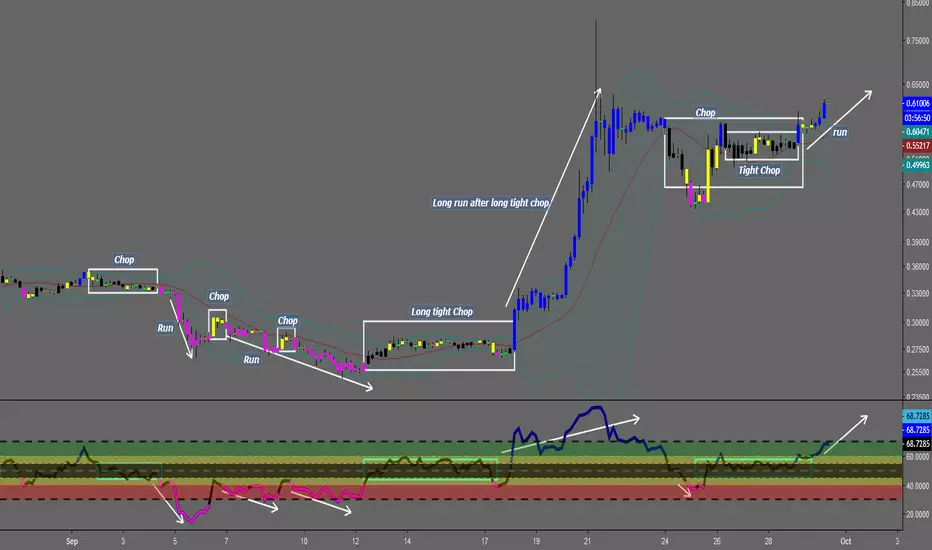
Chop and explodeThe purpose of this script is to decipher chop zones from runs/movement/explosion
The chop is RSI movement between 40 and 60
tight chop is RSI movement between 45 and 55. There should be an explosion after RSI breaks through 60 (long) or 40 (short). Tight chop bars are colored black, a series of black bars is tight consolidation and should explode imminently. The longer the chop the longer the explosion will go for. tighter the better.
Loose chop (whip saw/yellow bars) will range between 40 and 60.
the move begins with blue bars for long and purple bars for short.
Couple it with your trading system to help stay out of chop and enter when there is movement. Use with "Simple Trender."
Best of luck in all you do. Get money.
Build A BotThis is the Robot we built during the 60 Minute Build-A-Bot webinar on September 12, 2018. We had a great time, and a lot of participation and the best part was that we finished up this robot and even ran a backtest in exactly 60 minutes! We built this robot based on recommendations and suggestions from those who were attending live. Lots of pieces in this robot, but you can always tinker with it, remove stuff, add things, whatever you want!
This version uses the CCI as a trigger for trade entry. The other version uses the Hull Moving Average as a trigger for trade entry.

Volume Zone Oscillator and Price Zone (VZO/PZO) [NeoButane]" Volume Precedes Price is the conceptual idea for the oscillator."
"The main idea of the VZO was to try to change the OBV to look like an oscillator rather than an indicator, also to include time; primarily to identify which zone the volume is located in during a specific period "
How to read this indicator:
Positive reading -> bullish
Negative reading -> bearish
-60 or 60 is seen as the limit of the oscillator range, and a pullback should be expected from there.
Plus and minus signs have been added to the top and bottom for VZO and PZO, with an adjustable threshold to trigger.
Alert conditions have been added to this indicator for ease of use.
Volume Zone Oscillator, write-up by the author (recommended reading)
http:capitalsynergy.com/resources/IFTA09VZO.pdf
Volume Zone Oscillator, uses and formula
https:www.investopedia.com/articles/active-trading/072815/how-interpret-volume-zone-oscillator.asp
Price Zone Oscillator, uses and formula
https:www.investopedia.com/terms/p/price-zone-oscillator.asp

Fib,Guppy Multiple MA(FGMMA)(A/D & Volume Weight,SMA,EMA)[cI8DH]Features:
- 3 + 12 MAs (12 is chosen because Guppy has 12 MAs)
- MA types can be set to Simple, Exponential, Weighted, and Smoothed
- Volume weight can be applied to all available MAs (the built-in VWMA uses Simple MA)
- It is possible to count in only effective portions of the volume in the equation by using Accum/Dist Volume Weight
- Secondary smoothing (useful when volume weight is enabled)
- Predefined MA sets based on Fibonacci sequence (2,3,5,8,.., 377), Guppy (3,5,8,10,12,15 &30,35,40,45,50,60), and cI8DH (2,3,5,8,12,17 & 30,34,39,45,52,60)
Recommended settings:
- hlc3 as input source captures all the essential information encapsulated in a candle. I'd use hlc3 as the default option. In uptrend, "low" and in downtrend, "high" might give more relevant results when using MAs for structural analysis of a market. For commonly used MAs (EMA20, SMA50,100,200), "close" should be used due to their self-fulfilling prophecy effect.
- When you have volume weight above 0, you may want to use secondary smoothing.
- Try not to use Simple MA for smaller lengths (below 20). Sharp changes in the past (right before the period specified by the length) will affect the current value of MA dramatically leading to confusion.
- I am using the first 3 MAs for SMA 50,100,200. You can disable them from the MA type selector all at once when using Fib or Guppy ribbons.
MA-based analysis:
There are different ways of structuring a market. Geometrical (trend lines, channels, fans, patterns, etc) and Fib retracement-based structuring is very common among traders. MAs give an alternative way of analyzing markets. MA ribbons such as Guppy (6 slow and 6 fast-moving MAs) are popular for analyzing market flow. IMO default Guppy sets are a bit random as the numbers do not have an elegant sequence. So I proposed my sets based on increasing sequene spacing (+1). These two MA ribbons are good for market flow analysis but the spacing of the MAs are not ideal for structuring a market. Ribbons based on the Fib sequence is a better choice for structuring a market. This is the equivalent of Fib channels but in a more dynamic form. Among other things, MA Fib ribbon can be used to assess market momentum and to compare different stages of a market. Here are two "educational-only" examples:
Notes:
- Smoothed MA with length L = Exponential MA with length 2*L-1
- Read the background section in my ADP indicator to understand how A/D Volume is calculated

Better RSI with bullish / bearish market cycle indicator This script improves the default RSI. First. it identifies regions of the RSI which are oversold and overbought by changing the color of RSI from white to red. Second, it adds additional reference lines at 20,40,50,60, and 80 to better gauge the RSI value. Finally, the coolest feature, the middle 50 line is used to indicate which cycle the price is currently at. A green color at the 50 line indicates a bullish cycle, a red color indicators a bearish cycle, and a white color indicates a neutral cycle.
The cycles are determined using the RSI as follows:
if RSI is overbought, cycle switches to bullish until RSI falls below 40, at which point it becomes neutral
if RSI is oversold, cycle switches bearish until RSI rises above 60, at which point it becomes neutral
a neutral cycle is exited at either overbought or oversold conditions
Very useful, please give it a try and let me know what you think

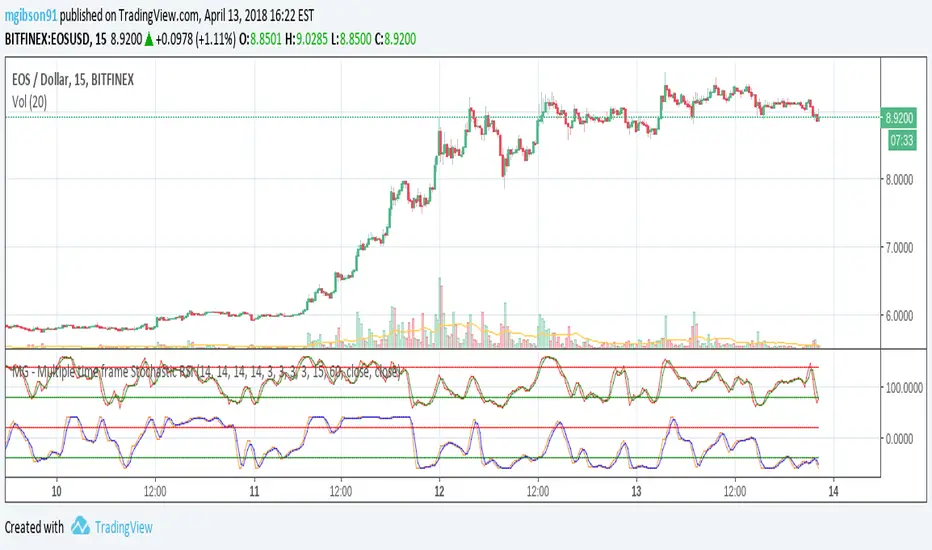
MG - Multiple time frame Stochastic RSIAllows user to view stochastic RSI from two different time frames.
Each stochastic RSI indicator is fully customizable, offering the following options:
- Timeframe
- RSI source
- RSI length
- Stochastic length
- Stochastic average length
- Stochastic smoothing length
Usage:
Comparing stochastic RSI across two different time frames can sharpen trades. For example, if you configure a 60 min and 5/15 min stochastic RSI pair, you might enter a long trade when the 60 min stoch RSI crosses up and exit / take profit when the 5 min stock RSI crosses down.
NG [Simple Harmonic Oscillator]The SHO is a bounded oscillator for the simple harmonic index that calculates the period of the market’s cycle.
The oscillator is used for short and intermediate terms and moves within a range of -100 to 100 percent.
The SHO has overbought and oversold levels at +40 and -40, respectively.
At extreme periods, the oscillator may reach the levels of +60 and -60.
The zero level demonstrates an equilibrium between the periods of bulls and bears.
The SHO oscillates between +40 and -40.
The crossover at those levels creates buy and sell signals.
In an uptrend, the SHO fluctuates between 0 and +40 where the bulls are controlling the market.
On the contrary, the SHO fluctuates between 0 and -40 during downtrends where the bears controlthe market.
Reaching the extreme level -60 in an uptrend is a sign of weakness.

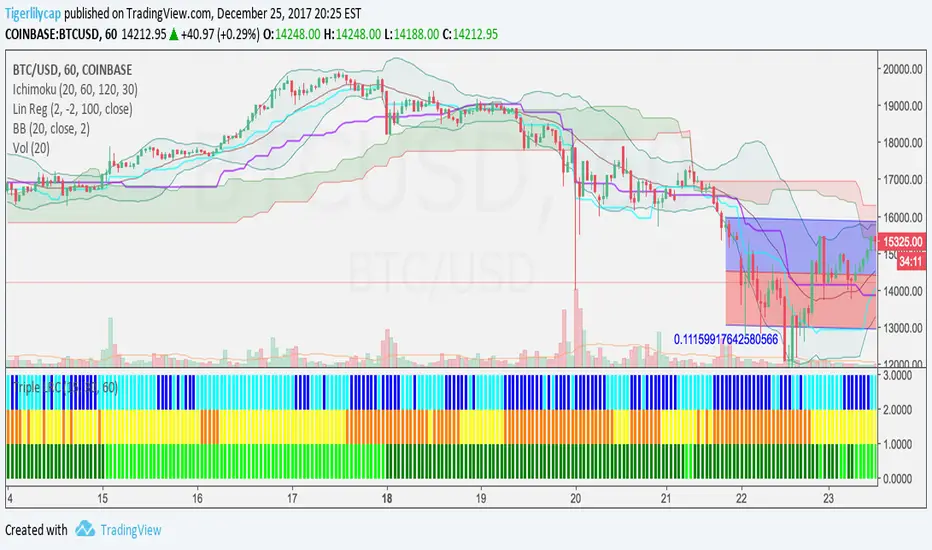
Ichimoku Cloud w/SelIchimoku Cloud with selection for:
Regular:
conversionPeriods = 9,
basePeriods = 26
laggingSpan2Periods = 52,
displacement = 26
Crypto:
conversionPeriods = 10,
basePeriods = 30,
laggingSpan2Periods = 60,
displacement = 30
Crypto Doubled:
conversionPeriods = 20,
basePeriods = 60,
laggingSpan2Periods = 120,
displacement = 30

3 Linear Regression CurveFast 3LRC - 15/30/60 standard settings - 15/30 give a lot of noise, but give you a some time to prepare for the 60 to flip
DEMA Double Exponential Moving Average Strategy@Moneros 2017
Based on The DEMA is a fast-acting moving average that is more responsive to market changes than a traditional moving average
en.wikipedia.org
!!!! IN ORDER TO AVOID REPAITING ISSUES !!!!
!!!! DO NOT VIEW IN LOWER RESOLUTIONS THAN res/2 PARAMETER !!!!
for example res = 120 view >= 60m res = 60 view >= 30m
the length of the DEMA sampling shouldn't be longer than a candle
Best profits tested on BTCUSD
res = 105 slowPeriod = 2 fastPeriod = 32
res = 125 slowPeriod = 3 fastPeriod = 21
res = 120 slowPeriod = 2 fastPeriod = 32
res = 130 slowPeriod = 1 fastPeriod = 24
res = 40 slowPeriod = 4 fastPeriod = 93
res = 60 slowPeriod = 1 fastPeriod = 67
BTCUSD

RSI in Bull and Bear Market V2.0RSI oversold at 60/40 in bullish market
And Overbought at 40/60 in Bearish market
for more info of this Strategy

WaveTrend [MastroFran]Great indicator to show short term price movements. 5 day moving average oscillator. When green crosses red and under the 60 mark, buy with caution. when over the 60 mark and red crosses green sell immediately for highest profits.

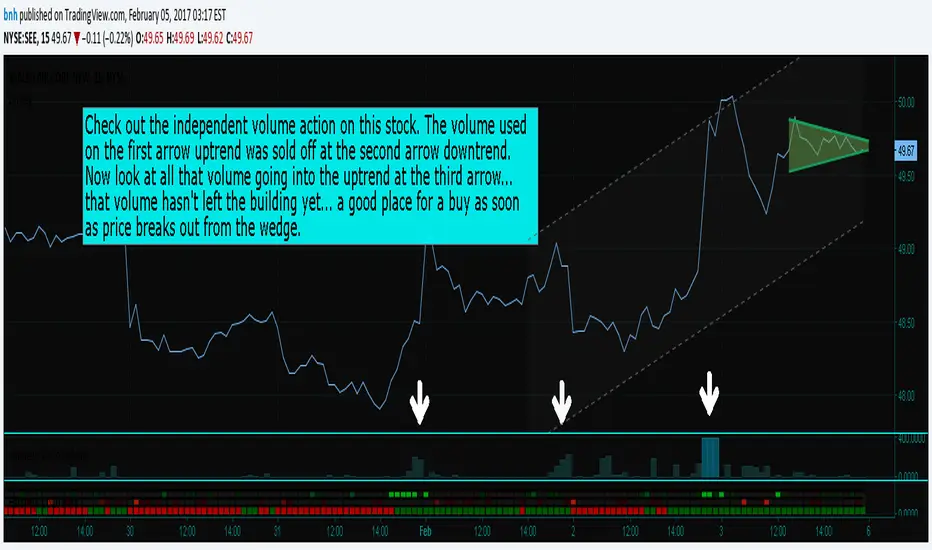
Hersheys CoCo VolumeCoCo Volume shows you volume movement of your symbol after subtracting the movement from another symbol, preferrably the sector or market the stock belongs to.
My latest update to my CoCoVolume Indicator. It calculates today's volume percent over the 60 period average for both your symbol and index, and displays that difference. If the percent is over the max it highlights the color, showing BIG action for that stock.
The last version was calculating the percent volume difference from yesterday to today for the stock and index and displaying the difference. The prior method had large swings on low volume stocks... this one shows the independent volume action much better. The default values will suit most stocks.
You can set three variables...
- the index symbol, default is SPY
- the period for averaging, default is 60
- the max volume percent, default is 500
Good trading!
Brian Hershey
close-hl2 Price actionStill not tested, but looks very good ; it is the difference between EMA median price and EMA close in different time frame, I used 240, 60, and the current Time frame ,plus one more customed period ; can forcast the price movement , but it s not in scale, so it can not show how much higher or lower the price can goes but just the next direction. I think intraday on 5 ,15 ,60 better then high frame.If you need to try on Daily frame have to change the period to higher then Daily

Everyday 0002 _ MAC 1st Trading Hour WalkoverThis is the second strategy for my Everyday project.
Like I wrote the last time - my goal is to create a new strategy everyday
for the rest of 2016 and post it here on TradingView.
I'm a complete beginner so this is my way of learning about coding strategies.
I'll give myself between 15 minutes and 2 hours to complete each creation.
This is basically a repetition of the first strategy I wrote - a Moving Average Crossover,
but I added a tiny thing.
I read that "Statistics have proven that the daily high or low is established within the first hour of trading on more than 70% of the time."
(source: )
My first Moving Average Crossover strategy, tested on VOLVB daily, got stoped out by the volatility
and because of this missed one nice bull run and a very nice bear run.
So I added this single line: if time("60", "1000-1600") regarding when to take exits:
if time("60", "1000-1600")
strategy.exit("Close Long", "Long", profit=2000, loss=500)
strategy.exit("Close Short", "Short", profit=2000, loss=500)
Sweden is UTC+2 so I guess UTC 1000 equals 12.00 in Stockholm. Not sure if this is correct, actually.
Anyway, I hope this means the strategy will only take exits based on price action which occur in the afternoon, when there is a higher probability of a lower volatility.
When I ran the new modified strategy on the same VOLVB daily it didn't get stoped out so easily.
On the other hand I'll have to test this on various stocks .
Reading and learning about how to properly test strategies is on my todo list - all tips on youtube videos or blogs
to read on this topic is very welcome!
Like I said the last time, I'm posting these strategies hoping to learn from the community - so any feedback, advice, or corrections is very much welcome and appreciated!
/pbergden

IU Momentum OscillatorDESCRIPTION:
The IU Momentum Oscillator is a specialized trend-following tool designed to visualize the raw "energy" of price action. Unlike traditional oscillators that rely solely on closing prices relative to a range (like RSI), this indicator calculates momentum based on the ratio of bullish candles over a specific lookback period.
This "Neon Edition" has been engineered with a focus on visual clarity and aesthetic depth. It utilizes "Shadow Plotting" to create a glowing effect and dynamic "Trend Clouds" to highlight the strength of the move. The result is a clean, modern interface that allows traders to instantly gauge market sentiment—whether the bulls or bears are in control—without cluttering the chart with complex lines.
USER INPUTS:
- Momentum Length (Default: 20): The number of past candles analyzed to count bullish occurrences.
- Momentum Smoothing (Default: 20): An SMA filter applied to the raw data to reduce noise and provide a cleaner wave.
- Signal Line Length (Default: 5): The length of the EMA signal line used to generate crossover signals and the "Trend Cloud."
- Overbought / Oversold Levels (Default: 60 / 40): Thresholds that define extreme market conditions.
- Colors: Fully customizable Neon Cyan (Bullish) and Neon Magenta (Bearish) inputs to match your chart theme.
LONG CONDITION:
- Signal: A Buy signal is indicated by a small Cyan Circle.
- Logic: Occurs when the Main Momentum Line (Glowing) crosses ABOVE the Grey Signal Line.
- Visual Confirmation: The "Trend Cloud" turns Cyan and expands, indicating that bullish momentum is accelerating relative to the recent average.
SHORT CONDITIONS:
- Signal: A Sell signal is indicated by a small Magenta Circle.
- Logic: Occurs when the Main Momentum Line (Glowing) crosses BELOW the Grey Signal Line.
- Visual Confirmation: The "Trend Cloud" turns Magenta, indicating that bearish pressure is increasing.
WHY IT IS UNIQUE:
1. Candle-Count Logic: Most oscillators calculate price distance. This indicator calculates price participation (how many candles were actually green vs red). This offers a different perspective on trend sustainability.
2. Optimized Performance: The script uses math.sum functions rather than heavy for loops, ensuring it loads instantly and runs smoothly on all timeframes.
3. Visual Hierarchy: It uses dynamic gradients and transparency (Alpha channels) to create a "Glow" and "Cloud" effect. This makes the chart easier to read at a glance compared to flat, single-line oscillators.
HOW USER CAN BENEFIT FROM IT:
- Trend Confirmation: Traders can use the "Trend Cloud" to stay in trades longer. As long as the cloud is thick and colored, the trend is strong.
- Divergence Spotting: Because this calculates momentum differently than RSI, it can often show divergences (price goes up, but the count of bullish candles goes down) earlier than standard tools.
- Scalping: The crisp crossover signals (Circles) provide excellent entry triggers for scalpers on lower timeframes when combined with key support/resistance levels.
DISCLAIMER:
This source code and the information presented here are for educational and informational purposes only. It does not constitute financial, investment, or trading advice.
Trading in financial markets involves a high degree of risk and may not be suitable for all investors. You should not rely solely on this indicator to make trading decisions. Always perform your own due diligence, manage your risk appropriately, and consult with a qualified financial advisor before executing any trades.

EMA Market Structure [BOSWaves]EMA Market Structure - Trend-Driven Structural Mapping with Adaptive Swing Detection
Overview
The EMA Market Structure indicator provides an advanced framework for visualizing market structure through dynamically filtered trend and swing analysis.
Unlike conventional EMA overlays, which merely indicate average price direction, this model integrates trend acceleration, swing highs/lows, and break-of-structure (BOS) logic into a unified, visually intuitive display.
Each element adapts in real time to price movement, offering traders a living map of support, resistance, and trend bias that reacts fluidly to market momentum.
The result is a comprehensive, trend-aware representation of price structure.
EMA slope and acceleration guide trend perception, while swing points identify key inflection zones.
Breaks of prior highs or lows are highlighted with visual BOS labels and stop-loss projections, giving traders actionable context for continuation or reversal setups.
Unlike static lines or simple moving averages, the EMA Market Structure indicator fuses dynamic trend analysis with structural awareness to provide a clear picture of market bias and potential turning points.
Theoretical Foundation
The EMA Market Structure builds on principles of momentum filtering and structural analysis.
Standard moving averages track average price but ignore acceleration and context; this indicator captures both the directional slope of the EMA and its rate of change, providing a proxy for trend strength.
Simultaneously, swing detection identifies statistically significant highs and lows, while BOS logic flags decisive breaks in structure, aligned with trend direction.
At its core are three interacting components:
EMA Trend & Acceleration : Smooths price data while highlighting acceleration changes, producing gradient-driven color cues for trend momentum.
Swing Detection Engine : Identifies swing highs and lows over configurable bar lengths, ensuring key turning points are captured with minimal clutter.
Break-of-Structure Logic : Detects price breaches of previous swings and aligns them with EMA trend for actionable BOS signals, including projected stop-loss levels for tactical decision-making.
By integrating these elements, the system scales effectively across timeframes and assets, maintaining structural clarity while visualizing trend dynamics in real time. Traders receive both macro and micro perspectives of market movement, with clear cues for trend continuation or reversal.
How It Works
The EMA Market Structure indicator operates through layered processing stages:
EMA Slope & Acceleration : Calculates the EMA and its rate of change, normalizing via ATR and a smoothing function to produce gradient color coding. This allows instant visual identification of bullish or bearish momentum.
Swing Identification : Swing highs and lows are computed using configurable left/right bar lengths, filtered through a cool-off mechanism to prevent redundant signals and maintain chart clarity.
Structural Lines & Zones : Swing points are connected with lines, and shaded zones are drawn between successive highs/lows to highlight key support and resistance regions.
Break-of-Structure Detection : BOS events occur when price breaches a prior swing in alignment with the EMA trend. Bullish and bearish BOS signals include enhanced label effects and projected stop-loss lines and zones, providing immediate tactical reference.
Dynamic Background Mapping : The chart background adapts to EMA trend direction, reinforcing trend context with subtle visual cues.
Through these processes, the indicator creates a living, adaptive map of market structure that reflects both trend strength and swing-based inflection points.
Interpretation
The EMA Market Structure reframes market reading from simple trend following to structured awareness of price behavior:
Uptrend Phases : EMA is rising with positive acceleration, swings confirm higher lows, and BOS events occur above prior highs, signaling trend continuation.
Downtrend Phases : EMA slope is negative, swings form lower highs, and BOS events occur below prior lows, confirming bearish bias.
Trend Reversals : Flat or decelerating EMA with BOS failures may indicate impending structural change.
Critical Zones : Swing-based lines and shaded zones highlight areas where price may pause, reverse, or accelerate, providing high-probability decision points.
Visually, EMA color gradients, structural lines, and BOS labels combine to provide both statistical trend confirmation and actionable structural cues.
Strategy Integration
EMA Market Structure integrates seamlessly into trend-following and swing-based trading systems:
Trend Alignment : Confirm higher-timeframe EMA slope before entering continuation trades.
BOS Entry Triggers : Use BOS events aligned with EMA trend for tactical entries and stop placement.
Support/Resistance Mapping : Swing lines and zones help define areas for scaling, exits, or reversals.
Volatility Context : ATR-based smoothing and stop-loss buffers accommodate varying market volatility, ensuring robustness across conditions.
Multi-Timeframe Coordination : Combine higher-timeframe EMA trend and swings with lower-timeframe structural events for precision entries.
Technical Implementation Details
Core Engine : EMA slope and ATR-normalized acceleration for gradient-driven trend visualization.
Swing Framework : Pivot-based high/low detection with configurable bar lengths and cool-off intervals.
Structural Visualization : Lines, zones, and labels for high-fidelity mapping of support/resistance and BOS events.
BOS Engine : Detects structural breaks aligned with EMA trend, automatically plotting stop-loss lines and visual cues.
Performance Profile : Lightweight, optimized for real-time responsiveness across multiple timeframes.
Optimal Application Parameters
Timeframe Guidance:
1 - 5 min : Ideal for intraday swing spotting and microstructure trend tracking.
15 - 60 min : Medium-range structural analysis and BOS-driven entries.
4H - Daily : Macro trend mapping and key swing-based support/resistance identification.
Suggested Configuration:
EMA Length : 50
Swing Length : 5
Swing Cooloff : 10 bars
BOS Cooloff : 15 bars
SL Buffer : 0.1%
These suggested parameters should be used as a baseline; their effectiveness depends on the asset volatility, liquidity, and preferred entry frequency, so fine-tuning is expected for optimal performance.
Performance Characteristics
High Effectiveness:
Trending markets with defined swings and structural consistency.
Markets where EMA slope and acceleration reliably indicate momentum changes.
Reduced Effectiveness:
Choppy or sideways markets with minimal swing definition.
Random walk assets lacking clear structural anchors.
Integration Guidelines
Confluence Framework : Combine with volume, momentum, or BOSWaves structural indicators
to validate entries.
Directional Control: Follow EMA slope and BOS alignment for high-conviction trades.
Risk Calibration: Use SL projections for disciplined exposure management.
Multi-Timeframe Synergy: Confirm higher-timeframe trend before executing lower-timeframe structural trades.
Disclaimer
The EMA Market Structure is a professional-grade trend and structure visualization tool. It is not predictive or guaranteed profitable; performance depends on parameter tuning, market regime, and disciplined execution. BOSWaves recommends using it as part of a comprehensive analytical stack integrating trend, liquidity, and structural context.

MTF RSI Stacked + AI + Gradient MTF RSI Stacked + AI + Gradient
Quick-start guide & best-practice rules
What the indicator does
Multi-Time-Frame RSI in one pane
• 10 time-frames (1 m → 1 M) are stacked 100 points apart (0, 100, 200 … 900).
• Each RSI is plotted with a smooth red-yellow-green gradient:
– Red = RSI below 30 (oversold)
– Yellow = RSI near 50
– Green = RSI above 70 (overbought)
• Grey 30-70 bands are drawn for every TF so you can see extremities at a glance.
Built-in AI (KNN) signal
• On every close of the chosen AI-time-frame the script:
– Takes the last 14-period RSI + normalised ATR as “features”
– Compares them to the last N bars (default 1 000)
– Votes of the k = 5 closest neighbours → BUY / SELL / NEUTRAL
• Confidence % is shown in the badge (top-right).
• A thick vertical line (green/red) is printed once when the signal flips.
How to read it
• Gradient colour tells you instantly which TFs are overbought/obove sold.
• When all or most gradients are green → broad momentum up; look for shorts only on lower-TF pullbacks.
• When most are red → broad momentum down; favour longs only on lower-TF bounces.
• Use the AI signal as a confluence filter, not a stand-alone entry:
– If AI = BUY and 3+ higher-TF RSIs just crossed > 50 → consider long.
– If AI = SELL and 3+ higher-TF RSIs just crossed < 50 → consider short.
• Divergences: price makes a higher high but 1 h/4 h RSI (gradient) makes a lower high → possible reversal.
Settings you can tweak
AI timeframe – leave empty = same as chart, or pick a higher TF (e.g. “15” or “60”) to slow the signal down.
Training bars – 500-2 000 is the sweet spot; bigger = slower but more stable.
K neighbours – 3-7; lower = more signals, higher = smoother.
RSI length – 14 is standard; 9 gives earlier turns, 21 gives fewer false swings.
Practical trading workflow
Open the symbol on your execution TF (e.g. 5 m).
Set AI timeframe to 3-5× execution TF (e.g. 15 m or 30 m) so the signal survives market noise.
Wait for AI signal to align with gradient extremes on at least one higher TF.
Enter on the first gradient reversal inside the 30-70 band on the execution TF.
Place stop beyond the swing that caused the gradient flip; target next opposing 70/30 level on the same TF or trail with structure.
Colour cheat-sheet
Bright green → RSI ≥ 70 (overbought)
Bright red → RSI ≤ 30 (oversold)
Muted colours → RSI near 50 (neutral, momentum pause)
That’s it—one pane, ten time-frames, colour-coded extremes and an AI confluence layer.
Keep the chart clean, use price action for precise entries, and let the gradient tell you when the wind is at your back.
