Logic Flow Signals & Backtest [bercutiatia]To understand the advanced logic of the tool, it is essential that you carefully read each topic and check the visual examples in this presentation.
--
Who is the Logic Flow Signals & Backtest tool recommended for?
Ideal for traders looking to increase the reliability and level of their operations. Recommended for those who want to create rigorous confluences, validate strategies with backtesting, and transform emotional management into systematic and measurable processes.
How can the Logic Flow Signals & Backtest tool help me?
High-confidence signals! You combine TradingView indicators and create a single robust signal, eliminating the frustration of having to spend hours in front of the chart and still clicking at the wrong time. This ensures that your entry is validated by logic, not emotional impulse.
--
Logic Flow Signals & Backtest is a versatile and powerful tool designed to test and validate your trading ideas with indicators from the TradingView community.
Extreme flexibility: Allows you to combine indicators available on TradingView (EMAs, RSI, MACD, SMC, etc.) to create custom entry and exit logics.
Sequential Logic: Goes far beyond simple crossovers. You can define rules where signal A must occur before signal B — and, if desired, before signal C or D — to validate an entry. Add time, order, and context filters, creating truly intelligent sequential logic that generates a single final alert only when all conditions align.
With Stages (Stage 1, Stage 2, etc.), your entries follow the exact sequence you define. And the best part: you no longer need to spend hours in front of the chart waiting for confluences. Simply set up your stages once, create an alert in TradingView, and the system will automatically notify you when the ideal combination of signals occurs.
Sequence Invalidation: Offers the option to define conditions that, if they occur, immediately cancel an ongoing entry sequence, helping to avoid entries in unfavorable scenarios.
Explaining the first image example (chart below):
LONG INDICATOR 1 (Stage 1): The market confirms a change in character (CHoCH Bullish). The system enters an alert state awaiting the confluence of the next indicators.
LONG INDICATOR 2 and 3 (Stage 2): Entry is only released when the SMA17 crosses above the SMA72 (indicator 2), but with one condition: The SMA72 must be ABOVE the SMA305 (indicator 3); Without this alignment of indicator 3, the signal of indicator 2 does not occur.
LONG INDICATOR 4 (Invalidation Rule): If at any point in the sequence the SMA72 crosses below the SMA305, the setup is immediately canceled and no entry signal is generated. The sequence restarts with indicator 1.
EXIT LONG (Hybrid Exit TP + SIGNAL): The trade seeks a TP target of 1000 ticks, but has a technical "Trailing Stop": if the trend reverses (Exit Long Indicator 1 = SMA72 crosses below the SMA305) before the target, the position is closed to protect capital.
SHORT INDICATOR 1 (Stage 1): Identification of weakness in the market with a Bearish CHoCH.
SHORT INDICATOR 2 and 3 (Stage 2): Entry is only released when the SMA17 crosses below the SMA72 (indicator 2), but with a strict condition: The SMA72 must be BELOW the SMA305 (indicator 3); Without this STATE of indicator 3, the signal from indicator 2 does not occur.
SHORT INDICATOR 4 (Invalidation Rule): If at any point in the sequence the SMA72 crosses above the SMA305, the setup is immediately canceled and no entry signal is generated. The sequence starts again with indicator 1.
EXIT SHORT (Hybrid Exit TP + SIGNAL): The trade seeks a target of 1000 ticks, but has a technical "Trailing Stop": if the downtrend reverses (Exit Short Indicator 1 = SMA72 crosses above the SMA305) before the target, the position is closed to protect capital.
In this strategy, we use the external indicators: Multiple MTF MA and Smart Money Concepts (Advanced)
--
Stage Duration: In STAGE DURATION , you control the maximum time (in candles) allowed for each transition between stages to occur. If the time limit expires before the next stage is reached, the sequence is reset. Keep it at 0 to disable the time limit.
The "Stage Duration" function is available in four separate blocks on the settings panel:
- LONG - STAGE DURATION: Controls the time limit (in candles) between Long entry stages (for example from Stage 1 to Stage 2).
- LONG EXIT - STAGE DURATION: Controls the time limit between Long exit stages.
- SHORT - STAGE DURATION: Controls the time limit between Short entry stages.
- SHORT EXIT - STAGE DURATION: Controls the time limit between Short exit stages.
Explaining the second image example (chart below):
Stage 1 (INDICATOR 1): New Fair Value Gap (FVG) Bullish Confirmed.
- Meaning: The move starts with a bullish FVG (Fair Value Gap), indicating a confirmed imbalance where buyers were much more aggressive than sellers.
Stage 2 (INDICATOR 2): EMA10 crossing above the EMA50.
- Meaning: Immediately after the FVG trigger, the fast moving average (10 periods) crosses the intermediate moving average (50 periods). This confirms that the initial FVG impulse was not an isolated event but the beginning of a short-term trend.
Stage 3: In this final stage, we require two simultaneous confirmations to validate the entry:
- INDICATOR 3: The EMA10 crosses above the EMA100, indicating that the movement has enough strength to break through larger barriers.
- INDICATOR 4: The RSI must be above its own moving average (SMA14). This ensures the asset is gaining momentum at the exact moment the averages are broken, avoiding entries in "tired" markets.
Stage Duration: The most important feature of this setup is the restricted time window.
- Rule: From Stage 1 to 2, and from Stage 2 to 3, the maximum interval to accept confluences is only 3 candles.
- Why this is vital? If the market took 20 candles to align these conditions, it would indicate weakness or indecision. By demanding that everything happens within a maximum of 3 candles per step, the setup filters only the moves where buying pressure is urgent and aggressive, increasing the probability of an explosive move in favor of the trade.
Asymmetric Risk Management: To complement a high-probability and high-pressure setup, we use aggressive risk management:
- Stop Loss (Technical/Short): 200 Ticks. If the buying pressure fails quickly, we exit early with a small loss.
- Take Profit (Long Target): 1000 Ticks. We aim to ride the impulse "leg" that the setup identified.
- Risk/Reward: 5:1. This means a single winning trade covers five losing trades, making the strategy mathematically viable in the long term.
In this strategy, we use the external indicators: Multiple MTF MA , Smart Money Concepts (Advanced) and Relative Strength Index (RSI) .
--
Multiple Operating Modes
It is not limited to sequences. It can operate by confluence (where all signals must be valid at the same time), by single trigger (only one signal is required), or by "OR" logic (any one of the defined signals).
- If you use only Stage 1 in more than one indicator session, the entry will only occur if all enabled conditions are true simultaneously.
- Any condition defined as OR can trigger the entry by itself.
- If only one condition block is enabled, the single indicator will function as a simple signal.
Multiple and Simultaneous Exits
It allows for the configuration of exits by both indicators and TP/SL targets. The strategy will close the trade as soon as any of these conditions are met first (indicator signal, profit target, or loss limit
Integrated Risk Management
It includes Stop Loss and Take Profit exits by percentage and ticks, which are easy to configure and essential for risk management. The strategy calculates the exact TP and SL prices based on your entry price and monitors the market on every tick.
Explaining the Third Image Example (Chart Below)
The move was validated by a 4-step logical sequence (Stage 1) and managed by a hybrid exit system.
Short Indicator 1, 2, and 3: The price (Close) crossed below the SMA200, SMA72, and SMA17 averages simultaneously.
- What this means: When a single candle has the strength to break below the short-term (17), mid-term (72), and long-term (200) averages, it indicates a high probability for the price to seek lower levels.
To reinforce Indicators 1 through 3, we added an extra layer of confirmation.
Short Indicator 4: The Positive Volume Index (PVI) needed to be below its own long-term average (EMA300).
- Why this is important: PVI below the average confirms that selling volume is dominant, validating that the break of the averages was not just noise.
Triple Exit Management (Maximum Security)
The great advantage of this tool is the ability to manage risk dynamically. In this trade, we configured three simultaneous exit conditions, where the first one to be met closes the position:
1. Financial Target (TP): A fixed Take Profit of 15%.
2. Exit Short Indicator 1 (Technical Exit 1): If the average (SMA72) crosses above the average (SMA200), the trade is closed.
3. Exit Short Indicator 2 (Technical Exit 2): If the PVI crosses above the EMA300, indicating an entry of buying strength, the trade is closed.
"OR" Logic: The tool monitors these conditions in real-time. Whichever occurs first triggers the exit, ensuring you lock in profit (TP) or protect your capital at the first sign from the indicators.
In this strategy, we use the external indicators: Multiple MTF MA and Positive Volume Index .
--
Reversal Mode (Stop and Reverse)
The Reversal Mode (Stop and Reverse) allows a new signal in the opposite direction (e.g., a SELL signal) to automatically close an existing position (e.g., BUY) and open a new one (sell). This "stop and reverse" function can be enabled or disabled in the settings, giving you full control over whether the strategy should only exit (awaiting a new signal) or immediately reverse the position.
Explaining the Fourth Image Example (Chart Below)
In this example, we demonstrate a setup focused on capturing every market "flip," keeping the trader positioned 100% of the time ("Always-in"), a technique widely used in automation.
- Long Entry: Occurs immediately upon confirming a bullish change of character (New CHoCH Bullish).
- Short Entry: Occurs immediately upon confirming a bearish change of character (New CHoCH Bearish).
- Exit (The Differentiator): We are not using fixed TP or SL here. The exit is triggered by Automatic Reversal.
The Power of "Exit by Opposite Signal"
Notice the labels on the chart: "Close Short" followed immediately by a "Long." This happens because the Allow Reversal function is enabled in the tool's settings.
When the market generates a buy signal, the tool understands that the sell thesis has been invalidated. It simultaneously sends an order to close the Short position and open a new Long position.
When to use this exit rule?
- Capturing Long Trends / Directional Movements: Ideal for volatile assets where you want to ride the trend until the market structure effectively changes.
- Operational Simplification: Eliminates the need to guess profit targets and acts as a loss limiter when the price moves against your position. The market dictates when to enter and when to exit.
Hybrid Flexibility:
The strongest point of Logic Flow is that you don't have to choose just one method. Reversal can be used in two ways:
1. Individually (as in the image): Reversal is the only form of exit. You stay in the move until the opposite signal.
2. Combined (Hybrid): You can enable Reversal and configure a safety Stop Loss + technical Take Profit (Exit Long/Short Indicator).
- Example: If the price hits your TP/SL first, you exit. If the market turns before the TP, the Reversal takes you out of the trade and generates a new trend alert.
In this strategy, we use the external indicators: Smart Money Concepts .
--
Backtesting: Far beyond creating logic and generating signals, Logic Flow Signals stands out due to its Integrated Backtest.
Backtesting serves as a reality check for the trader. It takes the strategy out of the realm of "imagination" and puts it to the test against historical data.
Here are the 4 main practical uses:
1. Verifying Feasibility (Proof of Concept): The most obvious use is to answer: "Does this idea make money?". Many strategies look visually perfect on the chart, but when you run the backtest, you discover that brokerage fees or frequent "stops" consume all the profit.
2. Knowing the "Worst-Case Scenario" (Drawdown): Maximum Drawdown: It shows you what the largest accumulated drop the strategy has ever experienced was. By identifying a Drawdown that exceeds the desired risk tolerance, the backtest allows for parameter optimization in search of a more efficient balance between risk and return.
3. Fine-Tuning (Optimization): It allows you to make changes such as: Increasing the profit target, changing the stop, removing an indicator, changing the chart timeframe, among other actions. You can test various variations instantly to find the most efficient configuration.
4. Expectation Management and Discipline: Backtesting does not eliminate fear nor guarantee that the future will repeat the past, but it serves as a reference map.
The Real Role: Aligning expectation with reality.
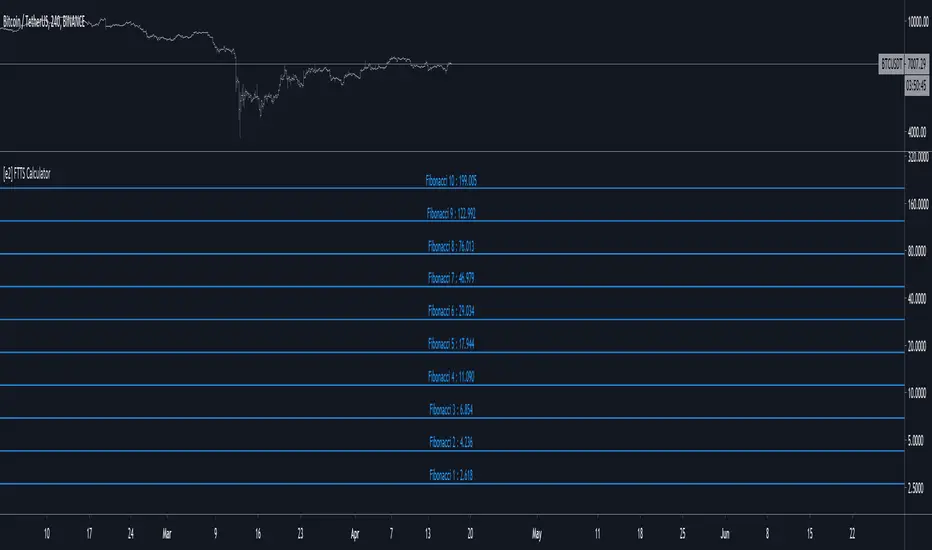
In the image below, you can check out how a backtest result is generated:
To understand the backtest results shown above, check the chart and the detailed operational logic below:
This operational example seeks to identify altcoins that are demonstrating an explosive decorrelation relative to Bitcoin. The logic is: we want to buy only the assets that are outperforming the market leader, precisely at the moment when speculative money (Open Interest) heavily enters the market.
For the buy signal (Long) to be triggered, three conditions must be simultaneously true (Stage 1):
Long Indicator 1 (Altcoin Strength): The asset's RSI must be above the 70 level (Overbought), indicating extremely strong bullish momentum.
Long Indicator 2 (Bitcoin Weakness): Bitcoin's RSI must be below the 50 level. This confirms that the Altcoin's rally is genuine and independent.
Long Indicator 3 (Money Flow): The Open Interest (open contracts) must be above the Extreme level of the OI DELTA indicator. This validates that new money is aggressively entering the asset to sustain the rally.
Risk Management: In this example, we configured an aggressive target to capture the altcoin volatility:
- Take Profit: 100%
- Stop Loss: 20%
- Risk/Reward: 5:1
In this strategy, we use the external indicators: RSI Crypto Strength (Asset vs BTC) and Open Interest Delta .
--
Configuring an Indicator Block
Each block (BUY INDICATOR 1, BUY INDICATOR 2, ...) allows you to define a complete condition.
- Enable (Activate): Simply turns this indicator block on or off.
- Source A: The first value you want to analyze.
example: The Closing Price (Close), Opening Price (Open), or another TradingView indicator.
- Condition: How 'Source A' will be compared.
example: Crossover/Crossunder, Greater Than, Less Than, Cross Up.
- Comparison Type: The option that defines whether you will compare 'Source A' with a fixed number or with another indicator.
- Fixed Value: Used if you selected "Fixed Value".
example: For an RSI greater than 70 condition, Source A would be the RSI, the Condition would be Greater Than, and the Fixed Value would be 70.
- Source B: Used if you selected "Source B".
example: For a condition where the EMA10 crosses above the EMA200, Source A would be the EMA10, the Condition would be 'Cross Up', and Source B would be the EMA200.
--
Configurable Alert Signals
Configurable Alert Signals: The tool allows for the creation of fully customized alerts for different types of events, such as entries, signal-based exits, take profit, and stop loss. These alerts can be used for both strategy automation and manual, real-time notifications.
The message field is highly flexible: it accepts dynamic placeholders, JSON structure, UUID identifiers, or any custom text, allowing integration with other external tools and systems via webhook.
Configuring Your Messages:
- LONG/SHORT - ALERTS: Defines the message for new entries.
- LONG/SHORT INDICATOR EXIT - ALERTS: Defines the message for signal-based exits (e.g., moving average cross).
- REVERSAL - ALERTS: Defines the message for when a position is closed by an opposite signal (stop-and-reverse).
- LONG/SHORT TP/SL EXIT - ALERTS: Defines the message for exits triggered by take profit (TP) or stop loss (SL), via percentage or ticks.
A Single Alert to Control Everything
You don't need to create separate alerts for "Buy," "Sell," or "Exits." On a single screen, you can create strategies by defining entries, signal-based exits, profit targets, or stop limits.
Alert Times (Operating Window)
In the Alert Times section, you can define a specific time (and time zone) for the strategy to generate entry or exit signals.
--
To create your alert, simply follow these steps:
- Condition: Select the script name: "Logic Flow Signals & Backtest".
- Message: Insert only the placeholder: {{strategy.order.alert_message}}
Once this single alert is active, it will "listen" to all orders executed by the strategy.
This means you can have your Long-Term, Short-Term, Signal-Based Exits, and TP/SL strategies active simultaneously. When any of these events are plotted on the chart, the script will send the customized message (which you wrote in the fields) to your single alert.
--
Advanced period filters: Allow you to test the strategy in specific date ranges, over the last X days, or over the last X bars, facilitating performance analysis in different market environments.
--
Status Panel: Displays a clear summary of all active rules and settings directly on the chart, facilitating the visualization and confirmation of the running logic.
Additionally, it has a settings box where you can activate or deactivate the panel, choose its position (such as at the bottom or side), and adjust its size.
--
The Thumbnail strategy uses the following external indicators: Multiple MTF MA and Breakout Finder .
--
Final Considerations:
The Logic Flow Signals & Backtest tool is a versatile and powerful system, designed to test and apply trading ideas based on multiple indicators from TradingView.
Its differential is being a customization environment: the script does not have integrated graphical indicators, as the objective is precisely to allow the user to combine and integrate multiple existing indicators in the TradingView community to build unique entry and exit logics.
It offers flexibility and precision, but the true value emerges when the trader integrates the tool into a consistent trading plan, with efficient risk management (Stop Loss and Take Profit), leverage control, and a professional mindset.
Important: Risk of Repainting (Unstable Data): Avoid indicators that 'repaint' (those that change their values in past bars after the closing of new candles). The backtest will be invalidated, and the actual performance of the strategy will fail.
Legal Warning and Didactic Purpose:
It is fundamental to understand that all visual examples, charts, and texts contained in this description do not constitute financial advice, buy or sell recommendations, nor a promise of easy or guaranteed gains.
This is an advanced support tool, not an automatic profit system. Use the integrated backtesting to evaluate the historical behavior of strategies before real execution and understand how different market conditions impact your results. The sole purpose of this material is to demonstrate the logical and execution capacity of the script, serving as a didactic guide for you to test and validate your own ideas.
Conclusion and Risk Warning:
Success in financial markets comes not only from a set of charting indicators, but from the trader's understanding, practice, and discipline. Our objective is to provide a robust, customizable, and intuitive solution, created to enhance your technical analysis and broaden your strategic vision, without replacing critical thinking and conscious decision-making.
Finally, remember: past results do not guarantee future performance. The real differentiator lies in continuous learning, testing, and evolution.
Sequence

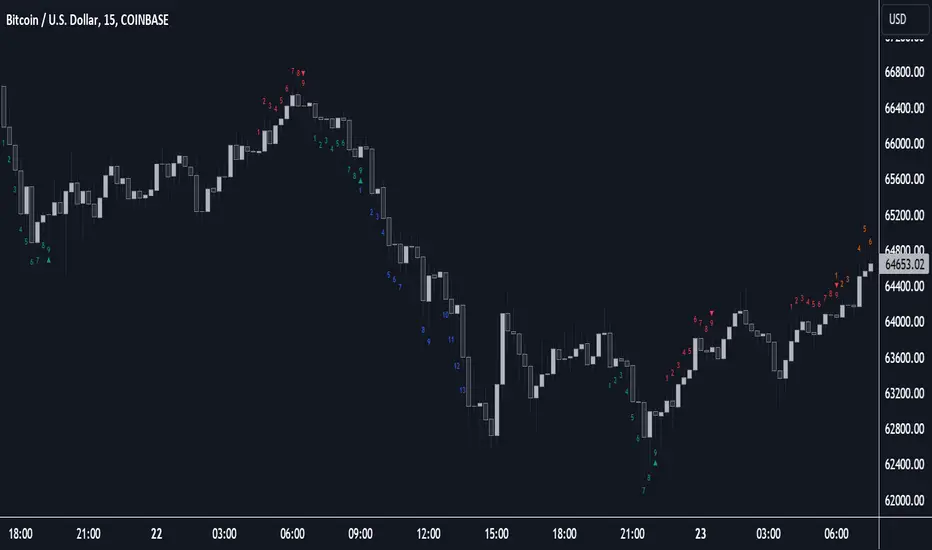
TDT Candle CounterThis indicator allows you to count candles inside a custom date range and display labels directly on the chart.
It supports three different counting modes:
🔢 Modes
Every Candle → Marks every bar sequentially (1, 2, 3, 4, …).
Alternative Sequence → Marks bars that match the sequence 1, 5, 9, 17, 25, 37, ….
Special Sequence (default) → Marks bars that match the sequence 1, 3, 7, 13, 21, 31, ….
Each mode has its own color so you can quickly distinguish which cycle is active.
⚙️ Features
Custom start and end date for the counting period.
Option to highlight the active period with a background color.
Labels are positioned above or below candles depending on the initial direction.
Alerts when:
Counting starts
Counting ends
🎯 Use Cases
Visualize candle sequences for cycle analysis.
Track market structure with custom numerical references.
Combine with other tools to study periodic behavior.
Inspired by Time Dilation Theory (TDT)
This counting approach is inspired by the Time Dilation Theory (TDT) methodology created by ICT Morpheus. According to TDT, markets unfold in cycles of 1, 3, 7, 13, 21… etc., reflecting natural rhythms of expansion, contraction, and distortion—an idea grounded in fractal time behavior across multi-timeframe analysis
Incorporating TDT principles into this tool helps visualize and align potential turning points and momentum shifts across different timeframes.

Swing Breakout Sequence [LuxAlgo]The Swing Breakout Sequence tool enables traders to identify a directional price action scalping sequence comprising two unsuccessful breakouts in the same direction, with the expectation of a third.
🔶 USAGE
This sequence looks for pressure on one side of a swing zone.
The market tried to break out of the zone twice but failed. This led to a pullback into the zone after each attempt. Once a reversal inside the zone is identified, the sequence is complete. It is expected that the market will move from the final reversal within the zone to the final breakout attempt outside the zone.
The sequence of price action is as follows:
Point 1: Breakout attempt out of the swing zone
Point 2: Pullback into the zone
Point 3: Breakout attempt out of Point 1
Point 4: Pullback into the zone, tapping into Point 2 liquidity
Point 5: Reversal structure with Point 4 in the form of a double top or double bottom
This sequence assumes traders will be caught off-guard when they try to capitalize on the initial breakout at Point 1, which is likely to result in a loss. If the breakout at Point 3 fails, all traders will be caught out and switch positions.
If there is enough pressure in the swing zone to cause a reversal at Point 5, the trapped traders could be the start of the next breakout attempt.
🔹 Sequence Detection
Traders can define sequence behavior and adjust detection with three parameters from the Settings panel.
Disabling Points 4 and 5 will detect the most uncompleted sequences.
🔹 Showing/Hiding Elements
Traders can change the look of sequences by showing or hiding their parts using the Style settings.
🔶 SETTINGS
Swing Length: Number of candles to confirm a swing high or swing low. A higher number detects larger swings.
Internal Length: Number of candles to confirm a internal high or internal low. A lower number detects smaller swings. It must be the same size or smaller than the swing length.
🔹 Detection
Point 4 Beyond Point 2: It only detects sequences where Point 4 is beyond Point 2.
Show Point 5: Enable/disable Point 5 detection.
Require Equal H/L at Point 5: Enable/Disable double top/bottom detection at Point 5 within a given threshold. A bigger value detects more sequences.
🔹 Style
Show Sequence Path: Enable/disable a line between sequence points.
Show Boxes: Enable/disable colored boxes for each sequence.
Show Lines: Enable/disable horizontal lines from each point of the sequence.
Default Color: Define the color or enable/disable auto color.

FiboSequFiboSequ: Fibonacci Sequence Marking
Leonardo Fibonacci was an Italian mathematician who lived in the 12th century. His real name was Leonardo of Pisa, but he is commonly known as "Fibonacci." Fibonacci is famous for introducing the Hindu-Arabic numeral system to the Western world. This system is the basis of the modern decimal number system we use today.
Fibonacci Sequence
The Fibonacci sequence is a series of numbers that frequently appears in mathematics and nature. The first two numbers in the sequence are 0 and 1, and each subsequent number is the sum of the two preceding numbers.
The sequence is as follows:
0, 1, 1, 2, 3, 5, 8, 13, 21, 34, 55, 89, 144, 233, 377, 610, 987, 1597, 2584, ...
Fibonacci Time Zones:
Fibonacci time zones are used to identify potential turning points in the market at specific time intervals. These time zones correspond to the Fibonacci sequence in terms of consecutive days or weeks.
The Fibonacci sequence has a wide range of applications in both mathematics and nature. Leonardo Fibonacci's work has had a significant impact on the development of modern mathematics and numeral systems. In financial markets, the Fibonacci sequence and ratios are frequently used by technical analysts to predict and analyze market movements.
Description:
Overview:
The FiboSequ indicator marks significant days on a price chart based on the Fibonacci sequence. This can help traders identify potential turning points or areas of interest in the market. The Fibonacci sequence is a series of numbers where each number is the sum of the two preceding ones, often found in nature and financial markets.
Fibonacci Sequence:
The sequence used in this indicator includes: 1, 3, 5, 8, 13, 21, 34, 55, 89, 144, 233, 377, 610, 987, 1597, and 2584.
These numbers represent the days to be marked on the chart, highlighting possible significant market movements.
How It Works:
User Input:
Users can input the starting date (Year, Month, and Day) from which the Fibonacci sequence will begin to be calculated.
This allows flexibility and customization based on the trader's analysis needs.
Calculation:
The starting date is converted into a timestamp in seconds.
For each bar on the chart, the number of days since the starting date is calculated.
The indicator checks if the current day matches any of the Fibonacci sequence days, the previous day, or the next day.
In this indicator, Fibonacci numbers can be displayed on the chart as plus and minus 2 days. For example, for the 145th day, signals start to appear as 143,144 and 145. This is due to dates that sometimes coincide with weekends and public holidays.
Marking the Chart:
When a match is found, a label is placed above the bar indicating the day number from the Fibonacci sequence.
These labels are colored blue with white text for easy visibility.
Usage:
This indicator can be used on any timeframe and market to help identify potential areas where price might react.
It is especially useful for those who employ Fibonacci analysis in their trading strategy.
Example:
If the starting date is January 1, 2020, the indicator will mark significant Fibonacci days (e.g., 1, 3, 5, 8 days, etc.) on the chart from this date onward.
Community Guidelines Compliance:
This indicator adheres to TradingView's Pine Script community guidelines.
It provides customizable user inputs and does not violate any terms of use.
By using the FiboSequ indicator, traders can enhance their technical analysis by incorporating time-based Fibonacci levels, potentially leading to better market timing and decision-making.
Frequently Asked Questions (FAQ)
Q: What is the FiboSequ indicator?
A: The FiboSequ indicator is a technical analysis tool that marks significant days on a price chart based on the Fibonacci sequence. This indicator helps traders identify potential turning points or areas of interest in the market.
Q: What is the Fibonacci sequence and why is it important?
A: The Fibonacci sequence is a series of numbers where each number is the sum of the two preceding ones. The first two numbers are 0 and 1. This sequence frequently appears in nature and financial markets and is used in technical analysis to identify important support and resistance levels.
Q: How do the Fibonacci time zones in the indicator work?
A: Fibonacci time zones are used to identify potential market turning points at specific time intervals. The indicator calculates days based on the Fibonacci sequence (e.g., 1, 3, 5, 8 days, etc.) from the starting date and marks them on the chart.
Q: How can users set the starting date?
A: Users can input the starting date by specifying the year, month, and day. This sets the date from which the indicator begins its calculations, providing flexibility for user analysis.
Q: What do the labels in the indicator represent?
A: The labels mark specific days in the Fibonacci sequence. For example, 1st day, 3rd day, 5th day, etc. These labels are displayed in blue with white text for easy visibility.
Q: Which timeframes can I use the FiboSequ indicator on?
A: The FiboSequ indicator can be used on any timeframe. This includes daily, weekly, or monthly charts, as well as shorter timeframes.
Q: Which markets can the FiboSequ indicator be used in?
A: The FiboSequ indicator can be used in various financial markets, including stocks, forex, cryptocurrencies, commodities, and more.
Q: How can I achieve better market timing with the FiboSequ indicator?
A: The FiboSequ indicator helps identify potential market turning points using time-based Fibonacci levels. This can lead to better market timing and more informed trading decisions for traders.
-Please feel free to write your valuable comments and opinions. I attach importance to your valuable opinions so that I can improve myself.

Sequencer [LuxAlgo]The Sequencer indicator is a tool that is able to highlight sequences of prices based on their relative position to past prices, which allows a high degree of customization from the user.
Two phases are included in this script, a "Preparation" phase and a "Lead-Up" phase, each with a customizable amount of steps, as well as other characteristics.
Users can also highlight the last step leading to each phase completion with a level, this level can eventually be used as a key price point.
🔶 USAGE
The script highlights two phases, each being based on a sequence of events requiring prices to be higher/lower than prices various bars ago.
The completion of the preparation phase will lead to the evaluation of the lead-up phase, however, it isn't uncommon to see a reversal occurring after the completion of a preparation phase. In the script, bullish preparations are highlighted in green, while bearish preparations are highlighted in red.
Completion of a "Lead-Up" phase is indicative of a potential reversal, with a bullish reversal for the completion of a bullish lead-up (in blue), and a bearish reversal for the completion of a bearish lead-up (in orange).
Using a higher length for the preparation/lead-up phases can allow the detection of longer-term reversals.
Users wishing to display levels based on specific phases completion can do so from the settings in the "Preparation/Lead-Up Completion Levels" settings group.
The "Show Last" settings determine the amount of respective levels to display on the chart.
🔶 PREPARATION PHASE
The "Preparation" phase precedes the "Lead-Up" phase. The completion of this phase requires N successive prices to be lower than the closing price P bars ago for a bullish phase, and for prices to be higher than the closing price P bars ago for a bearish phase, where N is the user set "Preparation Phase Length" and P the user set "Comparison Period".
🔹 Refined Preparations
Sequences of the preparation phase can either be "Standard" or "Refined". Unlike the standard preparation previously described a refined preparation requires the low prices from the user-specified steps in "Refined Preparation Steps" to be above the low price of the last step for a bullish preparation phase, and for the high prices specified in the refined preparation steps to be below the high price of the last step for a bearish preparation phase.
🔶 LEAD-UP PHASE
The "Lead-Up" phase is initiated by the completion of the "Preparation" phase.
Completion of this phase requires the price to be lower than the low price P bars ago N times for a bullish phase, and for prices to be higher than the high price P bars ago N times for a bearish phase, where N is the user set "Lead-Up Phase Length" and P the user set "Comparison Period".
Unlike with the "Preparation" phase these conditions don't need to be successive for them to be valid and can occur at any time.
🔹 Lead-Up Cancellation
Incomplete "Lead-Up" phases can be canceled and removed from the chart once a preparation of the opposite sentiment is completed, avoiding lead-ups to be evaluated after completion of complete preparations.
This can be disabled by toggling off "Apply Cancellation".
🔹 Lead-Up Suspension
Like with refined preparations, we can require specific steps from the lead-up phase to be higher/lower than the price on the last step. This can be particularly important since we do not require lead-up steps to be successive.
For a bullish lead-up, the low of the last step must be lower than the minimum closing prices of the user-specified steps for it to be valid, while for a bearish lead-up, the high of the last step must be higher than the maximum closing prices of the user-specified steps for it to be valid.
This effectively allows for eliminating lead-up phases getting completed on opposite trends.
🔶 SETTINGS
🔹 Preparation Phase
Preparation Phase Length: Length of the "Preparation" phase.
Comparison Period: Offset used to compare current prices to past ones.
Preparation Type: Type of preparation to evaluate, options include "Standard" or "Refined"
Refined Preparations Steps: Steps to evaluate when preparation type is "Refined"
🔹 Lead-Up Phase
Lead-Up Phase Length: Length of the "Lead-Up" phase.
Comparison Period: Offset used to compare current prices to past ones.
Suspension: Applies suspension rule to evaluate lead-up completion.
Suspension Steps: Specifies the steps evaluated to determine if the lead-up referral is respected. Multiple steps are supported and should be comma-separated.
Apply Cancellation: Cancellation will remove any incomplete lead-up upon the completion of a new preparation phase of the opposite sentiment.
🔹 Levels
Bullish Preparations Levels: When enabled display price levels from completed bullish preparations.
Show Last: Number of most recent bullish preparations levels to display.
Bearish Preparations Levels: When enabled display price levels from completed bearish preparations.
Show Last: Number of most recent bearish preparations levels to display.
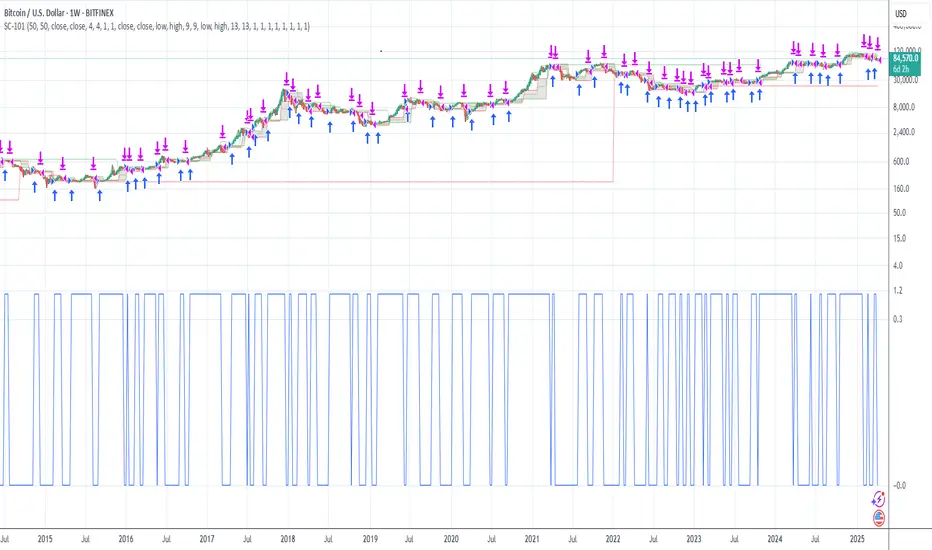
Trend Direction Sequence | Auto-Multi-TimeframeThe main benefit of this indicator is the ability to see multiple higher timeframes at ones to get a better overview of signals that could mark possible trend reversals with more weight than those on the selected timeframe. Since the higher timeframes are calculated automatically, the user needs to set a Period Multiplier that multiplies the selected timeframe several times to determine the higher timeframes. Equal periods are filtered out. And the current highest timeframe is capped at 1 year by TradingView.
It is possible to alter the sequence Count Limit and the underlying Wavelength. The Wavelength defines the distance between the starting and ending candle. This builds the minimum condition to find a trend. A longer Wavelength means that the distortions between the start and end candle can be bigger, so it can become easier to find a trending sequence. But be careful not to set the length too high as this could mean that the resulting sequence does not really represent a trend anymore. The Count Limit defines the completion of a trending sequence. A higher number makes it more difficult to find a completed sequence, but also makes the result more reliable. If the Wavelength is changed, the Count Limit should be adjusted accordingly.
There is also a qualifier for the completion of a sequence. A completed sequence only will be labeled on the chart, if it is proved that the lowest low/highest high of the last two candlesticks of a period is lower/higher than that of the previous two candlesticks. It does not require the trend to be continuous on the last candlestick. On the contrary, a trend shift may already have begun.
By default, the labeling of completed sequences will appear on the highs and lows of the specific periods. Because the higher periods will take time and several candlesticks to appear, the labels will be redrawn accordingly. As an option it is possible to disable the Count Limit for completed sequences so that the labels will be fluently redrawn until the corresponding sequences are interrupted by trend breaks. Only activate this option, if it can serve a plausible strategy.
The count status of all sequences in the specific timeframe periods is listed in a table. Also the results of the trends in higher timeframes are accumulated and combined into an overall trend. Positive trends are counted as positive, negative in the opposite case. To see the resulting Trend Shift Signals, the user can set a filter under 100% so that not all of them will be filtered out and therefore labeled on the chart (this signals cannot be redrawn). An “External Indicator Analysis Overlay” can be used to analyze the profitability with the provided Trend Shift Signal (TSS) which switches from 0 to 1, if the trend becomes positive or from 0 to -1, if the trend becomes negative.

MarkovChainLibrary "MarkovChain"
Generic Markov Chain type functions.
---
A Markov chain or Markov process is a stochastic model describing a sequence of possible events in which the
probability of each event depends only on the state attained in the previous event.
---
reference:
Understanding Markov Chains, Examples and Applications. Second Edition. Book by Nicolas Privault.
en.wikipedia.org
www.geeksforgeeks.org
towardsdatascience.com
github.com
stats.stackexchange.com
timeseriesreasoning.com
www.ris-ai.com
github.com
gist.github.com
github.com
gist.github.com
writings.stephenwolfram.com
kevingal.com
towardsdatascience.com
spedygiorgio.github.io
github.com
www.projectrhea.org
method to_string(this)
Translate a Markov Chain object to a string format.
Namespace types: MC
Parameters:
this (MC) : `MC` . Markov Chain object.
Returns: string
method to_table(this, position, text_color, text_size)
Namespace types: MC
Parameters:
this (MC)
position (string)
text_color (color)
text_size (string)
method create_transition_matrix(this)
Namespace types: MC
Parameters:
this (MC)
method generate_transition_matrix(this)
Namespace types: MC
Parameters:
this (MC)
new_chain(states, name)
Parameters:
states (state )
name (string)
from_data(data, name)
Parameters:
data (string )
name (string)
method probability_at_step(this, target_step)
Namespace types: MC
Parameters:
this (MC)
target_step (int)
method state_at_step(this, start_state, target_state, target_step)
Namespace types: MC
Parameters:
this (MC)
start_state (int)
target_state (int)
target_step (int)
method forward(this, obs)
Namespace types: HMC
Parameters:
this (HMC)
obs (int )
method backward(this, obs)
Namespace types: HMC
Parameters:
this (HMC)
obs (int )
method viterbi(this, observations)
Namespace types: HMC
Parameters:
this (HMC)
observations (int )
method baumwelch(this, observations)
Namespace types: HMC
Parameters:
this (HMC)
observations (int )
Node
Target node.
Fields:
index (series int) : . Key index of the node.
probability (series float) : . Probability rate of activation.
state
State reference.
Fields:
name (series string) : . Name of the state.
index (series int) : . Key index of the state.
target_nodes (Node ) : . List of index references and probabilities to target states.
MC
Markov Chain reference object.
Fields:
name (series string) : . Name of the chain.
states (state ) : . List of state nodes and its name, index, targets and transition probabilities.
size (series int) : . Number of unique states
transitions (matrix) : . Transition matrix
HMC
Hidden Markov Chain reference object.
Fields:
name (series string) : . Name of thehidden chain.
states_hidden (state ) : . List of state nodes and its name, index, targets and transition probabilities.
states_obs (state ) : . List of state nodes and its name, index, targets and transition probabilities.
transitions (matrix) : . Transition matrix
emissions (matrix) : . Emission matrix
initial_distribution (float )

FunctionProbabilityViterbiLibrary "FunctionProbabilityViterbi"
The Viterbi Algorithm calculates the most likely sequence of hidden states *(called Viterbi path)*
that results in a sequence of observed events.
viterbi(observations, transitions, emissions, initial_distribution)
Calculate most probable path in a Markov model.
Parameters:
observations (int ) : array . Observation states data.
transitions (matrix) : matrix . Transition probability table, (HxH, H:Hidden states).
emissions (matrix) : matrix . Emission probability table, (OxH, O:Observed states).
initial_distribution (float ) : array . Initial probability distribution for the hidden states.
Returns: array. Most probable path.

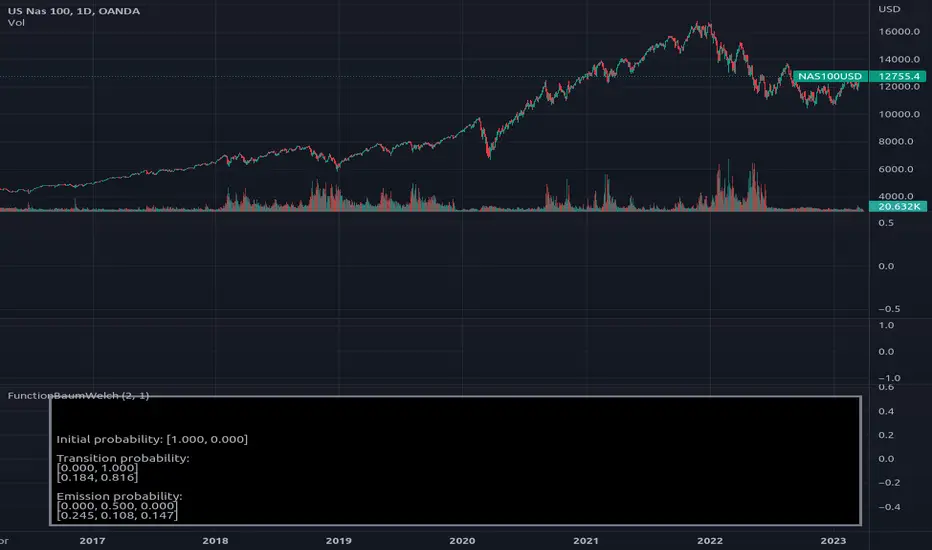
FunctionBaumWelchLibrary "FunctionBaumWelch"
Baum-Welch Algorithm, also known as Forward-Backward Algorithm, uses the well known EM algorithm
to find the maximum likelihood estimate of the parameters of a hidden Markov model given a set of observed
feature vectors.
---
### Function List:
> `forward (array pi, matrix a, matrix b, array obs)`
> `forward (array pi, matrix a, matrix b, array obs, bool scaling)`
> `backward (matrix a, matrix b, array obs)`
> `backward (matrix a, matrix b, array obs, array c)`
> `baumwelch (array observations, int nstates)`
> `baumwelch (array observations, array pi, matrix a, matrix b)`
---
### Reference:
> en.wikipedia.org
> github.com
> en.wikipedia.org
> www.rdocumentation.org
> www.rdocumentation.org
forward(pi, a, b, obs)
Computes forward probabilities for state `X` up to observation at time `k`, is defined as the
probability of observing sequence of observations `e_1 ... e_k` and that the state at time `k` is `X`.
Parameters:
pi (float ) : Initial probabilities.
a (matrix) : Transmissions, hidden transition matrix a or alpha = transition probability matrix of changing
states given a state matrix is size (M x M) where M is number of states.
b (matrix) : Emissions, matrix of observation probabilities b or beta = observation probabilities. Given
state matrix is size (M x O) where M is number of states and O is number of different
possible observations.
obs (int ) : List with actual state observation data.
Returns: - `matrix _alpha`: Forward probabilities. The probabilities are given on a logarithmic scale (natural logarithm). The first
dimension refers to the state and the second dimension to time.
forward(pi, a, b, obs, scaling)
Computes forward probabilities for state `X` up to observation at time `k`, is defined as the
probability of observing sequence of observations `e_1 ... e_k` and that the state at time `k` is `X`.
Parameters:
pi (float ) : Initial probabilities.
a (matrix) : Transmissions, hidden transition matrix a or alpha = transition probability matrix of changing
states given a state matrix is size (M x M) where M is number of states.
b (matrix) : Emissions, matrix of observation probabilities b or beta = observation probabilities. Given
state matrix is size (M x O) where M is number of states and O is number of different
possible observations.
obs (int ) : List with actual state observation data.
scaling (bool) : Normalize `alpha` scale.
Returns: - #### Tuple with:
> - `matrix _alpha`: Forward probabilities. The probabilities are given on a logarithmic scale (natural logarithm). The first
dimension refers to the state and the second dimension to time.
> - `array _c`: Array with normalization scale.
backward(a, b, obs)
Computes backward probabilities for state `X` and observation at time `k`, is defined as the probability of observing the sequence of observations `e_k+1, ... , e_n` under the condition that the state at time `k` is `X`.
Parameters:
a (matrix) : Transmissions, hidden transition matrix a or alpha = transition probability matrix of changing states
given a state matrix is size (M x M) where M is number of states
b (matrix) : Emissions, matrix of observation probabilities b or beta = observation probabilities. given state
matrix is size (M x O) where M is number of states and O is number of different possible observations
obs (int ) : Array with actual state observation data.
Returns: - `matrix _beta`: Backward probabilities. The probabilities are given on a logarithmic scale (natural logarithm). The first dimension refers to the state and the second dimension to time.
backward(a, b, obs, c)
Computes backward probabilities for state `X` and observation at time `k`, is defined as the probability of observing the sequence of observations `e_k+1, ... , e_n` under the condition that the state at time `k` is `X`.
Parameters:
a (matrix) : Transmissions, hidden transition matrix a or alpha = transition probability matrix of changing states
given a state matrix is size (M x M) where M is number of states
b (matrix) : Emissions, matrix of observation probabilities b or beta = observation probabilities. given state
matrix is size (M x O) where M is number of states and O is number of different possible observations
obs (int ) : Array with actual state observation data.
c (float ) : Array with Normalization scaling coefficients.
Returns: - `matrix _beta`: Backward probabilities. The probabilities are given on a logarithmic scale (natural logarithm). The first dimension refers to the state and the second dimension to time.
baumwelch(observations, nstates)
**(Random Initialization)** Baum–Welch algorithm is a special case of the expectation–maximization algorithm used to find the
unknown parameters of a hidden Markov model (HMM). It makes use of the forward-backward algorithm
to compute the statistics for the expectation step.
Parameters:
observations (int ) : List of observed states.
nstates (int)
Returns: - #### Tuple with:
> - `array _pi`: Initial probability distribution.
> - `matrix _a`: Transition probability matrix.
> - `matrix _b`: Emission probability matrix.
---
requires: `import RicardoSantos/WIPTensor/2 as Tensor`
baumwelch(observations, pi, a, b)
Baum–Welch algorithm is a special case of the expectation–maximization algorithm used to find the
unknown parameters of a hidden Markov model (HMM). It makes use of the forward-backward algorithm
to compute the statistics for the expectation step.
Parameters:
observations (int ) : List of observed states.
pi (float ) : Initial probaility distribution.
a (matrix) : Transmissions, hidden transition matrix a or alpha = transition probability matrix of changing states
given a state matrix is size (M x M) where M is number of states
b (matrix) : Emissions, matrix of observation probabilities b or beta = observation probabilities. given state
matrix is size (M x O) where M is number of states and O is number of different possible observations
Returns: - #### Tuple with:
> - `array _pi`: Initial probability distribution.
> - `matrix _a`: Transition probability matrix.
> - `matrix _b`: Emission probability matrix.
---
requires: `import RicardoSantos/WIPTensor/2 as Tensor`
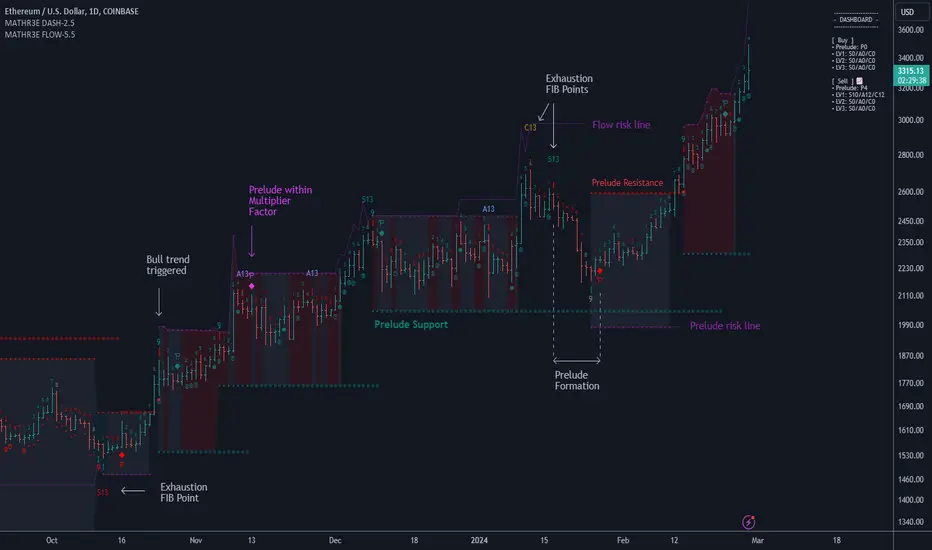
MATHR3E FLOW DASHBOARD█ OVERVIEW
MATHR3E Flow Dashboard is a market timing tool which aims to anticipate trend reversals and highlight potential low risk entries.
█ CONCEPTS
Disclaimer:
MATHR3E Flow Dashboard indicator is intended for advanced traders and may fit your profile, whether you are a day trader or a long-term investor.
It was originally developed by a renowned market analyst and documented in numerous books. Among them is the author Jason Perl.
It is recommended to have read the trading techniques mentioned in the books covering this indicator beforehand.
How to use:
Fibonacci Flow is a very complex tool, the purpose is not to detail it here but rather to introduce it briefly.
For a complete understanding, it is strongly recommended to read the books mentioned in the disclaimer section.
This indicator has two main components:
1 — The Prelude, which relies on momentum to define price ranges.
From a Price Reversal there must be nine consecutive closes;
each one less/greater than the corresponding close four bars earlier.
Preludes are numbered from 1 to 9. A complete Prelude occurs on bar 9.
It can be: Sharped / Flawed / Ignored / Extended
Cross over parameter can also evaluate the slowdown in a price trend's intensity and qualify the inception of Flow
2 — The Flow, which comes into play once the Prelude is complete.
They are trend based, and look for low-risk opportunities to fade established directional moves.
Flows are counts numbered from 1 to 13. There are 3 of them:
• SEQ: compares the current close with the low/high two bars earlier
• AGG: compares the current low/high with the low/high two bars earlier
• CMB: complex set of comparison with 2 available methods (not detailed here)
To handle the large amount of data to be displayed, they have been distributed over two indicators.
This indicator therefore works in pair with its companion: MATHR3E Flow Extension.
The distribution of the display is as follows:
Current indicator:
• Prelude points
• Markers for Extension preludes (E)
• Prelude Risk lines
• Flow Risk lines
• Prelude Trend Support and resistance
• Dashboard for supervision of ongoing counts
Companion indicator:
• Flow points
• Markers for Flows cancelation (X)
• Exhaustions points for:
• SEQ: up to 13 (Identify trend fading)
• AGG: up to 13 (For higher trading frequency)
• CMB: up to 13 (Identify prospective turning points following an abrupt price movement)
█ FEATURES & BENEFITS
Fibonacci Sequence
The number 13 is part of the Fibonacci sequence which is nature’s numbering system.
Exhaustion points
Potential exhaustion points emerge whenever the individual flows reach Fibonacci number 13.
These points may help traders to identify low-risk buy or sell opportunities.
Risk Lines
Once the trader has selected an entry point, the displayed risk lines should encourage the trader to remain disciplined and apply proper money management.
Position sizing remains the responsibility of the trader.
Available risk lines:
• buy/sell Preludes
• buy/sell Flows
Nested Flows
The indicator can track up to three nested Flows.
Renewing
During the path to reach point number 13, it is very common to trigger other Prelude in the same direction as the previously initiated trend.
MATHR3E Flow will address these potential market renewal with multiples options:
• Prelude range qualifiers
• Renewal Multiplier
Dashboard:
The dashboard makes it easier to monitor multiple buy and sell signals at the same time:
• Prelude: (P from 1 to 9) / Compares the current close with the corresponding close four bars earlier
• SEQ: (S from 1 to 13) / Compares the current close with the low/high two bars earlier
• AGG: (A from 1 to 13) / Compares the current low/high with the low/high two bars earlier
• CMB: (C from 1 to 13) / Requires four conditions to be satisfied simultaneously
Dashboard also provides the possibility to monitor up to 3 levels of flows
Alerts
The indicator also provides programmable alerts whose format can be adapted to be received on Discord servers
Configure your alerts and get notified on:
• Trend changes
• BUY or SELL P9
• BUY or SELL S13
• BUY or SELL A13
• BUY or SELL C13
MATHR3E FLOW█ OVERVIEW
MATHR3E Flow is a market timing tool which aims to anticipate trend reversals and highlight potential low risk entries.
█ CONCEPTS
Disclaimer:
MATHR3E Flow indicator is intended for advanced traders and may fit your profile, whether you are a day trader or a long-term investor.
It was originally developed by a renowned market analyst and documented in numerous books. Among them is the author Jason Perl.
It is recommended to have read the trading techniques mentioned in the books covering this indicator beforehand.
How to use:
Fibonacci Flow is a very complex tool, the purpose is not to detail it here but rather to introduce it briefly.
For a complete understanding, it is strongly recommended to read the books mentioned in the disclaimer section.
This indicator has two main components:
1 — The Prelude, which relies on momentum to define price ranges.
From a Price Reversal there must be nine consecutive closes;
each one less/greater than the corresponding close four bars earlier.
Preludes are numbered from 1 to 9. A complete Prelude occurs on bar 9.
It can be: Sharped / Flawed / Ignored / Extended
Cross over parameter can also evaluate the slowdown in a price trend's intensity and qualify the inception of Flow
2 — The Flow, which comes into play once the Prelude is complete.
They are trend based, and look for low-risk opportunities to fade established directional moves.
Flows are counts numbered from 1 to 13. There are 3 of them:
• SEQ: compares the current close with the low/high two bars earlier
• AGG: compares the current low/high with the low/high two bars earlier
• CMB: complex set of comparison with 2 available methods (not detailed here)
To handle the large amount of data to be displayed, they have been distributed over two indicators.
This indicator therefore works in pair with its companion: MATHR3E Flow Extension Dashboard.
The distribution of the display is as follows:
Current indicator:
• Flow points
• Markers for Flows cancelation (X)
• Exhaustions points for:
• SEQ: up to 13 (Identify trend fading)
• AGG: up to 13 (For higher trading frequency)
• CMB: up to 13 (Identify prospective turning points following an abrupt price movement)
Companion indicator:
• Prelude points
• Markers for Extension preludes (E)
• Prelude Risk lines
• Flow Risk lines
• Prelude Trend Support and resistance
• Dashboard for supervision of ongoing counts
█ FEATURES & BENEFITS
Fibonacci Sequence
The number 13 is part of the Fibonacci sequence which is nature’s numbering system.
Exhaustion points
Potential exhaustion points emerge whenever the individual flows reach Fibonacci number 13.
These points may help traders to identify low-risk buy or sell opportunities.
Risk Lines
Once the trader has selected an entry point, the displayed risk lines should encourage the trader to remain disciplined and apply proper money management.
Position sizing remains the responsibility of the trader.
Available risk lines:
• buy/sell Preludes
• buy/sell Flows
Nested Flows
The indicator can track up to three nested Flows.
Renewing
During the path to reach point number 13, it is very common to trigger other Prelude in the same direction as the previously initiated trend.
MATHR3E Flow will address these potential market renewal with multiples options:
• Prelude range qualifiers
• Renewal Multiplier
Alerts
Its Companion indicator also provides programmable alerts whose format can be adapted to be received on Discord servers
Configure your alerts and get notified on:
• Trend changes
• BUY or SELL P9
• BUY or SELL S13
• BUY or SELL A13
• BUY or SELL C13

FunctionDynamicTimeWarpingLibrary "FunctionDynamicTimeWarping"
"In time series analysis, dynamic time warping (DTW) is an algorithm for
measuring similarity between two temporal sequences, which may vary in
speed. For instance, similarities in walking could be detected using DTW,
even if one person was walking faster than the other, or if there were
accelerations and decelerations during the course of an observation.
DTW has been applied to temporal sequences of video, audio, and graphics
data — indeed, any data that can be turned into a linear sequence can be
analyzed with DTW. A well-known application has been automatic speech
recognition, to cope with different speaking speeds. Other applications
include speaker recognition and online signature recognition.
It can also be used in partial shape matching applications."
"Dynamic time warping is used in finance and econometrics to assess the
quality of the prediction versus real-world data."
~~ wikipedia
reference:
en.wikipedia.org
towardsdatascience.com
github.com
cost_matrix(a, b, w)
Dynamic Time Warping procedure.
Parameters:
a : array, data series.
b : array, data series.
w : int , minimum window size.
Returns: matrix optimum match matrix.
traceback(M)
perform a backtrace on the cost matrix and retrieve optimal paths and cost between arrays.
Parameters:
M : matrix, cost matrix.
Returns: tuple:
array aligned 1st array of indices.
array aligned 2nd array of indices.
float final cost.
reference:
github.com
report(a, b, w)
report ordered arrays, cost and cost matrix.
Parameters:
a : array, data series.
b : array, data series.
w : int , minimum window size.
Returns: string report.

Sequence Distribution Reporta basic tool to retrieve statistics of the distribution of price range sequences.

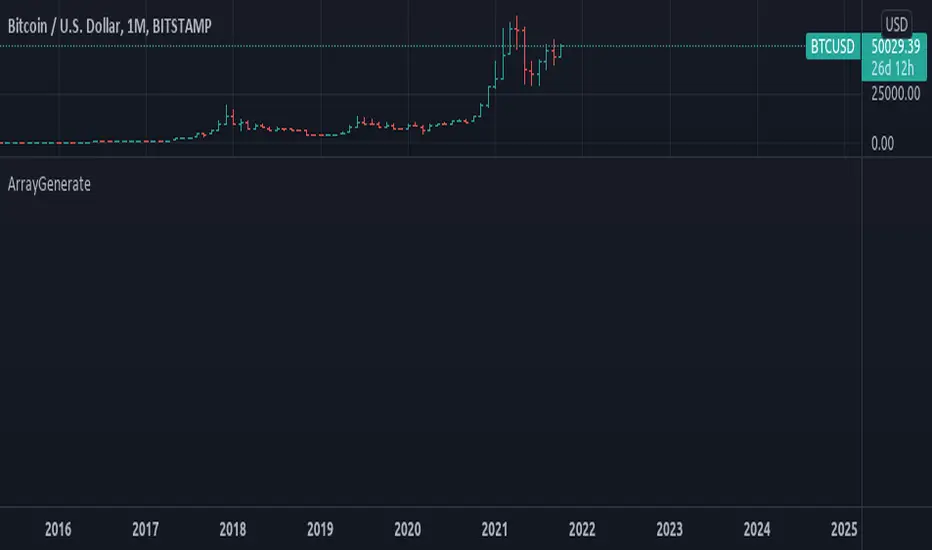
ArrayGenerateLibrary "ArrayGenerate"
Functions to generate arrays.
sequence_int(start, end, step) returns a sequence of int numbers.
Parameters:
start : int, begining of sequence range.
end : int, end of sequence range.
step : int, step, default=1 .
Returns: int , array.
sequence_float(start, end, step) returns a sequence of float numbers.
Parameters:
start : float, begining of sequence range.
end : float, end of sequence range.
step : float, step, default=1.0 .
Returns: float , array.
sequence_from_series(src, length, shift, direction_forward) Creates a array from a series sample range.
Parameters:
src : series, any kind.
length : int, window period in bars to sample series.
shift : int, window period in bars to shift backwards the data sample, default=0.
direction_forward : bool, sample from start to end or end to start order, default=true.
Returns: float array
normal_distribution(size, mean, dev) Generate normal distribution random sample.
Parameters:
size : int, size of array
mean : float, mean of the sample, (default=0.0).
dev : float, deviation of the sample from the mean, (default=1.0).
Returns: float array.
log_spaced(length, start_exp, stop_exp) Generate a base 10 logarithmically spaced sample sequence.
Parameters:
length : int, length of the sequence.
start_exp : float, start exponent.
stop_exp : float, stop exponent.
Returns: float array.
linear_range(stop, start) Generate a linearly spaced sample vector within the inclusive interval (start, stop) and step 1.
Parameters:
stop : float, stop value.
start : float, start value, (default=0.0).
Returns: float array.
periodic_wave(length, sampling_rate, frequency, amplitude, phase, delay) Create a periodic wave.
Parameters:
length : int, the number of samples to generate.
sampling_rate : float, samples per time unit (Hz). Must be larger than twice the frequency to satisfy the Nyquist criterion.
frequency : float, frequency in periods per time unit (Hz).
amplitude : float, the length of the period when sampled at one sample per time unit. This is the interval of the periodic domain, a typical value is 1.0, or 2*Pi for angular functions.
phase : float, optional phase offset.
delay : int, optional delay, relative to the phase.
Returns: float array.
sinusoidal(length, sampling_rate, frequency, amplitude, mean, phase, delay) Create a Sine wave.
Parameters:
length : int, The number of samples to generate.
sampling_rate : float, Samples per time unit (Hz). Must be larger than twice the frequency to satisfy the Nyquist criterion.
frequency : float, Frequency in periods per time unit (Hz).
amplitude : float, The maximal reached peak.
mean : float, The mean, or DC part, of the signal.
phase : float, Optional phase offset.
delay : int, Optional delay, relative to the phase.
Returns: float array.
periodic_impulse(length, period, amplitude, delay) Create a periodic Kronecker Delta impulse sample array.
Parameters:
length : int, The number of samples to generate.
period : int, impulse sequence period.
amplitude : float, The maximal reached peak.
delay : int, Offset to the time axis. Zero or positive.
Returns: float array.
Function - Sequence From SeriesFunction to create a array from a sample taken from a series (ex:. close, hlc3...).

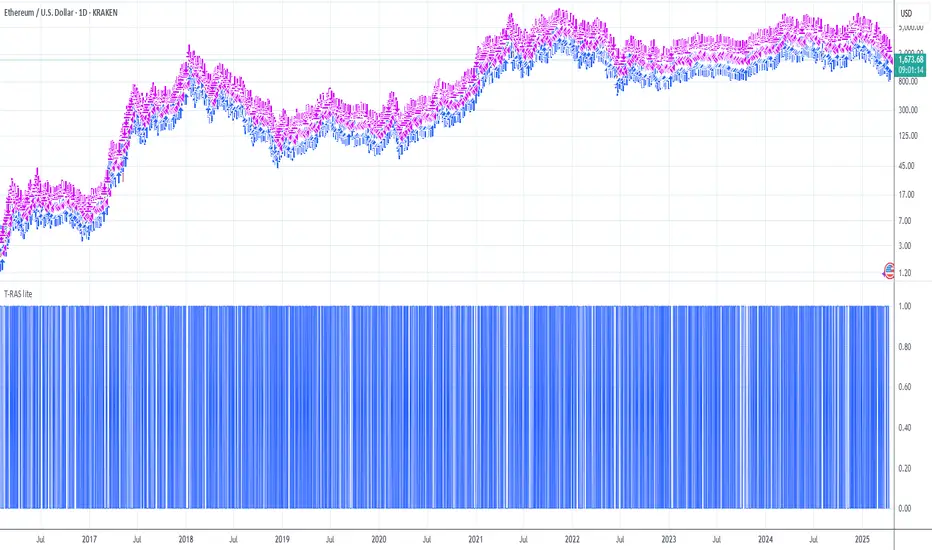
[e2] Fibonacci, Tribonacci, Tetranacci Sequence CalculatorThe script is a simple calculator to obtain numbers of Fibonacci, Tribonacci or Tetranacci Sequence.
The script contain calculations for constants (up to 16 digits) that could be used as one of the sequence's number.
The Calculator has 3 modes. Users can define the numbers to initialize the sequence in the options:
- The Fibonacci Sequence is the series of numbers, every next number is found by adding up the two numbers before it.
xn = xn-1 + xn-2
fiConst variable = Fibonacci Constant(Golden Ratio) - 1.61803...
"Classic" Sequence initialize with numbers {0, 1}. Output: 1,2,3,5,8,13,21...
To Calculate the Fibonacci Extensions the sequence should be initialized with {1, fiConst}. Output: 2.618, 4.236, 6.854...
- The Tribonacci Sequence is the series of numbers, every next number is found by adding up the three numbers before it.
xn = xn-1 + xn-2 + xn-3
trConst variable = Tribonacci Constant - 1.83929...
"Classic" Sequence initialize with numbers {0, 0, 1}. Output: 1,2,4,7,13,24...
To Calculate the Tribonacci Extensions the sequence should be initialized with {0, 1, trConst}. Output: 2.839, 5.679, 10.357...
- The Tetranacci Sequence is the series of numbers, every next number is found by adding up the four numbers before it.
xn = xn-1 + xn-2 + xn-3 + xn-4
teConst variable = Tetranacci Constant - 1.92756...
"Classic" Sequence initialize with numbers {0, 0, 0, 1}. Output: 1,2,4,8,15,29,56...
To Calculate the Tetranacci Extensions the sequence should be initialized with {0, 0, 1, teConst}. Output: 2.928, 5.855, 11.710...
The Calculator can return a single number or a set of numbers based on the selected sequence mode.
The script is made for other scripts integration rather than stand-alone usage.
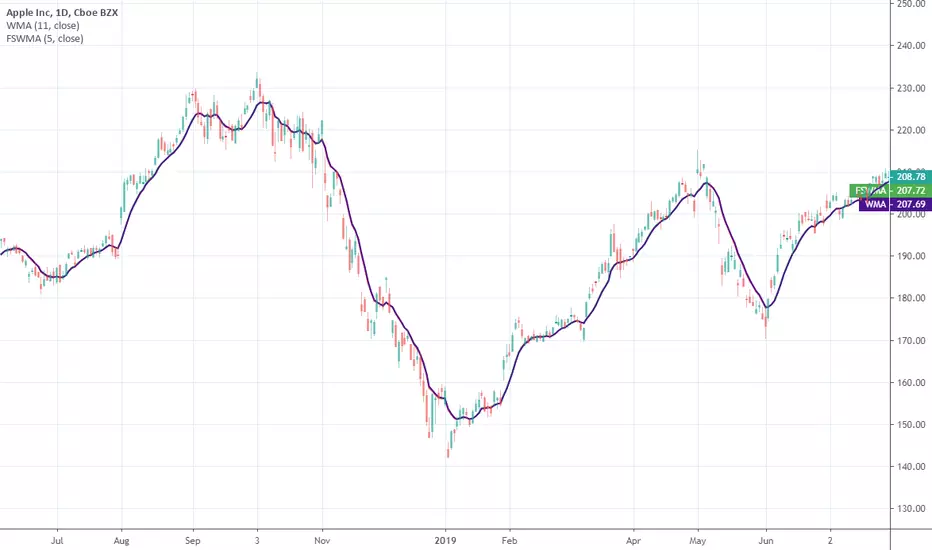
Sequentially Filtered Moving AverageThe previously proposed sequential filter aimed to filter variations lower than a certain period, this allowed to remove noisy variations and retain only the closing price values that occurred after a consecutive up/down, however because of the noisy nature of the closing price large filtering was impossible, in order to tackle to this problem the same indicator using a simple moving average as input is proposed, this allow for smoother results.
We will see that the proposed indicator can provide an alternative moving average that could be used as slow moving average in crossover systems.
The Indicator
The length parameter as the same function as the one described in the sequential filter post, however here length also control the period of the moving average used input, in short larger values of length will return a smoother but less reactive output.
In blue the moving average with length = 200, and in red the moving average with length = 50.
It is interesting to see how the moving average remain flat during ranging/flat market periods
Unfortunately like the sequential filter the sequentially filtered moving average (SFMA) is not affected by large short term variations such as gaps or short term volatile events. This is because of the nature of the sequential filter to ignore movements amplitude and only focus on the variation period.
Moving Average Crossover System
The SFMA is equal to a simple moving average of period length when a consecutive up/down sequence of size length has occurred, else the SFMA is equal to its precedent value, therefore we could expect less crosses between a fast moving average and the SFMA as slow moving average.
We can see on the figure above that the fast moving average of period 50 (in green) cross more with the slow moving average of period 200 (in red) than with the SFMA of period 200 (in blue).
Crosses can occur at the same time as with the classical slow moving average (in red) or a bit later.
Conclusion
A new moving average based on the recently proposed sequential filter has been proposed, it can be seen that under a moving average crossover system the proposed moving average seems to be more effective at producing less crosses without necessarily doing it with an excessive lag, in fact the moving average has either lag (length-1)/2 or lag length .
In the future it could be interesting to provide an hybrid alternative that take into account volatility as well as variations period.
Thanks for reading !

Farey Sequence Weighted Moving AverageA moving average that weighted with Farey fractions. It matches a standard linear weighted average almost one-to-one. Why? Because both averages have strictly monotonic weighting sequences and assign a higher weight to latests data. So, Farey weights are just scaled to linear ones. Instead of specifing period you specify an order of Farey sequence. To learn more about Farey sequence you can refer to Wiki
Published just for reference, it is not intended for trading purposes.
Trend Reversal Alerts Strategy [lite]This strategy was created as experimental and after playing around with it, I was able to realize what is a good way to base your strategy on and what is not.
This one is most primitive way and you should not expect gains from it(it's best on the weekly btw).
Anyway, all my attempts to advance this strategy in the end gave me around 1%2% +Net Profit on the hourly timeframe and drastically reduced the Net Profit by 50% on the weekly, so I think it is a waste of my time, but if you feel like you have ideas to share with me, please feel free to comments below!
AlPos-Trend-HighlighterAlPos TH
This tool was built to determine possible trend reversal points(use interval =1). Simple, but yet powerful due to the fact that you can turn his detection algorithm into a sequential highlighter(use interval >1). Also you can play with sources for the peaks/bottoms. 2 for the detector and the other 2 for the trend highlighter(be careful with this guys, because of those switches expressions that rely on candle’s color(for example if open>close or if open 1). Также вы можете играть с источниками для пиков/дна. 2 для детектора и другие 2 для тренд-маркера (будьте осторожны с этими ребятами из-за условий в выражениях переключателей, которые полагаются на цвет свечи (например, если открытие>закрытия или открытие<закрытия), поэтому советую - для тренда использовать всегда одинаковые источники), но в любом случае поиграйте с ним и решите сами, что вы думаете! Стили помогут вам установить ширину выделенной области. Нет дельта, да, я знаю ) ТОЛЬКО в этот раз

All Time Fibo ChannelThis is a configurable all time fibo channel with delta option and styles settings.

