Basic DCA Strategy by Wongsakon KhaisaengThe Core Principle and Philosophy Behind the Basic DCA Strategy
1. Introduction
The Basic DCA Strategy (Dollar-Cost Averaging) represents one of the most fundamental and enduring investment methodologies in the realm of systematic accumulation. The philosophy underpinning DCA is rooted not in speculation or prediction, but in disciplined participation. It assumes that the consistent act of investing a fixed amount of capital over time—regardless of short-term price volatility—can yield superior long-term outcomes through the natural smoothing effect of cost averaging.
This strategy, expressed through the Pine Script code above, formalizes the DCA concept into a fully systematic trading framework, enabling quantitative backtesting and objective evaluation of long-term accumulation efficiency.
2. Mechanism of Operation
At its technical core, the strategy executes a fixed-value buy order at every predefined interval within a specific accumulation period.
Each DCA event invests a constant “Investment Amount (USD)” irrespective of price fluctuations. When prices decline, this constant investment buys a larger quantity of the asset; when prices rise, it purchases fewer units. Over time, this behavior lowers the average cost basis of the accumulated position, effectively neutralizing short-term timing risks.
Mathematically, this is represented as:
Units Purchased = Investment Amount / Closing Price
Cost Basis = Total Invested USD / Total Units Acquired
Portfolio Value = Total Units Acquired × Current Price
The algorithm tracks cumulative investment, acquired units, and commissions dynamically, continuously recalculating key portfolio metrics such as total profit/loss (PnL), CAGR (Compound Annual Growth Rate), and maximum drawdown (peak-to-trough equity decline).
Furthermore, the script juxtaposes DCA results with a Buy & Hold benchmark, where the entire initial capital is invested at once. This comparison highlights the behavioral resilience and volatility resistance of the DCA method relative to market-timing strategies.
3. The Essence of DCA Philosophy
At its philosophical core, DCA is not a trading system, but a behavioral framework for rational capital deployment under uncertainty. It embodies the principle that time in the market often outweighs timing the market.
The DCA approach rejects the illusion of precision forecasting and embraces probabilistic humility—the recognition that even the most skilled investors cannot consistently predict short-term market fluctuations. Instead, it focuses on controlling what is controllable: the frequency, consistency, and size of investment actions.
This mindset reflects a broader principle of risk dispersion through temporal diversification. Rather than concentrating entry risk into a single price point (as in lump-sum investing), DCA spreads exposure across multiple time intervals, thereby converting volatility into opportunity.
In essence, volatility—often perceived as risk—is reframed as a mechanism for mean reversion advantage. The strategy thrives precisely because markets oscillate; each fluctuation provides a chance to accumulate at varied price levels, improving the weighted-average entry over time.
4. Long-Term Rationality Over Short-Term Emotion
DCA’s endurance stems from its ability to neutralize emotional biases inherent in human decision-making. Investors tend to overreact to market euphoria or panic—buying high out of greed and selling low out of fear. By automating purchases through predefined intervals, the DCA model enforces mechanical discipline, detaching decision-making from sentiment.
This transforms investing from an emotional endeavor into a systematic, algorithmic routine governed by rules rather than reactions. In doing so, DCA serves not only as a financial model but also as a psychological safeguard—aligning investor behavior with long-term compounding logic rather than short-term speculation.
5. Comparative Insight: DCA vs. Buy & Hold
While both DCA and Buy & Hold share a long-term investment horizon, they diverge in their treatment of entry timing. The Buy & Hold model assumes full deployment of capital at the beginning, maximizing exposure to growth but also to volatility. Conversely, DCA smooths the entry curve, trading off short-term returns for long-term stability and improved average entry price.
In environments characterized by volatility and cyclical corrections, DCA tends to outperform in terms of risk-adjusted returns, lower drawdowns, and improved investor adherence—since it reduces the psychological pain of entering at local peaks.
6. Conclusion
The Basic DCA Strategy exemplifies the synthesis of mathematical rigor and behavioral discipline. Its algorithmic construction in Pine Script transforms a classical investment philosophy into a quantifiable, testable, and transparent framework.
By automating fixed-amount purchases across time, the system operationalizes the central axiom of DCA: consistency over conviction. It is not concerned with predicting future prices but with ensuring persistent participation—trusting that the market’s upward bias and the power of compounding will reward patience more than precision.
Ultimately, DCA embodies the timeless principle that successful investing is less about forecasting markets, and more about designing behavior that can endure them.
Statistics

Master Trend Strategy - by jake_thebossMaster Trend Strategy
This strategy combines multiple technical indicators to identify high-probability trend entries across all asset classes.
Core Signal Logic:
Entry triggered when EMA 4 crosses above/below EMA 5
Confirmation required from RSI (>50 for long, <50 for short)
Price must be above/below key moving averages: EMA 21, SMA 50, EMA 55, EMA 89, and EMA 750
Additional confirmation from Stochastic (>52 bullish, <48 bearish) or EMA 89 breakout or VWAP cross
Key Features:
VWAP filter: Only takes bullish signals above VWAP and bearish signals below VWAP
Optional pyramiding: Allows multiple entries in the same direction (up to 200 orders)
Individual stop loss and take profit management for each pyramid level
Time filter: Customizable trading hours with timezone offset
Risk management: Adjustable stop loss (default 0.3%) and take profit (default 0.6%)
Visualization:
Entry, stop loss, and take profit levels drawn as horizontal lines
Customizable signal markers (triangles) for bull/bear entries
Optional EMA overlay display
The strategy is designed for trend-following on lower timeframes, with strict multi-indicator confirmation to filter out false signals.

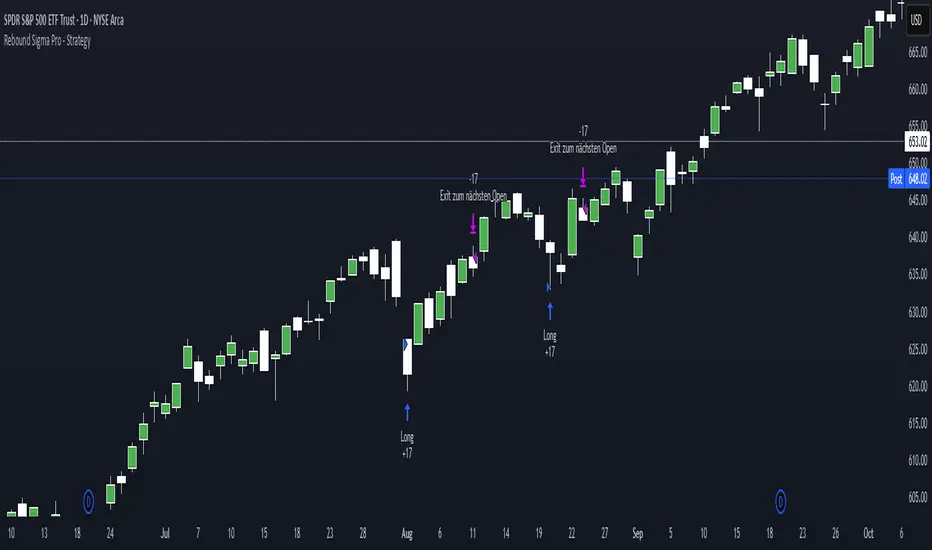
Rebound Sigma Pro - StrategyOverview
Rebound Sigma Pro is a mean-reversion indicator that detects statistically oversold conditions in trending markets.
It helps traders identify potential short-term rebounds based on momentum exhaustion and volatility-adjusted entry zones.
Concept
The indicator combines two quantitative components:
Short-term momentum to detect short-term exhaustion
Trend filter to ensure setups align with the long-term direction
When a stock in an uptrend becomes temporarily oversold, a limit-entry signal is plotted.
The trade is then tracked until short-term conditions normalize or a time-based exit occurs.
Visual Signals
Green Triangle: Suggests placing a limit order for the next session
Green Circle: Confirms entry was filled
Red Triangle: Signals an exit for the next session’s open
Orange Background: Pending order
Green Background: Position active
Red Background: Exit phase
Yellow Line: Entry reference price
User Inputs
Limit Entry (% below previous close) – Default 1 %
Use Limit Entry – Switch between limit or market entries
Enable Time Exit – Optional holding-period constraint
Maximum Holding Days
All other internal parameters (momentum length, filters) are pre-configured.
Alerts
Limit Order Signal: New setup detected
Entry Confirmed: Order filled
Exit Signal: Exit expected next day
Usage
Designed for liquid equities and ETFs
Works best in confirmed uptrends
Backtesting encouraged to adapt parameters per symbol and timeframe
Notes
Not an automated strategy; manual order execution required
Past behavior does not imply future performance
Always apply sound position sizing and risk management
Disclaimer
This indicator is provided for educational and analytical purposes only.
It does not constitute financial advice or performance assurance.
Squeeze Backtest by Shaqi v2.0Script to backtest price squeeze's. Works on long and short directions

AstraAlgo BacktesterOVERVIEW
The AstraAlgo Backtester allows traders to simulate and evaluate trading strategies directly on TradingView. By simulating trades across different timeframes and markets, it provides valuable insights into win rates, drawdowns, and overall strategy effectiveness.
SIGNAL MODES
Signal Modes generate proprietary trade signals based on live price data. Users can choose between Off, Basic, Advanced, or Custom modes to evaluate strategies under different conditions and refine their trading approach.
ADJUSTABLE BACKTESTING
Parameters for historical simulations can be customized to test different market conditions and trading scenarios. This allows traders to measure strategy performance, including win rate, profit/loss, and risk/reward ratios, helping refine and optimize strategies before live execution.
BAR COLORING
Bar Coloring highlights bullish and bearish bars on historical charts, allowing traders to visually assess trend direction and trade outcomes during backtesting. This makes it easier to analyze momentum and strategy effectiveness at a glance.
ASTRA CLOUD
Astra Cloud overlays dynamic support and resistance levels on live price data. These zones adapt automatically to past market movements, helping traders identify areas where trades would have reacted, aiding strategy evaluation and optimization.

AI - Gaussian Channel Strategy AI – Gaussian Channel Strategy is a long-only swing trading strategy designed for Bitcoin and other assets on daily charts. It combines an adaptive Gaussian Channel with Supertrend and Stochastic RSI filters to identify potential bullish breakouts or pullback entries. The channel defines trend direction and volatility, while the Stochastic RSI provides momentum confirmation. Positions are opened only when the price closes above the channel’s upper band under favorable momentum conditions, and are closed when the price crosses back below the band.
This script is intended for educational and research purposes. Parameters such as poles, period length, ATR factor, and RSI settings can be adjusted to fit different markets and timeframes.
Disclaimer: This script does not guarantee profits and should not be considered financial advice. Past performance is not indicative of future results. Trading involves risk, and you are solely responsible for your own decisions and outcomes.

Lead Levels TP/SL v1.3 (close-only entries)Lead Levels — close-only signals, clean execution
Notice: Designed for BTC 15-minute charts only.
What it shows
Four reliability tiers: L1, L2, L3, L4.
A black “DON’T BET” marker for extreme conditions you should skip.
All triangles print only on bar close to avoid repaint.
How to read
▲ BUY L1–L4: higher level → stronger confidence.
▼ SELL L1–L4: higher level → stronger confidence.
DON’T BET (black): stand aside. No trade.
How to trade it
When a triangle prints, run a 1:1 target/stop:
Long: TP +1%, SL −1%.
Short: TP −1%, SL +1%.
Focus on normal conditions. Skip when the black marker appears.
One entry per signal. Keep sizing consistent.
Why traders like it
Close-only printing keeps charts honest.
Simple 1:1 playbook. No guesswork.
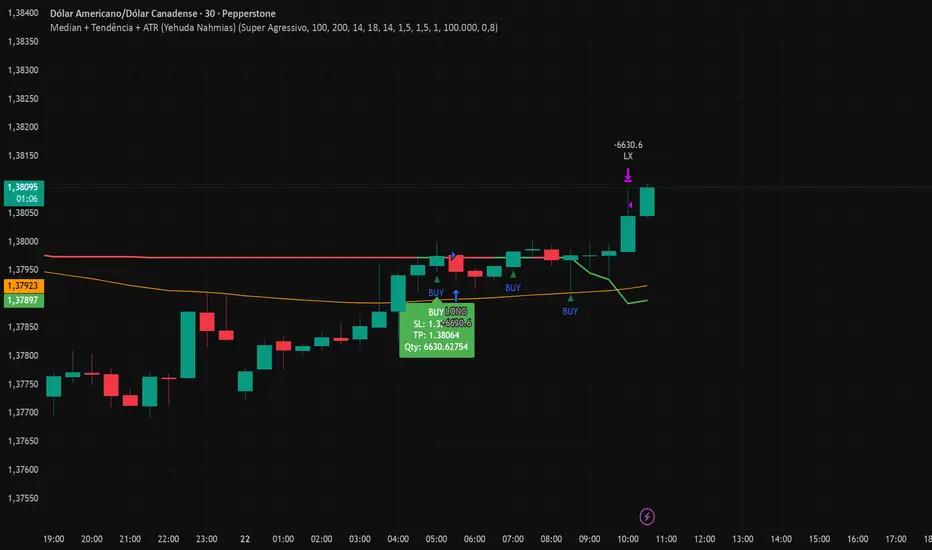
Median + Tendência + ATR (Yehuda Nahmias)📊 Median + Trend + ATR (By Yehuda Nahmias)
🚀 The indicator that combines Simplicity, Accuracy, and Risk Management
This script brings together three key pillars of professional trading:
✅ Dynamic Median → captures price midpoints and highlights reversal and breakout zones.
✅ Trend Filter (EMA) → ensures signals are aligned with the main market direction.
✅ Smart ADX + ATR → confirm trend strength and automatically calculate Stop Loss and Take Profit based on volatility.
🔔 How it works:
Buy/Sell Arrows: automatically appear when price crosses the median under valid trend and strength conditions (ADX).
Automatic Stops and Targets: SL and TP levels are plotted using ATR, ready for effective risk management.
3 Signal Modes:
🛡️ Conservative → fewer trades, stronger filtering.
⚖️ Standard → balance between frequency and accuracy.
⚡ Aggressive → more trades, captures shorter moves.
💡 Key Benefits:
Clear visuals: colored candles + BUY/SELL arrows.
Built-in risk management: position size is calculated based on % of equity.
Flexible: works on any asset (Forex, Crypto, Indices, Stocks).
🔑 Private access only.
If you’d like to use this strategy on your charts, contact me via my TradingView profile.
👉 Turn your analysis into objective signals and gain more confidence in your entries and exits!
KCandle Strategy 1.0# KCandle Strategy 1.0 - Trading Strategy Description
## Overview
The **KCandle Strategy** is an advanced Pine Script trading system based on bullish and bearish engulfing candlestick patterns, enhanced with sophisticated risk management and position optimization features.
## Core Logic
### Entry Signal Generation
- **Pattern Recognition**: Detects bullish and bearish engulfing candlestick formations
- **EMA Filter**: Uses a customizable EMA (default 25) to filter trades in the direction of the trend
- **Entry Levels**:
- **Long entries** at 25% of the candlestick range from the low
- **Short entries** at 75% of the candlestick range from the low
- **Signal Validation**: Orange candlesticks indicate valid setup conditions
### Risk Management System
#### 1. **Stop Loss & Take Profit**
- Configurable stop loss in pips
- Risk-reward ratio setting (default 2:1)
- Visual representation with colored lines and labels
#### 2. **Break-Even Management**
- Automatically moves stop loss to break-even when specified R:R is reached
- Customizable break-even offset for added protection
- Prevents losing trades after reaching profitability
#### 3. **Trailing Stop System**
- **Activation Trigger**: Activates when position reaches specified R:R level
- **Distance Control**: Maintains trailing stop at defined distance from entry
- **Step Management**: Moves stop loss forward in incremental R steps
- **Dynamic Protection**: Locks in profits while allowing for continued upside
### Advanced Features
#### Position Management
- **Pyramiding Support**: Optional multiple position entries with size reduction
- **Order Expiration**: Pending orders automatically cancel after specified bars
- **Position Sizing**: Percentage-based allocation with pyramid level adjustments
#### Visual Interface
- **Real-time Monitoring**: Comprehensive information panel with all strategy metrics
- **Historical Tracking**: Visual representation of past trades and levels
- **Color-coded Indicators**: Different colors for break-even, trailing, and standard stops
- **Debug Options**: Optional labels for troubleshooting and optimization
## Key Parameters
### Basic Settings
- **EMA Length**: Trend filter period
- **Stop Loss**: Risk per trade in pips
- **Risk/Reward**: Target profit ratio
- **Order Validity**: Duration of pending orders
### Risk Management
- **Break-Even R:R**: Profit level to trigger break-even
- **Trailing Activation**: R:R level to start trailing
- **Trailing Distance**: Stop distance from entry when trailing
- **Trailing Step**: Increment for stop loss advancement
## Strategy Benefits
1. **Objective Entry Signals**: Based on proven candlestick patterns
2. **Trend Alignment**: EMA filter ensures trades align with market direction
3. **Robust Risk Control**: Multiple layers of protection (SL, BE, Trailing)
4. **Profit Optimization**: Trailing stops maximize winning trade potential
5. **Flexibility**: Extensive customization options for different market conditions
6. **Visual Clarity**: Complete visual feedback for trade management
## Ideal Use Cases
- **Swing Trading**: Medium-term positions with trend-following approach
- **Breakout Trading**: Capturing momentum from engulfing patterns
- **Risk-Conscious Trading**: Suitable for traders prioritizing capital preservation
- **Multi-Timeframe**: Adaptable to various timeframes and instruments
---
*The KCandle Strategy combines traditional technical analysis with modern risk management techniques, providing traders with a comprehensive tool for systematic market participation.*

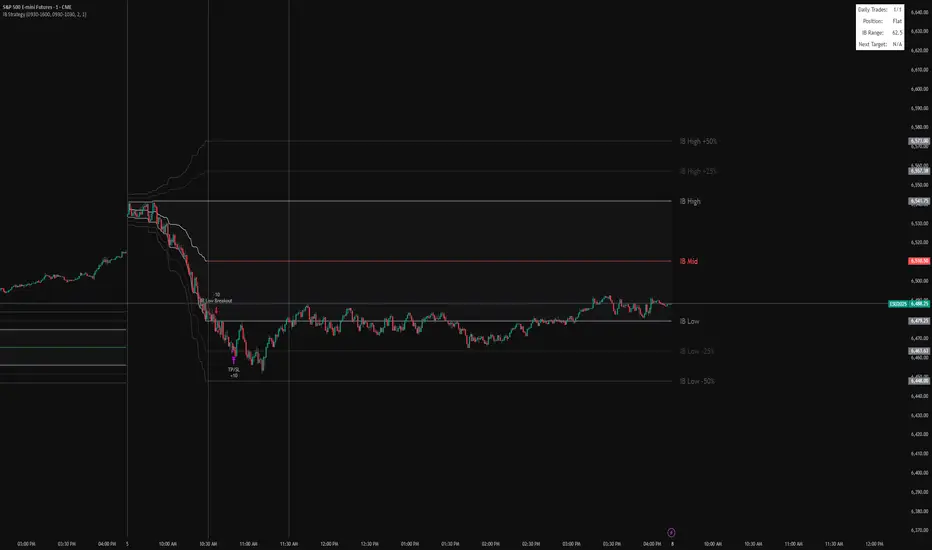
IB BreakoutIt marks the IB range (high, low, midpoint) from a chosen session window (default 9:30–10:30).
It plots the IB lines, midpoint (colored based on close), and extension levels (+/–25% and 50%).
After the IB session ends, it looks for breakouts:
Long if price closes above IB high.
Short if price closes below IB low.
Each trade targets the 25% extension in the breakout direction, with an optional stop at the opposite IB level.
It limits the number of trades per day and displays info (trades, position, IB range, next target) in a table.
Supertrend [TradingConToto]Supertrend — ADX/DI + EMA Gap + Breakout (with Mobile UI)
What makes it original
Supertrend combines trend strength (ADX/DI), multi-timeframe bias (EMA63 and EMA 200D equivalent), a structural filter based on the distance between EMA2400 and EMA4800 expressed in ATR units, and a momentum confirmation through a previous high breakout.
This is not a random mashup — it’s a sequence of filters designed to reduce trades in ranging markets and prioritize mature trends:
Direction: +DI > -DI (trend led by buyers).
Strength: ADX > mean(ADX) (avoids weak, choppy phases).
Short-term bias: Close > EMA63.
Long-term bias: Close > EMA4800 ≈ EMA200 daily on H1.
Momentum: Close > High (immediate breakout).
Structure: (EMA2400 − EMA4800) > k·ATR (ensures separation in ATR units, filters out flat phases).
Entries & exits
Entry: when all six conditions are met and no open position exists.
Exit: if +DI < -DI or Close < EMA63.
Visuals: EMA63 is painted green while in position and red otherwise, with a supertrend-style band; “BUY” labels appear below the green band and “SELL” labels above the red band.
UI: includes a compact table (mobile-friendly) showing the state of each condition.
Default parameters used in this publication
Initial capital: 10,000
Position size: 10% of equity (≤10% per trade is considered sustainable).
Commission: 0.01% per side (adjust to your broker/market).
Slippage: 1 tick
Pyramiding: 0 (only one position at a time)
Adjust commission/slippage to match your market. For US equities, commissions are often per share; for spot crypto, 0.10–0.20% total is common. I publish with 0.01% per side as a conservative example to avoid overestimating results.
Recommended backtest dataset
Timeframe: H1
Multi-cycle window (e.g. 2015–today)
Symbols with high liquidity (e.g. NASDAQ-100 large caps, or BTC/ETH spot) to generate 100+ trades. Avoid cherry-picked short windows.
Why each filter matters
+DI > -DI + ADX > mean: reduce counter-trend trades and weak signals.
Close > EMA63 + Close > EMA4800: enforce trend alignment in short and long horizons.
Breakout High : requires immediate momentum, avoids early entries.
EMA gap in ATR units: blocks flat or compressed structures where EMA200D aligns with price.
Limitations
The breakout filter may skip healthy pullbacks; the design prioritizes continuation over perfect entry price.
No fixed trailing stop/TP; exits depend on trend degradation via DI/EMA63.
Results vary with real costs (commissions, slippage, funding). Adjust defaults to your broker.
How to use
Apply it on a clean chart (no other indicators when publishing).
Keep in mind the default parameters above; if you change them, mention it in your notes and use the same values in the Strategy Tester.
Ensure your dataset produces 100+ trades for statistical validity.

AI KNN-Dual SuperTrend MTF - by Trading Pine Lab🇬🇧
The AI KNN-Dual SuperTrend MTF is a next-generation trading strategy that merges two higher-timeframe SuperTrends with dual KNN (K-Nearest Neighbors) classifiers, an ADX/DMI filter, and a Pivot Percentile bias module. This layered architecture ensures stronger signal confirmation by requiring consensus across AI models, multi-timeframe SuperTrends, and statistical filters.
Entries occur only when both SuperTrends align with bullish or bearish KNN labels, while the ADX/DMI filter validates momentum. Exits are managed dynamically with adaptive trailing stops (ST ± ATR × factor) or when market conditions flip according to percentile bias.
All parameters are fully configurable:
-Trading direction filter: Long / Short / Both.
-KNN classifiers: neighbors (K), dataset size (N), smoothing lengths.
-Dual SuperTrend: higher timeframes, ATR length, ATR factor, baseline type.
-ADX/DMI filter: customizable length and timeframe.
-Pivot Percentile module: multi-scale statistical bias.
-Visualization: AI markers, ribbons, aura lines, and per-trend coloring.

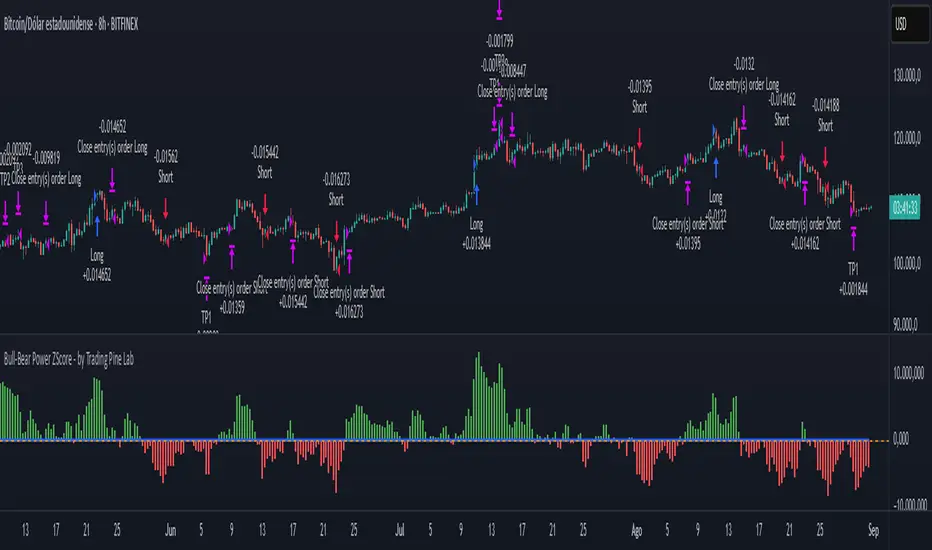
Bull-Bear Power ZScore - by Trading Pine Lab🇬🇧
The Bull-Bear Power ZScore Strategy is an advanced trading framework that integrates Bull-Bear Power (BBP) with a statistical Z-Score model.
BBP measures the relative strength of buyers vs. sellers against an EMA baseline, while the Z-Score standardizes this relationship to detect statistically significant breakouts.
This dual-layer approach provides early trend detection while reducing noise from raw momentum signals.
Entries are triggered when the Z-Score crosses above or below its threshold (long above +T, short below –T). Exits occur when the Z-Score crosses back to zero, ensuring trades close when momentum fades.
A dynamic multi-level take-profit system is integrated, using ATR-based targets (TP1, TP2, TP3) that automatically adapt to **volume context** (high/medium/low) and **percentile analysis** (distribution of price and volume).
This ensures profit targets stretch in strong environments and tighten in weaker conditions, optimizing both risk and reward.
All parameters are fully configurable:
-Bull-Bear Power Settings: EMA length, Z-Score length, Z-Score threshold.
-Take Profit Settings: enable/disable TP system, ATR period, TP1–TP3 multipliers, TP1–TP3 position sizes.
-Volume Analysis: volume MA period, high/medium/low multipliers, adjustment factors.
-Percentile Analysis: percentile lookback period, high/medium/low thresholds, adjustment factors.
ETH/BTC/XRP Strategy - Powered by BCHETH/BTC/XRP Strategy — Cross-Asset Momentum-Based Strategy
Overview
This strategy aims to identify medium-term long trade opportunities on ETH/BTC/XRP 2 or 4 hour charts by leveraging cross-asset momentum signals from Bitcoin Cash (BCH) relative to Ethereum (ETH). It integrates volatility filters, volume validation, and momentum confirmations to improve trade timing and risk management.
Key Features and Logic
Cross-Asset Momentum Filter: Enters long trades when BCH outperforms ETH in the prior candle, supporting relative strength confirmation.
Volume Confirmation: BCH volume must exceed 135% of its 20-period average, validating market interest before entry signals.
Volatility Filter: ETH price near or below 110% of the lower Bollinger Band (20 periods, 2σ) indicates oversold conditions.
Momentum Indicators: ETH RSI below 70 ensures the asset is not overbought, coupled with BCH MACD line crossing above its signal line for bullish bias.
Risk Controls: Includes trailing stop losses and take profit targets to protect gains and limit drawdowns.
Timing Constraints: Controlled cooldown periods between trades help prevent overtrading and false signals.
Usage Recommendations
Optimized for 2 or 4hour ETH/BTC/XRP USDT candles; 5-minute data optionally used for finer entries and exits.
Suitable for traders seeking dynamic timing based on multi-asset interactions rather than blind holding.
Works as a complement within diversified or rotational strategies focusing on Ethereum exposure.
Performance Summary (Backtest Jan 2023 – Jul 2025) ; ETHUSDT 2hour basis.
Total trades: 65
Win rate: 61.5%
Profit factor: 5.1
Note: The sample size is limited; results should be interpreted with caution. Past performance is not indicative of future results.
Important Notes
This script represents an original combination of cross-asset momentum with volatility and volume filters tailored to ETH and BCH interaction.
Source code is protected to safeguard unique implementation details while allowing free usage without restrictions.
Use appropriate risk management, and consider these signals as part of a broader trading analysis.
No guarantees on profitability; trading involves significant risk.

Lunar calendar day Crypto Trading StrategyLunar calendar day Crypto Trading Strategy
This strategy explores the potential impact of the lunar calendar on cryptocurrency price cycles.
It implements a simple but unconventional rule:
Buy on the 5th day of each lunar month
Sell on the 26th day of the lunar month
No trades between January 1 (solar) and Lunar New Year’s Day (holiday buffer period)
Research background
Several academic studies have investigated the influence of lunar cycles on financial markets. Their findings suggest:
Returns tend to be higher around the full moon compared to the new moon.
Periods between the full moon and the waning phase often show stronger average returns than the waxing phase.
This strategy combines those observations into a practical implementation by testing fixed entry (lunar day 5) and exit (lunar day 26) points, while excluding the transition period from solar New Year to Lunar New Year, effectively capturing mid-month lunar effects.
How it works
The script includes a custom lunar date calculation function, reconstructing lunar months and days for each year (2020–2026).
On lunar day 5, the strategy opens a long position with 100% of equity.
On lunar day 26, the strategy closes the position.
No trades are executed between Jan 1 and Lunar New Year’s Day.
All trades include:
Commission: 0.1%
Slippage: 3 ticks
Position sizing uses the entire equity (100%) for simplicity, but this is not recommended for live trading.
Why this is original
Unlike mashups of built-in indicators, this script:
Implements a full lunar calendar system inside Pine Script.
Translates academic findings on lunar effects into an applied backtest.
Adds a realistic trading filter (holiday gap) based on cultural/seasonal calendar rules.
Provides researchers and traders with a framework to explore non-traditional, time-based signals.
Notes
This is an experimental, research-oriented strategy, not financial advice.
Results are highly dependent on the chosen period (2020–2026).
Using 100% equity per trade is for simplification only and is not a viable money management practice.
The purpose is to investigate whether cyclical patterns linked to lunar time can provide any statistical edge in ETHUSDT.

Multi Channel GRID & DCA LTF [trade_lexx]Multi Channel GRID & DCA LTF
Usage Guide
Part 1: The concept and general possibilities of the "Multi Channel GRID & DCA LTF" strategy
Introduction
Welcome to the guide to "Multi Channel GRID & DCA LTF", a powerful and versatile automated trading strategy for the TradingView platform. This tool was developed for traders who are looking for flexibility, control and a high degree of adaptability to various market conditions.
The strategy is based on a hybrid approach that combines two popular and time-tested techniques.:
1. GRID (grid trading): The classic method of averaging a position is by placing a grid of limit orders.
2. DCA (Dollar Cost averaging): Smart position averaging based on signals from external indicators.
However, "Multi Channel GRID & DCA LTF" goes far beyond the simple combination of these two techniques. The strategy includes a number of unique and innovative features, such as cascading MultiGRID grids for dealing with extreme volatility, Channel Mode range trading mode for profiting from sideways movement, and Low Time Frame analysis (LTF) to achieve surgical accuracy in backtesting. Deep customization options for risk management, capital, take profits, and stop losses allow you to configure a strategy for almost any trading style, asset, and timeframe.
The basic idea: How does it work?
Let's take a detailed look at each of the key concepts embedded in the logic of the strategy.
1. GRID — Automatic placement of buy and sell orders at certain price intervals.
This is a fundamental mode of operation. Its main goal is to systematically improve the average entry price for a position if the market is going against you.
* The principle of operation: After opening the base (first) order (`BO`), the strategy automatically places a series of pending limit orders (here they are called "safety orders" or "SO") at certain price intervals. For a long position, orders are placed below the entry price, and for a short position, orders are placed higher.
* Target: When the price moves against an open position, it consistently hits and executes safety orders. Each such execution adds additional volume to the position at a more favorable price, thereby shifting the overall average entry price (`position_avg_price') closer to the current market price. This means that a much smaller corrective movement will be required to gain ground.
* Flexibility: You have full control over the geometry of the grid: the number of safety orders, the percentage distance between them (`SO Step`), and you can even set a coefficient that will increase this step for each subsequent order (`SO Multiplier`), creating an expanding grid.
2. DCA (Signal Averaging) — Smart Averaging
This mode adds an additional layer of analysis to the averaging process. Instead of just buying/selling at the set price levels, the strategy waits for a confirmation signal.
* Working principle: You can connect any external indicator (for example, RSI, CCI, or even your own complex signal system) to the strategy, which outputs numerical values. As standard, 1 is used for a long signal, and -1 is used for a short signal. The strategy will place the next averaging order only at the moment when it receives the appropriate signal.
* Goal: To average a position not just during a fall (or a rise for a short), but at the moments that your main trading system considers the most favorable for this. This allows you to avoid "catching falling knives" and enter only if there are good reasons.
3. Hybrid Mode (GRID+DCA) is the best of the previous two modes
This mode is designed for maximum filtering and control. It requires two conditions to be fulfilled simultaneously.
* Working principle: The safety order will be executed only if the price has reached the calculated grid level and a confirmation signal has been received from your external indicator. If a confirmation signal is received from an external indicator, the next calculated grid level activates the limit order.
* Goal: To create the most reliable averaging system that protects against premature entries and requires double confirmation (both by price and indicator) before increasing the position size.
4. MultiGRID — Adaptation to extreme volatility
This is one of the most powerful and unique features of a strategy designed to survive and make a profit in the face of strong, protracted trends or "black swans".
* The problem it solves: The usual grid of orders has a limited depth. If the price goes beyond the last safety order, the strategy loses the opportunity to average and becomes vulnerable.
* The principle of operation: The MultiGRID function allows you to create "cascades" — several grids following one another. When all the orders of the first grid are executed, the strategy does not stop. Instead, she can activate the second, third (and so on) a grid of orders. The new grid can be activated by one of two triggers:
1. Offset: The new grid is activated when the price passes another set percentage deviation from the last executed order.
2. Signal: The new grid is activated when a signal is received from an external indicator.
* Goal: To significantly expand the working range of the strategy. This allows it to adapt to strong market movements that would "break" the usual grid, and continue to effectively average a position at a much greater depth of decline or growth.
5. Channel Mode — Trading in the range
This feature turns a standard averaging strategy into a machine for "farming" profits within a price channel that is formed during a sideways market movement.
* The problem it solves: In the standard grid strategy, after partially closing a take profit position, the volume of this part "leaves" the trade until the deal is fully closed. You are missing the opportunity to reuse this capital.
* Operating principle: When Channel Mode is enabled, the following happens. Suppose the price went against you, executed several safety orders, and then turned around and reached one of the partial take profits. At this point, the strategy is:
1. Fixes the profit, as it should be.
2. Instantly places a new limit order to buy (or sell for a short) at exactly the same price level where the last triggered safety order was executed. The volume of this order is equal to the volume of the part that was just closed for take profit.
3. If the price goes down again and executes this "repeat" order, the strategy immediately sets a corresponding take profit for it at the level where the previous profit was taken.
* Goal: To create a continuous buy-sell cycle within the local range (channel). The lower limit of the channel is the price of the last averaging, and the upper limit is the price of a partial take profit. This allows you to repeatedly profit from sideways price fluctuations, without waiting for the full closure of the main, large transaction.
6. LTF (Lower Timeframe Analysis) — Surgical precision of backtesting
This feature is critically important for obtaining reliable results during historical testing (backtesting) of grid strategies.
* The problem it solves: The standard testing mechanism in TradingView has a serious limitation. Working, for example, on a 4-hour chart, he sees only 4 candle points: Open, High, Low and Close. He does not know in what order the price moved within these 4 hours. He could have touched High first and then Low, or vice versa. For grid strategies, this is fatal — the engine can show that a take profit has been executed, although in reality the price first went down, collected the entire grid of orders and only then turned around.
* How it works: When you turn on the LTF mode, the strategy for each candle on your main chart (for example, 4H) requests and analyzes all candles from the lower timeframe you specified (for example, 1-minute). Then it virtually trades the entire price path for these minute candles, executing orders, take profits and stop losses in the sequence in which they would occur in reality. It works in the single take profit mode of the Grid strategy.
* Goal: To provide the most realistic and reliable backtest that reflects the real dynamics of the market. This allows you to avoid false expectations and accurately assess the potential performance of the strategy.
// ------------------------
Part 2: Detailed description of the strategy settings
This section is your main guide to all the switches and options available in the strategy. Understanding each setting is the key to unlocking the full potential of this powerful tool.
1. 🛡️ Risk Management 🛡️
This group contains fundamental parameters that determine the basic logic of risk management and the geometry of grid orders.
* Strategy type: Determines the direction of transactions.
* Long: The strategy will only open long positions (buy).
* Short: The strategy will only open short positions (sell).
* Both: The strategy will work both ways, opening long or short depending on the incoming signal.
* SO Count: Sets the maximum number of Safety (averaging) Orders (SO) that the strategy will place within the same grid. If you have MultiGRID enabled, this number applies to each individual grid.
* SO Step (%): This is the base percentage deviation from the entry price at which the first safety order will be placed. For example, at a value of 0.5, the first SO in a long trade will be placed 0.5% lower than the opening price of the base order.
* SO Multiplier: A coefficient that exponentially increases the step for each subsequent safety order. This allows you to create an expanding grid where averaging orders are placed further and further apart, which is effective with strong and accelerating price movements.
* *The step formula for the nth order*: Step(N) = (SO Step) * (SO Multiplier ^(N-1)).
* If the value is 1, all steps will be the same.
* With a value of 1.6, the step of the second SO will be 1.6 times larger than the first, the step of the third will be 1.6 times larger than the second, and so on.
* 1️⃣ TP/SL: These are simplified settings for quick configuration. They allow you to turn on/off the main take profit and stop loss and set basic percentage values for them. More detailed settings for these parameters can be found in the relevant sections below.
// ------------------------
2. 💰 Money Management 💰
Everything related to position size, leverage, and capital is configured here.
* Volume BO (Base Order): Determines the size of the trade's opening order.
* Volume BO: A fixed amount in the quote currency (for example, in USDT).
* USDT (check mark): Manages the information in the comments to the orders. If enabled, the volume of orders in USDT will be displayed in the comments. This is convenient for visual analysis and for sending the amount of USDT by the placeholder {{strategy.order.comment}} via webhooks when connecting the strategy to the exchange or trading terminals.
* or % of deposit: The amount calculated as a percentage of the available capital of the strategy. The check mark to the right of this field enables this mode. Important: using a percentage activates the effect of compounding (compound interest), as the amount of each new transaction will be automatically recalculated based on the current capital (initial capital + profit/loss). If enabled, the percentage of orders will be displayed in the comments. This is convenient for visual analysis and for sending percentages on the placeholder {{strategy.order.comment}} via webhooks when connecting the strategy to the stock exchange, trading terminals, or creating Copy trading.
* Martingale: The coefficient applied to the volume of orders. It increases the size of each subsequent insurance order compared to the base one.
* Volume formula for the nth SO: Volume SO (N) = (Volume BO) * (Martingale^N).
* With a value of 1.2, the volume of the first SO will be 1.2 times greater than the base, the second — 1.44 times (`1.2 * 1.2`) and so on.
* Leverage: Specify the size of your leverage. This parameter is used exclusively for calculating and displaying the approximate liquidation price. It does not affect the size of positions, but it helps to visually assess the risks.
* Liquidation: Enables or disables the calculation and display of the liquidation line on the chart.
* Margin type: Allows you to select a method for calculating the liquidation price, simulating the logic of exchanges:
* Isolated: The liquidation price is calculated based on the size and leverage of the current open position only.
* Cross: The calculation simulates using the entire available balance to maintain a position. In the strategy, the liquidation price is calculated as the level at which the loss on the current transaction is equal to the current capital.
* Commission (%): Specify the percentage of your exchange's commission per transaction. The correct value of this parameter is crucial for obtaining realistic backtest results.
// ------------------------
3. 🕸️ Grid Management 🕸️
This group is responsible for the logic of safety orders and advanced mechanics such as Channel Mode and MultiGRID.
* SO Type: Defines the logic of placing averaging orders.
* GRID: Classic grid. All safety orders are placed in advance as limit orders.
* DCA: Signal averaging. The strategy is waiting for a signal from an external indicator to place a market averaging order.
* GRID+DCA: Hybrid. The strategy waits for a signal, and if it arrives, places a limit order at the appropriate price level of the grid or executes a market order if the signal has arrived below the limit order level.
* Signal for SO: A data source (indicator) that will be used for signals in DCA and GRID+DCA modes.
* ↔️ Channel Mode: When this option is enabled, the strategy tries to trade in a sideways range. After partially closing a take profit position, it immediately places a limit order for re-entry at the price of the last triggered safety order. This creates a buy-sell cycle within the local channel.
* Best Price Only: This filter adds an additional condition for averaging in DCA and MultiGRID modes (when it operates on a signal). The next averaging order or a new grid will be activated only if the current price is more favorable (lower for long, higher for short) than the price of the previous entry.
* 🧩 MultiGRID ⮕ Enables cascading grid mode.
* Grid Count: The total number of grids that can be activated sequentially.
* Offset: Percentage deviation from the price of the last order of the previous grid. When this margin is reached, the following grid of orders is activated (this mode does not require a signal).
* Or signal: Allows you to use the signal from an external indicator as a trigger to activate the next grid. The checkmark on the right turns on this mode.
// ------------------------
4. 🎯 Entry and Stop 🎯
This group of settings allows you to fine-tune the conditions for starting a new trade and all aspects related to protective stop orders, including the complex mechanics of trailing and managing SL after partial take profits.
* 🎯 Signal: A data source (indicator) that will be used to determine when to enter a trade. The strategy expects a value of 1 for the start of a long trade and -1 for a short trade.
* Min Bars: Sets the minimum number of candles that must pass from the moment of opening the previous trade to the moment of opening the next one. A value of 0 disables this filter. This is a useful tool to prevent overly frequent entries in a "noisy" market.
* Non-stop: If this option is enabled, the strategy ignores the Entry Signal and opens a new trade immediately after closing the previous one (taking into account the Min Bars filter, if it is set). This turns the strategy into a constantly working mechanism that is always on the market.
* 🛑 SL Type: Defines the base price from which the stop loss percentage will be calculated. The stop loss in the first section must be enabled for this block of settings to work.
* From the entry point: SL is always calculated from the opening price of the very first base order. It remains static throughout the entire transaction unless it is moved by other functions.
* From breakeven line: SL is dynamically recalculated and shifted each time a safety order is executed. It always follows the average price of the position, being at a given percentage distance from it.
* From last executed SO: SL is recalculated from the price of the last executed order, whether it is a base or a safety order.
* From last SO: SL is calculated from the price of the most recent possible safety order in the grid. This is usually the most remote and conservative type of SL.
* Trailing SL Type: Defines the algorithm by which the stop loss will move after its activation.
* Standard: Classic trailing. After activation, SL will follow the price at a fixed distance.
* ATR: SL will follow the price at a distance equal to the value of the ATR indicator multiplied by the specified multiplier.
* External Source: SL will follow any selected line of the third-party indicator.
* Period and Multiplier: Common parameters for all types of trailing.
* Source: The source of the line for the trailing SL of the third-party indicator.
* Trailing SL after entry: The mode of activation of the trailing SL after entering the transaction
* SL management after TP (sections 1️⃣, 2️⃣, 3️⃣): These three blocks allow you to create a complex stop loss management logic as profits are recorded.
For each take profit level (TP1, TP2, TP3), you can configure:
* SL BE / SL TP1 / SL TP2: When the corresponding TP is reached, the stop loss will be moved to the breakeven point (for TP1), to the TP1 price level (for TP2) or to the TP2 price level (for TP3).
* Trailing SL: When the corresponding TP is reached, the trailing stop loss is activated according to the settings above.
* By ↔️ Signal: A very powerful option. If it is enabled, the above action (SL transfer or trailing activation) will occur when the opposite trading signal is received from an external indicator. This allows you to protect profits or reduce losses if the market turns sharply, even before reaching the target.
* SL Delay ⮕ Allows you to delay the activation of the stop loss.
* Number of Bars: The Stop loss will be physically placed on the market only after the specified number of candles has passed since entering the trade. This can help to avoid "taking out" the stop with a random short movement (squiz) immediately after opening a position.
* SL Block: Unique defensive mechanics for trading both ways (`Strategy Type: Both`).
* Number of SL: If the strategy receives the specified number of stop losses in a row in one direction (for example, 2 stops long), it temporarily blocks the opportunity to open new trades in that direction.
* Lock Reset mode:
* By direction: The lock is lifted if a profitable trade is closed in the allowed direction or if a stop loss is triggered in the opposite direction.
* First profit: The lock is lifted after closing any profitable transaction, regardless of its direction.
// ------------------------
5. ✅ Take Profit ✅
This group of settings provides comprehensive control over profit taking, from a simple take profit to a complex system of partial closures and trailing.
* ✅ TP Type: Defines the base price for calculating the percentage deviation of the take profit.
* From entry point: TP is calculated from the base order price.
* From breakeven line: TP dynamically follows the average position price.
* From last executed SO: TP is calculated from the price of the last executed order.
* Filters for closing on signal
* Only ➕: If TP is triggered by a signal, the deal will be closed only if it is in the black relative to the average price.
* Or >TP: If TP is triggered by a signal, the trade will be closed only if the closing price is better than (or equal to) the estimated price of this TP.
* TP type of trailing: Yes, take profit has a trailing too! It works differently than the SL trailing.
* Standard / ATR: After the price touches the "virtual" TP level, the trailing is activated. He does not place a stop order, but begins to move away from the price, dynamically moving the limit order to close further and further in the profitable direction, allowing him to collect the maximum from the impulse movement.
* External Source: TP will follow any selected line of the third-party indicator.
* Period and Multiplier: Parameters for calculating the trailing margin TP.
* Source: The source of the line for the trailing TP of the third-party indicator.
* TP level settings (sections 1️⃣, 2️⃣, 3️⃣, 4️⃣): The strategy supports up to four independent take profit levels, which allows for a flexible system of partial commits.
For each level, you can set:
* TP: Enable the level and set its percentage deviation from the base price.
* Size: What percentage of the current position will be closed when this level is reached. For the last active TP, this parameter is ignored, and 100% of the remaining position is closed.
* Trailing TP: Enable the above-described trailing mechanism for this particular level.
* Signal: Enable closing based on the signal from the external indicator for this level.
* Or take: If both the closing on the signal and the limit order are enabled, then whatever comes first will work.
* After SO: Activate this TP level only after the specified number of safety orders has been executed. This allows you to set closer targets for riskier (deeply averaged) positions.
// ------------------------
6. 🔬 GRID and MultiGrid Analysis on Lower TFs (LTF) 🔬
This group activates one of the most important functions for accurate testing of grid strategies.
* Enable LTF Calculation ⮕ The main switch of the analysis mode on the lower timeframes.
* Timeframe selection: A drop-down list where you can select a timeframe for detailed analysis. For example, if your main schedule is 1 hour, you can select 1 minute here. The strategy will emulate the trading of minute candles within each hour candle.
❗️Important: As mentioned in the first part, the use of this mode is critically necessary to obtain realistic backtest results, especially for strategies with a dense grid of orders. Without it, the results may be overly optimistic and not reflect the real dynamics of the market. It should be remembered that TradingView imposes a limit on the number of intra-bars (minor TF bars) that can be requested. This is usually about 100,000 bars.
// ------------------------
7. 🕘 Backtest Date Range 🕘
This group allows you to focus testing on a specific historical period.
* Limit Date Range: Enables date filtering.
* Start time: The date and time when the strategy will start analyzing and opening deals.
* End time: The date and time after which the strategy will stop opening new deals and complete testing.
// ------------------------
8. 🎨 Visualization 🎨
All the options responsible for the appearance and information content of the chart are collected here.
* Show PnL labels: Enables/disables the display of text labels with the result (profit/loss) after closing each trade.
* Statistics Table: Enables/disables the main dashboard with detailed statistics on the results of the backtest.
* Strategy Settings Table: Enables/disables an additional panel that summarizes all the key parameters of the current configuration.
* Monthly Profit Table: Enables/disables a table with a breakdown of percentage returns by month and year.
* Table settings: For each of the three tables, you can individually adjust the Text size and Table Position on the screen to position them as conveniently as possible.
* Decimal places: Defines how many decimal places will be displayed in numeric values in tables and on labels.
// ------------------------
9. ✉️ Webhook Settings ✉️
This group is intended for traders who want to automate trading on strategy signals using third-party services and exchanges (for example, 3Commas, WunderTrading, Cryptorobotics, Cryptohopper, Bitsgap, Binance, ByBit, OKX, Pionex, Bitget or proprietary solutions).
For each key event in the strategy, there is a separate switch and a text field:
* Webhook for Open: Enable and set a message for the webhook that will be sent when the base order is opened.
* Webhook for Averaging: A message sent when executing any insurance order.
* Webhook for Take Profit: A message sent when closing on take profit (including partial ones).
* Webhook for Stop-Loss: A message sent when a stop loss is closed.
You can insert a JSON code or any other message format that your service requires for automation into the text fields. The strategy supports special placeholders (for example, `{{strategy.order.alert_message}}`), which allow you to dynamically insert the necessary data into the message, such as the amount of USDT or the percentage of the deposit for entry, averaging and take profit orders.

Valid H/L Strategy Tester with MFE/MAE Analytics
## Overview
A data-driven trading indicator that identifies valid high/low price levels and provides statistical insights through Maximum Favorable Excursion (MFE) and Maximum Adverse Excursion (MAE) analytics. Make informed trading decisions based on historical price behavior rather than guesswork.
## Key Features
### 🎯 Smart Pattern Recognition
- Automatically detects valid highs and lows with confirmation system
- Color-coded candles and lines for clear visual identification
- Inside/Outside print filtering for higher probability setups
### 📊 Statistical Analytics
- Analyzes up to 500 historical setups for MFE/MAE calculations
- 1-hour and 3-hour timeframe data with percentile-based targets (20th, 50th, 80th)
- Real-time performance tracking with comprehensive statistics table
### ⚙️ Flexible Strategy Options
**Entry Methods:** Confirmation-based or MAE percentile entries
**Take Profit:** MFE-based, fixed points, percentage, or R:R ratio targets
**Risk Management:** Multiple stop loss types with position sizing controls
### 🕐 Advanced Time Filtering
- Session filters (Asia, London, New York)
- Individual hourly controls (24-hour precision in ET)
- Pre-configured for optimal NY trading hours (9 AM - 2 PM)
### 📈 Visual Dashboard
- MFE target lines (blue) and MAE risk lines (orange)
- Customizable colors, styles, and line weights
- Statistics table showing daily/hourly/weekly performance breakdowns
## How It Works
1. **Pattern Detection** - Scans for valid high/low formations using price structure and gap behavior
2. **Statistical Analysis** - Calculates historical MFE/MAE percentiles from past setups
3. **Trade Framework** - Executes entries/exits based on your configuration with real-time performance tracking
## Ideal For
- **Day/Swing Traders** seeking data-driven entry/exit levels
- **Risk Managers** wanting historical drawdown data for stop placement
- **Performance Trackers** needing detailed analytics across timeframes and sessions
- **Flexible Strategies** - adapts to scalping, day trading, or swing trading styles
## Quick Setup
1. Select analysis timeframe (default: 5-minute)
2. Choose entry method and exit strategy
3. Enable MFE/MAE analytics display
4. Apply session/hourly filters
5. Customize visual elements and table settings
Transform your trading from guesswork to statistical precision with historical price behavior insights.

Mutanabby_AI | ATR+ | Trend-Following StrategyThis document presents the Mutanabby_AI | ATR+ Pine Script strategy, a systematic approach designed for trend identification and risk-managed position entry in financial markets. The strategy is engineered for long-only positions and integrates volatility-adjusted components to enhance signal robustness and trade management.
Strategic Design and Methodological Basis
The Mutanabby_AI | ATR+ strategy is constructed upon a foundation of established technical analysis principles, with a focus on objective signal generation and realistic trade execution.
Heikin Ashi for Trend Filtering: The core price data is processed via Heikin Ashi (HA) methodology to mitigate transient market noise and accentuate underlying trend direction. The script offers three distinct HA calculation modes, allowing for comparative analysis and validation:
Manual Calculation: Provides a transparent and deterministic computation of HA values.
ticker.heikinashi(): Utilizes TradingView's built-in function, employing confirmed historical bars to prevent repainting artifacts.
Regular Candles: Allows for direct comparison with standard OHLC price action.
This multi-methodological approach to trend smoothing is critical for robust signal generation.
Adaptive ATR Trailing Stop: A key component is the Average True Range (ATR)-based trailing stop. ATR serves as a dynamic measure of market volatility. The strategy incorporates user-defined parameters (
Key Value and ATR Period) to calibrate the sensitivity of this trailing stop, enabling adaptation to varying market volatility regimes. This mechanism is designed to provide a dynamic exit point, preserving capital and locking in gains as a trend progresses.
EMA Crossover for Signal Generation: Entry and exit signals are derived from the interaction between the Heikin Ashi derived price source and an Exponential Moving Average (EMA). A crossover event between these two components is utilized to objectively identify shifts in momentum, signaling potential long entry or exit points.
Rigorous Stop Loss Implementation: A critical feature for risk mitigation, the strategy includes an optional stop loss. This stop loss can be configured as a percentage or fixed point deviation from the entry price. Importantly, stop loss execution is based on real market prices, not the synthetic Heikin Ashi values. This design choice ensures that risk management is grounded in actual market liquidity and price levels, providing a more accurate representation of potential drawdowns during backtesting and live operation.
Backtesting Protocol: The strategy is configured for realistic backtesting, employing fill_orders_on_standard_ohlc=true to simulate order execution at standard OHLC prices. A configurable Date Filter is included to define specific historical periods for performance evaluation.
Data Visualization and Metrics: The script provides on-chart visual overlays for buy/sell signals, the ATR trailing stop, and the stop loss level. An integrated information table displays real-time strategy parameters, current position status, trend direction, and key price levels, facilitating immediate quantitative assessment.
Applicability
The Mutanabby_AI | ATR+ strategy is particularly suited for:
Cryptocurrency Markets: The inherent volatility of assets such as #Bitcoin and #Ethereum makes the ATR-based trailing stop a relevant tool for dynamic risk management.
Systematic Trend Following: Individuals employing systematic methodologies for trend capture will find the objective signal generation and rule-based execution aligned with their approach.
Pine Script Developers and Quants: The transparent code structure and emphasis on realistic backtesting provide a valuable framework for further analysis, modification, and integration into broader quantitative models.
Automated Trading Systems: The clear, deterministic entry and exit conditions facilitate integration into automated trading environments.
Implementation and Evaluation
To evaluate the Mutanabby_AI | ATR+ strategy, apply the script to your chosen chart on TradingView. Adjust the input parameters (Key Value, ATR Period, Heikin Ashi Method, Stop Loss Settings) to observe performance across various asset classes and timeframes. Comprehensive backtesting is recommended to assess the strategy's historical performance characteristics, including profitability, drawdown, and risk-adjusted returns.
I'd love to hear your thoughts, feedback, and any optimizations you discover! Drop a comment below, give it a like if you find it useful, and share your results.

Backtest - Strategy Builder [AlgoAlpha]🟠 OVERVIEW
This script by AlgoAlpha is a modular Strategy Builder designed to let traders test custom trade entry and exit logic on TradingView without writing their own Pine code. It acts as a framework where users can connect multiple external signals, chain them in sequences, and run backtests with built-in leverage, margin, and risk controls. Its main strength is flexibility—you can define up to five sequential steps for entry and exit conditions on both long and short sides, with logic connectors (AND/OR) controlling how conditions combine. This lets you test complex multi-step confirmation workflows in a controlled, visual backtesting environment.
🟠 CONCEPTS
The system works by linking external signals —these can be values from other indicators, and/or custom sources—to conditional checks like “greater than,” “less than,” or “crossover.” You can stack these checks into steps , where all conditions in a step must pass before the sequence moves to the next. This creates a chain of logic that must be completed before a trade triggers. On execution, the strategy sizes positions according to your chosen leverage mode ( Cross or Isolated ) and allocation method ( Percent of equity or absolute USD value]). Liquidation prices are simulated for both modes, allowing realistic margin behaviour in testing. The script also tracks performance metrics like Sharpe, Sortino, profit factor, drawdown, and win rate in real time.
🟠 FEATURES
Up to 5 sequential steps for both long and short entries, each with multiple conditions linked by AND/OR logic.
Two leverage modes ( Cross and Isolated ) with independent long/short leverage multipliers.
Separate multi-step exit triggers for longs and shorts, with optional TP/SL levels or opposite-side triggers for flipping positions.
Position sizing by equity percent or fixed USD amount, applied before leverage.
Realistic liquidation price simulation for margin testing.
Built-in trade gating and validation—prevents trades if configuration rules aren’t met (e.g., no exit defined for an active side).
Full performance dashboard table showing live strategy status, warnings, and metrics.
Configurable bar coloring based on position side and TP/SL level drawing on chart.
Integration with TradingView's strategy backtester, allowing users to view more detailed metrics and test the strategy over custom time horizons.
🟠 USAGE
Add the strategy to your chart. In the settings, under Master Settings , enable longs/shorts, select leverage mode, set leverage multipliers, and define position sizing. Then, configure your Long Trigger and Short Trigger groups: turn on conditions, pick which external signal they reference, choose the comparison type, and assign them to a sequence step. For exits, use the corresponding Exit Long Trigger and Exit Short Trigger groups, with the option to link exits to opposite-side entries for auto-flips. You can also enable TP and/or SL exits with custom sources for the TP/SL levels. Once set, the strategy will simulate trades, show performance stats in the on-chart table, and highlight any configuration issues before execution. This makes it suitable for testing both simple single-signal systems and complex, multi-filtered strategies under realistic leverage and margin constraints.
🟠 EXAMPLE
The backtester on its own does not contain any indicator calculation; it requires input from external indicators to function. In this example, we'll be using AlgoAlpha's Smart Signals Assistant indicator to demonstrate how to build a strategy using this script.
We first define the conditions beforehand:
Entry :
Longs – SSA Bullish signal (strong OR weak)
Shorts – SSA Bearish signal (strong OR weak)
Exit
Longs/Shorts: (TP/SL hit OR opposing signal fires)
Other Parameters (⚠️Example only, tune this based on proper risk management and settings)
Long Leverage: default (3x)
Short Leverage: default (3x)
Position Size: default (10% of equity)
Steps
Load up the required indicators (in this example, the Smart Signals Assistant).
Ensure the required plots are being output by the indicator properly (signals and TP/SL levels are being plotted).
Open the Strategy Builder settings and scroll down to "CONDITION SETUP"; input the signals from the external indicator.
Configure the exit conditions, add in the TP/SL levels from the external indicator, and add an additional exit condition → {{Opposite Direction}} Entry Trigger.
After configuring the entry and exit conditions, the strategy should now be running. You can view information on the strategy in TradingView's backtesting report and also in the Strategy Builder's information table (default top right corner).
It is important to note that the strategy provided above is just an example, and the complexity of possible strategies stretches beyond what was shown in this short demonstration. Always incorporate proper risk management and ensure thorough testing before trading with live capital.
Paid script

Spread Mean Reversion Strategy [SciQua]╭───────────────────────────────────────╮
Spread Mean Reversion Strategy
╰───────────────────────────────────────╯
This invite-only futures spread strategy applies a statistical mean reversion framework, executing limit orders exclusively at calculated Z-score thresholds for precise, rules-based entries and exits. It is designed for CME-style spreads and synthetic instruments with well-defined reversion tendencies.
╭────────────╮
Core Concept
╰────────────╯
The strategy calculates a rolling mean and standard deviation of a chosen spread or synthetic price series, then computes the Z-score to measure deviation from the mean in standard deviation units.
Long entries trigger when Z crosses upward through a negative entry threshold (`-devEnter`). A buy limit is placed exactly at the price corresponding to that Z-score, optionally offset by a configurable tick amount.
Short entries trigger when Z crosses downward through a positive entry threshold (`+devEnter`). A sell limit is placed at the corresponding threshold price, also with optional offset.
Exits use the same threshold method, with an independent `Close Limit Offset` to fine-tune exit placement.
╭────────────╮
Key Features
╰────────────╯
Persistence filter – Requires the Z-score to remain beyond threshold for a configurable number of bars before entry.
Cooldown after exits – Prevents immediate re-entry to reduce over-trading.
Daily and weekend flattening – Force-flattens positions via limit orders before exchange maintenance breaks and weekend closes.
Auto-rollover detection with persistence – Detects when the second contract month’s daily volume exceeds the first for a set number of days, then blocks new entries (optional).
Configurable tick offsets – Independently adjust entry and exit levels relative to threshold prices.
Minimum spread width filter – Blocks trades when long/short entry thresholds are too close together.
Contract multiplier override – Allows correct sizing for synthetic symbols where `syminfo.pointvalue` is incorrect or missing.
Limit-only execution – All entries, exits, and forced-flat actions are executed with limit orders for price control.
╭────────────────────╮
Entry Blocking Rules
╰────────────────────╯
New trades are blocked:
During daily maintenance break pre-windows
During weekend close pre-windows
After rollover triggers, if `Block After Roll` is enabled
╭────────────────────────╮
Intended Markets & Usage
╰────────────────────────╯
Built for futures spreads and synthetic instruments , including calendar spreads.
Performs best in markets with clear seasonal or statistical mean-reverting tendencies.
Not designed for strongly trending, non-reverting markets.
╭──────────────────────────╮
Risk Management & Defaults
╰──────────────────────────╯
Fixed default position size of 1 contract (qty calc function available for customization).
Realistic commission and slippage assumptions pre-set.
Pyramiding disabled by default.
Default Z-score levels: Entry at ±2.0, Exit at ±0.5.
Separate tick offset controls for entries and exits.
Note: This strategy is for research and backtesting purposes only. Past performance does not guarantee future results. All use is subject to explicit written permission from the author.

POCTraderX Pro— Structure & Precision Algorithm POCTraderX Pro is a market analysis system designed to accurately identify key interest zones and price turning points. It combines advanced Price Action reading with a dynamic filtering process that adapts signals according to market volatility and internal structure.
Methodology
The algorithm analyzes the sequence of relevant highs and lows (HH, HL, LL, LH) along with the price location in relation to Point of Control levels and consolidation ranges.
It uses multi–timeframe confirmations to filter out false breakouts and optimize trade entries.
In high–volatility conditions, it automatically adjusts validation levels to maintain a favorable risk/reward ratio.
Configuration
Recommended timeframes: from 1–minute to daily, depending on the trading style.
Applicable markets: indices, forex, commodities, and cryptocurrencies.
Adjustable parameters:
Structure detection sensitivity.
Enable/disable volatility filters.
Show/hide control zones and previous ranges.
Purpose
Provide a clear reading of market structure and critical zones to help traders execute trades with greater consistency and avoid entries in low–probability areas.
Important Notes
This script is closed–source to protect its internal methodology, but it is based on an original combination of structural analysis and zone validation not available in free indicators.
It does not produce automatic buy or sell signals without context; it is intended to be integrated into a complete trading strategy.
Backtest [OptAlgo]This backtest script is designed to convert ideas or indicators into backtest results. The script creates buy/sell signals by comparing price sources against fixed values or other imported plots using many comparison methods. It has many features including multiple exit systems: TP/SL, custom plot-based stops and more. It supports full trading automation through webhook alerts with live signal processing.
🔢 Signal Creation System
→ Values Group : Compare price sources against fixed numerical values
→ Plots Group : Compare two different price sources/indicators against each other
→ Flexible Comparisons : 15+ comparison methods (equal, crossover, rising...)
→ Signal Types : Long, Short, Close All, Block signals, and combination signals
→ Merge Rules : Minimum condition requirements for signal activation
🔀 Advanced Signal Logic
→ Counter Signals : Choose between reversing positions or closing them
→ Signal Inversion : Flip all buy/sell signals with one toggle
→ External Signal Import : Import coded signals (1=Long, -1=Short, 0=Close)
→ Day Blocker : Enable/disable trading on specific weekdays
→ Session Control : Limit trading to specific market sessions
⚙️ Strategy Settings
→ Position Sides : All Ways, Long Only, or Short Only modes
→ Signal Control : Individual enable/disable for long and short signals
→ Counter Signal Mode : Reverse Open Position vs Close Open Position
→ Signal Reversal : Global signal inversion capability
🔰 Risk Management (Limiter Settings)
→ Leverage Control : Leverage with liquidation warnings
→ Drawdown Limit : Auto-halt strategy at specified drawdown percentage
→ Tradable Ratio : Use portion of available balance (0.01-1.0)
→ Contract Limit : Cap maximum contract size regardless of balance
🎯 TP/SL System
→ Fixed TP/SL : Set percentage-based take profit and stop loss
→ Custom Plot Stops : Use any indicator/plot as dynamic stop loss
→ ATR-Based Exits : Volatility-adjusted TP/SL using Average True Range
→ Realistic Protection : Prevents unrealistic TP/SL prices in live trading
→ Stop Modes : Instant (Sudden) vs Candle Close execution
→ ATR Stop Loss : Override fixed SL with volatility-based calculations
→ ATR Take Profit : Dynamic TP based on market volatility
→ Trailing Options : Safe, Normal, or Aggressive trailing methods
→ Calculation Modes : Normal, Volume-weighted, or Limited (with max %) options
→ Volume Integration : ATR levels adjust based on volume influx
🤖 Automation & Alerts
→ Webhook Integration : Send JSON alerts for automated execution
→ Live Signals : Real-time signal processing (every tick vs bar close)
→ Strategy Key : Unique identifier for automated systems
→ Early Entry : Send alerts X seconds before candle close
→ Fast Execution : Prevent signal lag in automated trading
🐞 Development Tools
→ Alert Plotting : Visualize signals directly on chart (disable for live alerts)
→ Professional Mode : Remove UI controls for faster calculation
→ Debug : Metrics are plotted in data window.
📊 Key Advantages
→ Multi-Condition Logic : Combine multiple indicators with flexible rules
→ Risk-First Design : Built-in drawdown and leverage protection
→ Automation Ready : Full webhook and alert system integration
⚠️ Important Warnings
→ High leverage combined with high SL may adjust to liquidation price
→ Use consistent leverage across all strategies on same trading isolated margin pair
→ Live signals require "Calculate on every tick" enabled in settings
→ Disable alert plotting when creating actual alerts to prevent latency
