[astropark] Stops huntingDear Followers,
today I'm happy to share with you my Stops Hunting indicator.
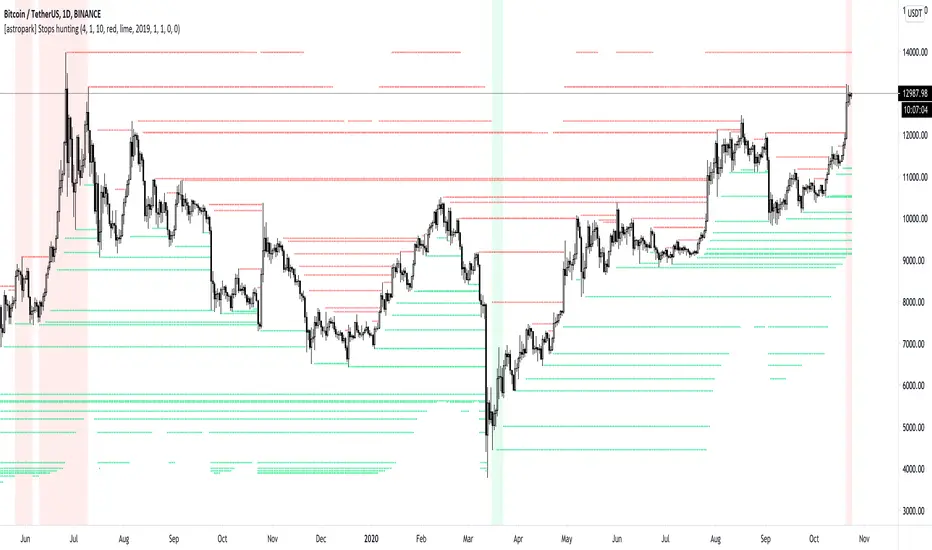
This indicators draws lines on important levels, where traders are supposed to set their own stop loss orders .
As per default values you will see
sellers (short) stoploss prices as red lines
buyers (long) stoploss prices as green lines
Market maker move prices towards liquidity, so to hit common traders stoplosses.
Why it acts this way? because stoplosses become fuel for market maker to move price where it wants to, and after latest stoplosses were triggered, then it uses this fuels to make trend reverse to the opposite direction.
To highlight this mechanism, the indicator plots:
red background when there are (almost) no-more sellers' stop losses still to be hit, so the trader can start thinking about opening a sell/short position ,
green background when there are (almost) no-more buyers' stop losses still to be hit, so the trader can start thinking about opening a buy/long position .
This indicator:
works on every timeframe , so it can be used for both swing and scalping trades
has a bias filter to increase or decrease the bullish/bearish backgrounded ranges (the higher the value, the less the width of ranges)
lets you change colours as you like
lets you enable/disable plotting of lines
lets you change lines' thickness and transparency
lets you enable/disable plotting of circles whenever a stoploss is hit
lets you set a starting date/time from which you want the indicator to start its analysis and collecting data for stops hunting
lets you set alerts when a stoploss has been hit/hunted
lets you set alerts when background starting be coloured as explained above
A gentle reminder: always consider setting a stoploss in trades and use a proper money and risk management strategies .
Here there are some examples how the indicator works on many timeframes and markets:
BTC/USDT 1h
LINK/BTC 1h
ETH/BTC 1h
EUR/USD 15m
GBP/USD
Brent Crude Oil 15m
GOLD (XAU/USD) 15m
FaceBook (FB) 15m
Microsoft Corp (MSFT) 15m
This is a premium indicator , so send me a private message in order to get access to this script .
Stophunt
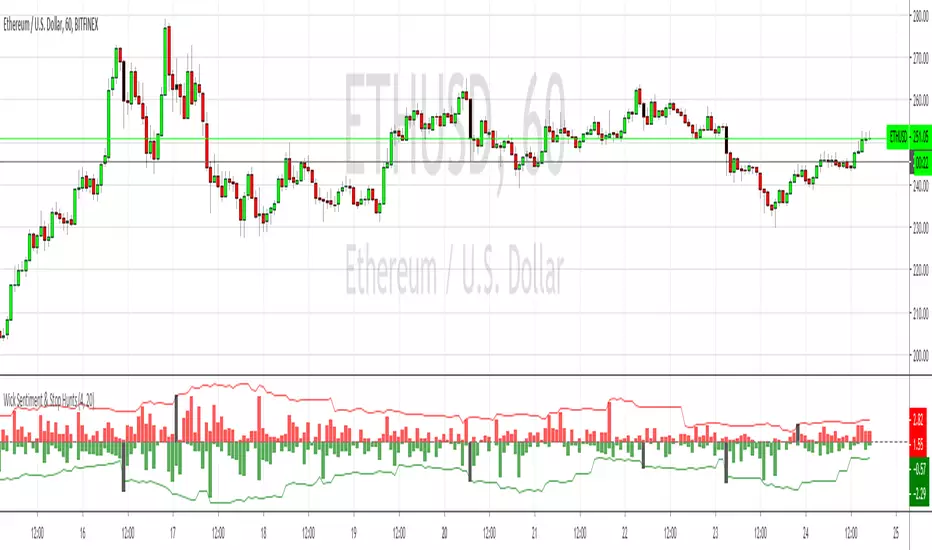
Wick Sentiment & Stop HuntsTakes the length of the wicks on the tops and bottoms of each candle and plots them on their own to reduce the noise and to give an idea of whether the bulls or bears are being more insistent about direction.
It also highlights the more aggressive wicks in black, which can be used to identify stop hunting if used in conjunction with support/resistance levels.
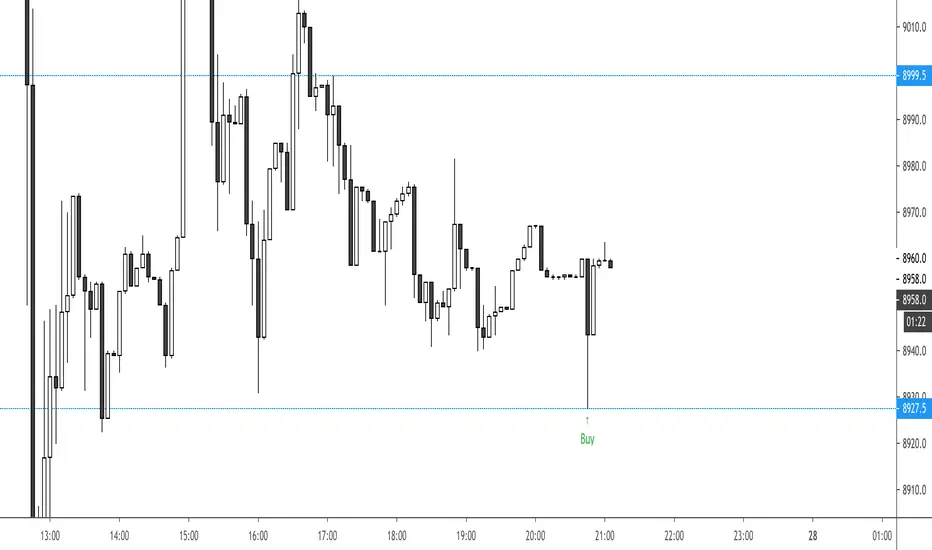
BullTrading Intraday StopHunt Indicator Phycologically traders tend to sell on lows and buy on highs. BullTrading Intraday StopHunt Indicator is designed to help you avoid such situations by monitoring the market for intraday trading setups.
The indicator plots a "Fractal Envelope © " containing the most significant Support and Resistance levels for analysis and entry level selection.
Trend filtering is provided by a MTF P-SAR (SAR will avoid repainting false signals).
The BullTrading Chaos Trend Wave is used instead the Alligator to trade fractals.
BullTrading Intraday StopHunt Indicator will provide 3 types of signals:
First one is a swing/intraday signal, it will alert you when the price is located at a very sensitive level (buy or sell) filtered by trend. If you check the indicator after the close of the day you can even know this exact level in advance (plot Red or Lime color).
Second signal will alert you the Chaos Trend Wave Moving Average Crossovers filtered by price position (related to the Fractal Envelope) and mayor trend.
Third signal is a scalping signal, it will alert you all the fractal breakouts filtered by price position (related to the Fractal Envelope) and mayor trend.
You will be amazed the huge amount of trade opportunities for a given week trading only one financial instrument.
Obviously the indicator is not perfect and will plot few false signals on mayor trend reversals or big price manipulations. AVOID THE TRAP BY WAITING THE PRICE USING BUY LIMIT AND SELL LIMIT ORDERS.
NOTE: This indicator works on any timeframe, but standard settings are calibrated for 15' charts.
