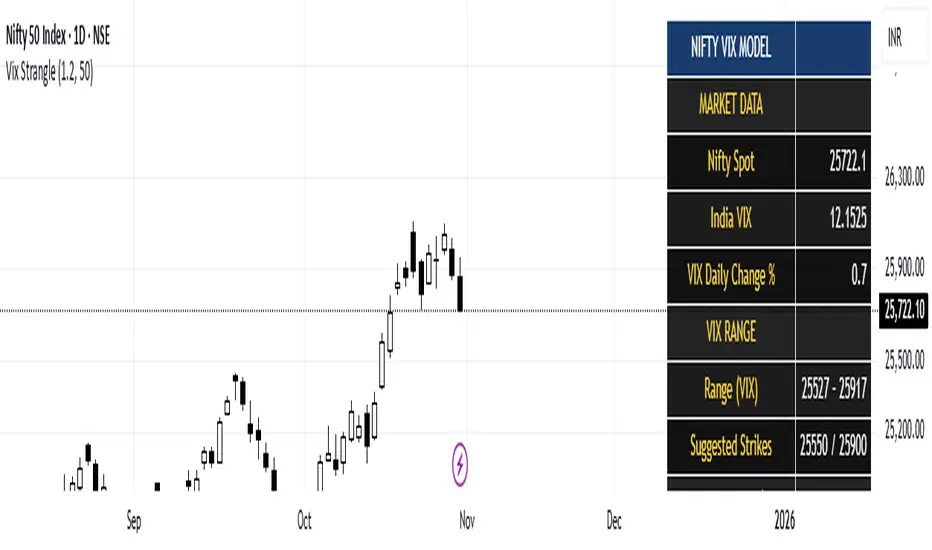
India Vix based Strangle StrikesA clean Nifty–VIX dashboard that converts India VIX into expected daily moves, price ranges, and suggested strangle strikes. Includes VIX %, expanded 1.2× range, and smart rounded strike levels for options trading.
This script provides a professional on-chart dashboard that converts India VIX into actionable trading levels for Nifty. It calculates the VIX-based expected daily move, projected price ranges, expanded 1.2× ranges, and suggested strangle strike prices. Includes clean formatting, color-coded sections, and real-time updates.
Ideal for traders using straddles, strangles, intraday volatility models, range-bound setups, and options-based risk management.
1.2x expanded range is better success probability, may keep 20% of strangle value as stop loss.
The vix based system is intended to give approx. 70%+ success rate.
Strangle
Multi Straddle-Strangle ChartThis powerful indicator is designed for options traders who want to visualize and track the combined premium of multiple straddle and strangle strategies in a single, dedicated pane.
Quickly analyze and compare up to five different options strategies at a glance, directly on your chart. This tool is perfect for monitoring volatility, tracking potential profits/losses on a position, and spotting key support and resistance levels based on option premiums.
Key Features:
Plot Up to 5 Strategies: Simultaneously plot any combination of up to 5 straddles or strangles.
Real-Time Data: Fetches live data for both Call and Put options to give you an up-to-the-second view of the combined price.
Dynamic Symbol Generation: Automatically detects the underlying symbol (e.g., NIFTY, BANKNIFTY, stocks) and builds the correct option symbols based on your input.
Customizable Inputs: Easily configure the expiry date, strike prices and line colors for each of the 5 lines.
In-Chart Summary Table: A clean and clear table in the corner of your chart provides a quick summary of each enabled strategy and its current price.
Important Note on Usage:
This tool requires you to input a strike price in all fields, even if you do not plan to use all five lines. This is necessary because of a fundamental rule in the Pine Script language: every input must have a constant, non-empty default value. The indicator is optimized to only fetch data for the lines you have explicitly enabled with the "Enable Line X" checkbox.

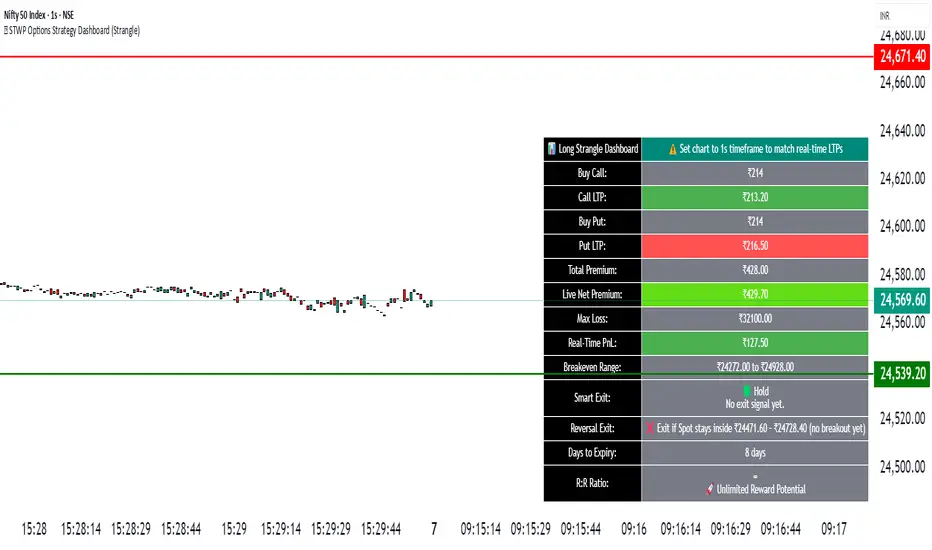
🧠 STWP Options Strategy Dashboard (Strangle)________________________________________
🧠 STWP Options Strategy Dashboard (Long/Short Strangle)
Author: simpletradewithpatience
Markets: NSE (India)
Best timeframe: 1-second chart
Built with: Pine Script v5
________________________________________
📌 Overview
A real-time options strategy dashboard tailored for NSE Strangles:
✅ Long Strangle → Buy OTM CE + Buy OTM PE
✅ Short Strangle → Sell OTM CE + Sell OTM PE
This tool offers a tick-by-tick visual dashboard to monitor:
Live premiums, PnL, breakeven levels, expiry decay, and Greeks.
It is designed **for manual use only** — no trade automation.
Ideal for strategy tracking, education, and decision support.
________________________________________
📌 Key Features
✅ Long & Short Strangle support
✅ Real-time tracking of CE & PE legs (LTPs, PnL, Premium)
✅ Max Loss / Profit calculator
✅ Breakeven range calculator
✅ Risk:Reward verdict (dynamic logic)
✅ Smart Exit logic with trade-specific warnings
✅ Reversal Exit logic based on spot compression
✅ Optional manual Greeks input (Delta, Gamma, Theta, IV)
✅ Greek-based bias: Bullish / Bearish / Neutral
✅ Days to Expiry (DTE) calculator
✅ Clean dashboard UI (emoji-labeled)
✅ Built for Indian NSE Options
✅ Designed to run on **1-second chart only**
________________________________________
📌 Option Symbol Inputs (LTP Tracking)
✅ Call Symbol: OTM CE (above spot)
✅ Put Symbol: OTM PE (below spot)
🎯 Symbol Tips: Use NSE format like `NSE:RELIANCE25JUL3050CE` and `PE`
⚠️ Valid option symbols are critical for accurate PnL tracking
________________________________________
📌 Strategy Parameters
- Call & Put Strike Prices
- Buy/Sell Premiums for both legs
- Lot Size & Number of Lots
- Loss Bearable Amount (₹)
- Expiry Date & Time (used for DTE tracking)
________________________________________
📌 Smart Exit Logic
🧠 A dynamic assistant that checks:
✅ Profit Target Hit
❌ Loss Threshold Breach
⏳ Expiry nearing with no breakout
🟡 Partial Profit Zone
📉 Guides the trader to avoid emotional decisions.
All messages are suggestive only — no trade recommendations.
________________________________________
📌 Reversal Exit Logic (Strangle Specific)
🔁 Detects if spot is trapped between the call/put strikes
➡️ If no breakout from the average strike zone, exit is suggested
⚠️ Helps prevent theta decay trap in Long Strangles
________________________________________
📌 Greeks (Optional Input)
🔹 Manual input for Delta, Gamma, Theta, and IV for both legs
🔍 Dashboard shows:
- Net Delta: Directional Bias
- Net Gamma: Volatility Risk
- Net Theta: Time Decay Risk
- Avg IV: Vol Crush or Low IV Warning
- Verdict: 🟢 Strong / 🟡 Moderate / ❌ Risky
________________________________________
📌 Dashboard Display
📈 Strategy Type: Long or Short Strangle
💹 Call & Put Premiums (Entry vs LTP)
📊 Total Net Premium
📉 Real-time PnL
📐 Breakeven Range (Lower & Upper)
🧠 Smart Exit verdict
🔁 Reversal Exit guidance
📆 Days to Expiry (DTE)
📊 R:R Ratio & Quality Verdict
📐 Greeks Summary + Risk Flags (if enabled)
________________________________________
⚠️ Important Notes
✅ Built for NSE Options only
✅ Designed for Long/Short Strangle strategies
✅ Use on 1-second chart only
❌ Will not function correctly on higher timeframes
✅ This is a manual dashboard — **no orders or automation**
✅ For educational, research, and tracking use only
❌ Not financial advice or a trading recommendation
________________________________________
💬 How to Use This Dashboard
1️⃣ Choose your strategy: Long or Short Strangle
2️⃣ Enter valid CE & PE symbols (OTM strikes)
3️⃣ Fill in strike prices and premiums (Buy/Sell)
4️⃣ Optionally enter Greeks (Delta, Gamma, etc.)
5️⃣ Set your expiry date
6️⃣ Monitor PnL, risk zones, exit suggestions
7️⃣ Use alerts (if enabled) for major thresholds
________________________________________
🤝 Final Note
This tool was built with patience and care by simpletradewithpatience to help fellow options traders trade more objectively, systematically, and confidently.
Feel free to share feedback on Tradingview.
Happy Trading! 📈
Stay disciplined. Stay smart.
________________________________________
🔠 Glossary
PnL – Profit & Loss
LTP – Last Traded Price
IV – Implied Volatility
DTE – Days to Expiry
ROI – Return on Investment
R:R – Risk to Reward Ratio
CE / PE – Call / Put Option
SEBI – Securities and Exchange Board of India
________________________________________
⚠️ Disclaimer
This script is for educational and research purposes only.
I am not a SEBI-registered advisor.
No buy or sell recommendations are made.
Trading options involves significant risk.
Use proper risk management and always consult a licensed advisor if in doubt.
The author is not responsible for any financial losses incurred.
By using this tool, you agree to these terms.
________________________________________
Strangle MoverStrangle Mover is an indicator especially made for option writer / seller who wants to do strangle and adjust the position based on the market trend / movement. It can be use for iron condor strategy too.
Settings: User must know the settings of the indicator before using .
First one is Option Strike Difference , user need to enter the correct option strike difference of the particular instrument / stock / indices, one can get it from option chain. For example, Nifty having 50 points differences in each option strike and bank nifty having 100 points. So, Nifty user must enter 50 and Bank nifty user must enter 100 in this setting.
Second is strangle distance multiply , user can choose the distance from the trend price. For example, nifty user selects 3, strangle line starts showing (3*50) 150 points away strike from the trend area.
Third is Length, default value is 20 which generally used in vwma, donchian channel and other trend finding indicators. User can change if need.
Note: Option Strike Difference and Strangle Distance Multiply is very important setting to use this indicator.
User must do adjustments based on their own risk and strategy. This indicator is only for education purpose.

0_dteUSAGE
This script guages the probability of an underlying moving a certain amount on expiration day, to aid the popular "0 dte" strategy. The script counts how many next-day moves exceeded a given magnitude in the past, under similar conditions. The inputs are:
mark_mode:
- "open": measures the magnitude as "open to close"--a true 0 dte.
- "previous close": for lazy people who don't want to wake up early. measures magnitude from the previous day's close.
move_mode:
- "percent": measures moves that exceed a given percentage.
- "absolute": measures moves that exceed a point value.
move-dir: measure only up moves, down moves, or both.
vol_model: the model for realized volatility. (may add more later).
min_vol: only measure moves when realized vol is above this value.
max_vol: only measure moves when realized vol is below this value.
precision: number of digits printed in the output table.
EXAMPLE:
- mark_mode: "previous close"
- move_mode: "percent"
- move_dir: "up"
- move_mag: 0.07
- vol_model: hv30
- min_vol: 0.2
- max_vol: 0.5
These settings will count the number of trading days that closed 7% higher than the previous day's close, when the previous day's realized volatility (annualized) was between 20% and 50%. The outputs are:
- current vol: green plot. Today's realized vol. Shown for convenience.
- max and min vol: red plots. Also shown for convenience.
- count: the number of days that exceeded the chosen magnitude, when the previous day's realized volatility was within the chosen bounds.
- total: the total number of days where realized volatility was within the chosen bounds
- probability: count / total. the percentage of days that exceeded the move when volatility was within the bounds.
- move: plotted as a purple line. purple "X" labels are plotted above
- bars where the move exceeded the magnitude threshold and volatility was in-bounds. a "hit".
CONCLUSION
This script is based on the idea that realized volatility has some bearing on future volatility. By seeing what happened in the past when volatility was close to its current value, we may be able to assess the probability that our short put will be in the money, tomorrow, and our account devastated.
NOTE: Unlike many of my other scripts, all percentages--both inputs and outputs--are given in fractional form. E.g., 0.01 means 1%.

portfolio_strikesA simple script for keeping track of your options portfolio. Basically, you can write one line of code per strategy (single, vertical, or strangle) to keep a line drawn on the underlying's chart, at the strike price, from the current bar until expiration. See the comments at the top of the code for more explanation.

strangle_pricerUsage:
1. Set the put and call strike inputs to values of your choosing.
2. Select "days to expiration".
3. Set the put and call standard deviations using the output table.
The indicator is meant help price a strangle using historical data and a volatility model. By default, the model is an ewma-method historical volatility. After selecting strikes and standard their corresponding standard deviation, theoretical values and probabilities will be shown in the table. The script is initialized with -1 for several inputs, and won't show any data until these are adjusted.
The theoretical values shown assume a strangle was bought or sold on every historical bar, and averaging their value at expiration.
For example, if you choose the $50 call and $40 put when the underlying is at $45 and there are 30 days until expiration, suppose the volatility is N and
these strikes correspond to M standard deviations. Input those and the resulting theoretial values shown will be based on opening a 30 dte call and put at M standard deviations with respect to the volatility at each bar.
- Past volatility forecasts are plotted in blue, and hidden by default.
- The current volatility forecast is drawn as a blue line.
- The put and call strikes are drawn as red lines.
This indicator is only meant for the daily chart!
Since I won't be able to edit this description later, also check the release notes and script comments for important changes.

Intrangle - Straddle / StrangleIntrangle is an indicator to assist Nifty / Bank Nifty Option Writers / Sellers to identify the PE / CE legs to Sell for Straddle and Strangle positions for Intraday.
Basic Idea : (My Conclusion for making this Indicator)
1) Last 10 Years data says Nifty / Bank Nifty More than 66% of times Index are sideways or rangebound (within 1% day) .
2) Mostly, First one hour high and low working as good support and resistance.
Once First one hour complete, this indicator will show Strangle High (CE), Strangle Low (PE) and Straddle (CE/PE).
Straddle:
If you want to do straddle strategy, sell at the money strike (CE/PE) when price comes near to the straddle line (black line),
Strangle:
If you want to do Strangle strategy, sell Strangle High (CE) and Strangle Low (PE) when price comes near to the straddle line (black line). Both Strangle High and Low will be out of the money when price near to the straddle line (black line).
Adjustment: option adjustment to be done based on the price movement. Adjustment purely up to the user / trader.
Note1: If price not comes to near straddle line after first hour, better to stay light…
Note2: If first hour not giving wide High / Low, don’t use strangle strike based on this indicator. Straddle can be done any day with require adjustment / hedge. This Indicator is purely for education purpose, user / trader has to be back-tested before their start using it.
This indicator will work in Nifty / Bank Nifty only. Best Time frames are 3/5/15 Mins. This is purely made for Intraday
Happy Trading 😊

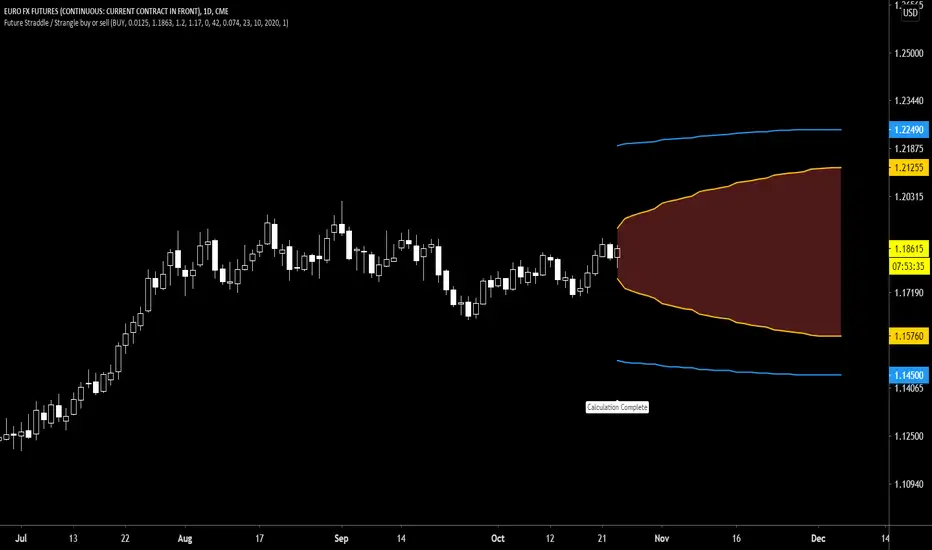
Future Straddle / Strangle buy or sell indicatorFuture Straddle / strangle buy or sell indicator developed by Chobotaru Brothers.
You need to have basic knowledge in option trading to use this indicator!
The indicator shows P&L lines of the options strategy. Use only for futures since the mathematical model of options for Future instruments is different from stocks. Plus, the days' representation in futures is also different from stocks (stocks have fewer days than futures ).
***Each strategy in options is based on different mathematical equations, use this indicator only for the strategy in the headline.***
What does the indicator do?
The indicator is based on the Black-Scholes model, which uses partial differential equations to determine the option pricing. Due to options non-linear behavior, it is hard to visualize the option price. The indicator calculates the solutions of the Black-Scholes equation and plots them on the chart so traders can view how the option pricing will behave.
How the indicator does it?
The indicator uses five values (four dominants and one less dominant) to solve the Black-Scholes equation. The values are stock price, the strike price of the option, time to expiration, risk-free interest rate, and implied volatility .
How the indicator help the users?
-View the risks and rewards so you can know the profit targets in advance which means you can compare different options in different strikes.
-View the volatility change impact so you can know the risk and the P&L changes in case of a change in the volatility over the life of the option before you enter the trade.
-View the passage of time impact so you can know where and when you could realize a profit.
-Multi-timeframes so you can stay on the same chart (Daily and below).
All these features are to help the user improve his analysis while trading options.
How to use it?
The user needs to obtain from the “option chain” the following inputs:
-Buy or sell (the strategy)
- Straddle/strangle price bought/sold: enter the price that you bought/sold one options strategy.
-Instrument price when bought/sold: the stock price when you bought/sold the options strategy.
-Upper strike price: the upper strike price of the options strategy.
-Lower strike price: the lower strike price of the options strategy.
-Interest rate: find the risk-free interest rate from the U.S. DEPARTMENT OF THE TREASURY. Example: for 2% interest rate, input: 0.02.
-Days to expire: how many days until the option expires.
-Volatility: the implied volatility of the option bought/sold. Example: for 45% implied volatility , input: 0.45.
-Day of entry: A calendar day of the month that the option bought/sold.
-Month of entry: Calendar month the option bought/sold.
-Year of entry: Calendar year the option bought/sold.
-Risk to reward: Profit/loss line defined by the user. Minimum input (-0.95) ; maximum input (3).
Example: If the strategy was bought, -0.95 means, 95% of the options strategy value is lost (unrealized). If the strategy was bought, 3 means, the risk to reward is 3.
After entering all the inputs, press Ok and you should see “Calculation Complete” on the chart.
The user should not change the entry date and days to expire inputs as time passes after he entered the trade.
How to access the indicator?
Use the link below to obtain access to the indicator
Straddle / strangle buy or sell indicatorStraddle / strangle buy or sell indicator developed by Chobotaru Brothers.
You need to have basic knowledge in option trading to use this indicator!
The indicator shows P&L lines of the options strategy. Use only for stocks since the mathematical model of options for Future instruments is different from stocks. Plus, the days' representation in futures is also different from stocks (stocks have fewer days than futures ).
***Each strategy in options is based on different mathematical equations, use this indicator only for the strategy in the headline.***
What does the indicator do?
The indicator is based on the Black-Scholes model, which uses partial differential equations to determine the option pricing. Due to options non-linear behavior, it is hard to visualize the option price. The indicator calculates the solutions of the Black-Scholes equation and plots them on the chart so traders can view how the option pricing will behave.
How the indicator does it?
The indicator uses five values (four dominants and one less dominant) to solve the Black-Scholes equation. The values are stock price, the strike price of the option, time to expiration, risk-free interest rate, and implied volatility .
How the indicator help the users?
-View the risks and rewards so you can know the profit targets in advance which means you can compare different options in different strikes.
-View the volatility change impact so you can know the risk and the P&L changes in case of a change in the volatility over the life of the option before you enter the trade.
-View the passage of time impact so you can know where and when you could realize a profit.
-Multi-timeframes so you can stay on the same chart (Daily and below).
All these features are to help the user improve his analysis while trading options.
How to use it?
The user needs to obtain from the “option chain” the following inputs:
-Buy or sell (the strategy)
- Straddle/strangle price bought/sold: enter the price that you bought/sold one options strategy.
-Instrument price when bought/sold: the stock price when you bought/sold the options strategy.
-Upper strike price: the upper strike price of the options strategy.
-Lower strike price: the lower strike price of the options strategy.
-Interest rate: find the risk-free interest rate from the U.S. DEPARTMENT OF THE TREASURY. Example: for 2% interest rate, input: 0.02.
-Days to expire: how many days until the option expires.
-Volatility: the implied volatility of the option bought/sold. Example: for 45% implied volatility , input: 0.45.
-Day of entry: A calendar day of the month that the option bought/sold.
-Month of entry: Calendar month the option bought/sold.
-Year of entry: Calendar year the option bought/sold.
-Risk to reward: Profit/loss line defined by the user. Minimum input (-0.95) ; maximum input (3).
Example: If the strategy was bought, -0.95 means, 95% of the options strategy value is lost (unrealized). If the strategy was bought, 3 means, the risk to reward is 3.
After entering all the inputs, press Ok and you should see “Calculation Complete” on the chart.
The user should not change the entry date and days to expire inputs as time passes after he entered the trade.
How to access the indicator?
Use the link below to obtain access to the indicator
