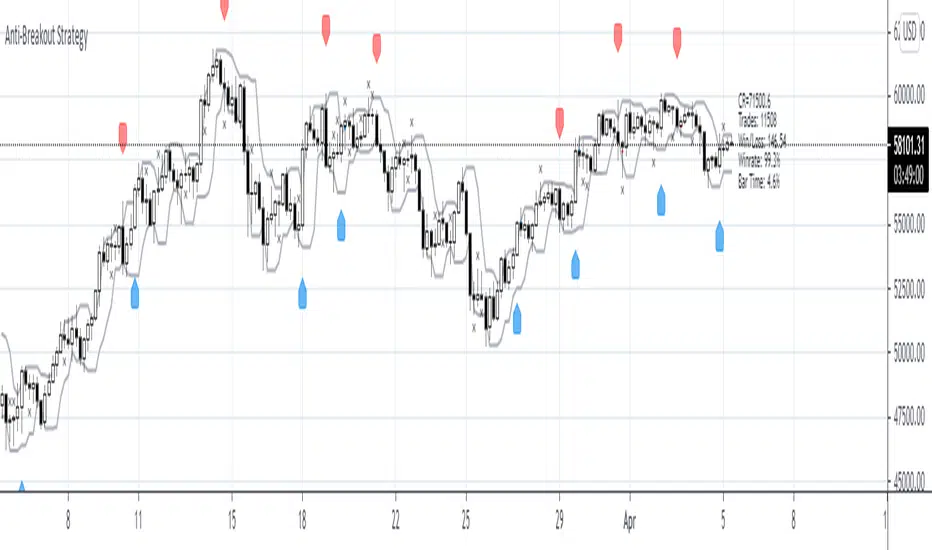
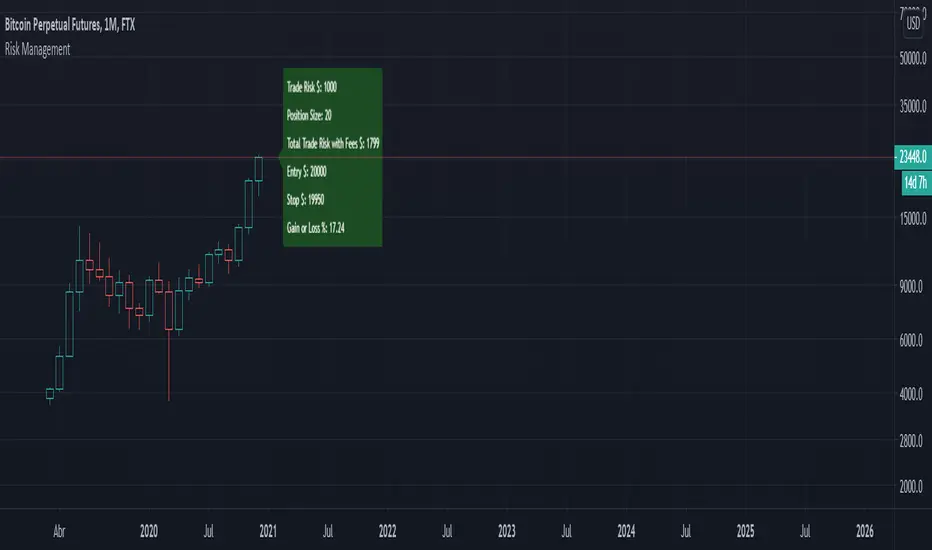
Trading Con Propositomy scrip intention is to make easier and simpler my analisis, having everything toghether helps me take desicions when to enter the market, the estrategy is based in moving averages, pivot points and structure, and the bollinger bands and the sthochastic are just another tool of confirmation when i'm goin to execute the trade.
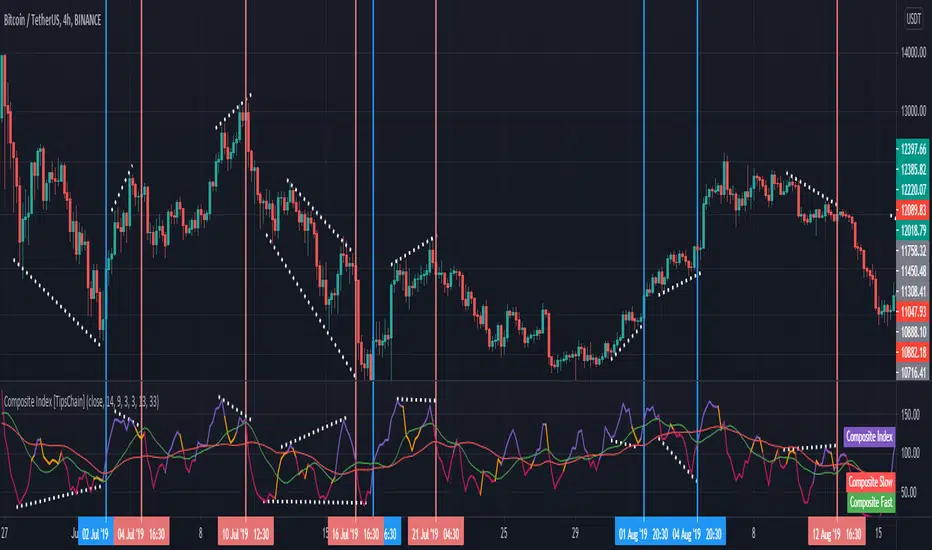
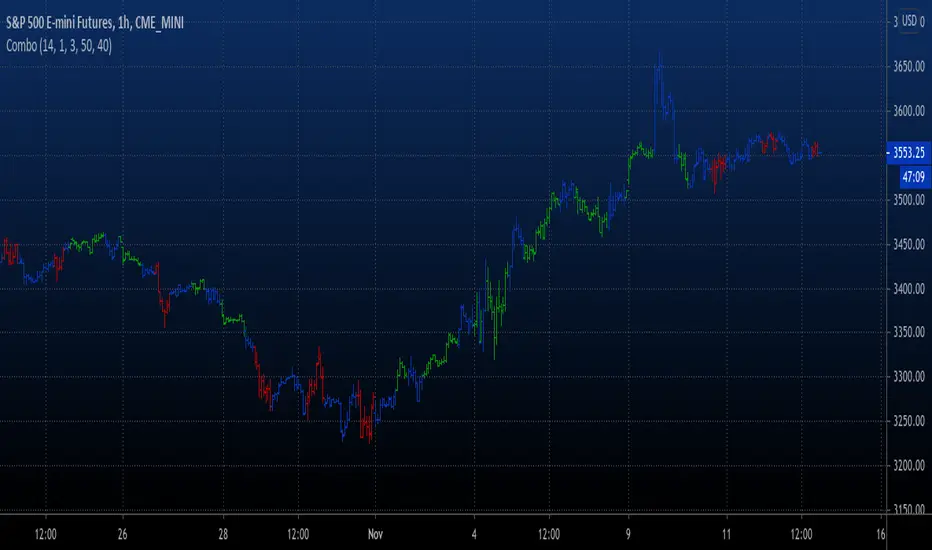
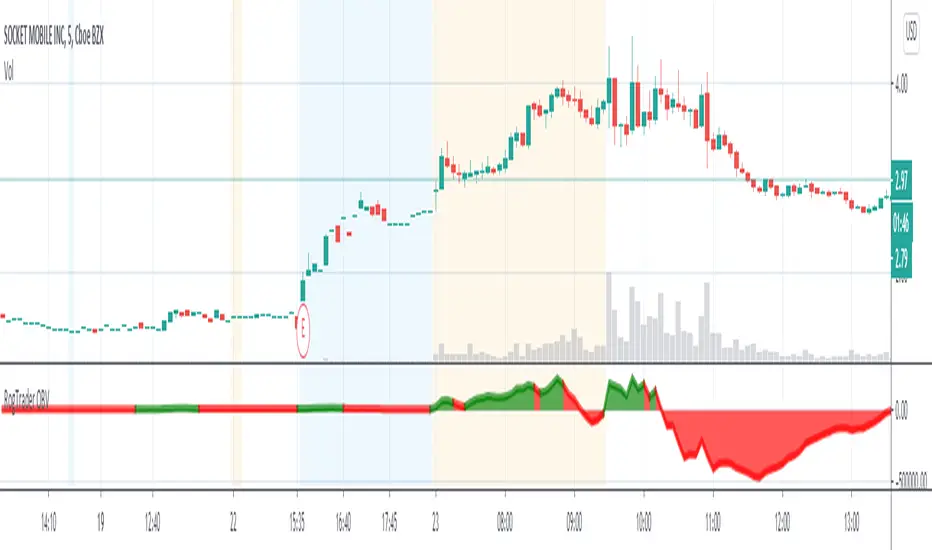
the market for this strategy is more focused on futures and us stocks but it can be use in any other market. the way to use this strategy is simple, every time a candle goes thru a MA and pull's back to it is a sign of a possible trade, samething when it cuts thru a pivot point and the perfect condition is when the bollinger bands and the sthocasthic are in oversold and overbuy areas.
Pine Script® indicator