Supertrend - Long & Short -Sachin Ughadethis indicator for super trend strategy with buy and sell signalsPine Script® strategyby hello_sachin11378
supertrend advanceHELLO FRIENDS ...............THIS IS SUPERTREND ADVANCE WITH HENKIASHI CANDLE ...I got so many request on supertrend with henkiashi. This is for all of them ..I am making it open for all so you can change its coding according to your need SOME IMPONTENT UPDATE IN THIS SUPERTRNED 1) You Can Use It for option trading ...you can do algo option trading using this strategy 2) YOU CAN USE CUSTOME SYNTAX TO ALGO TRADE IN STOCK,FOREX,COMMODITY AND CRYPTO 3) YO CAN USE IT IN INTRADAY TIME PERIOD ALSO U CAN SET ITS ENTRY AND EXIT TIME 4) YOU CAN USE HENKIASHI SUPERTREND ON NORMAL CANDLE STICK CHART 5) YOU CAN USE ITS QUNTITY FEATURE .BY THIS WAY U CAN DOUBLE YOUR QUNTITY SIZE ON LOSSING TRADE AND WHEN PROIFT TRADE OCCUR ITS QUNTITY AGAIN AUTOMATICALLY SHIFTED TO NORMAL QUNTITY ....THIS FEATURE ONLY HELP TRADER WITH MORE MARGIN....USE THIS FEATURE PROPERLY.THIS FEATURE BEST WORK ON ONE SIDE MEANS ONLY BUY SIDE TRADE OR SELL SIDE TRADE 6)YOU CAN SET YOUR TARGET AND STOPLOSS IN POINTS AND IN PERCENTAGE 7) YOU CAN CHOSE ONE SIDE TO TRADE ONLY BUY SIDE OR SELL SIDE HOPE THIS FEARTURES HELPS EVERY ONE ALL THE BEST FOR SUCESSFULL TRADINGPine Script® strategyby Aakashparikh7871717396
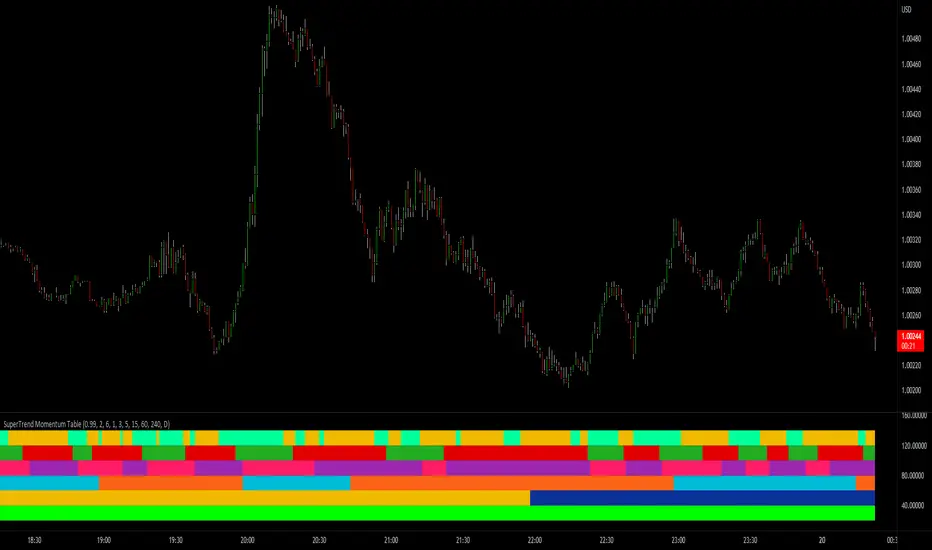
SuperTrend Momentum TableMy goal creating this indicator : Provide a way to see the Past and Current Momentum of multiple different timeframes without using multiple charts. The Underlying Concept / What is Momentum? The Momentum shown is derived from a Mathematical Formula, SUPERTREND. When price closes above Supertrend Its bullish Momentum when its below Supertrend its Bearish Momentum.This indicator scans for bullish & bearish Momentum on the Timeframes selected by the user and when there is a shift in momentum on any of those time frames (price closes below or above SUPERTREND ) it notifies the trader with a color change on the Momentum Table. Back Testing: This indicator will be key for back testing with the SuperTrend-Support-Resistance indicator since the SuperTrend Momentum Table shows you the visual shift in momentum. Giving the Trader a Clear visual on how Each Support and Resistance Level was made . Technical Inputs - If you want to optimize the rate of signals to better fit your trading plan you would change the Factor input and ATR Length input. Increase factor and ATR Length to decrease the frequency of signals and decrease the Factor and ATR Length to increase the frequency of signals. Quick TIP! : You can Sync all VFX SuperTrend Indicators together! All VFX SuperTrend indicators display unique information but its all derived from that same Momentum Formula. Keep the Factor input and ATR Length the same on other VFX SuperTrend indicators to have them operating on the same data. Timeframe Inputs - The indicator has 7 Time frame Displays where you can choose which Time Frames you would like to monitor. - You can limit the amount of time frames being displayed by changing the Time Frame Amount Display Inputs - The trader can specify the bullish and bearish color of all 7 Timeframes - You can toggle (on or off) the Momentum Switch if you want to highlight the exact candle where momentum switched from bullish to bearish and from bearish to bullish . How it can be Used ? Check the momentum of other Timeframes and use that information as a variable to structure your trading plan. - Use Momentum information to track the trend - Plan and limit trades based on the current Momentum of multiple timeframes - See if you have higher momentum to fuel your trades - See breakouts on Multiple Time FramesPine Script® indicatorby Who7is7Like7God1193
6 Multi-Timeframe Supertrend with Heikin Ashi as Source This is a multiple multi-timeframe version of famous supertrernd only with Heikin Ashi as source. Atr which stands in the heart of supertrend is calculated based on heikin-ashi bars which omits a great deal of noises. with 6 multiplication of the supertrend, its simply much easier to spot trend direction or use it as trailing stop with several levels available. this is a great tool to assess and manage your risk and calculate your position volume if you use the heikin ashi supertrend as your stoploss. Pine Script® indicatorby ThinkologistUpdated 44337
SuperTrend Support & Resistance(My goal creating this indicator) : Provide a way to categorize and label key structures on multiple time frames so I can create a plan based on those observable facts. The Underlying Concept / What is Momentum? The Momentum shown is derived from a Mathematical Formula, SUPERTREND. When price closes above Supertrend Its bullish Momentum when its below Supertrend its Bearish Momentum. On the first bar bearish momentum is detected a resistance Level is made at the highest point of the previous bullish condition. On the first bar bullish momentum is detected a support Level is made at the lowest point of the previous bearish condition. As I become a better analyst I will find better techniques and this source code may become open-source, but as of now it remains protected. This indicator scans for bullish & bearish Momentum on the Timeframes selected by the user and when there is a shift in momentum on any of those time frames (price closes below or above SUPERTREND ) it notifies the trader with a Supply or Demand level with a unique color and Size to signify the severity of said level. What is Severity? Severity is How we differentiate the importance of different Highs and Lows. If Momentum is detected on a higher timeframe the Supply or Demand Level is updated. The Color and Size representing that higher timeframe will be shown. Demand and Supply Levels made by higher Timeframes are more SEVERE then a demand level made by a lower Timeframe. Technical Inputs - If you want to optimize the rate of signals to better fit your trading plan you would change the Factor input and ATR Length input. Increase factor and ATR Length to decrease the frequency of signals and decrease the Factor and ATR Length to increase the frequency of signals. - to ensure the correct calculation of Support and Resistance levels change BAR_INDEX. BAR_INDEX creates a buffer at the start of the chart. For example: If you set BAR_INDEX to 300. The script will wait for 300 bars to elapse on the current chart before running. This allows the script more time to gather data. Which is needed in order for our dynamic lookback length to never return an error(Dynamic lookback length cant be negative or zero). The lower the timeframe the greater the amount of bars need. For Example if I open up a 30 sec chart I would enter 5000 as my BAR_INDEX since that will provide enough data to ensure the correct calculation of Support and Resistance levels. Time Frame Inputs - The indicator has 3 Time Frame Displays where you can choose how SEVERE You want the Supply and Demand Levels. For Example: 1min, 3min, 5min, 15 min Levels, 60 min levels Weekly Levels, etc.....The higher the Timeframe Selected the more SEVERE the Level. - Use the Amount of time Frames input to increase or limit the amount of time frames that will be displayed onto the chart. Display Inputs - The toggle (Trend or Basic) option Lets the trend determine the colors of the Support and Resistance Levels or Basic where the color is strictly based on if its a high or a low ( Trend = HH,HL,LL,LH) - Toggle options (Close) and (High & Low) creates Support and Resistance Levels using the Lowest close and Highest close or using the Lowest low and Highest high. Toggle on both or toggle off both in order to use both these values when determining the trend of your chart. For Example this would mean (Price has to close higher then the highest high. Not only make a higher high or a higher close) and the inverse (Price has to close lower then the lowest low. Not only make a lower low or a lower close) How Trend Is being Determined ? (Previous Supply Level > Current Supply Level ) if this statement is true then its s LH so the trend is bearish if this statement is false then its a HH so the trend is bullish (Previous Demand Level > Current Demand Level ) if this statement is true then its a LL so the trend is bearish if this statement is false then its a HL so the trend is bullish (Close > Current Supply Level ) if this statement is true technically price made a HH so the trend is bullish (Close < Current Demand Level ) if this statement is true technically price made a LL so the trend is bearish - Fully customize how you display and label Market Structure in specific timeframes. Line Length, Line Width, Line Style, Label Distance, Label Size, Label Background Size, and Background Color can all be customized. - Lastly Is the Trend Chart. To Easily verify the current trend of any timeframes displayed by this indicator toggle on Chart On/Off . You also get the option to change the Chart Position and the size of the Trend Chart *****The Current charts timeframe has to lower then a month to ensure correct calculation of Supply and Demand Levels***** How it can be used ? (Examples of Different ways you can use this indicator) : Easily categorize the severity of each and every Supply or Demand Level in the market (The higher the time frame the stronger the level) : Quickly Determine the trend of any Timeframe : Get a consistent view of a market and how different time frames are behaving but just use one chart. : Take the discretion from hand drawing support and resistance lines out of your trading : Find and categorize strong levels for potential breakouts : Trend Analysis, Use multiple time frames to create a narrative based on observable facts from these time frames : Different Targets to take money off the table : Use labels to differentiate between different trend line setups : Find Great places to move your stop loss too. Pine Script® indicatorby Who7is7Like7God1717633
FDI-Adaptive Supertrend w/ Floating Levels [Loxx]FDI-Adaptive Supertrend w/ Floating Levels is a Fractal Dimension Index adaptive Supertrend indicator. This allows Supertrend to better adaptive to volatility of the market. This also includes floating levels that act as support and resistance, stop loss or take profit, or indication of market reversal. Additional signal types will be added in the future based on these floating levels. What is the Fractal Dimension Index? The goal of the fractal dimension index is to determine whether the market is trending or in a trading range. It does not measure the direction of the trend. A value less than 1.5 indicates that the price series is persistent or that the market is trending. Lower values of the FDI indicate a stronger trend. A value greater than 1.5 indicates that the market is in a trading range and is acting in a more random fashion. What is the Supertrend? Supertrend indicator was created by Olivier Seban to work on different time frames. It works for futures , forex, and equities. It is used in 15 minutes, hourly, weekly, and daily charts . Based on the parameters of multiplier and period, the indicator normally uses 3 for multiplier and 7 for the ATR period as default values. Average True Range is represented by the number of days while the multiplier is the value by which the range is multiplied. Included: Bar coloring Alerts Signals Pine Script® indicatorby loxx55 1.5 K
SuperTrend Momentum Chart(My goal creating this indicator) : Provide a quick way to check the current momentum of multiple timeframes. The Smart Momentum Chart was intended to be a live trading tool that should be used when a trader has already defined his edge and no longer needs the past Momentum data. The Underlying Concept What is Momentum ? The Momentum shown is derived from a Mathematical Formula SUPERTREND , when price is above SUPERTREND its bullish Momentum and when its below SUPERTREND its Bearish Momentum. This indicator scans for candle closes on the timeframes you've selected and when there is a shift in momentum it notifies the trader with a color change and an alert if one was set up. Technical inputs - If you want to optimize the rate of signals to better fit your trading plan you would change the Factor input and ATR Length input. Increase factor and ATR Length to decrease the frequency of signals and decrease the Factor and ATR Length to increase the frequency of signals. Quick TIP! : You can Sync all VFX SuperTrend Indicators together! All VFX SuperTrend indicators display unique information but its all derived from that same Momentum Formula. Keep the Factor input and ATR Length the same on other VFX SuperTrend indicators to have them operating on the same data. Time Frame Inputs - Your able to fill the chart with up to 8 timeframes - If You don't need all 8 you can limit the amount to display by changing the "Time Frame Amount" Display Inputs - You can change the size of the chart and the color of the text - You can toggle ON if you want to be signaled when a momentum switch occurs ( bullish to bearish or bearish to bullish ) - Your able to pick the Bullish and Bearish Colors of the Momentum switch How it can be used ? - Easily check the momentum of other Timeframes and use that information as a variable in your trading plan. - quickly glance and know the momentum of any time frame before you enter any trade - always know the momentum of the higher time frames - Eliminate the need to switch from current chart - Get an abundance of information in one location - Have clear variables to structure your trades around Pine Script® indicatorby Who7is7Like7God11102
Supertrend B&SSuperTrend is one of the most common ATR based trailing stop indicators. In this version you can change the ATR calculation method from the settings. Default method is RMA, when the alternative method is SMA . The indicator is easy to use and gives an accurate reading about an ongoing trend. It is constructed with two parameters, namely period and multiplier. The default values used while constructing a superindicator are 10 for average true range or trading period and three for its multiplier. The average true range (ATR) plays an important role in 'Supertrend' as the indicator uses ATR to calculate its value. The ATR indicator signals the degree of price volatility . The buy and sell signals are generated when the indicator starts plotting either on top of the closing price or below the closing price. A buy signal is generated when the ‘Supertrend’ closes above the price and a sell signal is generated when it closes below the closing price. It also suggests that the trend is shifting from descending mode to ascending mode. Contrary to this, when a ‘Supertrend’ closes above the price, it generates a sell signal as the colour of the indicator changes into red. A ‘Supertrend’ indicator can be used on equities, futures or forex, or even crypto markets and also on daily, weekly and hourly charts as well, but generally, it fails in a sideways-moving market.Pine Script® indicatorby GTTRADINGIN153
SuperTrend Entry(My goal creating this indicator) : Provide a way to enter the market systematically, automatically create Stop Loss Levels and Take Profit Levels, and provide the position size of each entry based on a fix Percentage of the traders account. The Underlying Concept : What is Momentum? The Momentum shown is derived from a Mathematical Formula, SUPERTREND. When price closes above Supertrend Its bullish Momentum when its below Supertrend its Bearish Momentum. This indicator scans for candle closes on the current chart and when there is a shift in momentum (price closes below or above SUPERTREND) it notifies the trader with a Bar Color change. Technical Inputs - If you want to optimize the rate of signals to better fit your trading plan you would change the Factor input and ATR Length input. Increase factor and ATR Length to decrease the frequency of signals and decrease the Factor and ATR Length to increase the frequency of signals. Quick TIP! : You can Sync all VFX SuperTrend Indicators together! All VFX SuperTrend indicators display unique information but its all derived from that same Momentum Formula. Keep the Factor input and ATR Length the same on other VFX SuperTrend indicators to have them operating on the same data. Display Inputs - The indicator has a candle overlay option you can toggle ON or OFF. If toggled ON the candles color will represent the momentum of your current chart ( bullish or bearish Momentum) your able to change the colors that represent bullish or bearish to your preference - You can toggle on which shows the exact candle momentum switched sides your able to change the colors that represent a bullish switch or bearish switch to your preference - The trader can specify which point you would like your stop loss to reference. (Low and High) Which uses the Low of the Momentum signal as the reference for your Stop Loss during buy signals and the High as the reference during sell signals. Or (Lowest Close and Highest Close) which uses the Lowest Close of the Momentum signal as the reference for your Stop Loss during buys and the Highest Close as the reference during sells. - The colors that represent your Stop Loses and Take Profits can also be changed Risk Management Inputs - Your Risk MANAGMENT section is used to set up how your Stop Loss and Take Profit are calculated - You have the option to take in account Volatility when calculating your Stop Loss. A adjusted ATR formula is used to achieve this. Increase Stop Loss Multiplier from 0 to widen stops. - Increase Take Profit Multiplier from 0 to access visual Take Profit Levels based on your Stop Loss. This will be important for traders that Prefer trading using risk rewards. For Example: If the the Take Profit Multiplier is 3 a Take Profit level 3 times the size or your stop loss from your entry will be shown and a price number corresponding to that Take Profit Level becomes available. - Enter your current Account size, Bet Percentage and Fixed Spread to get your Position Size for each trade -Toggle on the Current Trade Chart and easily get the size of your Position and the exact price of your Take Profit and Stop Loss. You can increase the Size of the Current Trade Chart= Tiny, Small, Normal, Large, Huge and change the Position of the Current trade Chart to your preference, (Top- Right, Center, Left) (Middle- Right, Center, Left) (Bottom- Right, Center, Left). How it can be used ? - Enter Trades and always know where your stop is going to be - Eliminate the need to manual calculate Position Size - Get a consistent view of the current charts momentum - Systematical enter trades - Reduce information overloadPine Script® indicatorby Who7is7Like7God44573
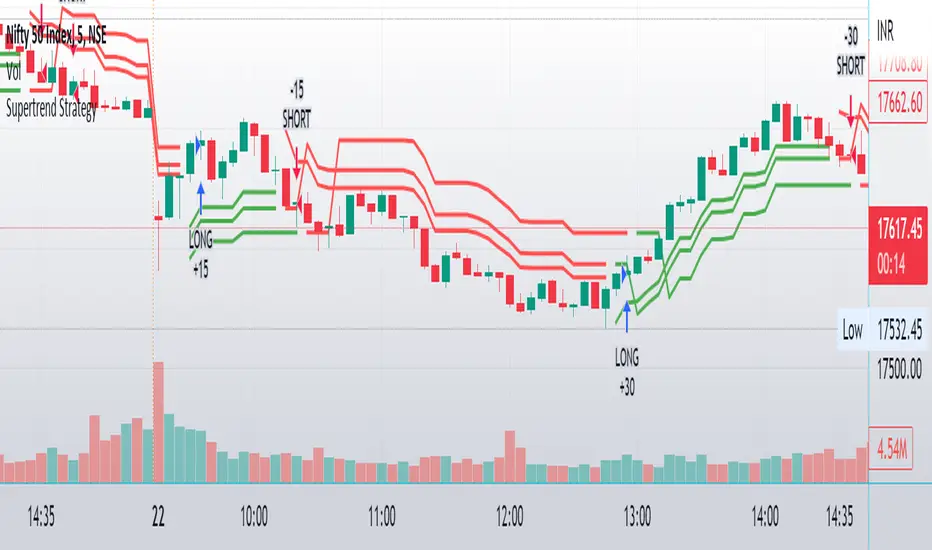
MTF Supertrend [Trading Nerd]Trend Trading Strategy using Supertrends Backtesting Script that uses a multitimeframeanalysis of the Supertrend Indicator. The trend direction is determind by a higher Timeframe (TF) Supertrend. The entry Signals are given by the Supertrend of the current TF. The script is NOT repainting (the script takes the previous value of the higher TF Supertrend, if the higher TF candle is not confirmed yet). Strategy Conditions Longs: The higher TF Supertrend has to be green The current TF Supertrend change from red to green Shorts: The higher TF Supertrend has to be red The current TF Supertrend change from green to red Optional: Option: If enabled also a trend chage of the higher TF Supertrend is a valid Entry Signal If enabled Signals are discarded if the ADX is below the value Take Profit On default there is no Take Profit. You can activate a Risk Reward Based Take Profit target trough the option. Also a Partial Take Profit is possible. Stop Loss The default Stop Loss Strategy is a Trailing Stoploss. As trailing Price the current TF Supertrend is used. Additional Time Filter: Only opens trade in the defined Session. Open trades are still being closed outside of the Session. Start Date/End Date: Limits the backtest for the defined Date Range Trading Days: Only open Trades on the checked Days Risk % per Trade: If enabled the Strategy uses X% of the capital (defined in Settings -> Properties -> Initial Capital) Use Compound Interest: If enabled Capital is recalculated for every trade (initial capital + net Profit) IMPORTANT: For low Timeframes and Markets with tight SL (like Forex) it requires a lower Margin Percent than default. Go to Settings->Properties and lower the required Long/Short Margin. Otherwise Trades might not be considered because of too less capital/marign. Margins can e.g. set to: 2% (Forex), 10% (Stocks), 20% (Crypto). Pine Script® strategyby Trading_Nerd77360
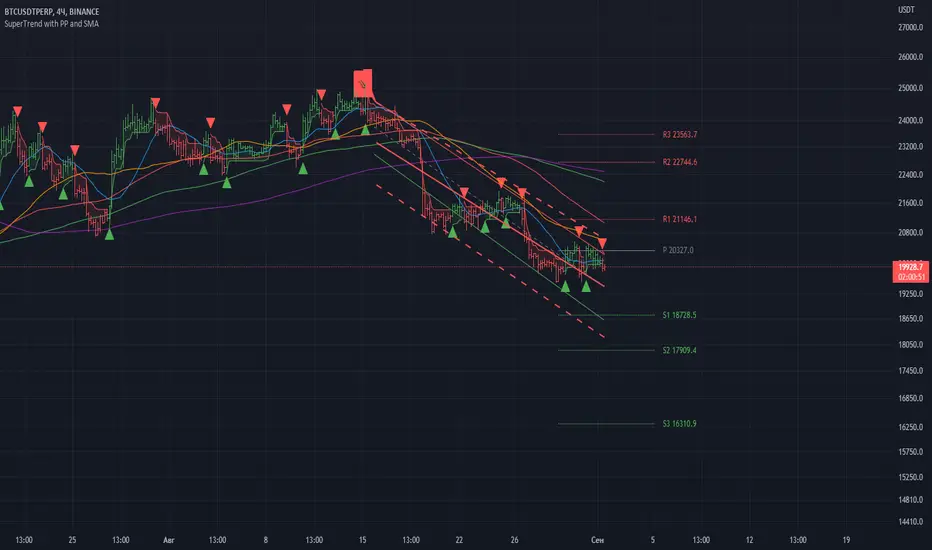
SuperTrend with PP and SMASuperTrend with PP and SMA: -SuperTrend -Pivot Points (Pivot Support & Resistance) -OBV-LIN -5 Moving Averages -Linear Regression ChannelPine Script® indicatorby Mike_Riff67
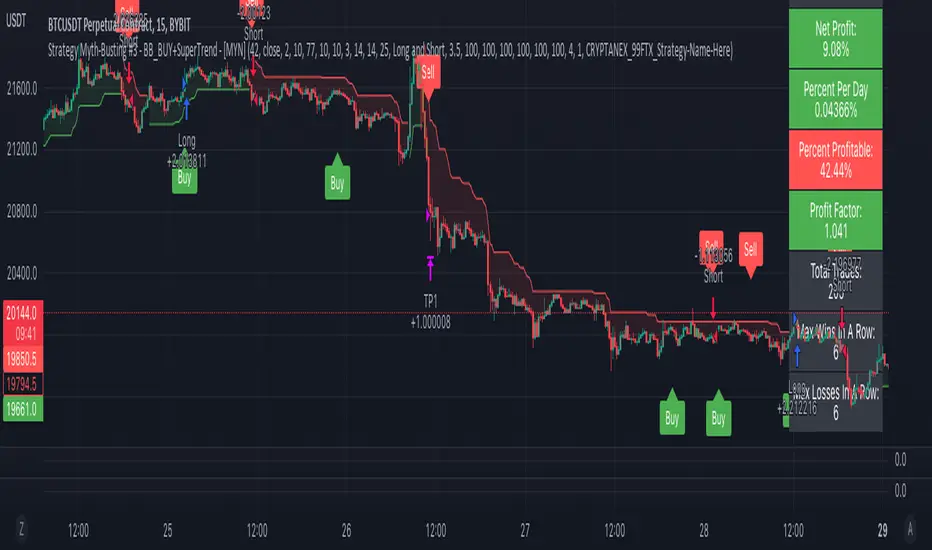
Strategy Myth-Busting #3 - BB_BUY+SuperTrend - [MYN]This is part of a new series we are calling "Strategy Myth-Busting" where we take open public manual trading strategies and automate them. The goal is to not only validate the authenticity of the claims but to provide an automated version for traders who wish to trade autonomously. Our third one we are automating is one of the strategies from "The Best 3 Buy And Sell Indicators on Tradingview + Confirmation Indicators ( The Golden Ones ))" from "Online Trading Signals (Scalping Channel)". No formal backtesting was done by them so wanted to validate their claims. If you know of or have a strategy you want to see myth-busted or just have an idea for one, please feel free to message me. This strategy uses a combination of 2 open-source public indicators: BB_Buy and Sell by guikroth (default settings) SuperTrend from TradingView's Technicals (default settings) Trading Rules 15 min candles Long Long condition when BB_BUY indicates buy signal and SuperTrend is green Short Short condition when BB_BUY indicates Sell signal and SuperTrend is red Pine Script® strategyby myncrypto55354
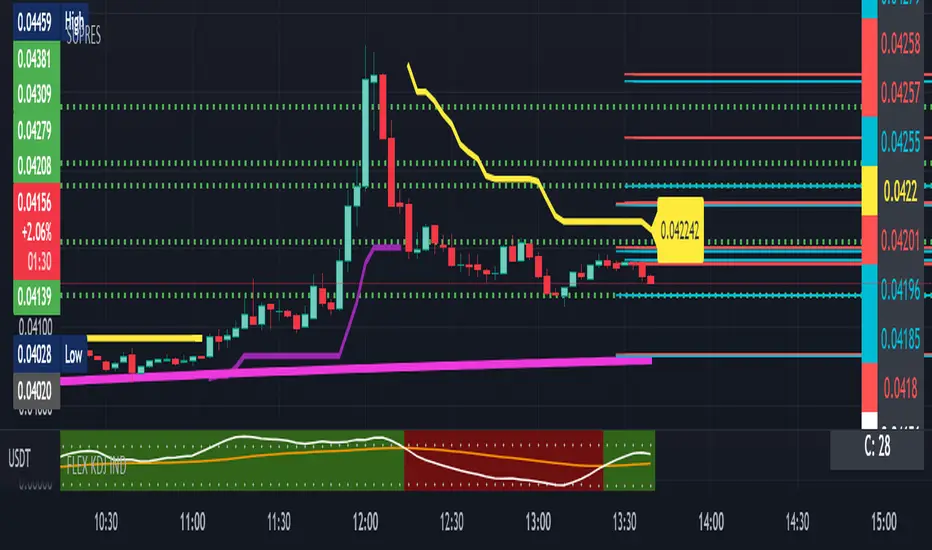
SUPRESHi Dears! I hope that you enjoyed my "FLEX KDJ IND" till today! Here, I want to publish one of my other golden indicators for you! Contents: + SUPRES + SUPERTREND + T.O Line - SUPRES (SUPPORT/RESISTANCE) is sensitive to trading volumes and with "BACHWARD" you can adjust the length of previous indices in investigation and "MEMORY" is an argument for calling maximum lines that have to be kept for "SUPPORT" and "RESIST". - SUPERTREND is the normal prepared indicator which is defined in "TRADING VIEW" -T.O is my suggestion instead of "EMA" to check the phase of session. I hope that you enjoy this Indicator, please do not forgot to "Warm-It-UP"! Happy trading, ShakibPine Script® indicatorby shaklerner1Updated 79
Digital Nivesh: Trend TrackerThis indicator is nothing but combination of Magic Trend and Super trend written by KivancOzbilgic So credit goes to him. I have just added some extra functionality which are below: 1. Multi time frame, magic trends time frame can be different from supertrend by changing shortTimeFrame 2. Dynamic time frame, u can change supertrends time also Best usage is to use Magic Trend on 1 lower time frame than supertrend. eg. Suppose ur current chart is on 5 min time, ur supertrend will be displayed with current time on chart(which can be changed also using MTF Tradingview feature), u need to keep shorterTimeFrame on lower value such as 3min . For any question , feel free to drop comment.Pine Script® indicatorby digitalniveshUpdated 11163
3c Ultimate reversal strategy With scanner and backtester v2This might just be the ultimate strategy to identify reversals. This strategy includes a scanner, a backtester and ability to connect it with you 3 commas bot(See adviced settings below) Strategy: -Signals reversal that happened in the last bar. This signal DO NOT repaint. -Identifies potential reversal that might happen in the current bar but can also not happen depending upon the timeframe closing price. -The strategy combines the Moving Average Trend Changer, SuperTrend (ATR price detection) and ADX. -It reduces the number of false signals in sideways market conditons and give more reliable trade signals. -The signal does not repaint and can be used in any market condition. It determines the trend with high precision. Take profit: -Set 2 separate TP conditions. -You can take profit using percentage, ATR, or RR(Risk Reward), aswell as using Trailing Take Profit. - Use sell signal from the strategy(I often find way better results using that) Stoploss: -You can use either ATR, Percentage or sell signal from the strategy (For now to let the strategy itself decide when to TP or SL, just set these parameters really high.) Scanner: -Identifies coins that are currently in the sell zone -Identifies coins that are currently in the buy zone -Screener explores up to 20 pairs in current graph's time frame. -Optimize the strategy to your liking and use the built in backtester to see if it is a viable strategy. 3commas settings: -For now you can only use simple bots. -Create LONG and SHORT bots for the coins you like to trade and set up alerts(You can send long and short signal from the same alert) -Set TP to 50% the strategy will handle buys and exits based on your inputs. -Set safety orders to 0. I might add DCA to the strategy if testing proves that to be a good solution. -When you have made the bots input the bot ID and token adress in the settings of the strategy. -When creating the alert use this webhook :https://3commas.io/trade_signal/trading_view -In the message field you use {{strategy.order.alert_message}} as the placeholder. In the future this signal might make it to the 3commas marketplace. You can then subscribe to that signal where I have cherrypicked coins based on thorough backtesting and optimization. Pine Script® strategyby KveieUpdated 1010101
Mtf Supertrend Table english It is a study of how the supertrend indicator looks on multiple timeframes. You can see the Supertrend direction in Multiple Timeframes by looking at the chart Türkçe supertrend indikatörünün çoklu zaman dilimdlerinde nasıl göründüğü yönünde bir çalışmadır. Tabloya bakarak Çoklu Zaman dilimlerinde Supertrend yönünü görebilirsinizPine Script® indicatorby FXTDPRUpdated 1010680
Ultimate IndicatorThis is a combination of all the price chart indicators I frequently switch between. It contains my day time highlighter (for day trading), multi-timeframe long-term trend indicator for current commodity in the bottom right, customizable trend EMA which also has multi-timeframe drawing capabilities, VWAP, customizable indicators with separate settings from the trend indicator including: EMA, HL2 over time, Donchian Channels, Keltner Channels, Bollinger Bands, and Super Trend. The settings for these are right below the trend settings and can have their length and multiplier adjusted. All of those also have multi-timeframe capabilities separate from the trend multi-time settings. The Day Trade Highlight option will draw faint yellow between 9:15-9:25, red between 9:25-9:45, yellow between 9:45-10:05. There will be one white background at 9:30am to show the opening of the market. while the market is open there will be a very faint blue background. For the end of the day there will be yellow between 15:45-15:50, red between 15:50-16:00, and yellow between 16:00-16:05. During the night hours, there is no coloring. The purpose of this highlight is to show the opening / closing times of the market and the hot times for large moves. The indicators can also be colored in the following ways: 1. Simple = Makes all colors for the indicator Gray 2. Trend = Will use the Donchian Channels to get the short-trend direction and by default will color the short-term direction as Blue or Red. Unless using Super Trend, the Donchian Channel is used to find short-term trend direction. 3. Trend Adv = Will use the Donchian Channels to get the short-trend direction and by default will color the short-term direction as Blue or Red. Unless using Super Trend, the Donchian Channel is used to find short-term trend direction. If there is a short-term up-trend during a long-term down-trend, the Blue will become Navy. If short-term down-trend during long-term up-trend, the Red will be Brown. 4. Squeeze = Compares the Bollinger Bands width to the Keltner Channels width and will color based on relative squeeze of the market: Teal = no squeeze. Yellow = little squeeze. Red = decent squeeze. White = huge squeeze. if you do not understand this one, try drawing the Bollinger Bands while using the Squeeze color option and it should become more apparent how this works. I also recommend leaving the length and multiplier to the default 20 and 2 if using this setting and only changing the timeframe to get longer/shorter lengths as I've seen that changing the length or multiplier can more or less make it not work at all. Along with the indicator settings are options to draw lines/labels/fills for the indicator. I enjoy having only fills for a cleaner look. The Labels option will show Buy/Sell signals when the short-term trend flips to agree with the long-term trend. The Trend Bars option will do the same as the Labels option but instead will color the bars white when a Buy/Sell option is given. The Range Bars option shows will color a bar white when the Close of a candle is outside of a respective ranging indicator option (Bollinger or Keltner). The Trend Bars will draw white candles no matter which indicator selection you make (even "Off"). However, Range Bars will only draw white when either Bollinger or Keltner are selected. The Donchian Channels and Super Trend are trending indicators and should be used during trending markets. I like to use the MACD in conjunction with these indicators for possibly earlier entries. The Bollinger Bands and Keltner Channel are ranging indicators and should be used during ranging markets. I like to use the RSI in conjunction with these indicators and will use 60/40 for overbought and oversold areas rather than 70/30. During a range, I wait for an overbought or oversold indication and will buy/sell when it crosses back into the middle area and close my position when it touches the opposite band. I have a MACD/RSI combination indicator if you'd like that as well :D As always, trade at your own risk. This is not some secret indicator that will 100% win. As always, the trades you see in the picture use a 1:1.5 or 1:2 risk to reward ratio, for today (August 8, 2022) it won 5/6 times with one trade still open at the end of the day. Manage your account correctly and you'll win in the long term. Hit me up with any questions or suggestions. Happy Trading!Pine Script® indicatorby theehoganatorUpdated 1111 1.4 K
DEMA Supertrend Bands [Misu]█ Indicator based on DEMA (Double Exponential Moving Average) & Supertrend to show Bands . DEMA attempts to remove the inherent lag associated with Moving Averages by placing more weight on recent values. Supertrend aims to detect price trends, it's also used to set protective stops. █ Usages: Combining Dema to calculate Supertrend results in nice lower and upper bands. This can be used to identify potential supports and resistances and set protective stops. █ Parameters: Length DEMA: Double Ema lenght used to calculate DEMA. Dema is used by Supertrend indicator. Length Atr: Atr lenght used to calculate Atr. Atr is used by Supertrend indicator. Band Mult: Used to calculate Supertrend Bands width. █ Other Applications: The mid band can be used to filter bad signals in the manner of a more classical Moving Average. Pine Script® indicatorby Fontiramisu225
SR Relative StrengthThis is a relative strength model for Indian Stock Markets where in the price of the stock in the current scenario is compared with the benchmark indices ( NIFTY / BANKNIFTY) over a period of 55 days ( by default). This indicator also has RSI and Supertrend built-in by default. Hence this indicator can be used in place of 3 indicators. How to use? 1. When the background is blue, it means that the stock is relatively strong as compared to the bench mark indices over a period of 55 days and the RSI is > 50 When both RS > 0 & RSI > 50 the background will be blue. If either or is true it won't turn blue. 2. Superternd by default setting is 10,3 which can be changed as per one's requirement. Thanks!!Pine Script® indicatorby sauravraj3sinhaUpdated 1515458
Adaptive Supertrend w/ Floating Levels [Loxx]Adaptive Supertrend w/ Floating Levels is a Supertrend indicator made adaptive by comparing the coefficient of determination / average of the least squares. The basic concept is this: use correlation with an r-squared line to adapt the period of the indicator, thereby resulting in a more versatile Supertrend. This adaptive formula makes the Supertrend more reactive to small fluctuation in the market while still doing what it's supposed to do: track trend. In addition, floating levels are drawn above or below the Supertrend which are calculated with percentage of the highest and lowest values of the Supertrend within the last “lookback” period. These floating levels act as filter to detect / prevent false trend reversals. T What is the Supertrend? Supertrend indicator was created by Olivier Seban to work on different time frames. It works for futures, forex, and equities. It is used in 15 minutes, hourly, weekly, and daily charts. Based on the parameters of multiplier and period, the indicator normally uses 3 for multiplier and 7 for the ATR period as default values. Average True Range is represented by the number of days while the multiplier is the value by which the range is multiplied. Included -Toggle on/off bar coloring -Toggle on/off adaptivity -Toggle on/off fill coloring Pine Script® indicatorby loxxUpdated 66370
Buy/Sell SignalsThe indicator is built using Supertrend, RSI, and Ema Crossovers. What is the best way to use the indicator? Indicator can be used in two ways: First : If a signal appears on the chart, you can enter immediately the stoploss is the candle's low with a Small Buffer. Second: you will get good results if you plot additional indicators like as volume, RSI and so on for additional confirmation to get better results Pine Script® indicatorby LossTronautUpdated 594
5EMA(8,13,21,55,125) w/ EMA8-13 + EMA8-125 GC/DC Signal-by TerryThis Script are Combined 5 EMAs Indicator with Golden / Death Cross EMA 8 -13 and EMA 8 - 125 within Green or Red Column Line as Default Signal. This Indicator also combined with Ballinger Band and Super Trend Channel. If you have like this Indicator, please add to your favorite Indicator, and If You Don't, Don't be like a man without woman :) ... God Bless You AllPine Script® indicatorby septeriady11150
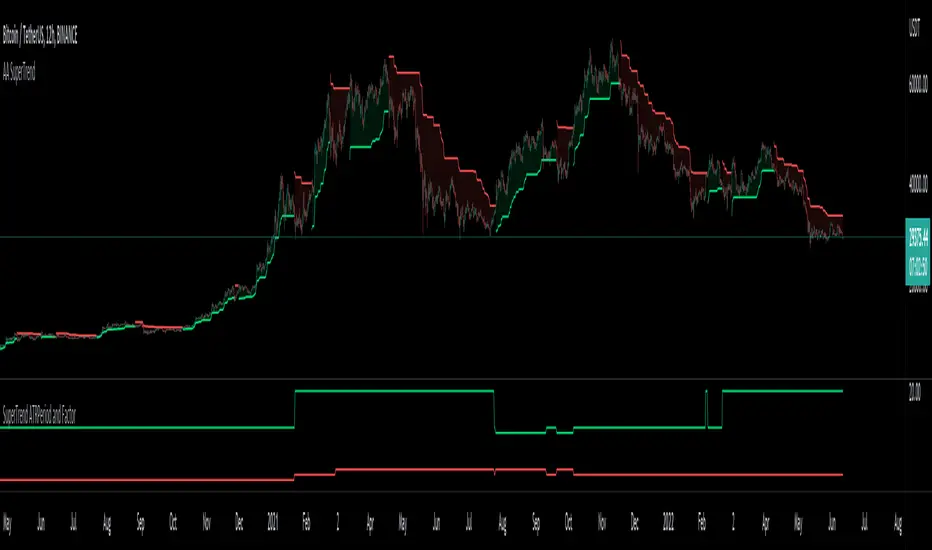
Auto Adjust SuperTrend Indicator SuperTrend It is a standard ATR (Average True Range)-based Trailing Indicator. The indicator takes two default values ATR Period and Factor. The standard settings for Super Trend I have seen are 10,3 or 10,2. These settings will not work for all the instruments, and we end up manually changing these settings. This is where Auto-Adjust Supertrend adds value. Auto-Adjust SuperTrend finds the optimized settings for ATRPeriod and Multiple using a defined algorithm to check all the different ATR Periods and Factors. It backtests different combinations of ATR Period and Factors and Indicator switches to these profitable settings as soon as it detects most profitable setting among given range in the settings. Default ATR Period : 10 to 20 Default Factor : 2 to 5 The above settings can be altered in the indicator settings. Please do keep in mind that the performance of the indicator reduces as we increase the default settings range. Alerts are available as well Pls contact me for access.Pine Script® indicatorby vickyprudhviUpdated 141421