Supertrend

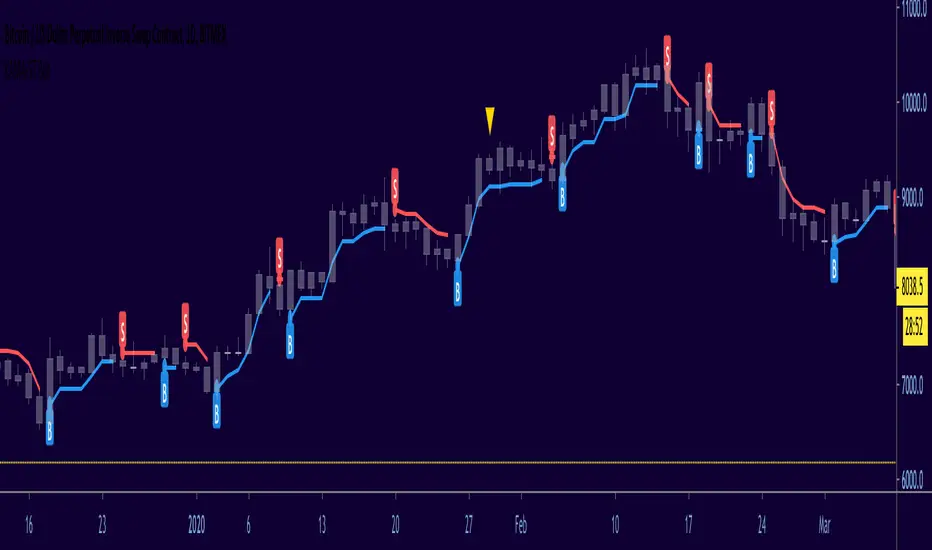
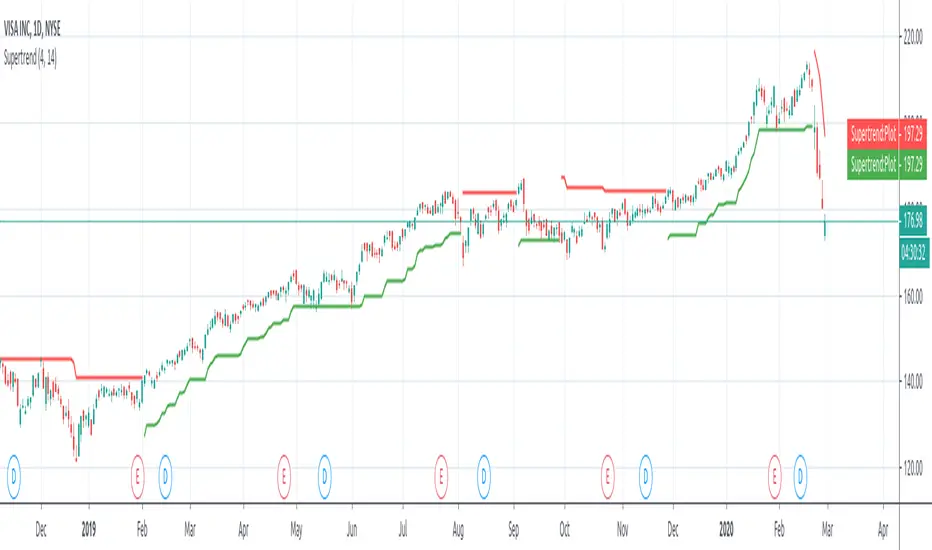
Pivot Point SupertrendHello All,
There are many types of SuperTrend around. Recently I thought about a Supertrend based on Pivot Points then I wrote "Pivot Point SuperTrend" script. It looks it has better performance on keeping you in the trend more.
The idea is behind this script is finding pivot point, calculating average of them and like in supertrend creating higher/lower bands by ATR. As you can see in the algorithm the script gives weigth to past pivot points, this is done for smoothing it a bit.
As I wrote above it may keep you in the trend more, lets see an example:
As an option the script can show main center line and I realized that when you are in a position, this line can be used as early exit points. (maybe half of the position size)
While using Pivot Points, I added support resistance lines by using Pivot Point, as an option the script can show S/R lines:
And also it can show Pivot Points:
When you changed Pivot Point Period you can see its reaction, in following example PP period is 4 (default value is 2). Smaller PP periods more sensitive trendlines.
Alerts added for Buy/Sell entries and Trend Reversals. (when you set alerts use the option " Once Per Bar Close ")
ENJOY!

SuperTrend Fake ReversalHello Everyone This Is SuperTrend Failed Reversal You Can Also Change Input Depend on Your Choice
Indicator Features
➤ Long or Short (This is only for Confirmation)
➤ Long Entry or Short Entry
➤ Long Entry Target Profit Calculated By Long Entry Bar High By default 1 percentage you Can also Change Input depend on your choice
➤ Short Entry Target Profit Calculated By Short Entry Bar High By default 1 percentage you Can also Change Input depend on your choice
➤ There are Available both side Trailing stop-loss you can also use Depend on ur choice
➤ You can Also Add Alerts
Important: This Indicator we are using for Automation Trading if You Want This Indicator Access Please Contact me PM on Tradingview

SuperTrend High or Low BreakoutSuperTrend Breakout Indicator
Indicator Feature
SuperTrend High Breakout Line With Alerts
SuperTrend Low Breakout Line With Alerts
SuperTrend High Breakout with TP and Alerts
SuperTrend Low Breakout with TP and Alerts
You Can add TP percentage base or Point Base
SuperTrend SL Candle Both Side
SuperTrend Next Candle High Breakout Line With Alerts
SuperTrend Next Candle Low Breakout Line With Alerts
All Alerts In build This Indicator
Thank you so much :)

KAMA-ST BotExperimental supertrend model using KAMA (Kaufman Adaptive Moving Average) instead of RMA /SMA.
Good for scalping, NOT trend trading.
DO NOT USE THIS AS A STOPLOSS... you will get stopped!
Signals as what they are, no repaint, use other indicators as confirmation.
...have a play, good luck & stay safe!
SuperTrendSuperTrend is one of the most common ATR based trailing stop indicators.
In this version you can change the ATR calculation method from the settings. Default method is RMA, when the alternative method is SMA.
The indicator is easy to use and gives an accurate reading about an ongoing trend. It is constructed with two parameters, namely period and multiplier. The default values used while constructing a superindicator are 10 for average true range or trading period and three for its multiplier.
The average true range (ATR) plays an important role in 'Supertrend' as the indicator uses ATR to calculate its value. The ATR indicator signals the degree of price volatility.
The buy and sell signals are generated when the indicator starts plotting either on top of the closing price or below the closing price. A buy signal is generated when the ‘Supertrend’ closes above the price and a sell signal is generated when it closes below the closing price.
It also suggests that the trend is shifting from descending mode to ascending mode. Contrary to this, when a ‘Supertrend’ closes above the price, it generates a sell signal as the colour of the indicator changes into red.
A ‘Supertrend’ indicator can be used on equities, futures or forex, or even crypto markets and also on daily, weekly and hourly charts as well, but generally, it fails in a sideways-moving market.
I had converted Supertrend indicator code for various platforms like Metastock in 2017, but in this TradingView version special credit goes to everget - Alex Orekhov which gave a great inspiration to look my indicators better with highlights, signals and alarms. Thank you Alex.
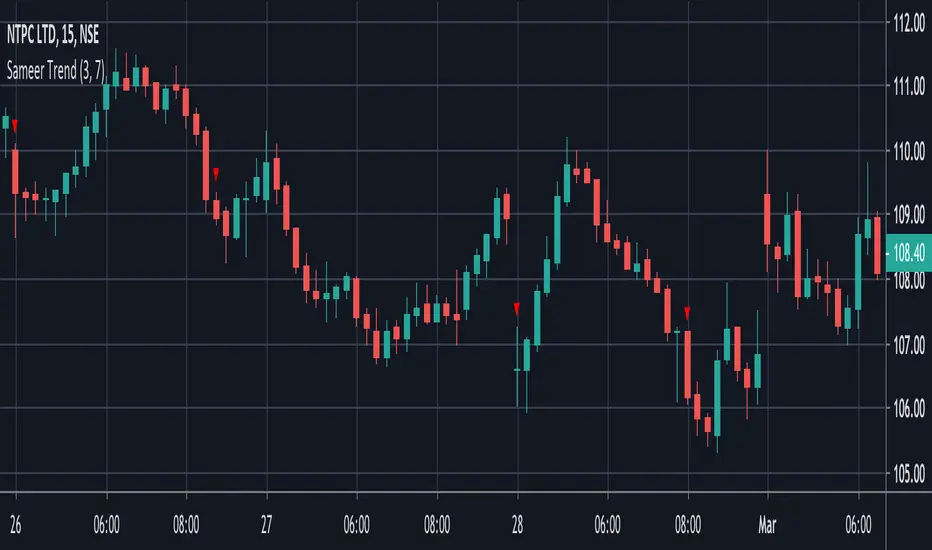
Sameer Trend - Super trend - ema - buy sell volumeThis script considers the following parameters
Super Trend
200 day ema
Buy & Sell Volume
And According to that gives you buy and sell Signal
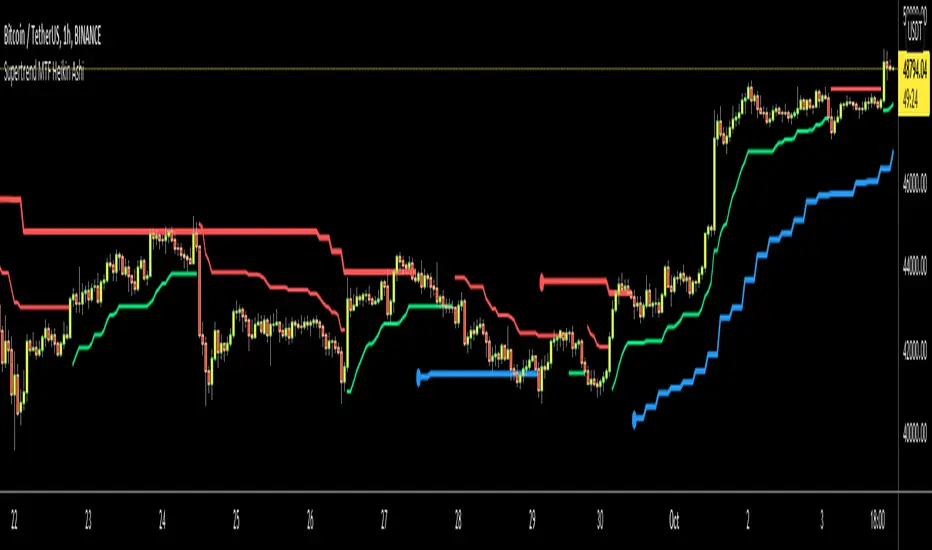
Supertrend MTF Heikin AshiThis is non-repaiting Supertrend Multi Time Frame script, uses Heikin Ashi Candles as source on normal chart
There is an option for Higher Time Frame. if you choose "Auto" then Higher Time Frame calculation is made by the script. If you choose "User Defined" option and then you can select Time Frame.
You better use this script with other indicators such as RSI, Momentum etc.
Enjoy!
SupertrendAn implementation of the supertrend indicator as it'll be implemented in build-in pine function
Supertrend calculates two values:
-supertrend
-direction
using the direction resistance and support are plotted.
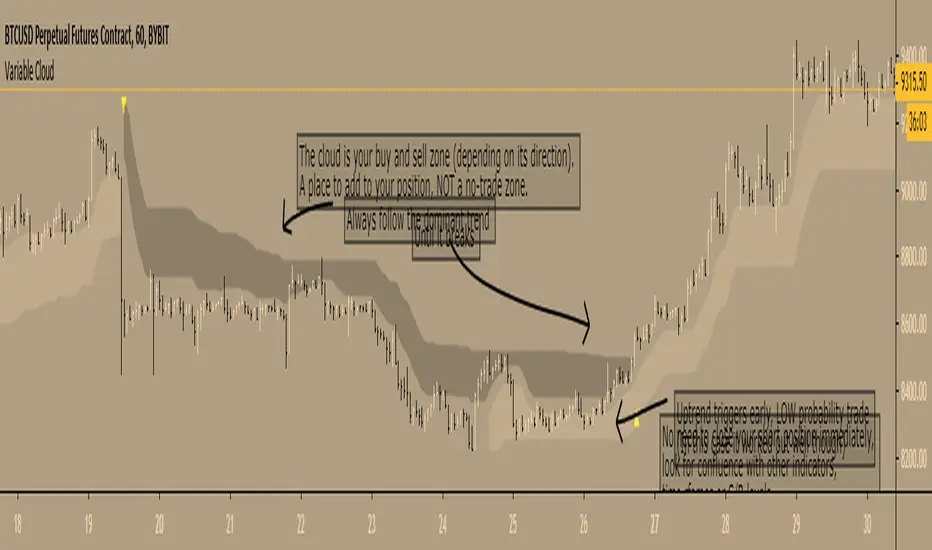
Variable Cloud - evoA Super Trend based on the high and low of a Moving Average, to get an easy view what the current trend is and where to buy and sell.
TIPS
- The 'Closing Source' option is the candle value that triggers the clouds. 'High/Low System' means that a downtrend is over when the candle LOW closes greater than the downtrend (dark cloud), an uptrend is over when the candle HIGH closes less than the uptrend (light cloud). The other options speak for themselves.
- Ideally place your stop loss outside the cloud, as you want to stay in the trend until it breaks to the opposite direction (but that's up to you of course).
- Reversal trades are low probability, you can see them as reversals or ranging before the market continues, I like to lower my risk on those set ups till it breaks the dominant trend.
Here are the scripts I used:
Everget's SuperTrend
LazyBear's VMA
Thanks LazyBear and Everget, I learn a lot from your scripts :)
Variable SuperTrend - evoPlayed around with Lazy Bear's VMA and Gunazzi's SuperTrend Cloud .
It plots an uptrend if the low of a candle gets above the recent downtrend and plots a downtrend if the high of a candle gets below the recent uptrend, you have to wait for the candle to close to confirm the actual trend change.
I use it to give me a direction for longs or shorts, not as a stop/reverse indicator.
Thanks Lazy Bear and Gunazzi :)

BEST Supertrend MAHello traders,
That one is an experiment
I was curious to see what a supertrend based on moving average cross could give
How does it work?
Bull event: fast moving average crossing over the slow moving average
Bear event: fast moving average crossing under the slow moving average
When the event is triggered, the script will plot the Supertrend as follow
UP Trend = ohlc4+ ATR * Factor
DOWN Trend = ohlc4- ATR * Factor
Interesting to see the results given by ohlc4 vs hl2 and hl3
Documentation: www.tradingview.com
This is an alternative of the classical Supertrend based on candle close being above/beyond the previous Supertrend level.
Hope you'll enjoy it and it will improve your trading making you a better trader
Dave

BEST Supertrend CCIHello traders
Today I present you a Supertrend not based on candle close but based on a CCI (Commodity Channel Index)
How does it work?
Bull event: CCI crossing over the 0 line
Bear event: CCI crossing below the 0 line
When the event is triggered, the script will plot the Supertrend as follow
UP Trend = High + ATR * Factor
DOWN Trend = Low - ATR * Factor
This is an alternative of the classical Supertrend based on candle close being above/beyond the previous Supertrend level.
Hope you'll enjoy it and it will improve your trading making you a better trader
Dave

BEST Multicolor Supertrend InfoPanelHello traders
Today is a Pinescript hack to display multiple colors in one label.
I used that panel to show the Supertrend Long Term values (weekly, monthly, quarterly, yearly)
What is a Supertrend?
Definition : SuperTrend is an indicator that works on all timeframes and all instruments (stocks, futures, forex, ...). It is a great tool to follow market trends and optimizes your profits.
SuperTrend evolves below or above the prices depending on the trend. You can use it as an exit position indicator when its direction changes. You can also use it to place your stops.
So.... the hack is?
The hack is about creating a new label for each line - versus creating just one label containing the whole text
Best regards,
Dave

Trend-Following Combo-SuperTrend, EMA, Aroon, DMI, Laguerre RSIThis is a trend-following indicator which condenses two SuperTrend indicators -- one based on analysis over a shorter period of time (1.5, 7), and one based on analysis over a longer period of time (1.65, 100) -- into a single indicator which appears on your chart only when both the shorter- and longer-term analysis indicates a "SuperTrend" in the same direction.
Additionally, potential trade entry indicators are displayed in the form of up and down arrows when (by default) three of the following five indicators suggest that the market is trending in the same direction as both the shorter- and longer-term SuperTrend indicators:
EMA Crossover (8, 15)
Aroon Indicator (8)
Aroon Oscillator (8)
Directional Movement Index (DI +/-) (8)
Laguerre RSI (13)
You may update the parameters of any of the indicators to match your own preferences.
Additionally, you may also adjust the "Threshold" of indicators that must be in agreement with the SuperTrend to show a potential trade entry arrow. Bear in mind that if you set the Indicator Threshold too low, you will see more frequent trade entry arrows, many of which will not be profitable if taken. Similarly, set this value too high, and you will see fewer trade entry arrows that may not appear until after most of the "juice" in the trend has evaporated. Ideal values for the threshold seem to be between 2-4, depending on the symbol you are trading.
The following image shows all of the indicators referenced above on a 5-minute chart of the SPY during a single trading day:
And, here is the same period of time showing only the Trend-Following Combo indicator with default settings:
This indicator would not have been possible save for work contributed by the following:
SuperTrend by Rajandran R
Aroon w/ crossovers highlighted by seiglerj
Aroon Oscillator by jcrewolinsky
Directional Movement Index by TradingView
Laguerre RSI (Self Adjusting Alpha with Fractals Energy) by everget

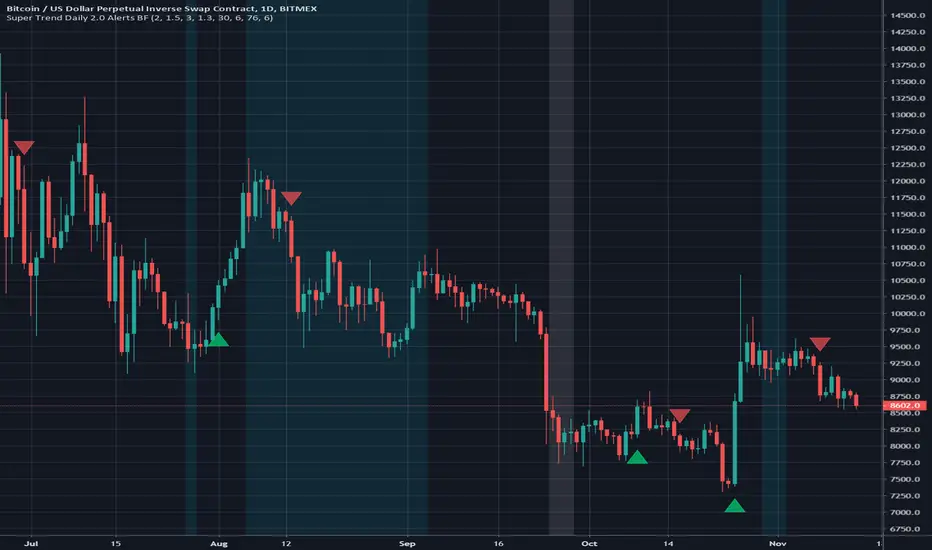
Super Trend Daily 2.0 Alerts BFThis is an alerts script for my Super Trend 2.0 indicator . It is intended as a companion script so you can backtest using the Strategy script and generate alerts using this Study script.
This Study script has the same default settings as the Strategy script and its only purpose is to provide alerts for the long and short signals the Strategy generates. Obviously, if you want to generate alerts based on a Strategy backtest, please ensure the settings are the same in the Study as in the Strategy.
For illustration, I have plotted arrows on the chart for long and short signals, and also colored the background to show when the rate of change function determines a choppy/sideways market.
ALERTS
There are 2 alerts set up:
Long Entry
Short Entry
ILLUSTRATION
Green arrow = Long Entry
Red arrow = Short Entry
White background = No short trades
Aqua background = No long trades
EXAMPLE USE CASE
1. Open a Bitcoin/USD chart on 1D timeframe.
2. Open this script and the Super Trend 2.0 indicator script.
3. Backtest with the Strategy Backtester and change the settings if you like until you get a desirable outcome for your own purposes.
4. Once you are happy with the backtest, change the settings in the Alerts script (this one) so they match the Strategy settings.
5. Set up the alerts according to your preferences.
Centerline SupertrendA centerline/non-chart indicator version of Everget's Supertrend script for use in NNFX-style indicator setups, with the emphasis on this indicator NOT adding visual clutter to the main charting area with a baseline indicator already present.
This is literally the EXACT same script as Everget's Supertrend, but not drawn on the chart and with the fill/stop and fill/state level removed.
Adjust to your timeframe/asset and backtest/forward-test accordingly.
Source script by Everget (Supertrend):

Fabonacci Trailer - [Alerts]This script comes with the following indicators and features:
ADX indicator
Chop indicator
Super Trend indicator
Trailing Take Profit and Stop Loss
Entry, Take Profit, and Stop Loss Alerts
Renko chart support
And a few more indicators in the back-end to increase accuracy and optimize entries
This script works really well as a scalper on lower Time Frames as well as on higher Time Frames. Besides that you can also use it on pretty much any coin or asset.
This script is not repainting. We advise to use alerts on “Once Per Bar Close”.
If you’d like to automate this script you can do that by using AutoView, ProfitView, ProfitTrailer, CryptoHopper etc.
Please note that this script is based on invite only.

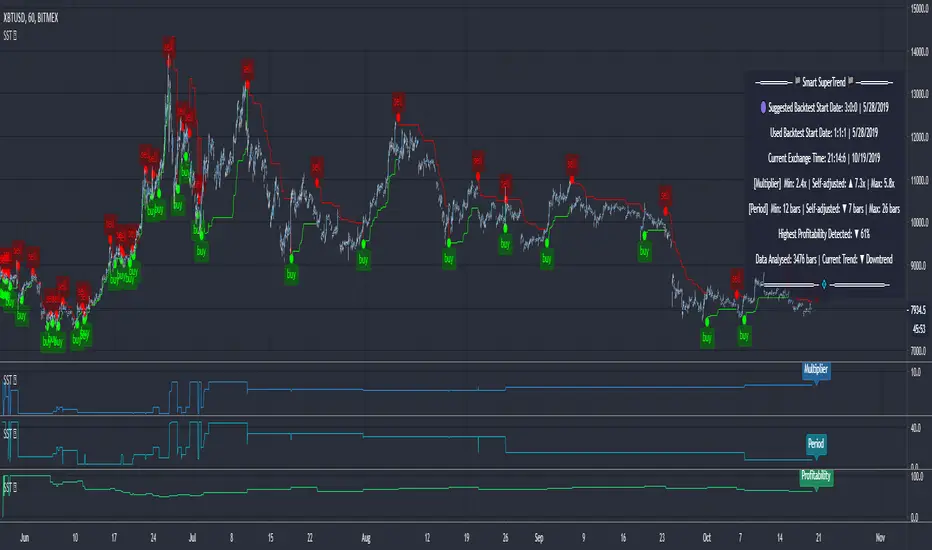
SuperTrend (Self-Adjusting Parameters for Highest Profitability)SuperTrend (Self-Adjusting Parameters for Highest Profitability)
The SuperTrend is a trend-following indicator.
It works best when it is used along with other indicators.
It performs well in trending markets and can give false signals in volatile markets.
It becomes Smart when its Multiplier and Period parameters are automatically detected .
• Self-Adjusting Multiplier and Period parameters
• The graphs for Profitability, SuperTrend Multiplier, SuperTrend Period and the SuperTrend itself are available to choose for display from the indicator settings
• A chart layout can be made just for the Smart SuperTrend, having all the graphs nicely displayed
• Alerts for changes in Trend, Multiplier, Period, Profitability
The range for Multiplier, Period and Time can be changed in the indicator settings.
This affects the loading speed (smaller range, faster to load), as well as the accuracy of the signals.
The indicator switches to the most profitable Multiplier and Period parameters automatically, in real-time .
It scans across the entire historical data made available by TradingView.
The Smart SuperTrend works on all timeframes and symbols available on TradingView.
It does not repaint!
But several aspects must be considered:
- 1. TradingView periodically removes access to old data while giving access to new data in real-time.
____ The frequency depends on the timeframe, amount of data. It can happen daily for second charts, weekly for minute charts.
____ Since the Indicator wouldn't have access to that old data anymore, the Profitability may change its value, causing a certain degree of repainting.
- 2. The starting time for Backtest must be inserted in the settings panel.
____ As long as that starting time has available price data, the SuperTrend will NOT get repainted.
____ A suggested starting date for the analysis is shown on the chart. Insert the date in the indicator settings.
This indicator is compatible with the Wrapper Module of the Risk Management System indicator, which means they can work together as a trading bot .
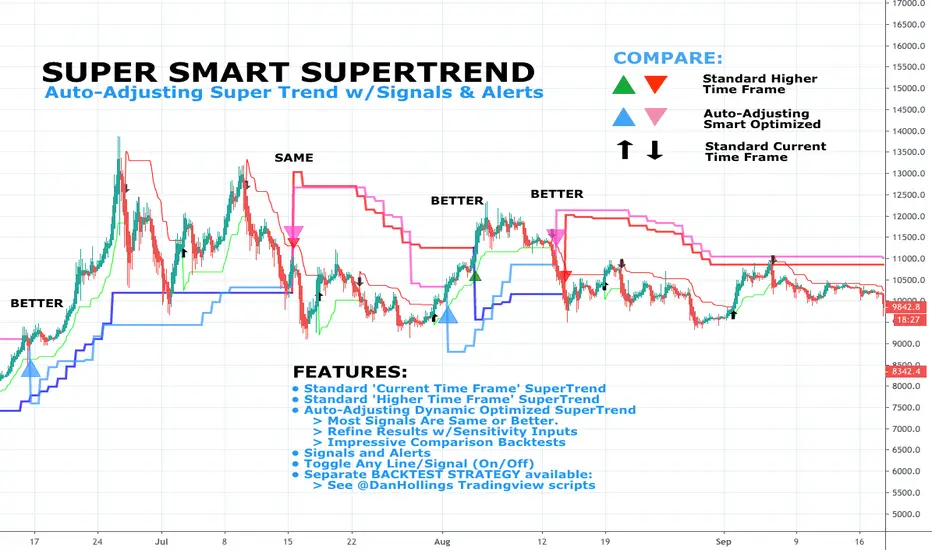
DH: (Study) Super Smart SuperTrend: Self AdjustingSUPER SMART SUPERTREND (Study Version w/Alerts)
Using data from other indicators I came up with a SMART SUPERTREND that auto-adjusts as the market changes - shall we call it "Artificial Intelligence?" Yes, you can fine tune it for specific assets and timeframes, but once the settings are entered, it auto-adjusts as the market and prices evolve.
This is the STUDY version of "Super Smart SuperTrend" with ALERTS. There is also a STRATEGY version which is designed for backtesting various settings.
STRATEGY VERSION FOR BACKTESTING IS HERE
ABOUT THIS INDICATOR
As the name suggests, 'Supertrend' is a trend-following indicator that is notably popular here on Tradingview and elsewhere. It does a remarkably great job of recognizing a trend (in progress) and it will signal you to initiate a position when the trend is clear. Perhaps the greater value of Supertrend is that it helps keep you in your position until that trend is over.
WHAT'S THE BEST ATR PERIOD AND MULTIPLIER?
There are two important data points we must enter for Supertrend to work, namely the 'period (ATR number of candles or days)' and the 'multiplier (value by which ATR is multiplied)' BTW, in case you don't know, ATR signals the degree of price volatility. A common default setting is 10 for the ATR period and 3 for the multiplier.
SORRY, BUT THE MOVIE STARTED HALF HOUR AGO...
Unfortunately Supertrend has a couple of big weaknesses. Generally, it fails in a sideways-moving market and when it does detect a trend, the signal to get in (or out) comes rather late. It's like someone telling you about a great movie they're watching, but by the time you start watching, one-third of the movie is over... bummer, right?
HOW TO IMPROVE SUPERTREND
One solution is to combine Supertrend with other indicators such as MACD, Parabolic SAR, RSI, etc. And another solution is to experiment (backtest) with the Period and Multiplier settings for the asset and timeframe you are considering for trade.
For the STANDARD SETTINGS in this "Super Smart SuperTrend" indicator, I have set 9 for the ATR and 2.2 for the multiplier as default after backtesting on Bitcoin and other crypto (mostly in the 15 minute to 6 HOUR timeframe). Of course you can change this easily to any ATR period and Multiplier you like.
BUT... WHY NOT GET SMART?
I started thinking, it might be best if we let the market determine candle-by-candle what the settings should be. If everyone says that Supertrend works best in conjunction with other indicators, why not do our "conjuncting" programmatically (ie: automatically) sorta like artificial intelligence!
HOW IT WORKS
So here's what I did. Using data from other indicators I came up with a SMART SUPERTREND that auto-adjusts as the market changes. It still has settings so you can fine tune it for specific assets and timeframes, but once the settings are entered, it auto-adjusts as the market and prices evolve.
With "Super Smart SuperTrend" there is no ATR period setting (that is determined programmatically) and now there are TWO multipliers you can experiment with... (a lower one set at 1.7 default and a higher one at 2.5). These multiplier settings create a multiplier range that can be used programmatically to adjust the multiplier as the market and prices evolve.
THE RESULTS
Across all time frames and assets I've tested, I generally get better results. Better entries, better exits and well defined trends. In comparison with a STANDARD Supertrend, it is not radically different, but when it does differ "Super Smart SuperTrend: is almost always better. All this is substantiated by backtesting of course.
SAMPLE BACKTEST RESULTS (BTC/USD)
Using Indicator Defaults
TIMEFRAME STANDARD RESULTS SUPER SMART RESULTS
% Profitable | Profit Factor % Profitable | Profit Factor
DAY 58.33% 9.38 75.00% 10.77
4 HOUR 78.43% 18.22 80.95% 21.78
1 HOUR 74.11% 8.98 70.13% 9.34
15 MIN 58.10% 6.10 71.43% 9.48
Keep in mind that "Profit Factor" is key. It basically tells you what you'd make for every ONE DOLLAR invested by consistently trading with the backtested parameters.
SUPER SMART SUPERTREND FEATURES
• There is a STUDY VERSION w/Alerts
• There is a STRATEGY VERSION for Backtesting
• Standard 'Current Time Frame' SuperTrend Line
• Standard 'Higher Time Frame' SuperTrend Line
• Auto-Adjusting Dynamic Optimized SuperTrend Line
> Most Signals Are Same or Better than Standard
> Refine Results w/Sensitivity Inputs (2 Multipliers)
> Impressive Comparison Backtests
• Both Standard and Smart Signals and Alerts
• Toggle Any Line/Signal (On/Off)
• Toggle Backtest
> Standard vs. "Smart Auto-Adjust"
> Backtest Higher Timeframe Only
WHAT MORE COULD YOU ASK FOR?
So glad you asked. Actually, there is more... Super Smart SuperTrend is incorporated into my premier indicator set called: STONEHENGE PLUS: SUPERTREND TRADING TOOLKIT.
With STONEHENGE, I'm combining this Super Smart SuperTrend with dozens of other indicators plus predictive "Stones." Check out STONEHENGE... you'll be in Trader's Heaven.
That's it. Get "SMART" Today!
STONEHENGE PLUS:
The Complete SuperTrend Trading Toolkit
SUPER SMART SUPERTREND ALSO WORKS WITH:
STONEHENGE BASIC: Double Stone Version (Study w/Alerts):
######
######
PLEASE HIT THE LIKE BUTTON (and follow me... lots of great stuff in the works!)
As always, I appreciate your support. Please share with others.
ENJOY!
Dan Hollings
Master Crypto Grid Trader
Stonehenge Master Mason
Host of the "High Leverage Lounge"
Please Explore My Other Indicators, Scripts, Grids and Educational Ideas.
@DanHollings on Tradingview.
Additional Links Below...
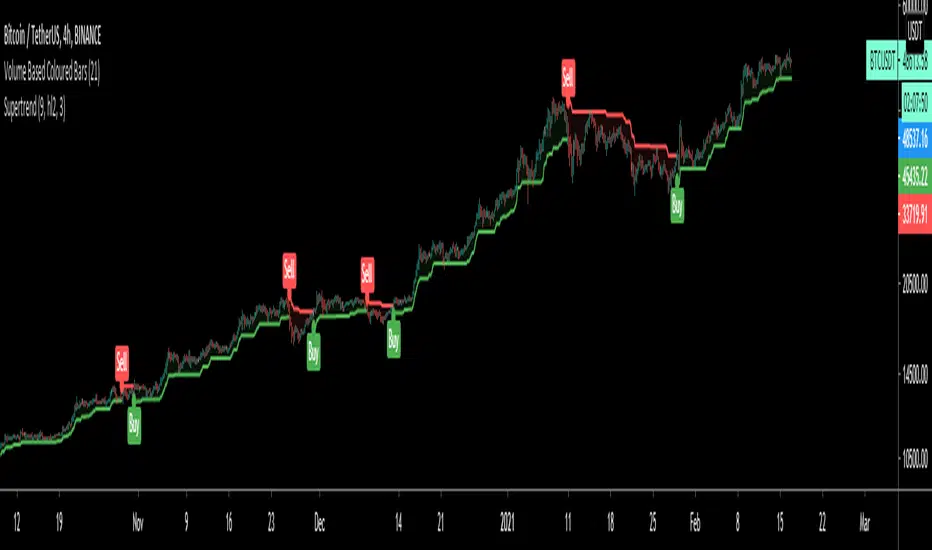
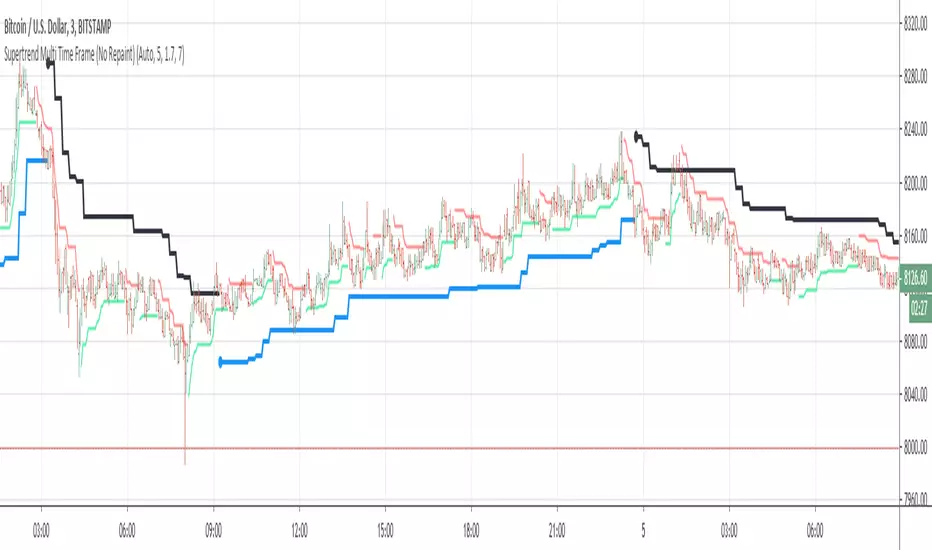
Supertrend Multi Time Frame (No Repaint)This is non repaiting Supertrend Multi Time Frame script.
There is an option for Higher Tİme Frame Period. if you choose "Auto" then Higher Time Frame calculation would be made by script. Or you can choose "User Defined" and then you must choose the period for Higher Time Frame.
You better use this script with some indicators, RSI , Momentum etc.
_ LonesomeTheBlue _
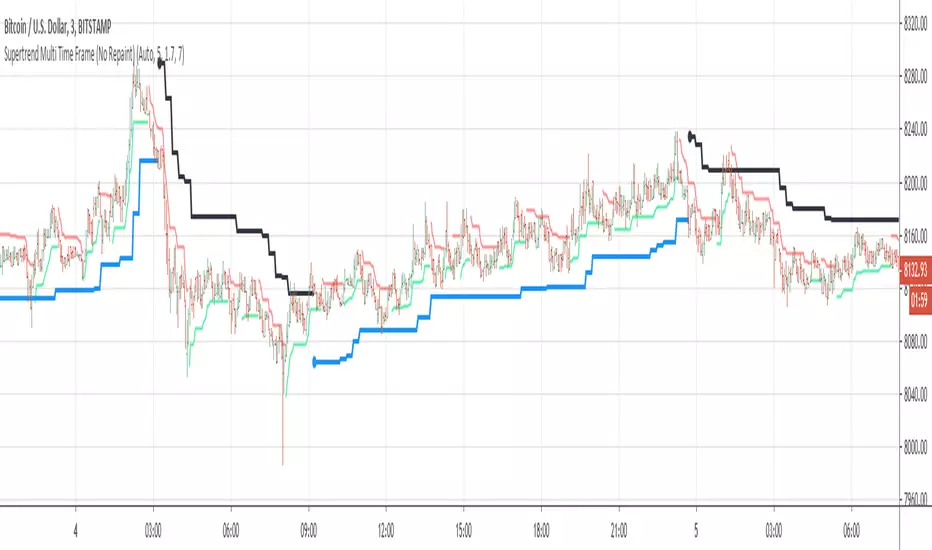
Supertrend Multi Time Frame (No Repaint)This is non repaiting Supertrend Multi Time Frame script.
There is an option for Higher Tİme Frame Period. if you choose "Auto" then Higher Time Frame calculation made by script. Or you can choose "User Defined" and then you must choose the period for Higher Time Frame.
You better use this script with some indicators, RSI, Momentum etc.
If you find my works useful, please consider a donation
BTC: 19qDW9AShZhBZsGuXcgRzam5Fbpc3EU8EV
ETH: 0x39c8552371b9b7f4e324197af460ba8bc8e18ef9
Compact Self-Adjusting SuperTrendA custom version of Self Adjusting SuperTrend that can be used as source for your trading frameworks and indicators.
