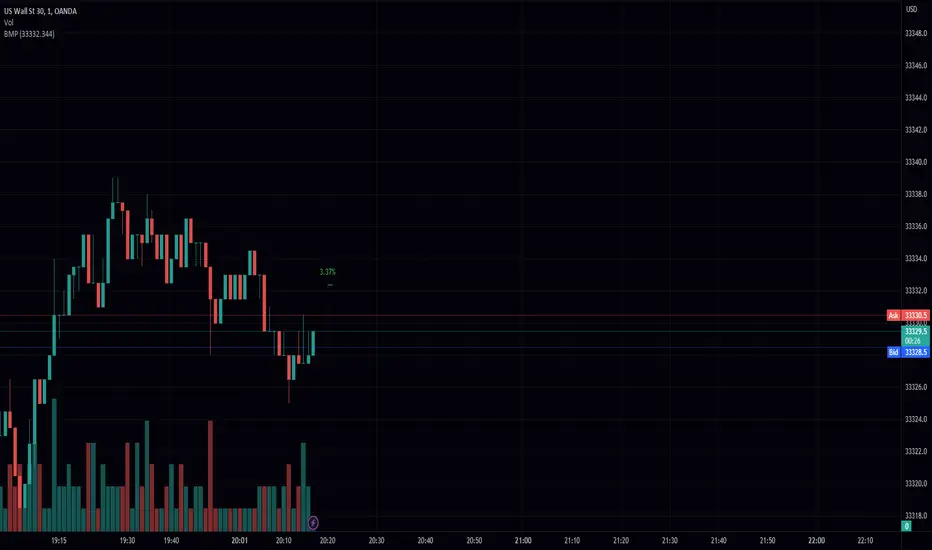
NSDT Pivot Points PlusThis script uses the Traditional Pivot Points but includes the price levels and the 50% line between levels. We added the ability to change the line color of the major levels and the minor levels independently, for better clarity. Added alerts - used code from QuantNomad.
Pivot Points description from TradingView default indicator:
Pivot Point analysis is a technique of determining key levels that price may react to. Pivot points tend to function as support or resistance and can be turning points. This technique is commonly used by day traders, though the concepts are valid on various timeframes. There are several methods of identifying the exact points. Common types of pivot points are Traditional, Fibonacci, Woodie, Classic, Camarilla and DM and each type has its own calculation method.
Most use a variation of significant prices such as established highs, lows, opening and closing prices and then apply a calculation to determine these points. They all calculate additional support and resistance levels alongside the pivot points. They can be used to determine when to enter or exit trades or to determine the range of a market. Conservative traders look for additional confirmation before entering a trade. Whether pivot points are used alone or in combination with other techniques, they are a useful tool in a technical trader's toolbox.
Support
[RickAtw] O1 Opening Market LineThis indicator helps to identify current support and resistance based on the opening of the Asian, London and New York sessions.
Function
You can make good trade entries based on these lines. Shows daily and weekly openings of each session
It will also help you to look at which session you are currently trading)
Purple ----> Asian session
Red ----> London session
Blue ----> New York session
Key Signal
buy ---> A strong buy signal is a bounce from the low and the presence of a weekly or day open line.
sell ---> A strong sell signal is a bounce from the maximum and the presence of a weekly or day open line.
P.S. Be sure to test on your pair!
Remarks
This will help you determine the approximate area of support and resistance.
Since we cannot look into the future, it does not inform you about the exact records, but a possible change in trends.
Readme
In real life, I am a professional investor. And I check each of my indicators on my portfolio and how effective it is. I will not post a non-working method. The main thing is to wait for the beginning of trends and make money!
I would be grateful if you subscribe ❤️
[TS] Sniper Support ResistanceThis script is our Pivot Points and ATR based Support and Resistance indicator
-A Support is a price level where a downtrend can be expected to pause due to a concentration of demand or buying interest. As the price of assets or securities drops, demand for the shares increases, thus forming the support line. Meanwhile, A resistance zone arises due to selling interest when prices have increased.
- By increasing the "S/R Multiplier" input, the user can change the distance from the S/R swing points
- By increasing the "S/R Length" input, the user can adjust the S/R Swing Points lookback length (pivot detection range)
Market Makers (PVSRA) - DataCrypto Analytics
Script to track market makers.
Colors candles with higher trading volumes, demonstrating that a lot of smart money is happening.
Exponential moving averages of 100, 200 and 233 periods with VWMAP 25 and DRAGON.
To use this indicator, it is necessary to understand PVSRA strategy.
You can read our PVSRA study on our profile.
//////////////////////////////////////////////////////////////////////////////////////////////////////
// PORTUGUES
//////////////////////////////////////////////////////////////////////////////////////////////////////
Script para rastrear Formadores de Mercado.
Colore velas com volumes de negociação mais altos, demonstrando que muito dinheiro inteligente está acontecendo.
Médias móveis exponenciais de 100, 200 e 233 períodos com VWMAP 25 e DRAGON.
Para usar este indicador, é necessário entender a estratégia PVSRA.
Você pode ler sobre estudo PVSRA em nosso perfil.
TEWY - Magic Support/Resistance1. This Indicator is used to identify the short-term and longer-term Support/Resistance levels.
2. Please try to keep base inputs as provided though it gives you the opportunity to change ticket price source and length as per your convenience.
3. With default settings:
a. The thick Red line is identified as Longer timeframe support
b. The thin Red line is identified as short timeframe support
c. The thick Green Line is identified as Longer timeframe resistance
d. The thick Green line is identified as short timeframe resistance
e. As per this indicator Gray area is where one can avoided taking a position or exit the existing positions if the candle's low or high Brocken which is closing in gray area as per the trade direction
Calculation Logic Used:
1. I calculated an average of 1-20 ROC average and checked price is above the it
2. I calculated 2 ATR based on 20 period to get the nearest support
3. If price is above both of above then plotted longer-term support based on ATR and shorter-term support based on ROC average.
One can use this indicator on any timeframe, though I created to see charts at a monthly and quarterly level to see for the investment opportunity.
Always respect RISKS and follow stoploss.
Let's understand how to take a position using this indicator
Thin Line = Shorter Time frame
Thick Line = Longer Time frame
Long position:-
1. Wait for the Candle to close above the Thin and Thick lines
2. Please make sure the close is firm above both of these lines.
3. Then enter long with stoploss below the Thick line.
4. Keep trailing stoploss with the thin line, so when the candle closes below thin line keep stoploss below low of that candle.
Short Position:-
1. Wait for the Candle to close below the Thin and Thick lines
2. Please make sure the close is firm below both of these lines.
3. Then enter short with stoploss above the Thick line.
4. Keep trailing stoploss with the thin line, so when the candle closes above the thin line, then keep stoploss above high of that candle.
I have given a sample illustrational image below, which should help you understand this indicator
Best of luck
ZigZag Multi Time Frame with Fibonacci RetracementHello Traders,
This is ZigZag Multi Time Frame with Fibonacci Retracement script. It calculates the ZigZag using Higher Time Frame, draw Fibonacci Retracement lines and put labels accordingly. I already published Zigzag with Fibonacci Levels script but this one is Multi Time Frame and I didn't want to change/update it.
You can set ZigZag Period and Resolution as you wish. Zigzag is calculated using higher time frames (ex: 1day) so you better choose small numbers as Zigzag Period, such 2, 3 etc. you should choose higher time frame wisely, meaning that you should not set 1Day while chart resolution is 1min ;)
It draws Fibonacci levels between 0%-100% and If the price goes higher/lower than 100% level than the script draws Fibonacci Levels accordingly. This means it draws Fibonacci levels until this levels get higher/lower than the price.
"Show Zig Zag" is not enabled by default, you can enable it if you want to see ZigZag as well.
You have options to set Text Color, Line Color, Zigzag Up Color and Zigzag Down Color.
You can set the location of the Fibonnaci Levels -> Left or Right
You also have option to enable/disable following Fibonnaci Levels:
---> 0.236
---> 0.382
---> 0.500
---> 0.618
---> 0.786
I added "Colorful Fibonacci Levels" for fun. if you enable it then Fibonacci line colors will be different randomly on each move, see it for yourself :)
Some Screenshots:
if you enable "Show Zigzag Option":
how the script adjust levels automatically:
if you set Label Location as "Right":
if you enable "Colorful Fibonacci Levels" then Line colors will be changed on each move randomly ;)
Enjoy!
NSDT Pivot ZonesThis is a new take on Traditional Pivot Points. By modifying the calculations, we were able to create "pivot zones" with a decent degree of accuracy.
PRIME - ShadoW ZoneZ with RSI LevelsIn This experimental study, we've taken RSI data, Volume Profile, and Trend analysis, combining them into one unique package that will allow a trader to analyze market trend lines and their proposed channels, trend momentum through candle color augmentation similar to "Pulse", and Visible Volume index price levels on chart for the current sequence. Below are explanations of each function within the system.
The Semafor is used to spot future multi-level Supports and Resistance zones.
It is also useful to spot HL or LL or HH or LH zones at different Depth settings.
The red zones are the extreme places where the market has a higher chance of reversing while the green zones have the lowest setting with lower chances of the market reversal
Automatic Trend Lines
The indicator takes in 2 timeframes to detect High and Low values from which to draw the trend lines of each timeframe.
As the values change with price movement, the lines are updated. They are color coded for uptrend and downtrend based on the direction of each individual line. Trend lines can be set up to color with only the default value on the configurations panel.
- Toggle on/off Color Coded
- Change Default, Uptrend, Downtrend color
- Change Line Width
- Change Line Style
- Toggle on/off Line Extensions
- Change Extended Line Width
- Change Extended Line Style
- Toggle On/Off labels for 7 data points of each timeframe
Automatic Trend Sights
This is a neat feature that may help you get a better feel for the direction the current movement is heading towards in correlation with the short or medium length timeframe trends. The sight draws a line from the middle vertical point of the trend coordinates towards the current price. They are toggled off by default but can be enabled in the configurations panel.
- Toggle on/off sight on each timeframe
- Change Width
- Change Line Style
Support & Resistance Levels, the main aim of the study. Level calculations are based on Relative Strength Index ( RSI ) threshold levels of oversold/overbought and bull/bear zones, where all threshold values are customizable through the user dialog box. Background of the levels can be colored optionally.
RSI Weighted Colored Bars and/or Mark Overbought/Oversold Bars , Bar colors can be painted to better emphasis RSI values. Darker colors when the oscillator is in oversold/overbought zones, light colors when oscillator readings are below/above the bull/bear zone respectively, and remain unchanged otherwise. Besides the colors, with “Display RSI Overbought/Oversold Price Bars” option little triangle shapes can be plotted on top or bottom of the bars when RSI is in oversold/overbought zones .
Disclaimer:
Trading success is all about following your trading strategy and the indicators should fit within your trading strategy, and not to be traded upon solely
The script is for informational and educational purposes only. Use of the script does not constitute professional and/or financial advice. You alone have the sole responsibility of evaluating the script output and risks associated with the use of the script. In exchange for using the script, you agree not to hold dgtrd TradingView user liable for any possible claim for damages arising from any decision you make based on use of the script
Tradespot - S&R SuiteTradespot - S&R Suite
No configuration needed, works out the box
Dynamically created S&R lines & zones based on ongoing price action
Dynamically created fibonnaci retracement lines to create your trading range
Completely open to building a core trading strategy upon
Want to know more or have questions? Come join the Tradespot community, or send me a message on TradingView.
asw Intraday SetBest for intraday trading!
Key levels to watch during intraday include Open price, high & low of the the and of yesterday's.
These lines are plotted on the chart with VWAP in addition.
Hope it helps!
Bull Market Support Band (20w SMA, 21w EMA)This moving average indicator is a bull market support band. It's significance comes from the previous bull runs where the price was bouncing off or riding from a distance the support band until the end of the market cycle. For example, during the 2017 bull run, Bitcoin had several 30-40% corrections to the support band.
The green line represents the 20 weeks simple moving average and the red line represents the 21 weeks exponential moving average. The best way to read the current value is to look at the weekly chart, but any time frame will display the same values.
Ichimoku + 2 base linesIchimoku + 2 base line
This indicator is a combination of Ichimoku cloud indicator with two base lines.
The first base line is the same as the Ichimoku default settings but the baseline 2 indicates an average of 108 candles in the past and it acts as a strong support and resistance level.
How to use this indicator?
You can use this indicator to see if a break out is true or is a false break. For example if the price broke up the Ichimoku cloud and base line 2 is above the price, it will probably react to that area but if it's below the price, it is a good opportunity to buy. (for sell/short position it is in the opposite way the base line 2 should be above the price)
If you want to trade in support zones base line 2 (108) is a very good area that you can wait for a good candlestick pattern to enter a position.
Caution: before using this indicator please back test it and if the results were good enough, use it as a confirmation.
Support/Resistance Zone Auto [PRO]This is an indicator that automatically detects and displays support / resistance zones.
It displays up to 5 zones with a large number of reversals.
- Zone Color : Set the zone color.
- Number Of Zones : Set the number of zones to display. Can be set from 1 to 5.
- Zone Width : Set zone width. Selectable from "Very Wide", "Wide", "Normal", "Narrow", "Very Narrow".
- Number Of Reference Bars : Set the number of bars to reference. Selectable from "500", "1000" and "1500". When "1000" is set, the past 1000 bars are referenced from the latest bar (current bar) to investigate the reversal status.
- Reference Point Label : Set the color of the label displayed at the reference start position. Selectable from "Black", "White", and "None". If this parameter is "Black" and the "Number Of Reference Bars" parameter is "1000", a black label with "1000 bars" will be displayed 1000 bars before the current bar.
- Increased maximum zone display from 3 to 5.
- Zone color can be set with Input.
- Display the price range of the zone (eg 1.5600 - 1.5650)
- Display Reference Point Label.
Support/Resistance Zone Auto [FREE]This is an indicator that automatically detects and displays support / resistance zones.
It displays up to 3 zones with a large number of reversals.
- Number Of Zones : Set the number of zones to display. Can be set from 1 to 3.
- Zone Width : Set zone width. Selectable from "Very Wide", "Wide", "Normal", "Narrow", "Very Narrow".
- Number Of Reference Bars : Set the number of bars to reference. Selectable from "500", "1000" and "1500". When "1000" is set, the past 1000 bars are referenced from the latest bar (current bar) to investigate the reversal status.
NSDT Pre-Market Breakout LevelsA simple way to identify potential breakouts at the New York market open. This indicator plots the high and low of the New York Pre-Market, providing a great visual of a potential breakout levels.
HTF Highs Lows [JV]█ OVERVIEW
This script presents a label with an overview of higher timeframe highs and lows. This can be useful information as we all know that price likes to revisit previous highs and lows area, specially on the higher timeframe.
█ CONCEPTS
This information can be relevant and valuable for various reasons:
Finding horizontal Support and Resistance
Get a better view on Market Structure
Provide some information about Order Flow
TrendLines
...
█ FEATURES
Plots
This script provides the option to show information about 3 timeframes
Each timeframe can be separately shown or hidden
The Y position of the info label can be user defined, based on high or low of the chosen timeframe
The X offset of the info label can be adjusted to the user's liking and the chart resolution
The label color and text color can be user defined
The info label's size can be user defined
█ NOTES
Caveat
The timeframes must be chosen in order of size. Meaning that the highest timeframe should be on top. This is title as such on the info label, but I want to mention it again as it's something to pay attention to.
Repainting
The question that pops up all the time is: Does it repaint ?
I will quote PineCoders on this:
We're pretty sure Wilder was not asked very often if RSI repainted. Why? Because it wasn't in fashion—and largely unnecessary—to ask that sort of question in the 80's. Many traders back then used daily charts only, and indicator values were calculated at the day's close, so everybody knew what they were getting. Additionally, indicator values were calculated by generally reputable outfits or traders themselves, so data was pretty reliable. Today, almost anybody can write a simple indicator, and the programming languages used to write them are complex enough for some coders lacking the caution, know-how or ethics of the best professional coders, to get in over their heads and produce code that does not work the way they think it does.
Briefly: yes, it repaints and no it does not matter.
Simple because we are working with highs and lows on a higher timeframe. So if we get a new high or low within a certain time frame, we want this new high or low to be displayed and, for me, it's not relevant if this information appears when it happens or when the candle closes.
Questions & Suggestions
Questions, suggestions or even a word of thanks are always welcomed in the comments section. I usually answer within the same day.
█ THANKS
A word of thanks to, and I hope I am allowed to use hyperlinks here, LonesomeTheBlue for being an inspiration on coding style and his work on arrays in Pine Script and to lmatl for his support, words of advice and letting me borrow his brain now and then.
pivot semaphore support&resistance levels [LM]Hello Traders,
I would like to introduce you pivot semaphore support&resistance levels. The idea is the same as the zigzag script of mine to spot the importance of support&resistence
The Semafor is used to spot future multi-level Supports and Resistance zones.
It is also useful to spot HL or LL or HH or LH zones at different Depth settings.
The red zones are the extreme places where the market has a higher chance of reversing while the green zones have the lowest setting with lower chances of the market reversal
The lines can be extended like so
The lines also can just stop extending when price will reach it
Enjoy!
Multi Time Frame Candles with Volume Info / 3DHello Traders,
This is my second Multi Time Frame Candles script but with this new one, you will have some new features such volume info, remaining time to close of higher time frame candle and also developed using new features of Pine such array of lines. also I tried to make it 3D for better visualization ;) also it shows new highs/lows / breakouts.
I tried to make many things optional, so you can change almost everything using options.
What you can change using options:
- Higher time frame
- Number of Candles
- Candle Colors Up/Down
- Wick Color
- Volume colors Up/Down
- Text color of Remaining Time
- Shadow Color
- Background color
- Start bar of the candles (so you can see many higher times frame candles in same window)
- 3D effect, by default it's enables but you can disable 3D view
Lets see some examples:
Remaining time:
Breakouts:
You can combine different higher time frames:
if you don't want 3D view then combining different higher time frames:
You can change background color:
Enjoy!
Double BB + Multi Ema Supports 2.0 // by Mochero Use this indicator to identify the market trend, possible dynamic support or resistance, and possible reversals or corrections.
Take the moving averages (50,75,100,200) as a reference to identify whether the market is bullish or bearish.
Use the Parabolic Sar, to identify minor trends.
Take as reference the Moving Averages (5,9,15,25) as possible support or dynamic resistance.
You can also use a DEMA 9.
This indicator marks past Supports and Resistances to have a reference and mark reversal zones.
Take the BB as a reference, to identify possible setbacks or trend changes.
Added a third BB (optional).
-Added 3 types of signals, with RSI, Stoch, DMI. They indicate possible reversals or changes in trends.
Suggested values
-RSI 4
-Stoch 1 (5,1,1)
-Stoch 2 (14,1,1)
-DMI (10, 3)
[astropark] Progressive VWAPDearDear Followers,
today another awesome Analysis Tool, that you can use in your trading journey: Progressive VWAP !
If you love vwap, you will love this indicator, as it calculates some special "progressive" / "evolving" vwap levels:
daily vwap named dvwap
2D vwap named 2dvwap
3D vwap named 3dvwap
weekly vwap named wvwap
2W vwap named 2wvwap
Monthly vwap named mvwap
Quarterly vwap named qvwap
Yearly vwap named yvwap
You can:
choose which progressive vwap to show and which to hide
change each line color / thickness / display style (solid or dashed)
choose to show or hide labels and change their size
Why such indicator should be helpful? How can I use it to do profit?
In multiple ways:
when a lower timeframe crosses an higher timeframe progressive vwap, you know sentiment is getting bullish and viceversa if the cross is downwards
price tends to bounce on such progressive vwaps: the higher the timeframe, the more probably the bounce is as well as the magnitude of the breakout of the level
This indicator works on every timeframe, market and pair.
As I always say, all tools are great if you use them correctly: this is not the "Holy Grail", so always use proper money and risk management strategies.
This is a premium indicator , so send me a private message in order to get access to this script.
Local LimitsDisplays recent higher highs, lower highs, lower lows, and higher lows as a collection of local limit indicators.
In its simplicity is a lot more powerful than might appear at first glance.
Does not rely on volatility calculation.
Can be linked together to create an objective view of recent support and resistance levels.
Makes current trends more visible.
Excellent for use as a trailing stop algorithm.
Parameters
Single Bar Sensitivity: True (default) reacts to individual bars. False only responds to the alignment of 2 bars.
Margin (1-5): Adds extra distance from higher lows and lower highs to reduce the sensitivity of broken trends.
Single indicators with configurable sources:
Local Limit Higher
Local Limit Lower
MrBB:BullBear Support BandVery simple and effective S/R band. Created bycombining the weekly 21EMA and weekly 20SMA, it provides strong support/resistance depending on market direction, and works as a basing area for retraces during parabolic (and normal) bull markets.
Support & Resistance LevelsPlots support and resistance levels based on occurrence of fractals.
Line width indicates historical significance of the level.
Decreasing the proximity multiplier input increases the sensitivity/ increases the frequency of level changes.
If price closes above a resistance level, the level becomes a support level and its color on the chart changes to green (& vice-versa).
NSDT Auto Fib Support / Resistance LevelsThis script automatically plots support and resistance lines using the fib numbers as the amount of candles to lookback. Each line is colored differently to easily identify the support/resistance pair (i.e. 23%, 38%, 61%, etc..) with the 50% (Green) and 78% (Red) a thicker line. All variables are editable. Added alert capability.