BOSS Automatic Trendlines and Support Zones IndicatorTHE BEST FOREX, BINARY OPTIONS, STOCK AND CRYPTO INDICATORS FOR TRADINGVIEW.COM
Our auto-trendlines indicator and our support and resistance zones indicator with Fast and Slow EMA's all combined in one!
TrendLines
Trendlines when drawn properly make an excellent tool for traders. Used improperly though, they become ineffective and even counterproductive, resulting in a belief that prices have made a reversal when they really haven't, or that a trend has strength when price action suggests it doesn't.
The Boss Auto Trendline Indicator draws the trendlines automatically, and now you can effectively use trendlines as part of your trading strategy.
Trendlines highlight a trend or range (sideways movement). A trendline connects swing lows, where the low is lower than the surrounding prices, and swing highs in price. When the price rises, the swing lows rise.
Red Lines & Dots.
Connecting these lows with a line results in an ascending trendline , showing you that the trend is up. A trendline can also be drawn along the swing highs. This shows the angle of ascent, and the strength of the price move, whether strongly higher or not.
Green Lines & Dots
When the price falls, the swing highs fall. Connecting these highs with a line results in a descending trendline , illustrating the downward trend. A trendline can also be drawn along the swing lows. This shows the angle of descent and the strength of the downward price movement.
Support & Resistance Zones
Green = Support Zones
Red = Resistance Zones
The basic trading method for using support and resistance is to buy/long near support in uptrends, and to sell/short near resistance in downtrends.
Fast & Slow EMA's
Trend Following - you essentially use the EMA to track the primary trend. If a trading pair does not close beyond the average - you stay in the trade.
Moving Average Crosses - by using two different exponential moving average crosses you can generate buy and/or sell signals. For example, you can have a fast average cross a slow average to trigger a trade signal.
Dynamic Support and Resistance - EMA periods like the 21 or 55 can act as support and resistance zones.
Support

Support/Resistance Zones x3Support and Resistance Levels + Zones for 3 time frames, based on volume at fractal levels with Zones based on wick size which is a true reflection of a Zone when compared to other S/R Zone scripts which only use a thick line not based on anything.
Original script is thanks to synapticex I have just migrated to version 3, heavily modified it and added Support and Resistance Zones.

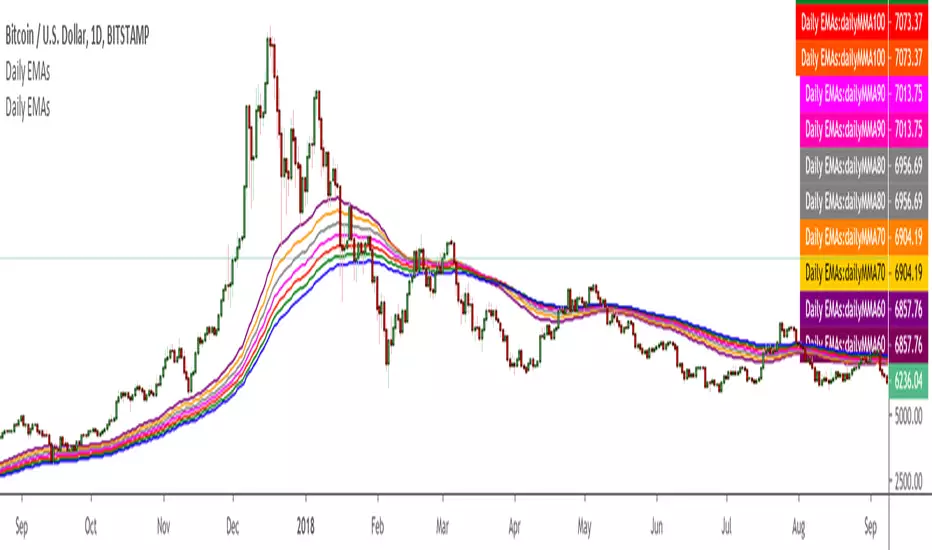
Multiple EMA Daily (60->120) - BTC bull market supportThis script shows areas of strong support during a BTC bull market.
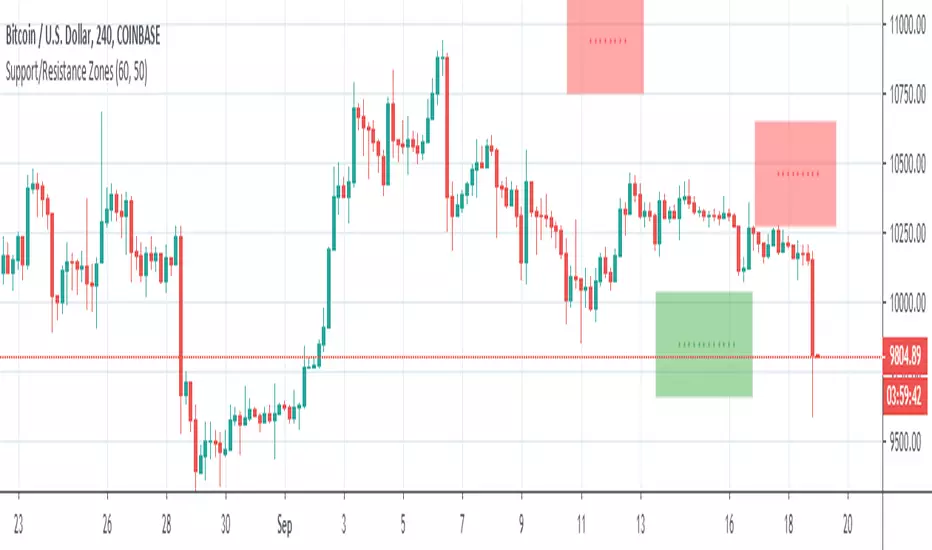
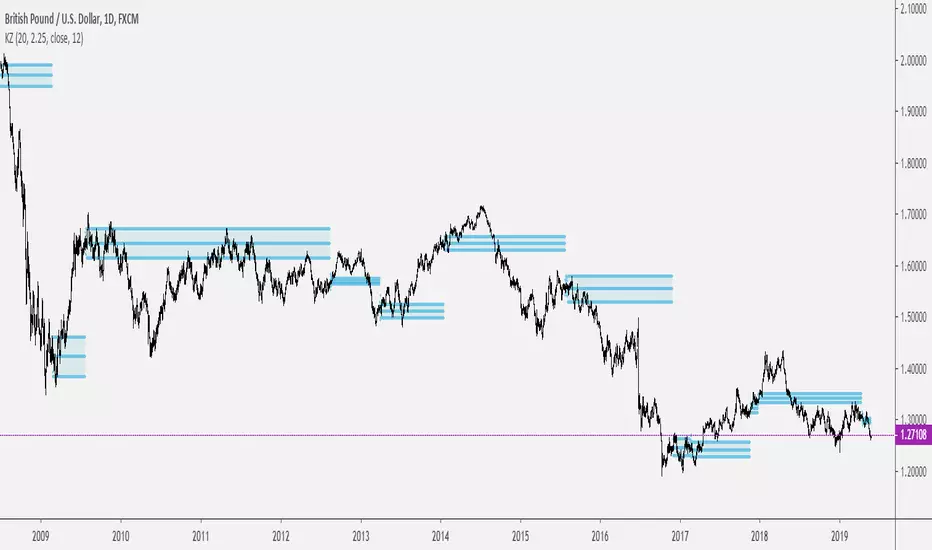
S&R Zone SignalsThis indicator allows you to specify price zones in which to detect basic candlestick patterns.
In the example above, I have specified the most immediate support and resistance zones on GBP/USD and set the script to detect engulfing candles. If a bearish engulfing candle occurs within the resistance zone a signal will be generated; likewise for bullish engulfing candles within the support zone .
The purpose of this indicator is to generate trading alerts when these patterns occur in order to reduce the screen-time required to monitor setups. This indicator is intended for structure traders primarily, although it could be used by anyone who uses zones and candlestick patterns to enter trades.
If you leave either zone set to 0 then that zone will not be used, meaning that you can use this to detect both support and resistance signals, or only signals at support, or only signals at resistance.
Settings:
R1: First Resistance Price
R2: Second Resistance Price
S1: First Support Price
S2: Second Support Price
Draw Signals: Enable/Disable Visual Signals
How Far To Look Back: Used For Detecting Fractal Highs/Lows
Doji Size (in pips): This Changes the Size of Detected Doji Candles
Hammer Wick Size: This Changes the Size of Detected Hammers/Shooting Stars
Engulf Wick: If Enabled, Only Engulfing Candles That Engulf the Wick Will Be Valid
Show Engulfing Candles: Enable/Disable Visual Signals For Engulfing Candles
Show Doji Candles: Enable/Disable Visual Signals For Doji Candles
Show Hammer Candles: Enable/Disable Visual Signals For Hammer/Shooting Star Candles
Source Code:
Go to zenandtheartoftrading.com for the source code – it’s free!


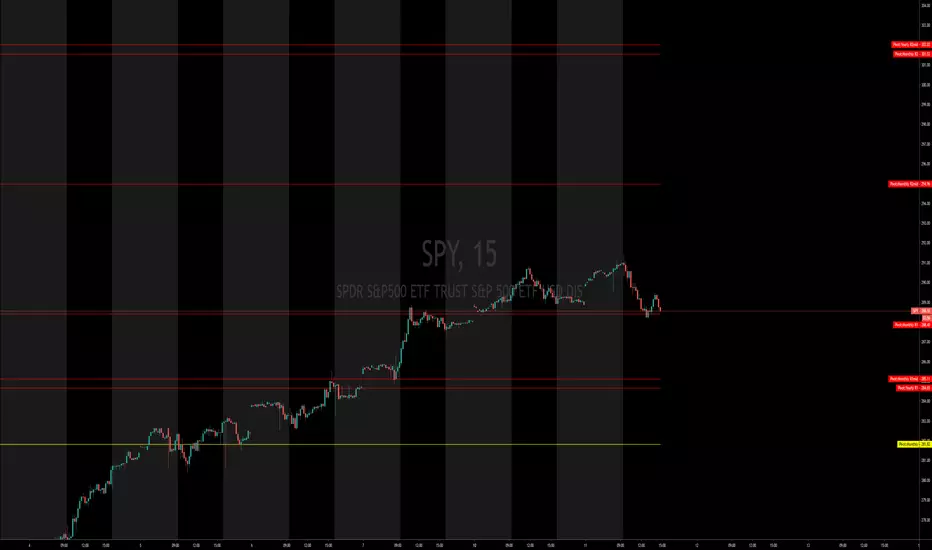
Pivot Points Monthly & YearlyMonthly and Yearly only
What is a Pivot Point?
A pivot point is a technical analysis indicator, or calculations, used to determine the overall trend of the market over different time frames. The pivot point itself is simply the average of the high, low and closing prices from the previous trading day. On the subsequent day, trading above the pivot point is thought to indicate ongoing bullish sentiment, while trading below the pivot point indicates bearish sentiment.
The pivot point is the basis for the indicator, but it also includes other support and resistance levels that are projected based on the pivot point calculation. All these levels help traders see where the price could experience support or resistance. Similarly, if the price moves through these levels it lets the trader know the price is trending in that direction.
When the price of an asset is trading above the pivot point, it indicates the day is bullish or positive.
When the price of an asset is trading below the pivot point, it indicates the day is bearish or negative.
The indicator typically includes four additional levels: S1, S2, R1, and R2. These stand for support one and two, and resistance one and two.
Support and resistance one and two may cause reversals, but they may also be used to confirm the trend. For example, if the price is falling and moves below S1, it helps confirm the downtrend and indicate a possible continuation to S2.
This Script includes the Mid Pivot Points, Open and Close levels

SFL Daily ATR levelsAn indicator that plots the daily ATR upper and lower levels on a chart.
This is a TradingView re-write from Trader Dante's dATR indicator.

CL Kijun Support Resistance LinesExperimental support / resistance lines inspired by the ichimoku indicator.

Kijun Support/Resistance LinesThis is a trend line inspired by the Ichimoku indicator. Feel free to change the time frame depending on what you're looking at.
Feel free to use it as resistance / support levels or even figure something out yourself.

Year Open Price LevelAn utility tool that plots a dynamic level using the opening price of each year on the chart.
Allows to highlight the change in the price relative to this level.


Keltner ZonesThis is an indicator that draws support and resistance zones / levels based on price action in and around Keltner Channels.
There are 3 different modes;
Draw zones based on price breaking the upper band
Draw zones based on price breaking the lower band
Draw zones if price stays within the bands for a prolonged period of time.
You can also decide if you want the indicator to paint zones or levels. The Zones can grow rather large if there is a volatility shock since they are drawn using the true range around the trigger price.
Upper Band Zones
Lower Band Zones
Congestion Zone
AVERAGE MULTI_SMAIndicator returns an average of 5 SMAs. an interesting point that I have noticed that the price has several times reacted on it.
Note 1: Do not just use this as a criterion for buying and selling, use as one more aid.
Note 2: It is possible to leave in the chart all the averages, if you feel it necessary.
------------------------------------//--------------------------------------------------
Indicador retorna uma média de 5 SMAs. um ponto interessante que tenho notado que o preço tem diversas vezes reagido nele.
Observação 1: Não use apenas isso como critério para compra e venda, use como mais um auxilio.
Observação 2: É possivel deixar no grafico todas as médias, caso você ache necessário.

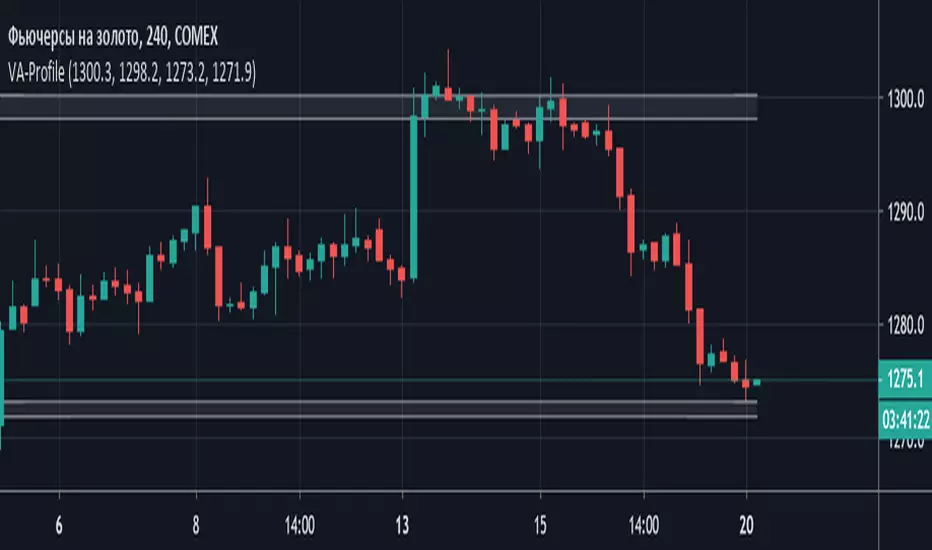
Volume Area Profile (Индикатор горизонтальных объемов)Volume Area Profile (Индикатор горизонтальных объемов)
Данные введены для графика GC!- Futures Gold - Дата: 20 мая 2019
Индикатор интегрирует данные полученные Вами после анализа кластерного графика объемов цены и строит зоны профиля объемных уровней поддержки и сопротивления
Необходимо отредактировать входные параметры:
Resistance_max - верхняя граница зоны сопротивления
Resistance_min - нижняя граница зоны сопротивления
Support_max - верхняя граница зоны поддержки
Support_min - нижняя граница зоны поддержки
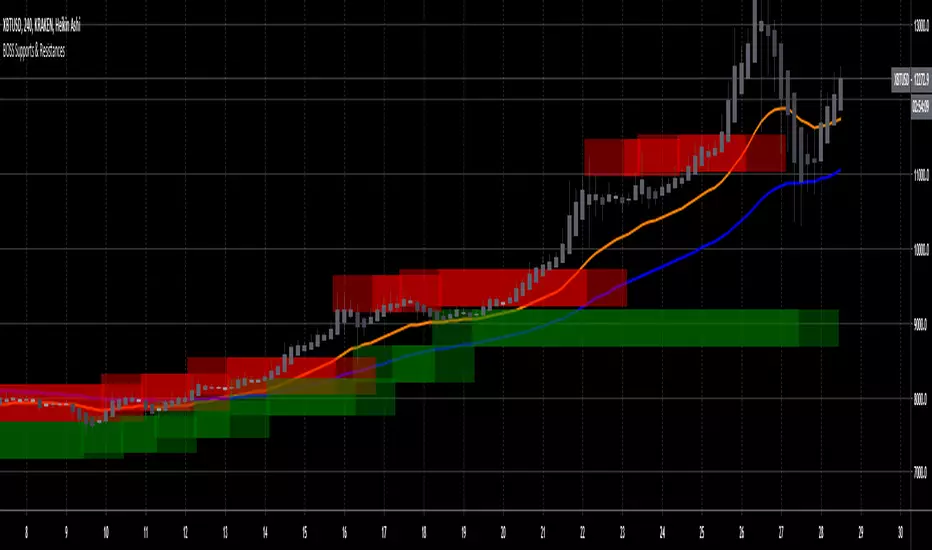
Boss Support and Resistance zonesTHE BEST FOREX, BINARY OPTIONS, AND CRYPTO INDICATORS FOR TRADINGVIEW.COM
Green = Support Zones
Red = Resistance Zones
The basic trading method for using support and resistance is to buy/long near support in uptrends, and to sell/short near resistance in downtrends.
Also included in this indicator are a Higher High, Lower High, Higher Low, and Lower Low indicator as well as Fast and Slow EMA'S
Available at bosscripts.com
Website bosscripts.com
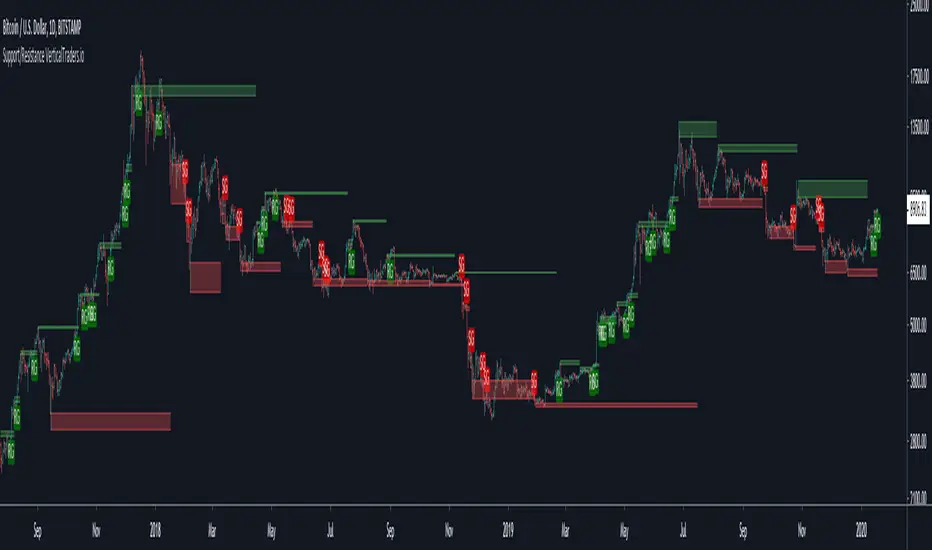
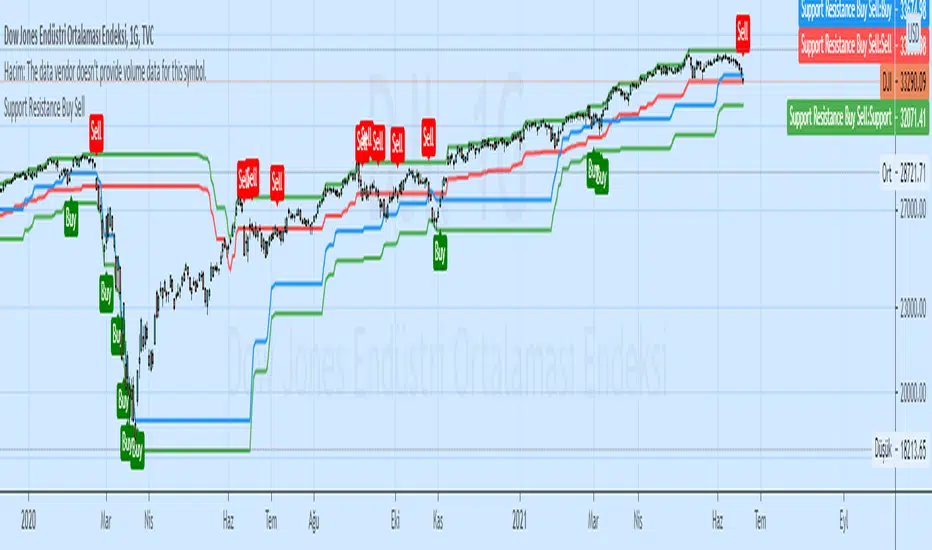
Higher High Lower Low StrategyThis script finds pivot highs and pivot lows then calculates higher highs & lower lows. And also it calculates support/resistance by using HH-HL-LL-LH points.
Generally HH and HL shows up-trend, LL and LH shows down-trend.
If price breaks resistance levels it means the trend is up or if price breaks support level it means the trend is down, so the script changes bar color blue or black. if there is up-trend then bar color is blue, or if down-trend then bar color is black. also as you can see support and resistance levels change dynamically.
If you use smaller numbers for left/right bars then it will be more sensitive.
free to use but the code is hidden and not free of charge, if you want the code please send me message.
comments are welcome.

Support and Resistance LevelsSupport and Resistance Levels
-This indicador show automatically the support and resistance levels.
- Allows you to select the amount and importance of the S/R levels.
-This indicator allows to overlay a custom timefame S/R levels.
-You can activate notification alerts for any of the conditions.
-Works in any timeframe or market like Forex, Crypto, Commodities even Stocks.
-Recommended manual trading.
Do you need an Script or an expert adviser for Forex, contact our coding service!
Get this indicator today! contact us.
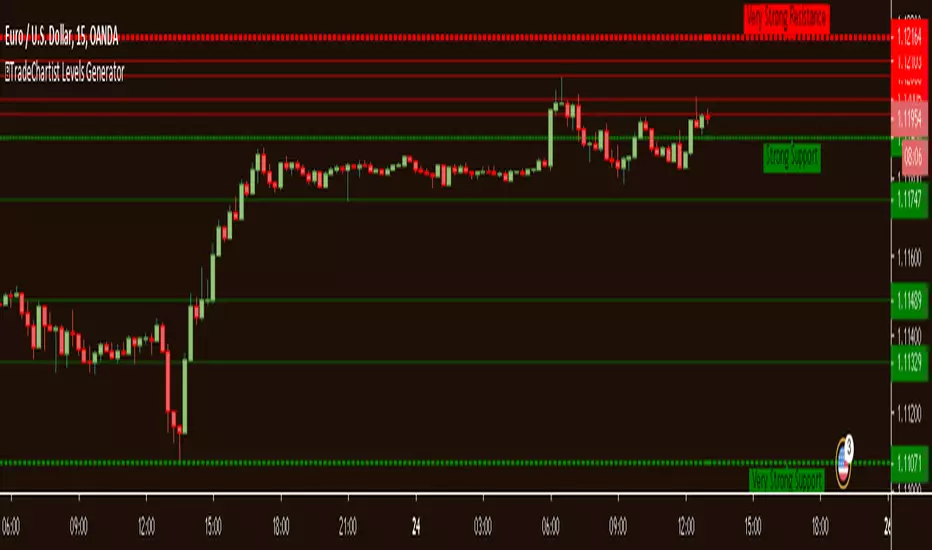
Levels Generator with Fibs"Levels Generator with Fibs" is an easy to use and a well coded script that can be used by traders of all levels from beginners to advanced professionals.
What does the script do?
Plots the support and resistance levels automatically based on user preference of Local or Global levels from indicator settings.
Plots Fibonacci retracement levels between high and low based on 'Days' or 'Candles' lookback from indicator settings.
What markets can this script be used on?
Forex
Stocks
Commodities
Cryptocurrencies
and almost any asset on Trading View
Does the script repaint levels?
No. The script does not repaint as it plots levels based on the past price movement. The only time the levels change for a given timeframe is when the price makes a new All Time High or a new All Time Low.
What is the difference between "Plot Levels" and "Plot Fibonacci Levels"?
"Plot Levels" plots support and resistance levels automatically without any input from the user other than preferred levels 'plot' from the indicator settings namely
Plot All Global Levels - Plots all important levels from ATH to ATL (dependent on data age/availability on Trading View) - recommended for Long term outlook
Plot Local Levels for Higher TF - Plots all important Support/Resistance levels for mostly higher time frames (1hr or higher) - Short to Mid term outlook
Plot Local Levels for Lower TF - Plots all important Support/Resistance levels for mostly smaller time frames (can be used for up to 1hr in most cases) - Recommended for Scalping/Swing Trading mostly dependent on volatility
"Plot Fibonacci Levels" plots all standard Fibonacci retracement levels - 0, 23.6%, 38.2%, 50%, 61.8%, 78.6% and 100% based on
"Days" Lookback - Fibonacci levels between High and Low based on number of days in the past, starting from the current day on any time frame chart
"Candles" Lookback - Fibonacci levels between High and Low based on number of candles in the past, starting from the current candle on any time frame chart
Can the Fibonacci levels be reversed?
Yes. The Fibonacci levels can be reversed by checking the "Reverse" checkbox from the indicator settings. This is very handy if the trend looks like there may be a support or resistance from one of the Fib levels and a possibility of a new high or a new low based on the price action.
What is the need for "Plot 1.272 Fibonacci Level" under "Plot Fibonacci Levels"?
1.272 is an important Fibonacci number as it is the square root of 1.618 and is the near support or resistance after 100% price retracement. Even though it keeps moving on the chart dependent on the new high or new low based on Days/Candles lookback, it serves as a 'nice to have' reference for any trader looking beyond 100% retracement for support/resistance.
Why do the 'local levels' lines' color changes between green and red?
The nearby levels lines change color based on price closing above or below them. This happens to only closest local levels for lower TF near price action and for top/bottom lines of the local levels for higher TF.
The line turns green when it becomes support as price closes above it.
The line turns red when it becomes resistance as price closes below it.
Can the levels lines' colors be changed?
Yes. The color of the Higher TF levels and all Global levels (from "Plot All Global Levels") can be changed from the 'Styles' tab from the indicator settings. Some lines change between green and red (which show on both light and dark themed background), so they are not editable and are hidden, but all other lines can be edited to show /hide or change color from the 'Styles' tab on the indicator settings.
What chart background is recommended?
The colors of the levels are neutral to both light and dark background of the chart screen, but a black or a dark background shows the lines even better. It comes down to user preference. If the default horizontal and vertical lines on chart screen is of no use, it can be hidden from 'Background' tab on Trading View chart settings by increasing the transparency of the lines all the way up.
Get in touch with me if you would like access to the script on monthly, 6 monthly or annual basis.