Algorithmic Volume Rejection Zones [AVRZ]Hello traders,
I am pleased to release the Algorithmic Volume Rejection Zones (AVRZ). This is a specialized decision-support system designed to identify high-probability reversal points by synthesizing candle geometry, market structure, and statistical volume anomalies.
Trading reversals often presents a dilemma: wait for confirmation and miss the move, or enter early and get stopped out by noise. AVRZ solves this by quantifying "Institutional Absorption." It filters out weak price probes and highlights only the specific moments where significant volume has stepped in to defend a price level.
🛡️ The Concept: Attacking The Zonesl
You will often see price aggressively "attack" a support or resistance level with speed and high volume. To the untrained eye, this looks like a breakout. However, professional analysis reveals that this is often an Efficiency Event—liquidity is being absorbed by passive limit orders.
The AVRZ indicator is specifically engineered to detect this phenomenon. When price strikes a level and volume spikes (>2.0 Sigma), it signals that the auction is becoming efficient and a reversal is imminent. The script captures this "Attack" via the Climax Bypass logic, plotting a fresh zone immediately to mark where the liquidity was defended.
Support and Resistance

Auto-Anchored Fibonacci Volume Profile [Custom Array Engine]Description:
1. The Theoretical Foundation: Structure vs. Participation In professional technical analysis, traders often struggle to reconcile two distinct datasets: Price Geometry (where price should go) and Market Participation (where money actually went).
Why Fibonacci? (The Structure) Fibonacci Retracements map the mathematical structure of a trend. They identify psychological and algorithmic "interest zones" (0.382, 0.5, 0.618) where a correction is statistically likely to terminate. However, Fibonacci levels are theoretical—they are "lines in the sand" that do not guarantee liquidity or reaction.
Why Volume Profile? (The Verification) Volume Profile maps the historical exchange of shares at specific price levels. It reveals "fair value" (High Volume Nodes) and "market imbalance" (Low Volume Nodes). It is the only tool that verifies if a specific price level was actually accepted by institutional participants.
2. Underlying Calculations (The Custom Engine) This script operates on a custom-built calculation engine that bypasses standard built-in functions entirely. It uses Pine Script Arrays to build a Volume Profile from scratch. Here is the breakdown of the proprietary code logic:
A. The "Smart-Fill" Distribution Algorithm (Solves Gapping)
The Problem: Standard volume scripts often assign a candle's entire volume to a single price row. In volatile markets or steep trends, this creates visual "gaps" or a "barcode" effect because price moved too fast to register on every row.
My Solution: I wrote a custom loop that calculates the vertical overlap of every candle against the profile grid.
The Math: Volume Per Bin = Total Candle Volume / Bins Touched.
The Result: If a single volatile candle spans 10 price rows (bins), the script mathematically divides that volume and distributes it equally into all 10 array indices. This generates a solid, continuous distribution curve that accurately reflects price action through the entire candle range, not just the close.
B. Dynamic Arrays & Split-Volume Logic The script initializes two separate floating-point arrays (buyVolArray and sellVolArray) sized to the user's resolution (up to 300 rows). It iterates through the specific time-window of the swing:
If Close >= Open, the calculated volume slice is injected into the Buy Array.
If Close < Open, it is injected into the Sell Array.
These arrays are then visually stacked to render the dual-color profile, allowing traders to see the "Delta" (Buyer vs. Seller aggression) at key structural levels.
C. Custom Garbage Collection (Performance) To enable the "Auto-Anchoring" feature without causing chart lag or visual artifacts ("ghosting"), the script includes a Garbage Collection System. Before drawing a new profile, the script iterates through a tracking array of all existing objects (box.delete, line.delete) and clears them from memory. This ensures the indicator remains lightweight and responsive even when dragging chart margins or switching timeframes.
3. The Synthesis: Why Combine Them? The core philosophy of this script is Confluence . A Fibonacci level without volume is merely a suggestion; a Fibonacci level backed by volume is a defensive wall. By algorithmically anchoring a Volume Profile to the exact coordinates of a Fibonacci swing, this tool allows traders to instantly answer critical questions:
"Is the Golden Pocket (0.618) supported by a High Volume Node (HVN), or is it a Low Volume Node (LVN) that price might slice through?"
"Is the Shallow Retracement (0.382) holding because of structural support, or just a lack of selling pressure?"
4. How to Read the Indicator
The Geometry: The script automatically detects the trend and draws standard Fib levels (0, 0.236, 0.382, 0.5, 0.618, 0.786, 1.0).
The Confluence Check: Look for the Point of Control (Red Line). If this High Volume Node aligns with a key Fib level (e.g., the 0.618), the probability of a reversal increases significantly.
The Imbalance Check: Look for "Valleys" in the profile (Low Volume Nodes). These gaps often act as "slippage zones" where price travels quickly between structural levels.
Buy/Sell Splits: The dual-color bars (Teal/Red) reveal the composition of the volume. A 0.618 level held up by dominant Buy Volume is a stronger bullish signal than one with mixed volume.
5. Settings & Customization
Lookback Length: Sensitivity of the swing detection (Default: 200 bars).
Resolution: Granularity of the profile rows (Default: 100). Higher values provide smoother definition.
Width (%): Responsive sizing that scales the profile relative to the trend's duration.
Extend Lines: Option to project structural levels infinitely to the right.
Disclaimer This script is an analytical tool for visualizing historical market data. It does not provide trade signals or financial advice.

PDH(RTH)+PMH / PDL(RTH)+PML First Break + 3m EMA RetestIncludes retest notification for passed or failed on 3min 9EMA.

Pivot point moving averagesPivot Point Moving Averages builds moving averages from confirmed pivots, not from every bar.
Instead of averaging all highs and lows, this script:
Detects swing pivot highs and pivot lows using a configurable Pivot length (pivotLen).
Converts these sparse pivot prices into continuous series of:
last confirmed pivot low
last confirmed pivot high
Applies a user-selectable moving average (SMA / EMA / RMA / WMA / VWMA) to each of those pivot series.
Plots the two resulting lines and shades the area between them as a pivot value cloud.
Because the lines only move when a new pivot is confirmed, they represent structural acceptance rather than raw volatility. Short “noise” moves and stop hunts between pivots have much less impact on these averages.
You can also enable an optional second pivot MA cloud:
Uses the same Pivot length for structural detection.
Has its own MA length and type.
Can run on a different timeframe (e.g. D, 240, W).
Is projected back onto the current chart so you see local pivot value and higher-timeframe pivot value together.
Why it’s useful
Traditional MAs:
React to every bar.
Move on noise, wicks, and stop runs.
Don’t distinguish between “meaningful” structure and random fluctuation.
This tool uses confirmed pivots, so it is better suited to market structure and phase analysis:
Pivot MA low reflects how demand is stepping up (or down) as new swing lows form.
Pivot MA high reflects how supply is pressing down (or easing) as new swing highs form.
The cloud between them acts as a dynamic, structure-based value area.
Typical interpretations:
Price inside the pivot cloud → balance / fair value area.
Price above the pivot cloud → bullish value expansion.
Price below the pivot cloud → bearish value expansion.
Cloud compressing → possible energy build-up, transition between phases.
Cloud expanding → stronger directional conviction.
With the second cloud enabled on a higher timeframe, you can:
See whether lower-timeframe structure is building with or against the higher-timeframe pivot value.
Use the HTF cloud as a background bias and the LTF cloud for timing and fine-grained context.
Notes
All pivot-based tools have inherent delay: a pivot is only confirmed after pivotLen bars to the right.
On very low timeframes, long pivotLen + long MA lengths will make the lines slower to react.
This is intended as a context and structure tool, not a standalone entry signal.

Daily/Weekly Swing Highs-Lows + Candle PatternsDescription
Daily/Weekly Swing Highs-Lows + Candle Patterns
This indicator plots the most recent Daily and Weekly Swing Highs and Lows (key support/resistance levels) using a simple and effective logic: a swing high/low is confirmed when the previous bar's extreme is higher/lower than both the current and the one before it.
Features:
• Daily Swing Highs/Lows (teal/maroon circles) – toggleable
• Weekly Swing Highs/Lows (blue/purple circles) – optional
• Visual separators for new daily and weekly bars (light background color)
• Daily candle pattern labels (optional):
- US = Up Swing (strong bullish continuation)
- DS = Down Swing (strong bearish continuation)
- IN = Inside Bar
- OUT = Outside Bar
• Daily close position labels (optional):
- P = Positive (close in upper 25% of the range)
- mP = minor Positive (50–75%)
- mN = minor Negative (25–50%)
- N = Negative (lower 25%)
All elements are fully customizable (colors, visibility) and work on any timeframe.
Best suited for intraday timeframes (1 min to 4 hours) where daily and weekly key levels provide important context for price action and reversals.
The optional "Trading session length" input is mainly useful for markets with shorter sessions (e.g., European indices) and does not affect swing detection.
Open-source, free to use and modify.
How to Use the Indicator + Practical Use Case
Key Settings (Inputs)
Trading session length (hours) → Default 8.5 h (useful for FTSEMIB, DAX, etc.). Leave it as is unless you trade a market with a different session length.
Daily Swing Levels → Show/Hide daily swing highs (teal) and lows (maroon).
Weekly Swing Levels → Usually keep off on intraday charts to avoid clutter (turn on for higher-timeframe context).
Daily Candle Patterns → Enable only if you want to see US/DS/IN/OUT labels on the daily close.
Close Position (P/mP/mN/N) → Enable if you want to quickly see how strong/weak the daily close was.
What You See on the Chart
Teal circles = Last confirmed daily swing high (resistance).
Maroon circles = Last confirmed daily swing low (support).
Blue/purple circles (if enabled) = Weekly swing high/low.
Light gray background = Start of a new trading day.
Purple background (if weekly enabled) = Start of a new week.
Small labels on daily close (if enabled):
- US = strong bullish day
- DS = strong bearish day
- IN = inside bar (consolidation)
- OUT = outside bar (expansion)
- P/mP/mN/N = how far the close was from the high/low of the day.
Best Timeframes 1 min to 240 min charts → Daily levels act as major support/resistance zones for intraday trading.
Avoid using on daily or higher charts (the logic is designed for intraday context).
Why this works well intraday:
The daily swing high/low levels are high-probability zones where institutions and algorithms often defend positions. On intraday charts, they act as “magnets” for price, giving you clean entries and exits with clear invalidation levels.
This indicator keeps your chart clean while providing exactly the context most intraday traders need: key daily levels + daily momentum context.

Support and ResistanceSupport & Resistance Zones
This indicator automatically identifies support and resistance zones by clustering confirmed pivot highs and lows into statistically valid price areas.
Instead of drawing single horizontal lines, it creates price zones whose width is dynamically controlled using ATR (Average True Range), allowing the zones to adapt to market volatility.
Core Logic
The indicator scans a user-defined number of historical bars and detects pivot highs and pivot lows using a configurable pivot strength.
Each new pivot is evaluated against previously detected zones:
A zone becomes visible only after receiving sufficient confirmation (minimum number of pivot touches).
This ensures that only structurally meaningful levels are drawn.
Zone Construction Rules
Zones are formed by grouping pivot points whose total price range remains within ATR range
Each zone expands dynamically as new pivots confirm it
Zones are drawn as rectangular areas, not lines
Zones extend to the right, remaining active until price structure changes
This approach avoids over-plotting and reduces noise commonly seen in traditional support/resistance tools.
Dynamic Zone Coloring
Zones automatically change color based on current price position:
Support Color → Price is above the zone
Resistance Color → Price is below the zone
Neutral (In-Zone) Color → Price is trading inside the zone
This makes it easy to visually assess market context without additional indicators.
Inputs Explained
Logic Settings
Bars to Apply
Number of historical bars scanned to detect pivots and construct zones.
Pivot Strength
Number of candles required on both sides of a pivot high/low for confirmation.
Min Pivot Confirmation
Minimum number of aligned pivots required before a zone is drawn.
Styling
Support, resistance, and in-zone colors
Zone fill transparency
Why This Approach
Uses price structure, not arbitrary levels
Adapts to market volatility via ATR
Filters out weak, single-touch levels
Works across all markets and timeframes
This indicator is designed to highlight areas of interest, not generate buy or sell signals.
It is best used in combination with trend, momentum, or volume-based tools.

Global J-1 & W-1 Levels (Fixed Lines / Lignes Fixes)Description
This indicator automatically plots key price levels from the previous day (D-1) and the previous week (W-1). It is designed for Day Traders and Scalpers who need clear visual references without cluttering their chart with past history.
Unlike standard indicators that use plot() and create "step-like" lines, this script uses graphic objects (line.new) to display fixed, infinite horizontal lines, just as if you had drawn them manually.
Key Features:
D-1 Levels (Blue): Previous Day High (DR-1) and Low (DS-1).
W-1 Levels (Red): Previous Week High (WR-1) and Low (WS-1).
Clean Chart: Lines are displayed only for the current session. No historical clutter.
Readability: Dashed lines with level names and exact prices displayed on the right.
How to use it? These levels often act as institutional support and resistance. Watch for price reactions (bounces or breakouts) near these zones to confirm your trade entries.

Liquidity ZonesLiquidity Zones
Liquidity Zones is a price-action–based indicator designed to identify high-probability support and resistance areas where liquidity has historically accumulated.
Instead of drawing single lines, the script builds dynamic price zones based on repeated pivot reactions validated by volume, helping traders focus on meaningful levels rather than noise.
How It Works
Pivot Detection
The indicator scans historical price data for pivot highs and pivot lows using a fixed pivot strength.
Each pivot represents a potential liquidity interaction point.
Volume Qualification
A pivot is only considered valid if the volume at the pivot bar exceeds:
Volume SMA × Sensitivity
This filters out weak or low-participation levels and keeps zones formed during strong market interest.
Zone Construction
Nearby pivots are grouped into a single zone if their price difference stays within an ATR-based threshold.
Each time price reacts within this threshold, the zone’s touch count increases.
Once the minimum number of touches is reached, a liquidity zone is drawn and extended to the right.
Adaptive Zone Expansion
As new qualifying pivots appear, zones automatically expand to reflect the true liquidity range instead of staying static.
Dynamic Zone Coloring
Zones update their color in real time based on price position:
Green (Support) → Price is above the zone
Red (Resistance) → Price is below the zone
Gray (In-Zone) → Price is trading inside the zone
This allows instant visual feedback on whether a level is acting as support, resistance, or an active liquidity area.
Settings Overview
Bars to Apply
Controls how much historical data is scanned for liquidity zones.
Volume Sensitivity
Higher values require stronger volume spikes to validate pivots, resulting in fewer but higher-quality zones.
Styling Options
Fully customizable colors and transparency for support, resistance, and in-zone states.
Best Use Cases
Identifying high-liquidity support and resistance zones
Planning entries, exits, and stop placement
Combining with trend-following or momentum indicators
Filtering out weak levels in sideways or choppy markets

[ARTIO] TTG Levels Pro: The Grail (S.C.T.) TTG Pro: The Grail (v8.5) Professional Key Levels Solution for Synthetic Crypto Trading
Overview TTG Pro is a high-precision, multi-timeframe analysis tool developed by . Designed specifically for the fast-paced environment of synthetic crypto trading and scalping, this indicator automatically identifies and projects critical reversal points (Key Levels) from higher timeframes onto your current chart.
Key Features
Multi-Timeframe Architecture: Simultaneously displays key levels from Monthly (1M), Weekly (1W), Daily (1D), 4H, 1H, and 30m timeframes.
Dynamic Trend Status: The core engine evaluates the relationship between the current price and key levels in real-time.
Price > Level: Status LONG (Green visualization).
Price < Level: Status SHORT (Red visualization).
Synergy (Cluster) Alerts: A unique detection system that triggers an alert when multiple key levels from different timeframes converge within a tight percentage range, indicating a strong zone of interest.
Smart Visuals:
Stable Anchor: Lines are strictly bound to the time axis, eliminating "floating" issues during chart scrolling.
Adaptive UI: The information table automatically adjusts its width based on price digits, keeping the chart clean.
Magnet Labels: Price labels are offset for better visibility and do not obscure candle action.
v8.5 Update (Pine Script v6) This version has been completely rewritten on the Pine Script v6 engine, ensuring maximum performance, stability, and optimized array processing for complex calculations.
Settings & Customization
Fully Customizable UI: Toggle specific timeframes, adjust alert sensitivity (%), and resize the dashboard table.
Professional Mode: To enable a minimalist look, go to Chart Settings -> Status Line and uncheck "Arguments" to hide input values next to the indicator title.
Developed by Trading involves risk. This tool is for educational and analytical purposes.

SMC Structure & Expectation [WavesUnchained]SMC Structure & Expectation - Professional Context & Confirmation Tool
A sophisticated Smart Money Concepts indicator that combines objective market structure analysis with intelligent expectation logic and professional order block validation. Built for traders who value context over signal spam.
4-LAYER ARCHITECTURE
Layer 1: Market Structure
✓ Objective HH/HL/LH/LL detection based on confirmed pivot swings
✓ Internal structure tracking (micro swings within major legs)
✓ Structure alignment detection (Internal + External agreement)
✓ No predictions - pure price action description
Layer 2: Expectation/Bias
✓ Logical hypotheses derived from current structure
✓ "Expect HL" in bullish structure / "Expect LH" in bearish structure
✓ "Expect Continuation" after BOS events
✓ Expectation ≠ Signal (can be wrong, that's the point)
Layer 3: Confirmation (BOS + Order Blocks)
✓ Break of Structure (BOS) detection with 2 modes:
• Conservative: Close-cross (default)
• Aggressive: High/Low-cross with optional close confirmation
✓ Professional Order Block System with 8 intelligent filters
✓ Only creates OBs when expectation is met
✓ Maximum 1 OB per direction (quality over quantity)
Layer 4: Optional Warnings
✓ Trendline break detection
✓ Early Top/Bottom warnings (volume + volatility divergence)
✓ Can be disabled for clean chart focus
PROFESSIONAL ORDER BLOCK SYSTEM
8 Quality Filters (Cascade Logic):
1. BOS-Only Guard : No OB without confirmed Break of Structure
2. Displacement Filter : Minimum 1.0 ATR momentum (customizable)
3. Location Filter : Must be in Premium (bearish) or Discount (bullish) zone
4. Size Filter : 3 modes available:
• Hard Limit: Reject oversized OBs (strict)
• Score Penalty: Allow but reduce priority (balanced, default)
• Disabled: No size filtering (permissive)
5. Volume Filter : Optional relative volume threshold
6. FVG Filter : Optional Fair Value Gap requirement
7. Mitigation Tracking : 30% penetration = mitigated (score penalty)
8. TTL (Time-To-Live) : Auto-delete after 80 bars (prevents chart clutter)
Priority Scoring System (0-100):
• HIGH Priority (>80) : Bright colors, zero transparency
• MED Priority (50-80) : Normal colors, 30% transparency
• LOW Priority (<50) : Faded colors, 60% transparency
Score Components:
✓ Displacement strength (10-30 points)
✓ FVG confluence (+20 points)
✓ Relative volume (+5-15 points)
✓ Premium/Discount location (+10-20 points)
✓ Structure alignment (+30 points if aligned, -15 if conflict)
✓ Leg strength (+15-25 points for strong impulse vs correction ratio)
✓ Size penalty (-0 to -30 points if oversized, Score Penalty mode only)
BAR COLORING MODES
Choose your preferred visual feedback:
1. Off : No bar coloring
2. Structure : Bullish/Bearish/Neutral structure states
3. Expectation : Continuation zones (green = expect bullish, red = expect bearish)
4. BOS + OB Priority (Default):
• Highlights active Order Blocks by priority
• BOS events in bright neon
• Faded structure colors when no OB active
5. Multi-Layer : Combines structure + priority intensity
6. Alignment : Shows Internal/External structure alignment (orange = conflict warning)
INTELLIGENT LOGGING SYSTEM
Priority-based log filtering to reduce noise:
• All : Every event (debug mode)
• MED+ : Only medium and high priority events
• HIGH Only : Only high priority setups
• Smart (Default): Adaptive filtering based on priority + context
Logs include:
✓ Structure changes (HH/HL/LH/LL)
✓ Expectation updates
✓ BOS events with confirmation status
✓ OB creation with full scoring breakdown
✓ OB reactions (Tap/Deep/Failure classification)
✓ Rejection reasons with "Potential Lost" analysis
CONFIGURATION HIGHLIGHTS
Layer 1: Structure
• Pivot detection length: 5 (left) / 5 (right)
• Internal structure: Optional micro-swing tracking
• Swing confirmation: Closes beyond pivot required
Layer 2: Expectation
• Expectation expiry: 40 bars (auto-reset after timeout)
• Visual feedback: Labels + optional expectation zones
Layer 3: Confirmation
• BOS Mode: Close-cross (conservative) / High/Low-cross (aggressive)
• Close Confirmation: Optional 3-bar window for aggro mode
• Displacement: Min 1.0 ATR (customizable)
• Size Filter Mode: Hard Limit / Score Penalty / Disabled
• OB Location: 38% discount / 62% premium thresholds
• OB Size Range: 0.3-1.2 ATR (customizable)
• TTL: 80 bars default
• Volume Filter: Optional, 1.0x minimum
• FVG Requirement: Optional
Layer 4: Warnings
• Trendline break detection
• Early Top/Bottom signals
• Can be fully disabled
BEST USE CASES
✓ Context Tool : Understand where you are in the market cycle
✓ Confirmation Filter : Validate trade ideas with structure alignment
✓ Order Block Trading : High-probability zones with priority scoring
✓ Educational : Learn SMC concepts with transparent logic
✓ Multi-Timeframe Analysis : Combine with HTF structure for confluence
Optimized for:
• Commodities (NatGas, Gold, Oil)
• 1H - 4H timeframes
• Swing trading / Intraday positioning
KEY FEATURES SUMMARY
✓ Zero signal spam - only high-conviction setups
✓ Transparent scoring system - know why each OB matters
✓ Adaptive to market conditions - structure alignment detection
✓ Flexible filtering - customize to your risk tolerance
✓ Priority-based visuals - instantly identify best opportunities
✓ Professional logging - learn from rejections and acceptances
✓ Clean chart - auto-cleanup with TTL system
✓ Bar coloring modes - choose your visual feedback style
✓ Size Filter Mode - prevent blocking of high-quality oversized setups
PHILOSOPHY
This indicator follows the principle: "Context over signals, quality over quantity"
Expectations can be wrong - that's the point. They help you stay aware of the most likely scenario while remaining open to structure changes. When expectation is met AND confirmed by BOS + quality OB, you get a high-conviction setup.
Not a holy grail. Not a signal service. A professional analysis tool.
Version: 1.0.0
Author: WavesUnchained
Pine Script: v6

Custom Session ORB - Extending Past Current CandleCustom Session ORB - Extending Past Current Candle
This indicator plots Opening Range Breakout (ORB) levels for one or two customizable trading sessions directly on your chart. It dynamically tracks the high, low, and midpoint of the defined session(s) and extends these levels beyond the session using a configurable offset.
Features:
Supports two custom sessions.
New York and Asia pre-saved.
Automatically tracks session High, Low, and Mid.
Option to extend ORB levels past the live candle.
Option to display only the most recent ORB for a clean chart.
Configurable line thickness, style, and label size.
Works in Eastern Standard Time (EST) without manual adjustment.
Settings:
Show Labels: Toggle to display ORB values on chart.
Label Font Size: Small, Normal, Large.
Mid Line Style: Solid, Dashed, or Dotted.
ORB Line Thickness: Set line thickness of ORB levels.
Extend Past Current Candle by N Bars: Controls how far the ORB extends visually.
Show Only Current ORB: Cleans chart by removing previous session ORB levels.
Enable Session 1 / 2: Toggle individual sessions on/off.
Session Time: Set the start and end times for each session (automatically in EST).
How It Works:
The indicator monitors the defined session time, records the high, low, and midpoint, and draws lines at those levels. When the session ends, the lines are extended by the specified offset for easy breakout visualization. Labels can optionally show the exact price levels.

Signal Algo - Elephant Edge Strategy🔶 Strategy Overview:
This strategy is designed for intraday trading and focuses on taking trades near important price reference areas instead of random market locations.
This strategy is designed to:
Take trades only near important price levels
Avoid random mid-market entries
Validate every trade using multiple confirmation filters
It combines the following core concepts:
Elephant Edge zones based on previous session volatility
Index & F&O strike price levels (psychological and liquidity-based levels)
Previous Day OHLC levels (important institutional reference prices)
The goal of this strategy is to allow trades only when price behavior is meaningful and occurs near key market reference areas, while filtering out low-quality signals. All filters are optional, allowing traders to customize the strategy according to their trading style, risk preference, and market conditions.
🔶 How to Use: Elephant Edge Support–Resistance
This strategy is based on the Elephant Edge Support–Resistance concept, where trades are taken only near important price zones instead of random market areas.
The image above shows how the strategy identifies Support Zones, Resistance Zones, and how trade entries and exits are generated.
🟩 Support Zones:
Shown as green areas. These are considered potential Buy zones.
A positive price reaction from these zones is required before a Buy entry is generated.
🟥 Resistance Zones:
Shown as red areas. These are considered potential Sell zones.
Price rejection from these zones is required before a Sell entry is generated.
Important:
The strategy does not blindly buy or sell at the zone. Entries are generated only after additional confirmation, such as: Candle structure validation, Directional filters, Optional, volume and time filters (if enabled)
Trade entries are generated only when price touches a Support or Resistance zone.
These zones represent areas where price is more likely to react, helping to avoid low-quality trades during sideways or random market movement.
Final Understanding:
This strategy is not about predicting the market. It is about reacting to price behavior at important levels and trading only when conditions are meaningful.
🔶 How to Use: Index Strike Price Support–Resistance
This concept is based on *Index & F&O Strike Price levels*, where trades are taken near important *round-number strike prices* (for example: every 50 or 100 points), instead of random price locations.
The image above shows how *strike prices act as natural Support and Resistance levels** in index trading.
🟩 Strike Price Support:
Strike levels below the current price act as potential Support zones. Price reaction from these levels is required before a Buy entry is generated.
🟥 Strike Price Resistance:
Strike levels above the current price act as potential Resistance zones. Price rejection from these levels is required before a Sell entry is generated.
Trade entries are generated only when price touches or reacts near a strike price level.
These levels represent *psychological and liquidity-based areas*, where price is more likely to pause, reverse, or react.
🔶 How to Use: Previous Day OHLC Levels
This concept is based on *Previous Day Open, High, Low, and Close (OHLC)* levels, which are widely used as *important market reference prices* by traders and institutions.
The image above shows how price reacts around Previous Day OHLC levels and how they act as natural *Support and Resistance areas** during intraday trading.
🟩 Previous Day Support Levels:
Previous Day Open, Low, or Close levels below the current price act as potential Support zones.
A positive price reaction from these levels is required before a Buy entry is generated.
🟥 Previous Day Resistance Levels:
Previous Day Open, High, or Close levels above the current price act as potential Resistance zones. Price rejection from these levels is required before a Sell entry is generated.
Trade entries are generated only when price touches or reacts near a Previous Day OHLC level.
These levels represent *high-interest price areas* where price is more likely to pause, reverse, or show strong reactions.
🔵 Strategy Setting Features Overview :
Trade Direction Controls : -
Buy Only When enabled: The strategy will generate only Buy trades All Sell signals are ignored Sell Only When enabled: The strategy will generate only Sell trades All Buy signals are ignored
Important Note If both Buy Only and Sell Only are enabled: The strategy can generate both Buy and Sell trades
Candle Direction & Color Filter : -
Available Options:
Both - Candle color is ignored Trades depend only on strategy logic
Trend - Buy → Green candles only. Sell → Red candles only
O-Trend - Buy → Red candles only. Sell → Green candles only
Continuous Buy / Sell Check : -
When enabled: Prevents repeated trades in the same direction Reduces over-trading during sideways markets Example: After a Buy trade, another Buy trade will not be taken immediately unless conditions reset.
Elephant Edge Percentile Levels : -
When enabled: Buy trades are allowed only near lower percentile levels Sell trades are allowed only near upper percentile levels
Why this matters: Percentile levels act as dynamic intraday support and resistance based on historical price movement.
Strike Price Level Filters : -
When enabled: Buy trades require price to touch lower strike zones Sell trades require price to touch upper strike zones
Why strike levels are important: Strike prices often act as psychological and liquidity zones, especially in index trading.
Previous Day OHLC Levels : -
When enabled: Draws Previous Day Open, High, Low, and Close on the chart Trades are allowed only when price touches any of these levels
Why Previous Day levels matter: These levels are widely watched by traders and institutions Price often reacts strongly near them Helps filter out low-probability trades
Stoploss Settings : -
Candle Touch: Stoploss triggers immediately when price touches the level
Candle Close: Stoploss triggers only after candle closes beyond the level
Stoploss Type Choose how stoploss distance is calculated:
Candle High / Low
Fixed Points
Percentage based
Trailing Stoploss : -
Trailing stoploss helps protect profits as price moves favorably. Trailing Mode
Points
Percentage
Trailing Activation Defines how much profit is required before trailing starts.
Candle Structure Filters : -
Candle Size : Filter Avoids trades on: Very small candles (low momentum) Extremely large candles (high risk)
Candle Body : Filter Ensures trades are taken only on candles with sufficient body strength.
Wick Filter : Filters out candles with unusually long wicks, which often indicate fake breakouts.
Hammer Candle Detection : -
Enable Hammer Pattern Detects hammer-type candles using wick-to-body ratios.
Useful for: Reversal-based setups near key levels
Entry & Stop Buffers : -
Buffers add small offsets to: Entry price Stoploss price
Purpose: Helps avoid false triggers caused by small price spikes or noise.
Volume-Based Validation : -
Use Volume Alert Validity Trades are allowed only after a high-volume candle appears.
Why volume matters: High volume confirms participation and interest.
Time & Trade Limits : -
Entry / Exit Time Restricts trades to specific market hours. Trade Count Limits Controls the maximum number of trades per session to avoid over-trading.
Quantity Calculation: -
Investment Amount Automatically calculates trade quantity based on capital amount.
Benefit: Helps maintain consistent risk across different instruments.
JSON Alert Output: -
Used for: Automation Broker integration This does not affect strategy logic.
⚠️ Disclaimer This strategy is provided for educational and research purposes only. Past performance does not guarantee future results. Users should test and manage risk independently.

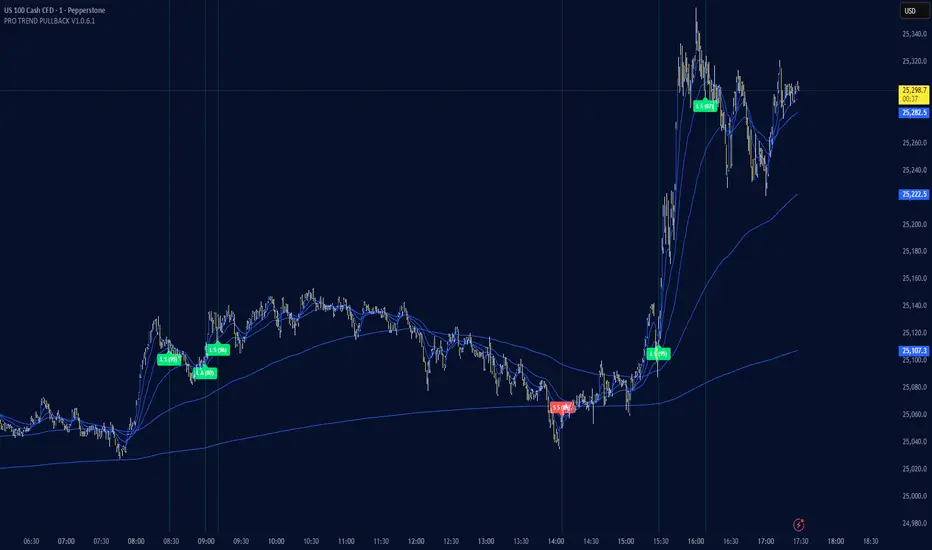
PRO TREND PULLBACK
PRO TREND PULLBACK – trend-following pullback strategy (NAS100 / US30 focus, 1m)
What is this?
- EMA-based trend + pullback entry logic, with optional VWAP and EMA-order filters.
- Built-in preset system for NAS100/US30 on the 1-minute timeframe (Safe / Balanced / Turbo), plus a fully manual “Custom” mode.
Core logic (quick overview)
1) Trend filter:
- Above EMA TREND: long bias, below: short bias
- Optional: VWAP filter, EMA order filter, HTF EMA TREND filter, Multi-EMA direction filter
2) Pullback trigger:
- Pullback level selectable: FAST / MID / SLOW EMA
- Long: touch + bullish confirmation, Short: touch + bearish confirmation (toggleable)
3) Quality filters:
- RSI zone filter (separate for long/short)
- Candle filters: doji / oversized candle / wick (pin-zone) / low-volatility block
- ADX trend-strength filter (via ta.dmi), entry cooldown (bar-based)
- Sideways/range handling: Filter / Penalty / Edge-only mode (ADX + slope + “chop” cross counter)
Risk management / trade management (backtest & automation)
- ATR-based SL/TP: SL, TP1, TP2 (TP1 partial close optional)
- Break-even trigger based on ATR (optional)
- “Max bars in trade” time-based exit (optional)
- Volatility-regime scaling: dynamic SL/TP scaling in high-volatility regimes (optional)
Signal grading (Grade / Score)
- Radar-style scoring + grade: S / A / B / C
- Structural penalties (e.g., lower low / higher high, EMA50 touch, proximity to swing high)
- Trend “fatigue” penalty (down-weights repeated same-direction signals)
- Optional “Lux SMC-lite” score layer (BOS/CHoCH + OB + EQH/EQL + Premium/Discount)
- Optional “ABC-lite (Elliott A-B-C)” score layer (pivot-based)
Alerts / Robot JSON (for webhook)
- Built-in JSON alerts via alert() with watchlist-friendly fields:
secret, strategy, signal, signal_type, symbol, timeframe, time (UTC), price, + optional grade/score
- TradingView alert setup: Condition = “Any alert() function call”
(Webhook URL + your own secret is recommended)
Important notes
- This is a STRATEGY (strategy) intended for backtesting and signal logic. Before live use, test thoroughly and account for slippage/spread differences.
- Pivot-based components (SMC-lite / ABC-lite) are naturally confirmation-based (delayed), so “structure/ABC” values do not print instantly.
- Not financial advice. Use at your own risk.
Suggested starting setup
- Presets: Auto + Balanced (NAS100/US30 1m), then fine-tune with Safe/Turbo.
- For robot mode: turn useRobotAlert=ON and change payloadSecret to a unique value.
Auto TrendLine ProAuto TrendLine Pro is a smart, automated trendline tool designed for traders who value quality over quantity.
Most indicators draw too many lines, making the chart messy and confusing. This engine solves that by filtering out the " noise. " It hunts for mathematically precise connections between market pivots. It gives you a clean view of the strongest Support and Resistance levels that the market is actually respecting.
Menu Options Explained
Here is how you can control the indicator using the settings menu:
1. Swing Length
This setting controls the "eyes" of the engine—how it finds the Highs and Lows.
Swing Length determines how far back the engine looks.
Small numbers (1 or 2): It finds more short-term swings.
Big numbers(3 to 10): It ignores small moves and only looks for major market turns.
2. Trendline Strength
This shows how strong the trendline is. 1 is a good score for a valid trendline. If you increase this number you will get stronger trendlines.
3. Touch Threshold
How strict should the engine be?
Low value: Very strict. Price must touch the line perfectly.
High value: More relaxed. Near-misses are counted as touches.
4. Breakout Threshold
This prevents false alarms. If a candle wick pokes through the line just a little bit but closes back inside, this setting tells the engine to ignore it and keep the trendline alive.
5. Source
This controls where a trendline starts.
Wick: The line must start at the very tip of the candle's Wick (High/Low). This usually gives the most precise touches.
Body: The line starts from the candle's Body (Close). This is usually recommended for line charts.
Best Match(Recommended): The engine tries both and picks the one that fits the math better.
6. Display Mode
This controls how many lines you see on the screen.
Oldest Line: Shows only the single best Support and Resistance line.
Recent Lines: Shows the top 2 or 3 best lines.
Only Specific Line: Shows only a specific line(e.g., only the 2nd best line).
7. Lines to Display
This option controls exactly how many trendlines appear on your chart at the same time, such as showing only the single oldest line or the top 3. It helps declutter your view by hiding weaker lines so you can focus only on the most critical support and resistance levels.
Trendline Types:
1. Confirmed Trendlines
These are solid, established lines that have been tested by price enough times to be locked in as reliable barriers. Unlike live lines, they are permanent and will not disappear or move, providing a trustworthy reference for Support and Resistance.
2. Live Trendlines
These are tentative lines that have just started to form but have not been fully confirmed yet. They show you potential setups early, but they are risky because they might disappear if the price invalidates them before they become strong.
3. Broadening Trendlines
Broadening Trendlines open up wider like a Loudspeaker as they move forward, instead of squeezing together like a normal triangle.
4. Freeze on Live
This option stops the trendlines from moving or flickering while the current candle is still forming. The lines will only update once the candle finishes and closes, keeping your chart stable. Trade-off: You are sacrificing Real-time Reaction to get Stability.
Breached Trendlines, Visuals and Alerts are self Explanatory.
Future updates will have lots of other features.
⚠️ DISCLAIMER
This indicator is for educational purposes only and does not constitute financial advice. Trading involves substantial risk of loss. Past performance does not guarantee future results. Use at your own risk.
© Auto TrendLine Pro - All rights reserved. Copying, redistribution, or reverse-engineering is prohibited without written consent.

Vel-SIGThis pine script will give you an idea about the markets are in trending or rangebound. based on this you can take your decision whether you can buy or sell or right option.

AI Brahmastra with SMC by Pooja V22🚀 AI Brahmastra with SMC by Pooja v22
Invite-Only | Rule-Based Market Structure & Momentum Indicator
📌 What this indicator is (clear definition)
AI Brahmastra with SMC v22 is a closed-source, rule-based technical analysis indicator designed to filter low-quality market conditions and highlight high-probability structural and momentum alignment.
It is not a strategy, does not execute trades, and does not provide fixed targets or stop-losses.
The indicator functions strictly as a decision-support tool, where signals appear only after all predefined rules are satisfied on a confirmed candle close.
The primary objective is signal validation and rejection, not signal frequency.
🎯 Intended Use & Markets
Designed for traders who focus on:
Market structure (SMC)
Trend alignment
Momentum & volatility confirmation
Intraday and positional analysis
Optimised for:
Indian equity markets
Index derivatives (NIFTY, BANKNIFTY, FINNIFTY)
NSE stocks
Futures & commodities
🧠 What “AI” means in this indicator (important clarification)
The term “AI” does NOT refer to machine learning, prediction, or data fitting.
In this script, AI refers to a rule-driven decision engine that:
Evaluates multiple independent conditions simultaneously
Uses state-based logic (past signal state affects future eligibility)
Actively rejects signals unless context, momentum, volatility, and structure align
In short:
👉 The script decides whether a signal is allowed or blocked, instead of blindly triggering on single conditions.
🔗 Why multiple indicators are combined (not a mashup)
Each component has a non-overlapping role.
No indicator is used to “confirm itself”.
EMA (Trend Bias)
Defines directional market bias
Blocks counter-trend signals early
VWAP (Fair-Price Filter)
Ensures entries are aligned with institutional mean price
Prevents chasing overextended moves
Supertrend (Trend Continuation Context)
Confirms directional persistence
Helps avoid premature reversals
RSI + RSI-MA (Momentum Quality)
RSI direction alone is not enough
RSI-MA distance filters weak momentum
RSI-MA slope filters flat / sideways conditions
ADX (Market Energy)
Confirms whether the market has sufficient strength
Blocks signals in low-energy or sideways phases
ATR (Volatility Context)
Confirms whether price movement is meaningful
Helps avoid signals during compressed ranges
👉 No single indicator can generate a signal independently.
Signals are allowed only when these components agree together.
🧱 Market Structure Engine (SMC Logic)
BOS — Break of Structure
Detected using swing-based pivot highs and lows
Confirms continuation of the prevailing structure
Evaluated only after candle close
CHoCH — Change of Character
Detects structural shift against the prior trend
Used as early contextual information
CHoCH remains valid for a limited number of bars
⚠️ BOS and CHoCH are contextual structure references, not standalone trade signals.
⚡ Partial Signal System (Context, not entries)
Instead of showing only final Buy/Sell signals, the indicator provides partial signals that reflect setup development:
B1 / S1 → CHoCH + RSI
B2 / S2 → EMA + VWAP + Supertrend + RSI
B3 / S3 → EMA + VWAP + RSI
B4 / S4 → Breakout alignment (RSI intentionally excluded)
Each partial type:
Represents a specific rule-set
Can be enabled or disabled independently
Does not imply trade execution
🛡 Noise & Fake-Breakout Protection (Core Design Goal)
The script is specifically engineered to avoid false breakouts by using:
Candle-close confirmation (non-repainting)
RSI-MA minimum distance & slope filtering
Optional ADX strength filter with recovery (grace) window
Optional RSI divergence blocking
Optional session-time exclusion
Low-volatility, sideways, or unstable market conditions are intentionally filtered out.
⚙ Trading Modes (Different internal logic)
Intraday Mode
Direction resets at the start of each trading day
Prevents repeated same-side entries
Optional momentum-based reset logic
Positional Mode
Direction remains active until an opposite signal appears
No daily reset
Suitable for swing and higher-timeframe analysis
These modes use different internal state handling, not cosmetic toggles.
📍 Traditional Pivot Points (Support & Resistance Context)
Built-in Traditional Pivot Levels include:
Auto / Daily / Weekly / Monthly anchoring
Multi-year support (Quarterly, Yearly, etc.)
Optional price labels
Historical plotting control
Pivot levels are never used to generate signals.
They serve only as contextual support & resistance references.
📋 Trend Dashboard (Visual Aid)
An optional dashboard displays:
Trend state across multiple timeframes
Bullish / Bearish / Neutral classification
The dashboard is informational only and does not generate signals.
🔔 Alerts
Supports:
Confirmed signal alerts
Partial signal alerts
JSON-formatted webhook alerts
All alerts trigger only on confirmed candle close.
🔐 Why Invite-Only & Closed-Source
This script uses:
Stateful signal control
Multi-stage rule validation
Structure persistence logic
Partial-to-confirmed signal flow
Source access is restricted solely to protect these internal mechanisms, not for promotion.
⚠ Disclaimer
This indicator is provided for educational and analytical purposes only.
It does not constitute financial advice and does not guarantee results.
All trading decisions and risk management remain the user’s responsibility.

Math by Thomas SMC Buy and Sell Model📖 DESCRIPTION
This indicator is built on Smart Money Concepts (SMC) and focuses on how institutions actually execute trades.
Instead of predicting direction, it identifies three critical market states:
Acceptance (Sideways / Consolidation)
Liquidity Location (PDH / PDL / Swing High–Low)
Volatility Release (Breakout with intent)
The model waits for price compression (inventory build) near liquidity and triggers trades only when price breaks in the direction of liquidity.
This approach is especially suitable for index option buying, where timing and expansion matter more than prediction.
🧠 CORE LOGIC (SIMPLE EXPLANATION)
1️⃣ Sideways / Acceptance Phase
The indicator detects periods where price accepts value
These zones represent institutional inventory building
Shown as blue boxes on the chart
2️⃣ Liquidity Context
The indicator tracks:
Previous Day High (PDH)
Previous Day Low (PDL)
Swing Highs & Swing Lows
These levels act as liquidity targets for institutional moves.
3️⃣ Buy / Sell Signal
A signal appears only when:
Price breaks out of a sideways box
The breakout is towards liquidity
This avoids:
Random breakouts
Counter-trend trades
Low-probability entries
🟢 BUY SIGNAL RULES
A BUY (CALL) signal is generated when:
A valid sideways box is present
Candle closes above the box high
Liquidity exists above price
PDH or Swing High above
📌 The signal appears after candle close (no repaint).
🔴 SELL SIGNAL RULES
A SELL (PUT) signal is generated when:
A valid sideways box is present
Candle closes below the box low
Liquidity exists below price
PDL or Swing Low below
📌 The signal appears after candle close (no repaint).
⏱️ BEST TIMEFRAME
✅ Recommended timeframe: 5 MINUTE
Why 5-minute works best:
Cleaner acceptance zones
Meaningful liquidity reactions
Less noise than 1-minute
Faster execution than higher timeframes
⚠️ 1-minute charts may produce noisy signals.
⚠️ Higher timeframes may delay option entries.
🕒 BEST MARKET TIME
For index trading (NIFTY / BANKNIFTY):
✅ 9:30 AM – 2:45 PM
❌ Avoid late entries after 3:10 PM
🎯 WHO SHOULD USE THIS INDICATOR
✔️ Index option buyers
✔️ Traders using SMC / price action
✔️ Traders who want logic-based entries
✔️ Those avoiding prediction-based trading
❌ WHAT THIS INDICATOR IS NOT
❌ Not a scalping indicator
❌ Not a trend-following MA system
❌ Not for blind signal trading
This is a context-based execution tool.
🎓 EDUCATIONAL NOTE
This indicator does not predict the market.
It helps identify when institutions are likely executing after inventory build-up.
Always combine with:
Proper risk management
Market context
Discipline
⚠️ DISCLAIMER
This indicator is for educational purposes only.
Trading involves risk.
The author is not responsible for financial losses.
📖 விளக்கம் (DESCRIPTION)
இந்த இன்டிகேட்டர் Smart Money Concepts (SMC) அடிப்படையில் உருவாக்கப்பட்டது.
மார்க்கெட் எந்த திசைக்கு போகும் என்று ஊகிப்பதில்லை;
இன்ஸ்டிடியூஷன்கள் எப்போது உண்மையாக செயல்படுகின்றன என்பதை கண்டறிவதே இதன் நோக்கம்.
இந்த மாடல் மார்க்கெட்டின் மூன்று முக்கிய நிலைகளை கவனிக்கிறது:
1️⃣ Acceptance / Sideways (கன்சாலிடேஷன்)
2️⃣ Liquidity Location (PDH / PDL / Swing High–Low)
3️⃣ Volatility Release (Breakout with intent)
Sideways நிலையில் இன்ஸ்டிடியூஷன்கள் inventory build செய்கிறார்கள்.
அந்த acceptance முடிந்து, liquidity நோக்கி பிரேக் ஏற்பட்டால் மட்டுமே
Buy / Sell signal கொடுக்கப்படுகிறது.
👉 இது Index Option Buying-க்கு மிகவும் பொருத்தமானது.
🧠 மைய லாஜிக் (எளிய விளக்கம்)
1️⃣ Sideways / Acceptance Phase
விலை ஒரு ரேஞ்சில் சுழலும் போது இந்த பகுதி கண்டறியப்படுகிறது
இது inventory build ஆகும் பகுதி
சார்ட்டில் நீல நிற Box ஆக காட்டப்படும்
2️⃣ Liquidity Context
இந்த இன்டிகேட்டர் கீழ்கண்ட liquidity லெவல்களை கவனிக்கிறது:
Previous Day High (PDH)
Previous Day Low (PDL)
Swing High / Swing Low
இந்த லெவல்கள் தான் இன்ஸ்டிடியூஷன்களின் இலக்கு (destination).
3️⃣ Buy / Sell Signal
Signal வரும் போது:
Sideways box இருக்க வேண்டும்
Box-ஐ உடைத்து CLOSE ஆக வேண்டும்
அந்த பிரேக் liquidity இருக்கும் திசையில் இருக்க வேண்டும்
இதனால்:
தவறான பிரேக்குகள் தவிர்க்கப்படும்
Counter-trend trades குறையும்
🟢 BUY SIGNAL (CALL)
BUY signal வரும் நிலை:
Sideways box உருவாகி இருக்க வேண்டும்
Candle, box high-க்கு மேலே close ஆக வேண்டும்
Liquidity மேலே இருக்க வேண்டும்
PDH மேலே
அல்லது Swing High மேலே
📌 Candle close ஆன பிறகே signal வரும்
👉 No repaint
🔴 SELL SIGNAL (PUT)
SELL signal வரும் நிலை:
Sideways box உருவாகி இருக்க வேண்டும்
Candle, box low-க்கு கீழே close ஆக வேண்டும்
Liquidity கீழே இருக்க வேண்டும்
PDL கீழே
அல்லது Swing Low கீழே
📌 Candle close ஆன பிறகே signal வரும்
👉 No repaint
⏱️ சிறந்த Timeframe
✅ 5-Minute Timeframe – BEST
ஏன் 5-minute சிறந்தது?
Sideways zones தெளிவாக உருவாகும்
Liquidity reaction நல்லதாக இருக்கும்
1-minute போல noise இல்லை
Option buying-க்கு சரியான timing
⚠️ 1-minute – அதிக noise
⚠️ Higher timeframe – entry தாமதம்
🕒 சிறந்த Trading Time
Index (NIFTY / BANKNIFTY):
✅ காலை 9:30 – மதியம் 2:45
❌ 3:10க்கு பிறகு புதிய entry தவிர்க்கவும்
🎯 யாருக்கு இந்த இன்டிகேட்டர்?
✔️ Index Option Buyers
✔️ SMC / Price Action Traders
✔️ Prediction-ஐ விட logic விரும்புபவர்கள்
✔️ Clean entries தேடும் traders
❌ இது என்ன அல்ல?
❌ Scalping indicator அல்ல
❌ Moving Average system அல்ல
❌ Blind signal trading-க்கு அல்ல
👉 இது context-based execution tool.
🎓 கல்வி குறிப்பு
இந்த இன்டிகேட்டர் மார்க்கெட்டை predict செய்யாது.
Inventory build ஆன பிறகு, இன்ஸ்டிடியூஷன்கள் execute செய்யும் இடங்களை
காட்டுவதே இதன் நோக்கம்.
எப்போதும்:
Risk management
Discipline
Market context
கண்டிப்பாக பயன்படுத்த வேண்டும்.
⚠️ மறுப்பு அறிவிப்பு (Disclaimer)
இந்த இன்டிகேட்டர் கல்வி நோக்கத்திற்காக மட்டுமே.
Trading-ல் risk உள்ளது.
ஏதேனும் இழப்புகளுக்கு உருவாக்குநர் பொறுப்பல்ல.

MTF CPR Boxes & Multiple Pivots - Nadeem Al-QahwiMTF CPR Boxes & Multiple Pivots is designed to make those structural zones easier to see by turning classic pivot math into clean, multi-timeframe visual regions directly on your chart.
⸻
The Concept: Central Pivot Range (CPR) Math
This tool is based on the well-known Central Pivot Range (CPR) methodology.
For each selected timeframe, the CPR is calculated from the previous period’s OHLC data:
• Central Pivot:
Pivot = (High + Low + Close) / 3
• Bottom Central:
BC = (High + Low) / 2
• Top Central:
TC = (Pivot - BC) + Pivot (equivalently TC = 2 * Pivot - BC)
This indicator computes these CPR levels for Daily, Weekly, and Monthly timeframes and overlays them on the current chart. The idea is to reveal how price is interacting with higher-timeframe value areas and potential support/resistance clusters in real time.
⸻
Visual Innovation:
• Instead of drawing only thin lines for TC, Pivot, and BC, the area between TC and BC is rendered as a box (zone).
• The central pivot is still drawn as a line inside the box for reference, but the main emphasis is on the entire value range, not a single price.
• This box-based representation helps traders visually identify:
• Liquidity clusters inside the CPR range
• Overlapping CPR zones across multiple timeframes (powerful confluence)
• Compression areas where price is likely to build up orders before expansion
⸻
Key Features
• Multi-Timeframe CPR (MTF Overlay)
• Daily CPR box
• Weekly CPR box
• Monthly CPR box
All three can be enabled simultaneously, allowing you to see where short-term and higher-timeframe value zones overlap.
• Institutional Color Theme
• Separate colors for Daily, Weekly, and Monthly CPR zones
• Designed to be visually distinct yet clean, so confluence is easy to spot without clutter.
• Multiple Pivot Types (Traditional + Camarilla)
• Traditional pivots (PP, S1–S5, R1–R5)
• Camarilla pivots (L1–L6, H1–H6)
These are drawn as classic lines with label/price options and can be used together with CPR boxes for a richer structural map.
• Dynamic Zone Levels (DZL) Engine
• Automatically detects pivot-based support and resistance zones from historical swings.
• Clusters nearby pivots into channels based on a configurable width and strength filter.
• Draws only the strongest zones to keep the chart readable and focused on meaningful levels.
⸻
Settings Guide (How to Customize)
The script includes a set of user-friendly controls so you can adapt the visuals to your style and chart theme:
• General Settings
• Pivot timeframe selection for the main (non-CPR) pivots.
• “Pivots Back” and “CPR Levels Back” to control how many historical periods are displayed (helpful for performance).
• CPR Visual Style (SMC Boxes)
• Box Transparency: Adjusts how opaque the CPR zones are (0 = solid, 100 = invisible fill).
• Border Style & Width: Choose between Solid, Dashed, Dotted, or hide borders completely.
• Text Options: Toggle CPR labels inside each box (e.g., “D-CPR”, “W-CPR”), set text color, size, and placement (center or corner positions).
• Pivots & Labels
• Enable/disable Traditional and Camarilla sets independently.
• Control which levels to display (e.g., show R1–R3 only).
• Choose whether to show level names, prices, or both.
• DZL Settings
• Pivot period for swing detection.
• Channel width (% of price range).
• Maximum number of zones and minimum strength (how many pivots must cluster to form a valid zone).
• Separate style controls for support vs. resistance colors.
⸻
Disclaimer
This indicator is provided for educational and analytical purposes only.
It does not constitute financial advice, investment advice, or a recommendation to buy or sell any security or instrument. Always perform your own analysis and use proper risk management. Trading involves risk, and you are solely responsible for your own decisions.

Mawhoob (OBs & FVGs) - v1.1Mawhoob (OBs & FVGs) - v1.1
Professional Market Structure Indicator
----------------------------------------------------
🎯 Overview
----------------------------------------------------
Mawhoob (OBs & FVGs) - v1.1 is a comprehensive technical analysis indicator designed to identify and track two of the most powerful concepts in modern price action trading: Order Blocks (OBs) and Fair Value Gaps (FVGs). This indicator provides traders with automated detection, visualization, and real-time alerts for these key market structure elements, helping you identify high-probability trading zones and potential reversal areas.
----------------------------------------------------
🔍 What Are Order Blocks and Fair Value Gaps?
----------------------------------------------------
✅ Order Blocks (OBs)
Order Blocks represent areas where institutional players have placed significant orders, creating imbalances in supply and demand. These zones often act as strong support or resistance levels where price tends to react when revisited.
* Bullish Order Block (OB+): Forms when a bearish candle is immediately followed by a strong bullish candle that closes above the previous candle's high, indicating institutional buying interest.
* Bearish Order Block (OB-): Forms when a bullish candle is immediately followed by a strong bearish candle that closes below the previous candle's low, indicating institutional selling pressure.
✅ Fair Value Gaps (FVGs)
Fair Value Gaps are price inefficiencies that occur when the market moves too quickly, leaving unfilled price ranges. These gaps often get "filled" or "mitigated" as price returns to seek liquidity and balance.
* Bullish Fair Value Gap (FVG+): Forms when there's a gap between the high of two candles ago and the low of the current candle in an upward move.
* Bearish Fair Value Gap (FVG-): Forms when there's a gap between the low of two candles ago and the high of the current candle in a downward move.
----------------------------------------------------
✨ Key Features ✨
----------------------------------------------------
✅ Order Blocks (OBs) Module:
Detection & Visualization
Automatic OB Detection: Identifies both bullish and bearish order blocks in real-time.
Customizable Display: Show up to 50 order blocks simultaneously.
Visual Distinction: Separate color schemes for bullish and bearish order blocks.
Smart Labeling: Optional OB+/OB- labels for easy identification.
Advanced Filtering Options
Strong OBs Filter: Option to display only "super/strong" order blocks.
FVG Confirmation Filter: Show only order blocks that are immediately followed by fair value gaps for higher confluence.
Flexible Filtering: Use filters independently or combine them for maximum selectivity
Mitigation Tracking
Real-time Monitoring: Automatically tracks when order blocks are "filled" or mitigated by price.
Display Control: Choose whether to show or hide filled order blocks.
Customization Options
Color Settings: Fully customizable colors for bullish/bearish order block zones.
Transparency Control: Adjustable box background transparency.
Border Styles: Choose between Solid, Dashed, or Dotted borders.
Extension Options: Extend boxes to the right or stop at mitigation point.
Label Size: Select from Auto, Tiny, Small, Normal, or Large label sizes.
✅ Fair Value Gaps (FVGs) Module:
Detection & Visualization
Automatic FVG Detection: Identifies both bullish and bearish fair value gaps.
Customizable Display: Show up to 50 FVGs simultaneously.
Visual Distinction: Separate color schemes for bullish and bearish gaps.
Smart Labeling: Optional FVG+/FVG- labels for clarity.
Advanced Filtering Options
Strong FVGs Filter: Display only significant gaps formed by strong candles.
OB Confirmation Filter: Show only FVGs that follow order blocks for enhanced reliability.
Independent Settings: Completely separate filtering from order block module.
Mitigation Tracking
Gap Fill Detection: Automatically detects when price fills the fair value gap.
Visual Updates: Filled gaps change appearance to indicate completion.
Display Options: Control visibility of filled versus unfilled gaps.
Customization Options
Full Color Control: Independent color settings for bullish/bearish FVGs.
Transparency Management: Adjustable transparency levels.
Border Customization: Multiple border style options.
Extension Control: Choose how gaps extend on the chart.
Label Customization: Adjustable label sizes and colors.
----------------------------------------------------
🔔 Alerts & Signals
----------------------------------------------------
Alerts System
Real-time Notifications: Receive instant alerts when new OBs or FVGs are detected.
Separate Alert Channels: Independent alerts for order blocks and fair value gaps.
Price Information: Each alert includes the current price level.
Frequency Control: Alerts trigger once per bar to avoid spam.
Visual Signals
On-Chart Markers: Optional visual signals (circles/diamonds) at detection points.
Color-Coded: Bullish signals below bars, bearish signals above bars.
Toggle Control: Enable/disable signals independently from alerts.
----------------------------------------------------
📋 How to Use This Indicator?
----------------------------------------------------
For Trend Following
Look for Bullish OBs and FVGs in uptrends as potential entry zones.
Look for Bearish OBs and FVGs in downtrends as potential entry zones.
Use unmitigated zones as key support/resistance levels.
For Reversal Trading
Watch for price reactions when approaching order blocks.
Combine multiple timeframe analysis for higher probability setups.
Use the "Strong" filters to focus on the most significant zones.
For Confluence Trading
Enable "Show Only (OBs) that Followed by (FVGs)" filter.
Enable "Show Only (FVGs) that Follow (OBs)" filter.
Trade only when both structures align for maximum confluence.
Risk Management
Monitor when zones become mitigated (filled).
Use multiple timeframes to identify nested zones.
Combine with your existing trading strategy for confirmation.
----------------------------------------------------
⚙️ Recommended Settings
----------------------------------------------------
For Scalping (1m - 5m timeframes)
Display: 15-20 boxes.
Enable: Strong filters.
Disable: Show mitigated zones.
For Day Trading (15m - 1H timeframes)
Display: 20-30 boxes.
Enable: Confluence filters when needed.
Enable: Show mitigated zones for context.
For Swing Trading (4H - Daily timeframes)
Display: 30-50 boxes.
Enable: All zones for comprehensive analysis.
Enable: Confluence filters when needed.
Enable: Show mitigated zones for context.
----------------------------------------------------
💡 Pro Tips
----------------------------------------------------
Multiple Timeframe Analysis: Use the indicator on multiple timeframes to identify nested order blocks and FVGs for stronger setups.
Confluence Zones: Areas where OBs and FVGs overlap often provide the highest probability trades.
Mitigation Matters: Pay attention to how quickly and cleanly zones are mitigated - clean mitigations often indicate institutional interest.
Filter Combinations: Experiment with different filter combinations to find what works best for your trading style.
Alert Management: Set up alerts for both OBs and FVGs to never miss potential setups.
----------------------------------------------------
⚠️ Important Notes
----------------------------------------------------
This indicator is for educational and informational purposes only.
Always confirm signals with your own analysis before trading.
Use proper risk management and position sizing.
The indicator works on all timeframes and instruments.
Past performance does not guarantee future results.
----------------------------------------------------
🔄 Updates & Support
----------------------------------------------------
Current Version: v1.1
This indicator is actively maintained and updated. Future versions may include additional features and improvements based on user feedback.
----------------------------------------------------
🙏 Acknowledgments
----------------------------------------------------
Created by @mawhoobx - Designed to help traders identify institutional footprints and market inefficiencies for better trading decisions.

Boyen_Clean Historical Key Levels (WO, MO, YO & Mon)Define historical Key Level Weekly Open, Montly Open and Yearly Open
Additional with current Monday low & Monday high level

Boyen_Clean Historical Key Levels (WO, MO, & YO)Define historical Key Level Weekly Open, Montly Open and Yearly Open

BTC Halving VWAP [Cycle Analysis]█ OVERVIEW
This indicator plots Anchored Volume Weighted Average Prices (VWAPs) from each Bitcoin halving date, revealing the "fair value" of each market cycle.
The key insight: When price closes below the current cycle's VWAP on the monthly chart (after 1+ year into the cycle), it historically signals the end of the bull market and continuation toward the previous halving's VWAP.
█ HALVING DATES
• H1: November 28, 2012 (Block 210,000)
• H2: July 9, 2016 (Block 420,000)
• H3: May 11, 2020 (Block 630,000)
• H4: April 19, 2024 (Block 840,000)
█ FEATURES
◽ Anchored VWAPs — VWAP lines calculated from each halving date
◽ Consolidation Bands — Adjustable percentage bands around each VWAP (default ±15%)
◽ Cycle Top Detection — Tracks the highest high before VWAP breakdown
◽ Breakdown Signals — Visual markers when price breaks below cycle VWAP (bearish confirmation)
◽ Interactive Dashboard — Shows cycle progress, VWAP levels, and historical comparison
◽ Alerts — Configurable alerts for VWAP crossovers and breakdowns
█ HOW TO USE
1. Apply to BTCUSD on the Monthly timeframe for best results
2. Watch the H4 VWAP (gold line) — this is the current cycle's fair value
3. When price is ABOVE the VWAP → Bullish bias
4. When price is BELOW the VWAP → Bearish bias, expect move to previous cycle VWAP
5. The ▼ signal marks confirmed cycle tops (VWAP breakdown after 1+ year)
█ DASHBOARD GUIDE
• Price — Current price and gain from halving
• Day — Days since halving and cycle progress %
• VWAP Levels — Current VWAP values with status (ABOVE/BELOW/CONSOL)
• Cycle Tops — Historical days to cycle top for H2 and H3
• Next Halving — Estimated date and countdown
█ SETTINGS
Display:
• Toggle dashboard, consolidation bands, vertical lines, cycle tops, breakdown signals
VWAPs:
• Show/hide individual halving VWAPs (H1-H4)
Settings:
• Dashboard text size
• Consolidation band percentage
• Cycle top label size
█ ALERTS
• VWAP Breakdown — Price breaks below any halving VWAP
• VWAP Reclaim — Price reclaims a halving VWAP
• Consolidation Zone — Price enters consolidation around VWAP
█ NOTES
• Best used on Monthly (1M) timeframe for cycle analysis
• Weekly timeframe also works for more granular view
• H1 VWAP disabled by default (requires data from 2012)
• Cycle top locks when price closes below VWAP after 365+ days into the cycle

Quasimodo (QML) Pattern [Kodexius]Quasimodo (QML) Pattern is a market structure indicator that automatically detects Bullish and Bearish Quasimodo formations using confirmed swing pivots, then visualizes the full structure directly on the chart. The script focuses on the classic liquidity-grab narrative of the QML: a sweep beyond a prior swing (the Head) followed by a decisive market structure break (MSB), leaving behind a clearly defined reaction zone between the Left Shoulder and the Head.
Detection is built on pivot highs and lows, so patterns are evaluated only after swing points are validated. Once a valid 4 pivot sequence is identified, the indicator draws the pattern legs, highlights the internal triangle area to emphasize the grab, marks the MSB leg, and projects a QML zone that can be used as a potential area of interest for retests.
This tool is designed for traders who work with structure, liquidity concepts, and reversal/continuation triggers, and who want a clean, repeatable QML visualization without manually marking swings.
🔹 Features
🔸 Confirmed Pivot Based Structure Mapping
The script uses classic built-in pivot logic to detect swing highs and swing lows.
🔸 Automatic Bullish and Bearish QML Detection
The indicator evaluates the most recent 4 pivots and checks for a valid alternating sequence (High-Low-High-Low or Low-High-Low-High). When the sequence matches QML requirements, the script classifies the setup as bullish or bearish:
Bullish logic (structure reversal up):
- Left Shoulder is a pivot Low
- Head is a lower Low than the Left Shoulder (liquidity sweep)
- MSB pivot exceeds the Reaction pivot
Bearish logic (structure reversal down):
- Left Shoulder is a pivot High
- Head is a higher High than the Left Shoulder (liquidity sweep)
- MSB pivot breaks below the Reaction pivot
🔸 Full Pattern Visualization (Legs + Highlighted Core)
When a pattern triggers, the script draws:
Three main legs: Left Shoulder to Reaction, Reaction to Head, Head to MSB
A shaded triangular highlight over the internal structure to make the liquidity-grab shape easy to spot at a glance
🔸 QML Zone Projection
A QML Zone box is drawn using the price range defined between the Left Shoulder and the Head, then extended to the right to remain visible as price develops. This zone is intended to act as a practical reference area for potential retests and reaction planning after MSB confirmation.
🔸 MSB Emphasis
A dotted MSB line is drawn between the Reaction point and the MSB point to visually emphasize the confirmation leg that completes the pattern logic.
🔸 Clean Point Tagging and Directional Labeling
Key points are labeled directly on the chart:
- “LS” at the Left Shoulder
- “Head” at the sweep pivot
- “MSB” at the break pivot
A directional label (“Bullish QML” or “Bearish QML”) is also printed to quickly identify the detected bias.
🔸 Configurable Visual Style
All main visual components are user configurable:
- Bullish and bearish colors
- Line width
- Label size
🔸 Efficient Update Logic
Pattern checks are only performed when a new pivot is confirmed, avoiding unnecessary repeated calculations on every bar. The most recent pattern’s projected elements (zone and label positioning) are updated as new bars print to keep the latest setup readable.
🔹 Calculations
This section summarizes the core logic used for detection and plotting.
1. Pivot Detection (Swing Highs and Lows)
The script relies on confirmed pivots using the user inputs:
Left Bars: how many bars must exist to the left of the pivot
Right Bars: how many bars must exist to the right to confirm it
float ph = ta.pivothigh(leftLen, rightLen)
float pl = ta.pivotlow(leftLen, rightLen)
When a pivot is confirmed, its true bar index is the pivot bar, not the current bar, so the script stores:
bar_index
2. Pivot Storage and History Window
Each pivot is stored as a structured object containing:
- price
- index
- isHigh (true for pivot high, false for pivot low)
A rolling history is maintained (up to 50 pivots) to keep processing stable and memory usage controlled.
3. Sequence Validation (Alternation Check)
The pattern evaluation always uses the latest 4 pivots:
p0: Left Shoulder candidate
p1: Reaction candidate
p2: Head candidate
p3: MSB candidate
Before checking bullish/bearish rules, the script enforces alternating pivot types:
bool correctSequence =
(p0.isHigh != p1.isHigh) and
(p1.isHigh != p2.isHigh) and
(p2.isHigh != p3.isHigh)
This prevents invalid structures like consecutive highs or consecutive lows from being interpreted as QML.
4. Bullish QML Conditions
A bullish QML is evaluated when the Left Shoulder is a Low:
Head must be lower than Left Shoulder (sweep)
MSB must be higher than Reaction (break)
if not p0.isHigh
if p2.price < p0.price and p3.price > p1.price
// Bullish QML confirmed
Interpretation:
p2 < p0 represents the liquidity grab below the prior swing low
p3 > p1 represents the market structure break above the reaction high
5. Bearish QML Conditions
A bearish QML is evaluated when the Left Shoulder is a High:
Head must be higher than Left Shoulder (sweep)
MSB must be lower than Reaction (break)
if p0.isHigh
if p2.price > p0.price and p3.price < p1.price
// Bearish QML confirmed
Interpretation:
p2 > p0 represents the liquidity grab above the prior swing high
p3 < p1 represents the market structure break below the reaction low
6. Drawing Logic (Structure, Highlight, Zone, Labels)
When confirmed, the script draws:
Three connecting legs (LS to Reaction, Reaction to Head, Head to MSB)
A shaded triangle using a transparent “ghost” line to enable filling
A dotted MSB emphasis line between Reaction and MSB
A QML Zone box spanning the LS to Head price range and projecting to the right
Point labels: LS, Head, MSB
A direction label: “Bullish QML” or “Bearish QML”
7. Latest Pattern Extension
To keep the newest setup readable, the script updates the most recently detected pattern by extending its projected elements as new bars print:
QML zone right edge is pushed forward
The main label x position is pushed forward
This keeps the last identified QML zone visible as price evolves, without having to redraw historical patterns on every bar.
