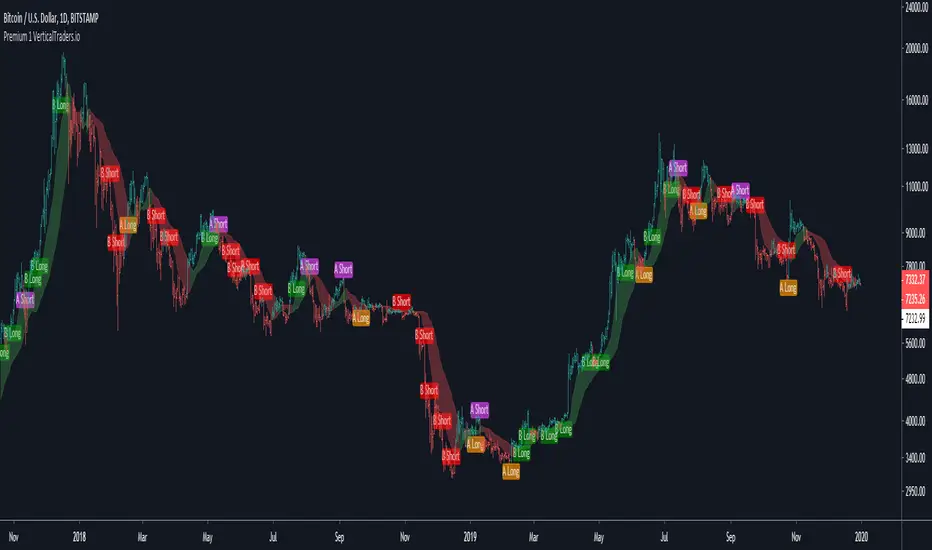
Premium 1-This algorithm takes in consideration Media averages, Volatility Movements and other Mathematical Properties.
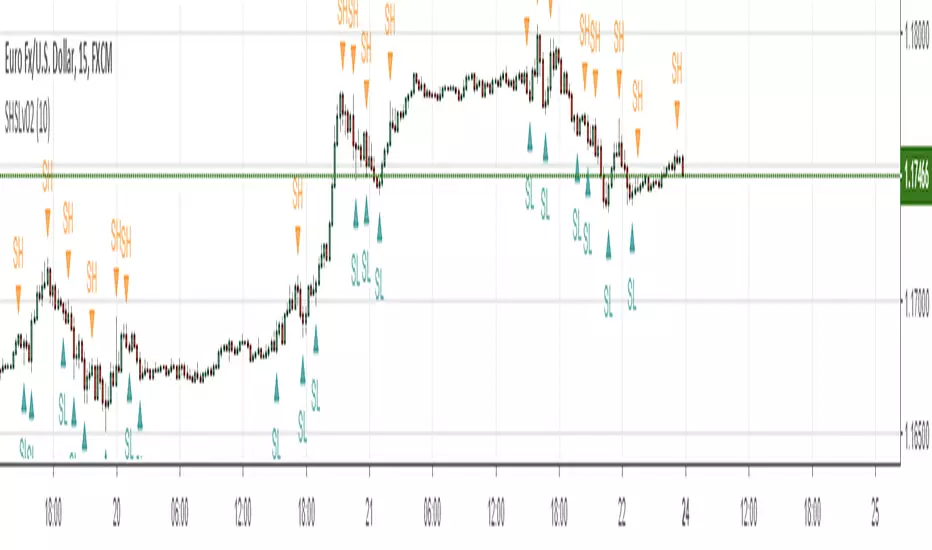
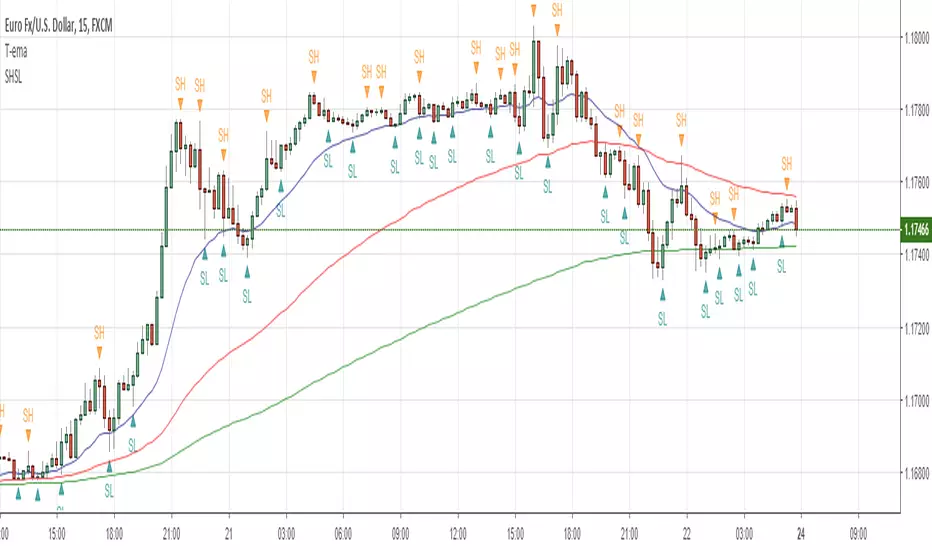
-After adding this signal on TradingView, you will get notified every of potential long and short points triggered by the indicator.
-This signal alerts you anytime bars form a bullish or bearish pattern and price start to move in the suggested direction.
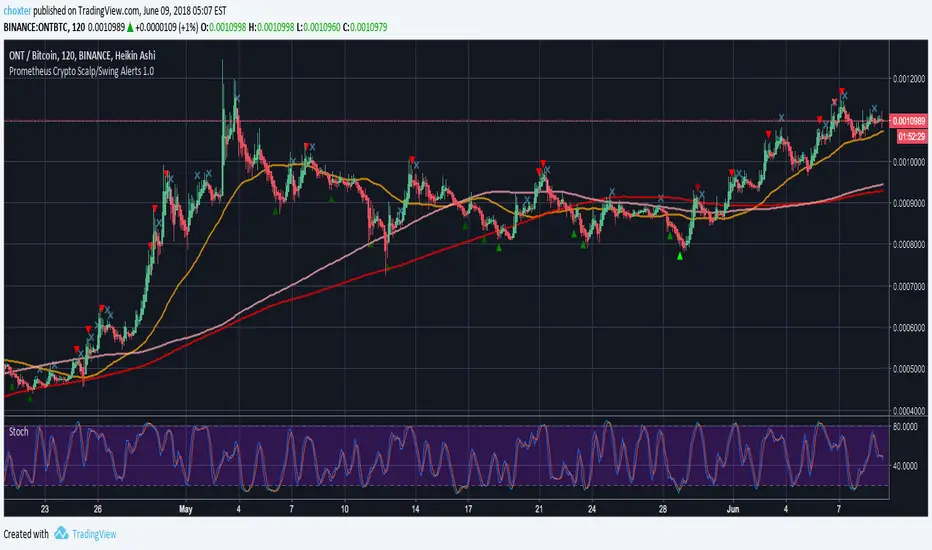
-It works in any time frame or market like Forex, Crypto, Commodities even Stocks.
-Recommended for bots or manual trading.
Do you need an Script or an expert adviser for Forex, contact our coding service:
Get this indicator today! contact us
Pine Script® indicator